Back to Archived Journals » Energy and Emission Control Technologies » Volume 5
Analysis of emission reduction strategies for power boilers in the US pulp and paper industry
Authors Bhander G, Jozewicz W
Received 14 April 2017
Accepted for publication 14 June 2017
Published 4 August 2017 Volume 2017:5 Pages 27—37
DOI https://doi.org/10.2147/EECT.S139648
Checked for plagiarism Yes
Review by Single anonymous peer review
Peer reviewer comments 2
Editor who approved publication: Dr Adolfo Perujo
Gurbakhash Bhander,1 Wojciech Jozewicz2
1Office of Research and Development (ORD), Air Pollution Prevention and Control Division (APPCD), U.S. Environmental Protection Agency, Research Triangle Park, NC, USA, 2Arcadis US, Inc, Environmental Business Line, NC, USA
Abstract: The US pulp and paper (PNP) industry utilizes a variety of fuels to provide energy for process needs, resulting in air emissions of sulfur dioxide (SO2), nitrogen oxides (NOX), particulate matter (PM), and greenhouse gases such as carbon dioxide (CO2). Emissions from this sector have largely declined and continue to decline steadily since the mid-1990s, reflecting changes in fuel types used and their sulfur content, fluctuation in PNP production, increase in the volume of recycling, efficiency gains throughout the sector, and capital investments for compliance with regulations. Because of the above factors, recent market trends favoring the use of natural gas over coal, and more demanding regulatory limits, it is reasonable to expect that air emissions from the sector will continue to decline in the near future. Boilers have been the dominant source of SO2, NOX, PM, and CO2 emissions for the sector. It would, therefore, be of interest to understand how air pollution controls have been applied to date on new, existing, and replaced units, as well as the cost and emission reductions associated with expanding their use throughout the sector. In the work described here, the Universal Industrial Sectors Integrated Solutions (UISIS) model developed by the U.S. Environmental Protection Agency is used to examine the emission reduction potential and cost of controls. This paper briefly characterizes air emissions from boilers operating in the PNP sector and reviews the menu of air pollution control technologies applicable to the sector. Then, after describing the UISIS PNP model, modeling results are presented, in which several illustrative air emission reduction strategies are assessed, including fuel switching, installation of air pollution control equipment, and implementation of energy efficiency measures.
Keywords: power boilers, emission sources, fuel consumption, mitigation options, fuel exchange, emission control technologies, emission reduction
Introduction
The USA is the second leading producer and exporter of paper products after China and the top producer of pulp products.1 Domestic production of paper and paperboard was 83 million metric tons in 2011.3 In 2014, the world’s total paper production was 406 million metric tons, and consumption was 408 million metric tons.1 Paper production is an energy-intensive process, accounting for 11% of the total US industrial energy use in 2010.10 Boilers that generate electricity and steam via combustion of fossil fuels (e.g., coal, natural gas, and fuel oil) and biomass consume most of this energy. Some boilers use “opportunity fuels” such as waste oils, process gases, and wastewater treatment sludge. Different types of boilers are used by the industry on the basis of the fuel used (e.g., coal, natural gas, fuel oil, and wood) and the firing mode (e.g., pulverized coal, grate, etc.), and some boiler types are more amenable to the installation of air pollution controls than others.
The pulp and paper (PNP) industry continues to work to minimize its environmental impacts by increasing the use of recycled paper (66.8% recovered for recycling in 2015), improving energy efficiency, and making capital investments for effective compliance with regulations. As a result, sulfur dioxide (SO2) emissions were 6.4% lower in 2012 than in 2010, and nitrogen oxide (NOX) emissions have been reduced by 26.4% for the same period.17 Since 2000, the total direct and indirect absolute greenhouse gas (GHG) releases at PNP manufacturing facilities have decreased by 42.2% to 46 million metric tons carbon dioxide (CO2)-equivalents. The intensity of GHG emissions, expressed as CO2-equivalents released per ton of the product produced, has decreased by 23.9% to 0.635 metric tons.21
Air pollution control technologies that may be installed on boilers at PNP mills include a variety of combustion and postcombustion controls to reduce NOX; wet, dry, and semidry scrubbers to reduce SO2; and wet and dry particulate collection devices to reduce particulate matter (PM). Two practical approaches for reducing CO2 emissions include fuel switching and increasing process efficiency. It is worth noting that 65.9% of the energy used at American Forest and Paper Association member PNP mills in 2012 was generated from biomass, offsetting CO2 from fossil fuels.17 In 2014, biomass and renewable fuels provided, on average, about 66.8% of PNP mill energy needs, increasing slightly from the energy used in 2012. The PNP sector continually seeks to use energy more efficiently and to achieve its GHG reduction goal.
Because of the variety of boiler types and control technologies and the number of PNP facilities across the country, a mathematical model is useful for understanding the technoeconomic implications of the application of emission reduction strategies across the sector. To facilitate the comprehensive analysis required to understand complex interactions between the economy and the environment, the US Environmental Protection Agency (EPA) has developed the Universal Industrial Sectors and Integrated Solutions (UISIS) model. Emission reduction strategies are incorporated into the model through various constraints depending on the type of emission units, pollutant types, and available control technology. Technology implementation scenarios may be simulated over long- and short-time horizons (e.g., years to decades, respectively). UISIS is also capable of evaluating requirements on a regional or national scale.20
Recent air quality regulations focusing on the sector include the PNP production Maximum Achievable Control Technology (MACT) (MACT I and III) standards, the Kraft pulp mill New Source Performance Standards, and chemical recovery MACT (MACT II) standards.13 Furthermore, the final amendments to the new source performance standards for Kraft pulp mills issued in March 2014 apply to recovery furnaces, smelt dissolving tanks, and lime kilns commencing construction, reconstruction, or modification after May 23, 2013.7 The primary purpose of these regulatory requirements is to attain and maintain air quality by ensuring that the best demonstrated systems for emission reduction are installed when it is most cost-effective. Emission limits for mercury, PM, hydrogen chloride, and CO2 are applicable to new and existing units.6 Because various air pollution control equipment may be needed (e.g., fabric filters, electrostatic precipitators, combustion controls, and carbon injection), a model like UISIS, capable of technoeconomic analysis of multiple technology implementation scenarios, should be particularly useful to facility managers and others responsible for compliance planning.
A UISIS model populated with data specific to the PNP sector (UISIS-PNP) has been used to analyze the technology implementation scenarios presented in this paper. The UISIS-PNP takes into account numerous technical factors, including type of emission sources, fuel type and efficiency, and applicable emission control technologies. Other factors include production capacity, plant location, total cost of production, and control costs.
This paper first presents the background information for the UISIS-PNP by discussing different types of boilers installed throughout the PNP sector, the air emissions from these boilers, and the menu of air pollution control technologies applicable to the boilers. The paper then presents examples of air pollution reduction strategies, followed by an analysis of the benefits of reduction strategies. These examples are given to illustrate modeling capabilities of the UISIS-PNP model and should not be construed as actual emission reduction strategy considerations by the EPA.
Background
Over the past several decades, the PNP sector continually has reduced its environmental impacts by increasing the use of recycled paper, improving energy efficiency, and making capital investments for effective compliance with regulations. However, as noted in a 2009 document prepared by the National Council on Air and Stream Improvement, Inc. (NCASI) on the trade-offs and benefits accompanying NOX and SO2 control, lingering environmental concerns associated with emissions of NOX and SO2 have prompted continued pressure for further emission reductions.15 These pollutants originate as products of combustion that accompany power generation and the processing of pulping chemicals.
Boilers used by the sector
The PNP industry had ~830 boilers in 2012 (in addition to Kraft recovery furnaces) to produce the steam and electricity needed for PNP manufacturing.16 A survey estimated that boilers were the dominant source of emissions in the sector, accounting for about 85% of the SO2, 65% of the NOX, and 45% of the filterable PM emissions in 2010.16 Furthermore, boilers accounted for over 95% of the sector’s GHG emissions. In 2012, these boilers produced 57.7 million metric tons of CO2-equivalent GHG emissions, mostly nonbiogenic CO2.11 In addition, 113 million metric tons of biogenic CO2 emissions from biomass combustion were produced. Therefore, this paper considers only boilers from among other sources of emissions throughout the PNP sector.
Boilers of various designs and using a variety of fuels operate throughout the PNP industry. The fuels most often used include coal, natural gas, residual (heavy) oil, and wood or wood residuals, or a combination of these fuels. The fuel mix for boilers for 1990 and 2010 is shown in Figure 1, in terms of the percentage of total heat input.16 As can be seen in Figure 1, from 1990 to 2010, the heat input from residual oil essentially has been replaced by heat input from wood. Boilers are commonly configured to burn multiple fuels to ensure that heat demands can be met at the most favorable fuel cost.15
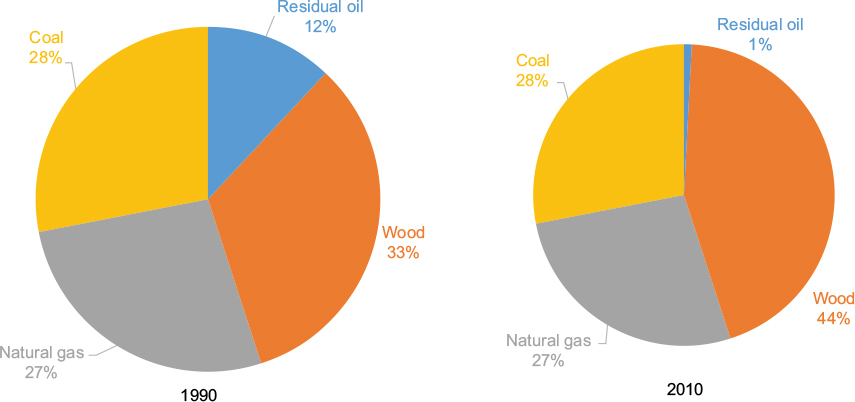 | Figure 1 Fuels used by boilers in pulp and paper sector, by heat input. Note: Data from National Council for Air and Stream Improvement. Pulp and Paper Mill Emissions of SO2, NOX, and Particulate Matter in 2010. Special Report No. 12-03, June 2012.16 |
Air emissions from the sector
In the absence of emission controls, NOX, SO2, and PM emissions from boilers are driven predominantly by the type of fuel burned, as different fuels have varying levels of nitrogen (N) and sulfur (S), precursors to NOX and SO2, respectively. A comparison of the typical N and S content of various fuels is shown in Table 1.15
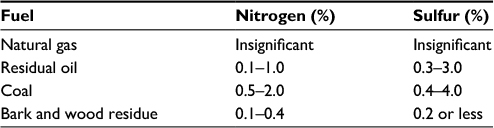 | Table 1 Relative nitrogen and sulfur content of fuels Note: Data from National Council for Air and Stream Improvement. Environmental Footprint Comparison Tool: Trade-Offs and Co-Benefits Accompanying SOX and NOX Control, 2009.15 |
In addition to fuel characteristics, boiler design features, such as boiler type and size, as well as combustion conditions under which the boiler can be operated (boiler load and firing conditions), influence the NOX, SO2, and PM emissions generated.15 The principal sources of NOX emissions from boilers are “thermal NOX” (formed from the thermal conversion of N in the combustion air) and “fuel NOX” (formed from the N in the fuel). The main mechanism of NOX formation in natural gas combustion is the thermal NOX mechanism, whereas NOX emissions from residual oil combustion are formed from both fuel NOX and thermal NOX. In contrast, NOX emissions from coal are considerably higher than those from gas or oil combustion because of the higher N content of coal compared with other fuels, as shown in Table 1. NOX emissions from wood combustion are mainly the result of fuel NOX. Average NOX emissions from wood combustion are lower than those from coal or residual oil combustion and comparable to average NOX emissions from natural gas combustion. Because of different temperature regimes, emissions of NOX are highest for cyclone boilers, followed by pulverized coal-fired boilers and stoker boilers.
Uncontrolled SO2 emissions are driven by fuel S content, which, as shown in Table 1, is highest in coal and negligible in natural gas. The average S content of coal used in PNP boilers was 1.27% for coal used in 2010.16 Small amounts of other S-containing fuels burned in boilers include tire-derived fuel (TDF) and petroleum coke. TDF S content is normally ~1.5%. Petroleum coke S content ranges from 4% to 6%. Over the years, the average S content of fuels used by the industry has declined. For example, from 1980 to 2019, the average S content declined from 1.96% to 1.27% and from 2.04% to 1.42% for coal and residual oil, respectively.16
Uncontrolled filterable PM emissions from PNP boilers depend largely on the fuel type used. Boiler load also affects the PM emissions. Increased PM emissions may result from poor air/fuel mixing or maintenance problems.8 PM emissions from residual oil burning are related to boiler load. At very low load conditions, proper combustion conditions may be difficult to maintain, and PM emissions may increase significantly.8 In coal-fired boilers, PM composition and emission levels are a complex function of boiler firing configuration, boiler operation, pollution control equipment, and coal properties. Uncontrolled PM emissions from coal-fired boilers include the ash from combustion of the fuel and unburned carbon resulting from incomplete combustion. However, in biomass combustion, PM emissions result from inorganic materials contained in the bark and wood itself and from carbonaceous material resulting from incomplete combustion.
GHG emissions from PNP boilers include mostly CO2, with small amounts of methane (CH4) and nitrous oxide (N2O). Regardless of fuel used, nearly all of the fuel carbon is converted to CO2 during the combustion process. The majority of the fuel carbon not converted to CO2 results from incomplete combustion in the fuel stream.11
CO2 from coal combustion varies with the carbon content of coal, which varies between the classes of bituminous and subbituminous coals. Furthermore, carbon content also varies within each class of coal on the basis of the geographical location of the mine.4
The formation of N2O during the combustion process is governed by a complex series of reactions and is dependent on many factors. Formation of N2O is minimized when combustion temperatures are kept high (above 800°C) and excess air is kept to a minimum (<1%). N2O emissions for coal combustion are not significant, except for fluidized-bed boilers.11
In addition to CO2, PNP boilers are also a source of other GHG emissions, such as CH4 and N2O. CH4 emissions vary with the type of fuel and firing configuration but are highest during periods of incomplete combustion or low-temperature combustion. Typically, conditions that favor the formation of CH4 also favor the formation of N2O.11
Emissions of SO2, NOX, and PM from boilers in the US PNP sector have been declining steadily over recent decades. Boiler SO2 emissions have declined from 393,000 metric tons in 1995 to 205,000 metric tons in 2010, because of large reductions in residual oil use, recent decreases in coal use, declines in the average S content of residual oil and coal being burned, and the increasing use of SO2 control systems.16
Over the same period, boiler NOX emissions have declined from 233,000 metric tons to 126,000 metric tons.16 The reduction in NOX emissions can be attributed to reduced fuel consumption and to the declining use of fossil fuels (coal and oil) in favor of wood. NOX emissions from wood combustion in boilers are, on average, lower than NOX emissions from coal. Also, the number of boilers with combustion and postcombustion NOX emission controls has been increasing steadily.
A similar trend of decreasing emissions can be observed for PM. Boiler PM emissions were estimated at 26,000 metric tons in 2005 and 17,000 metric tons in 2010. As in the case of SO2 and NOX emissions, the decrease in coal use and the installation of more efficient control devices probably contributed mostly to the decrease of PM emissions.16
Nonbiogenic CO2-equivalent emissions from fossil fuel consumption were estimated to be 46, 44, and 42 million metric tons in 2010, 2011, and 2012, respectively.12 The decrease is presumed to result from the implementation of energy efficiency measures and increased reliance on biomass fuels that displaced fossil fuels.
Control technologies for boilers
Technologies for the reduction of NOX emissions can be divided into combustion (primary) and postcombustion (secondary) control technologies. In general, primary controls seek to limit the formation of thermal NOX, whereas secondary controls aim to remove the NOX from the flue gas. Conversion of fuel N is more dependent on fuel:air ratio than it is on variations in combustion zone temperatures. Thus, a precise balance of air distribution and combustion temperature control must be maintained to make primary NOX controls effective. The applicability of secondary control technologies and their performance depends on boiler design and configuration, fuels burned, and the dynamic character of boiler loading.
Some of the most widely used primary technologies include low-NOX burners (LNBs), flue gas recirculation, and over-fire air (OFA). Some of the most widely used secondary technologies include selective noncatalytic reduction (SNCR), selective catalytic reduction (SCR), and reburning.19
Wet flue gas desulfurization (FGD) is the most commonly used SO2 control, achieving SO2 reductions of 95% and more. The wet scrubbing process most commonly used to treat boiler flue gas is limestone wet scrubbing (LWS). Lime wet scrubbers, an alternative, are not widely used but are similar in operation to LWS. The lime slurry is more reactive than limestone slurry, enabling the same level of SO2 removal in a smaller scrubber than LWS, but lime is a more expensive reagent than limestone.
Compared with the wet FGD technology, the spray dryer absorber (SDA) offers lower capital cost while ensuring high reliability, low potential for corrosion, lower energy consumption, absence of a wastewater stream, lower water consumption, and simpler process chemistry. Both SDA and wet FGD offer the added benefit of mercury removal. Dry FGD is another option; however, this technology typically does not achieve the SO2 reduction levels associated with its wet counterparts.18
PM emissions from boilers may be controlled with electrostatic precipitators (ESPs), fabric filters (FFs), wet PM scrubbers, or mechanical collectors (such as multicyclones). ESPs are capable of PM collection efficiencies >99%, even for fine PM (<1 µm).5
FFs have been applied widely to coal combustion sources, and the collection efficiencies of FFs can be as high as 99.9% for coal combustion and >99% for fuel oil combustion.11 FFs have limited applications to wood-fired boilers, however, especially to small boilers.2 The principal drawback of the FF is the danger of fire arising from the collection of combustible carbonaceous fly ash.
Postcombustion decarbonization of flue gas presents the issue of processing and disposal of large volumes of flue gas and is energy intensive. Furthermore, carbon capture and sequestration, which have been considered for application at utility power plants, are not likely to be applied to industrial facilities in the near future because of economies of scale and the lack of a policy driver. Thus, for the foreseeable future, two practical approaches to reduce CO2 emissions from fossil fuel combustion at industrial boilers will be 1) switching to a lower-carbon fuel or 2) increasing process energy efficiency, so that less fuel is combusted. These two approaches often also result in reductions of other air pollutants.
Model description
The UISIS-PNP model has been used to analyze technology implementation for the purpose of satisfying various emission reduction scenarios. The UISIS-PNP has been populated with data specific to the US PNP industry. The UISIS-PNP is a multiproduct, multipollutant, multimarket, dynamic, linear mathematical modeling structure that can be applied to evaluate the performance of user-supplied strategies or to identify least-cost, single-and multipollutant control strategies for pulp mills and paper mills independently. The data inputs to the model contain industry-specific data, market-specific data, and optimization parameters. The industry-specific data to the PNP industry characterize the following aspects of individual facilities: unit-level production for each category of products, capacity, production cost (material, operations, and maintenance costs), capital cost, fuel types and cost, information about emissions sources (boilers, recovery furnaces, and lime kilns), mitigation technologies (emission controls), energy efficiency measures, and fuel emission intensities. The data related to mitigation technologies provide information regarding applicable air pollution control technologies, their costs, and their emission control characteristics. Similarly, data related to measures intended to increase energy efficiency provide information regarding applicable energy efficiency measures, their costs, and their characteristics. Because of data and modeling limitation, all states in the USA are divided into four (North, West, East, and South) demand centers (markets) and supply centers (SCs). The import terminals also are assumed to be North, West, East, and South in the USA. Transportation between terminals to SCs and from SCs to demand centers is assumed to be by heavy-duty vehicles.
As shown in Figure 2, boilers, recovery furnaces, and lime kilns are the main sources that provide energy in the form of heat (MMBtu) to the PNP manufacturing processes. Boilers are often capable of being fired with multiple fuels. Recovery furnace (a combustion unit) is used to recover the cooking chemicals from spent cooking solutions and produces heat (~70%). The lime kiln burns lime mud and produces heat. The UISIS-PNP model is constrained to use the free fuels (e.g., black liquor in recovery furnace, biowaste, lime mud, etc.) first and then uses the fossil fuels to satisfy the production requirements for each unit. The model also optimizes the electricity production that can be produced from the extra heat in some units and credited to the revenue. The fossil fuels also can be constrained on the basis of their availability and cost, as well as policy constraints.
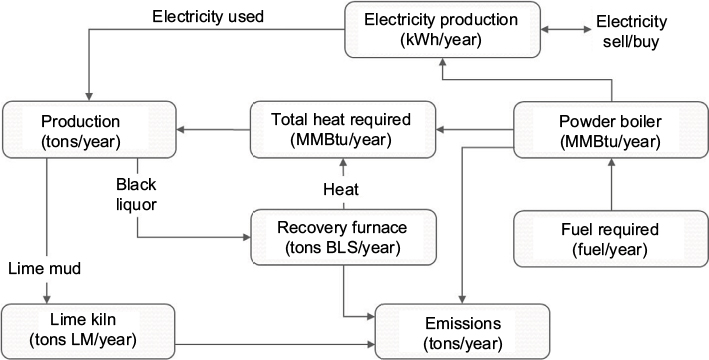 | Figure 2 Systematic modeling diagram of boilers and other emission sources in a pulp and paper mill. Note: Data from Universal Industrial Sectors Integrated Solutions Model (Universal ISIS-PNP) for the Pulp and Paper Manufacturing Industry.14 |
Applications
The UISIS-PNP is a dynamic, linear-modeling foundation that analyzes and evaluates the optimal industry-level and plant-level economic and environmental performance with and without the constraints imposed by the requirements of environmental compliance. The model considers a wide range of plant-level economic and technical factors (inputs), as well as elasticity of demand, interest rates, import quantities and export demand, discount rate, and taxes on emissions. For each emission reduction strategy that is being considered, the model can identify optimal (least-cost) industry operation, cost-effective controls to meet market demand, and emission standards over the time period of interest. In this fashion, the extent of emission reduction and the cost to the industry to achieve the desired level of reduction can be calculated. The UISIS-PNP model treats the pulp mill and the paper mill as two independent mills rather than as one integrated mill. This approach gives the user the ability to evaluate the economic impact of emission constraints that are exclusively applicable to each of the mills. Optimal solutions for the baseline case (without emission constraints or business as usual) and the emission reduction strategy case (with emission constraints) are obtained by using a solver application embedded in the UISIS-PNP Optimization Engine.14 However, since this paper is focused on the analysis of emissions, only emission data are presented here. Emission reduction strategies are incorporated into the model though various constraints depending on the type of strategy.
Generally within an industrial sector, emissions arise from four pathways: 1) onsite emissions from combustion of fossil and biofuels for energy at plants, 2) onsite emissions from processing of certain raw materials, 3) offsite emissions from combustion of fossil fuels at power plants to generate the electricity needed by the industrial sector, and 4) overseas emissions associated with imports. To illustrate the utility of the UISIS-PNP in the PNP industry, we apply the model to three separate cases of onsite emissions. Three cases of emission reduction strategies applications for the reduction of NOX, SO2, GHG, and PM emissions were analyzed using the UISIS-PNP, and the results are presented below. The cases involve exploration of the impacts of fuel switching, application of SCR, and energy efficiency, with each measure applied individually. The model can also be used to evaluate strategies that apply each of these options, selecting the quantity of each on the basis of the objective of minimizing system-wide cost.
Case 1: fuel switching
Methodology
As discussed before, different fuels used by the sector contain varying amounts of N and S, and, thus, their combustion may result in varying amounts of NOX and SO2. Fuel switching from high S and high N content fuels can reduce emissions. After fuel switching, a plant may comply with emission requirements without taking additional action. However, even if the amount of emission reduction is insufficient without adding control equipment, the lower pollutant concentrations could allow that equipment to be down-sized, which would result in lower capital costs and operation and maintenance (O&M) costs. Thus, it is important to understand what amount of emission reduction would result from a hypothetical transition from an S- and N-rich fuel like coal to other fuels.
To demonstrate how the UISIS-PNP can be applied to examine this transition, we add a constraint in the model that reduces the use of coal in the PNP sector by 50% relative to 2010.9 In addition, 2010 PNP boiler inputs of coal, wood, natural gas, and residual oil use were combined with their respective air pollutant emission factors (pounds of pollutant/MMBtu of heat input) to estimate 2010 NOX, SO2, PM, and GHG emissions by fuel type.
No energy efficiency measures were applied across the sector for this scenario. Constraining coal fuel may affect plant-specific commodity production because of fuel availability or utilization capacity (e.g., constraining 50% of the coal supply may affect the commodity production of a coal-based plant because the coal boiler may not be able to produce enough heat to satisfy production and demand). The UISIS-PNP model then compensated for the coal constraint by increasing the use of other fuels on the basis of fuel costs, fuel availability, and fuel emission factors. Once the amount of required substitute fuels was known, the emissions by fuel type were recalculated using their corresponding emission intensities.
Result
As a result of the coal constraint, NOX emissions were reduced significantly from about 128,241 metric tons to 107,350 metric tons because the coal fuel was constrained and the model used natural gas (natural gas is the next low cost than coal) to satisfy production to meet demand.
The impact of these fuel-switching options on lowering emissions was examined, and a comparison is shown in Figure 3, giving the amount of NOX, SO2, PM, and GHG emissions before and after fuel switching options. As can be seen in Figure 3, coal-to-natural gas switch was the most effective option as far as the amount of NOX emission reduction resulting from fuel switch was concerned. Furthermore, the switching from coal to either natural gas or biomass approximately halved SO2 emissions because there are typically negligible amounts of S in these fuels. The substitution with biomass provided an additional benefit of reduced emissions of nonbiogenic CO2.
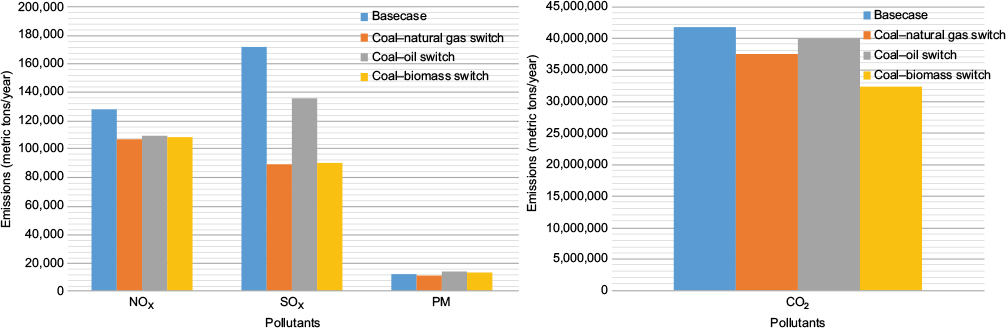 | Figure 3 The effect of 50% coal use reduction on emissions of NOX, SO2, PM, and GHG emissions. Abbreviations: GHG, greenhouse gas; NOX, nitrogen oxides; PM, particulate matter; SO2, sulfur dioxide; SOX, sulfur oxides. |
Case 2: installation of SCR
Methodology
In the next case, the analysis was conducted on a plant level to analyze the plant’s options to reduce NOX emissions. It is important for plant operators to understand the full spectrum of NOX emission reduction options. For example, a plant may be facing NOX emission reduction requirements while being located in the area where substitute fuels, such as biomass or natural gas, may be prohibitively expensive. In such a case, the plant might consider the installation of secondary, or postcombustion, NOX emission control technology, such as, for example, an SCR.
Case 2 illustrates how the UISIS-PNP can be used to analyze the effect of the installation of an SCR on operation of a specific PNP plant. Boilers deployed in the PNP sector typically use LNB and OFA technologies; however, these boilers are also capable of using any postcombustion NOX control technology. In principle, a high-dust SCR (SCR placed upstream of a PM control device) can be installed on any industrial boiler. For this example, a hypothetical plant located in the southern SC with a different annual production capacity for each of its four products (container board, newsprint, specialty industrial paper, and uncoated printing and writing) was selected.12,13 This hypothetical plant in the PNP sector uses 6% coal, 68% natural gas, 11% oil, and 15% wood by heat input to produce the required products. To calculate NOX, SO2, PM, and GHG emissions from each of these fuels, the energy intensity (ton of fuel used per ton of product) and production capacity (ton of product per year) were used to calculate the amount of fuel (ton of fuel used per year) to produce each specific product. The heat input of each fuel was calculated by multiplying the amount of fuel in tons by the corresponding fuel intensity (MMBtu/ton). The emissions (lb/MMBtu) associated with fuels vary depending on their emission intensities. Each fuel will, therefore, have its specific NOX, SO2, PM, and GHG emissions (lb/year). The NOX emissions from all fuel types are added to obtain total NOX emissions.
Results
To reduce NOX emissions from this hypothetical plant in the PNP sector, the installation of SCR was considered to achieve achieve significant amount of NOx emission reduction. The SCR technology is capable of a 75% reduction in NOX emissions from wood and a 90% emission reduction each from coal, natural gas, and residual oil. The total NOX emissions (lb/year) as calculated by the UISIS-PNP after applying these percentages of NOX reductions to each fuel used by the plant resulted in an 85.6% overall NOX emission reduction. However, there were no decreases in SO2, PM, and GHG emissions, as can be seen in Figure 4. In fact, GHG emissions would increase slightly under this scenario if emissions of GHG associated with the production of SCR operational power requirements were considered.
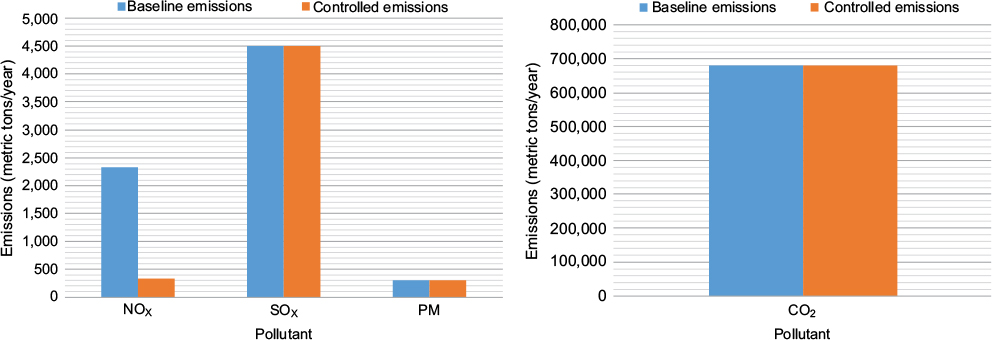 | Figure 4 The effect of SCR technology on reduction in emissions of NOX, SO2, and CO2. Abbreviations: CO2, carbon dioxide; NOX, nitrogen oxides; PM, particulate matter; SCR, selective catalytic reduction; SO2, sulfur dioxide; SOX, sulfur oxides; yr, year. |
Case 3: energy efficiency measures
Methodology
Energy efficiency measures for industrial boilers used in the PNP sector may vary from O&M improvements to repowering. Although the latter require major capital expense investment and take longer to pay off, the former are relatively low cost and with a short pay-off period. O&M improvements include the replacement or retrofit of burners. Case 3 illustrates how the UISIS-PNP could assess the plant level impact of replacing or retrofitting burners on NOX and CO2.
Results
For this case, a hypothetical plant located in the southern SC was selected. The plant uses coal and has conventional LNB installed. Case 3 describes the effect of replacement of conventional LNB with ultra-low NOX burners (ULNBs), which is capable of reducing NOX and CO2 emissions by 75% and 6%, respectively, compared with uncontrolled emissions levels.15,11 In contrast, with conventional LNB installed, emissions of NOX and CO2 were assumed to be reduced by 50% and 2%, respectively. Uncontrolled (baseline) emissions of NOX and CO2 for a plant with LNB are assumed to be 2,340 and 675,369 metric tons/year, respectively. Next, the installation of ULNB was considered in Case 3 as a replacement for conventional LNB already in place in this plant. As a result of an LNB-to-ULNB upgrade, emissions of NOX and CO2 decreased to 1,170 and 647,803 metric tons/year, respectively, for this plant, as shown in Figure 5.
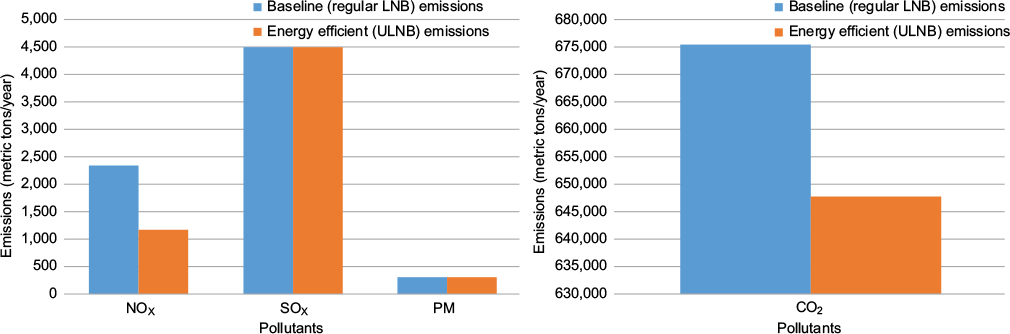 | Figure 5 The emission reduction of NOX and CO2 as an effect of LNB to ULNB upgrade. Abbreviations: CO2, carbon dioxide; LNB, low-NOX burner; NOX, nitrogen oxides; SOX, sulfur oxides; ULNB, ultralow NOX burner. |
Discussion
As illustrated by Case 1, fuel switching from coal offers substantial reductions of SO2, NOX, CO2, and PM emissions for the sector. Switching coal with natural gas or biomass fuels can achieve ~48% SO2 reduction and ~15%NOX reduction. Switching coal with oil fuel can achieve ~20% SO2 and ~14% NOX reduction. Switching coal with biomass and natural gas fuels can achieve ~22% and 10% CO2 reduction, respectively.
Switching coal with the natural gas or biomass is an attractive option for reducing boiler SO2 emissions because these emissions are a function of fuel S content. For example, combustion of natural gas produces far less SO2 emissions than coal does because of the significantly lower S content of natural gas. Natural gas and oil are favorable fuels from the standpoint of NOX emissions compared with coal. As the availability of natural gas in the USA is increasing, more business owners may decide to switch their boilers to natural gas. We demonstrate that the UISIS-PNP is a useful tool to predict the extent of emission reduction resulting from the coal-to-natural gas switch. As with NOX and SO2, fuel switching is an attractive option for reducing boiler PM emissions. For example, PM generally will be reduced when coal is replaced with natural gas. Similarly, fuel switching may reduce GHG emissions significantly because of varying GHG emission intensities of fuels. For example, CO2 intensity of coal and natural gas is ~93 and ~53 kg CO2/MMBtu, respectively. Thus, switching from coal to natural gas would accomplish reductions in SO2, PM, and GHG emissions. Switching from natural gas to solid biomass would significantly reduce GHG emissions but may increase PM emissions. These different fuel switching scenarios can be analyzed by UISIS-PNP, and an optimum fuel switching strategy for minimal emissions can be selected either for an individual boiler or for the sector.
The installation of air pollution control equipment assures reduction of emissions from the plant, as shown in Case 2. Although an 80% emission reduction of a single pollutant from the plant was achieved, emissions of other pollutants were unaffected. However, the UISIS-PNP provides the capability to analyze emission reduction on a sectoral scale. In this way, the user could implement SCR for plants with the highest NOX emissions and wet FGD for plants burning fuels with high S content (e.g., high S coal). For example, using the UISIS-PNP database, a user could discern the type of boiler used at the plant and, in turn, infer flow mixing conditions in the boiler. For boilers with favorable mixing conditions, the user may analyze the application of SNCR in lieu of more expensive SCR. By comparing plants with boilers of different sizes, a user can understand the economy of scale for wet FGD installation. Understanding the economy of scale may result in the installation of SDA rather than wet FGD for plants burning low- to mid-S fuels. Using the UISIS-PNP database, a user can analyze reduction of emissions of other pollutants, such as mercury, because fuel properties and installed air pollution control technologies are known at the plant level.
Similarly, PM control technology applications could be analyzed to accomplish maximum PM emission reduction. For example, a plant with excessive PM emissions despite having ESP installed, could consider the installation of an FF on the basis of the UISIS-PNP database that has determined that high resistivity PM (function of fuel use) was limiting the performance of the ESP. This selective application of efficient air pollution control technologies to plants with the highest emissions of specific pollutant could then be analyzed by the UISIS-PNP to understand how the cost impact of equipment installation could be minimized across the sector.
Some of the most commonly used measures from a menu of GHG emission reduction techniques for existing boilers include good O&M measures, air preheaters and economizers, boiler insulation, minimization of leakage, and steam line maintenance.11 The majority of measures are common, such as burner retrofit discussed above, yet capable of considerable CO2 emission reduction. In the example discussed above, simple replacement/retrofit of burners was capable of ~6% CO2 emission reduction. Other measures may be complex and may require site reconfiguration, such as, for example, combined heat and power or repowering. Impacts of any measure are highly site specific in terms of energy efficiency gain. In turn, CO2 emission reduction corresponds to actual percent efficiency gain realized as the effect of measure implementation. Using the UISIS-PNP database and the menu of GHG emission measures, the user is able to optimize technology solutions that may be applied to specific boilers to reduce overall GHG emissions from the sector. As illustrated by the cases above, simultaneous reductions of GHG and other pollutants may be accomplished by measures such as fuel switching or energy efficiency improvements. Similar analyses can be made for pollutants other than GHG, using a menu of SO2, NOX, and other emission control technologies built into the UISIS-PNP model.
The main objective of these analyses is the determination of the practical range of options available for the selected emission reduction and what the features of the PNP sector will be for the selected range of options. Once the practical range of emission reductions has been determined, the user can analyze the PNP industry revenue and the price of the PNP product categories under the scenario considered.
Conclusion
The UISIS-PNP model was applied to estimate emission changes for three representative applications: 1) fuel switching, 2) installation of air pollution equipment, and 3) implementation of energy efficiency measures. The objective of the analysis was to gain insights relative to broad questions on the range of practical SO2, NOX, GHG, and PM reduction options in the US PNP industry, both industry-wide and at specific plants.
Here, fuel switching, control, and energy efficiency are examined separately to give further insight into the model. A strength of the UISIS-PNP framework is that it is also able to examine these options simultaneously, allocating emission reductions to each approach to minimize cost. The model can also examine the sector-based emission limits and long- and short-time horizons (e.g., CO2 [decades] and criteria pollutants [annual]). The UISIS-PNP is a decision support tool that is designed specifically to support decisions concerning emission reduction scenarios for the PNP sector with the aim of obtaining an in-depth understanding of potential economic and environmental benefits and issues in that sector. The aim is achieved by the detailed analysis of primary calculations of the overall economic and environmental value for the PNP sector while using data for selected commodities, operations, maintenance, production, and energy consumption. Thus, using the model enables the gradual refinement of the economic and environmental impacts of various emission reduction scenarios on the PNP sector.
In general, UISIS is a linear modeling structure that can help analyze optimal sector operations for meeting demand and pollution reduction requirements over specified time periods. With the UISIS model, the total surplus can be thought of as composed of producer surplus and consumer surplus in a market at competitive equilibrium, without exogenous factors. This mechanism may not be 100% valid in a real market because each nonmarginal plant may not be running at its full capacity all the times, which may cause some levels of uncertainty, but it can be negligible at a sector level. The model presents an opportunity for users to understand the optimal behavior of the PNP sector on a regional or national basis, including fuel consumption and environmental burdens. Analysis of emission reduction strategies can be performed and compared using different levels of optimization of the reduction of pollutants. Strategies may be simulated over long- and short-time horizons, such as a pollutant reduction strategy that occurs over a decade or a criteria pollutant strategy based on 1 year.
Emission reduction strategies can be analyzed with the UISIS-PNP model by switching fuel or the installation of emission control technology. For example, switching from coal to either natural gas or biomass approximately halved SO2 emissions because there are typically negligible amounts of S in these fuels. The substitution with biomass provided an additional benefit of reduced emissions of nonbiogenic CO2 and NOX emissions. Installing SCR emission control technology can achieve up to ~75% reduction in NOX emissions from wood and 90% emission reduction each from coal, natural gas, and residual oil.
Acknowledgments
Complicated processes, a multiproduct sector, and a complicated modeling framework, such as the UISIS model, could not have been completed without the support and advice of many individuals and organizations. We gratefully acknowledge the following contributions. Dr. Ravi Srivastava, Mrs. Elineth Torres, Dr. Alex Macpherson, Dr. Kelley Spence, and Mr. John Bradfield of the EPA provided many quality assurance checks on the PNP data and modeling equations. Under EPA Contract EP-D-06–118, Andover Technologies developed the technical information on available controls and energy efficiency measures used in the modeling tool to generate results. RTI International assisted with development of PNP boilers documentation under EPA contract EP-W-11–027. Finally, we thank our colleagues at the EPA/ Air Pollution Prevention and Control Division (APPCD) who provided insight and expertise that greatly assisted the research.
Disclosure
Reference herein to any specific processes or services by trade name, trademark, manufacturer, or otherwise does not necessarily constitute or imply its endorsement, recommendation, or favoring by the EPA. The views and opinions of authors expressed herein do not necessarily state or reflect those of the EPA and shall not be used for advertising or process endorsement purposes. The example analyses of emission reduction strategies given in this paper are shown for illustrative purposes only and do not reflect any opinions or policies of the EPA. The authors report no other conflicts of interest in this work.
References
Skogs Industrierna. Swedish Forest Industries Federation, Stockholm, Sweden, 2016. Available from: http://www.forestindustries.se/documentation/statistics_ppt_files/international/production-and-exports-of-paper. Accessed August 20, 2016. | ||
Beauchemin PA, Tampier M. Emissions from Wood-Fired Combustion Equipment. Vancouver, British Columbia, Canada: Envirochem Services Inc.; 2008. | ||
Stuart J Benway. Standard & Poor’s Industry Surveys, Paper & Forest Products. New York, NY: Standard & Poor’s; 2013. | ||
Bowen BH, Irwin MW. Coal Characteristics, CCTR Basic Facts File #8. West Lafayette, IN: Purdue University; 2008. | ||
Chambers M. 21st Century ESP Design, Synergism of Old and New Concepts. Pensacola, FL: Southern Environmental, Inc; 2009. | ||
Cuttica J, Hedman B. Industrial/Commercial/Institutional Boiler MACT. Combined Heat and Power A Technical & Economic Compliance Strategy. January 17, 2012. | ||
Eddinger J. Major Source BOILER MACT Webinar. Overview of Requirements, November 21, 2013. | ||
European Commission Report. Integrated Pollution Prevention and Control: Reference Document on Best Available Techniques in the Pulp and Paper Industry, April 2010. | ||
U.S. Energy Information Administration. Manufacturing Energy Consumption Survey (MECS). Available from: http://www.eia.gov/consumption/manufacturing/data/2010/. Accessed January 22, 2014. | ||
Energy Efficiency in U.S. Manufacturing. The case of midwest pulp and paper mills. World Resources Institute. Washington, DC: Energy Efficiency in U.S. Manufacturing; 2013. | ||
U.S. Environmental Protection Agency. Available and Emerging Technologies for Reducing Greenhouse Gas Emissions from Industrial, Commercial, and Institutional Boilers. Sector Policies and Programs Division, Office of Air Quality Planning and Standards, October 2010. | ||
U.S. Environmental Protection Agency. Greenhouse Gas Reporting Program data publication page. Available from: http://www.epa.gov/ghgreporting/ghgdata/reported/pulp-paper.html. Accessed November 8, 2013. | ||
U.S. Environmental Protection Agency. Rule and Implementation Information for Pulp and Paper Production. March 14, 2014. Available from: https://www.epa.gov/stationary-sources-air-pollution/clean-air-act-standards-and-guidelines-agriculture-food-and. Accessed June 28, 2017. | ||
Universal Industrial Sectors Integrated Solutions Model (Universal ISIS-PNP) for the Pulp and Paper Manufacturing Industry, Volume 2, U.S. Environmental Protection Agency, RTP, NC 27711, EPA/600/R-14/322, CTN: ORD-009942. | ||
National Council for Air and Stream Improvement. Environmental Footprint Comparison Tool: Trade-Offs and Co-Benefits Accompanying SOX and NOX Control, 2009. | ||
National Council for Air and Stream Improvement. Pulp and Paper Mill Emissions of SO2, NOX, and Particulate Matter in 2010. Special Report No. 12-03, June 2012. | ||
American Forest & Paper Association (AF&PA). 2014 AF&PA Sustainability Report, July 2014, Better Practices Better Planet 2020. | ||
Srivastava RK, Jozewicz W. Flue gas desulfurization: the state of the art. J Air Waste Manage Assoc. 2001;51(12):1676–1688. | ||
Srivastava R, Neuffer W, Grano D, et al. Controlling NOX emissions from industrial sources. Environmental Progress. 2005;24:2. | ||
Srivastava R, Vijay S, et al. Global climate change-the technology challenge. Chapter 8. Princiotta FT, editor. Reduction of Multi-Pollutant Emissions from Industrial Sectors: The U.S. Cement Industry-A Case Study. New York, NY: Springer; 256–298. | ||
American Forest & Paper Association. AF&PA Sustainability Report, 2016, Advancing U.S. Paper and Wood Products Industry Sustainability Performance. |
 © 2017 The Author(s). This work is published and licensed by Dove Medical Press Limited. The
full terms of this license are available at https://www.dovepress.com/terms
and incorporate the Creative Commons Attribution
- Non Commercial (unported, 3.0) License.
By accessing the work you hereby accept the Terms. Non-commercial uses of the work are permitted
without any further permission from Dove Medical Press Limited, provided the work is properly
attributed. For permission for commercial use of this work, please see paragraphs 4.2 and 5 of our Terms.
© 2017 The Author(s). This work is published and licensed by Dove Medical Press Limited. The
full terms of this license are available at https://www.dovepress.com/terms
and incorporate the Creative Commons Attribution
- Non Commercial (unported, 3.0) License.
By accessing the work you hereby accept the Terms. Non-commercial uses of the work are permitted
without any further permission from Dove Medical Press Limited, provided the work is properly
attributed. For permission for commercial use of this work, please see paragraphs 4.2 and 5 of our Terms.