Back to Journals » OncoTargets and Therapy » Volume 13
Analysis of Differential Expression Proteins of Paclitaxel-Treated Lung Adenocarcinoma Cell A549 Using Tandem Mass Tag-Based Quantitative Proteomics
Received 6 May 2020
Accepted for publication 15 August 2020
Published 13 October 2020 Volume 2020:13 Pages 10297—10313
DOI https://doi.org/10.2147/OTT.S259895
Checked for plagiarism Yes
Review by Single anonymous peer review
Peer reviewer comments 2
Editor who approved publication: Prof. Dr. Takuya Aoki
Wanchun Zheng,1 Shouming Xu2
1Academy of Chinese Medical Sciences, Henan University of Chinese Medicine, Zhengzhou, People’s Republic of China; 2State Key Laboratory of Crop Stress Adaptation and Improvement, School of Life Sciences, Henan University, Kaifeng 475004, People’s Republic of China
Correspondence: Shouming Xu
Henan University, Jinming Avenue, Kaifeng, Henan 475004, People’s Republic of China
Tel/Fax +86-371-23887799
Email [email protected]
Background: Paclitaxel is widely used in the treatment of cancer and has a good effect in the treatment of non-small cell lung cancer. The combination of TMT proteomics and bioinformatics is used to systematically analyze the molecular mechanism of paclitaxel in the treatment of lung adenocarcinoma A549 cell, which is helpful to screen new therapeutic targets.
Methods: MTT assay was used to analyze the inhibitory effect of paclitaxel on the proliferation of A549 cells. The proteins were identified by TMT quantitative proteomics and the differential expression proteins (DEPs) database was constructed. The DEPs were enriched by Gene Ontology (GO) and KEGG pathway annotation. Based on the information in the STRING database, find the interaction between DEPs, and the protein–protein interaction (PPI) networks of DEPs were constructed and analyzed by using the Cytoscape software. According to the PPI network results, select the hub proteins from DEPs for WB verification.
Results: A total of 5449 proteins were identified in A549 by TMT proteomics. Compared with the control group, 281 DEPs were significantly up-regulated and 218 were significantly down-regulated after paclitaxel treatment. GO functional analysis, we found that the main functions of these DEPs are binding, catalytic activity, molecular function regulator and so on. They are mainly involved in cellular process, metabolic process, biological regulation and so on. KEGG analysis showed that the three most significant signal transduction pathways of DEPs enrichment were DNA replication, steroid biosynthesis, oxidative phosphorylation. In PPI network, there are 294 nodes among which CDK1, MCM2-5 and PCNA are located at the center of proteins interaction. WB analysis confirmed that the expression of CDK1 was significantly down-regulated, consistent with the TMT results.
Conclusion: Paclitaxel significantly increased the expression of tubulin, binding tubulin to promote A549 cell death. In addition, paclitaxel significantly inhibited the expression of hub proteins, DNA replication and cell cycle pathways, thus killing lung adenocarcinoma cell A549. These findings will enhance the understanding of the mechanism of paclitaxel in the treatment of lung adenocarcinoma cell A549 and provide new valuable targets.
Keywords: proteomics, tandem mass tags, TMT, paclitaxel, alveolar epithelial cells, A549
Introduction
Lung cancer has a 27% mortality rate, the highest of all cancers.1 Almost 85% of lung cancer cases belong to non-small cell lung cancer (NSCLC), including lung adenocarcinoma.2 The five-year survival rate of NSCLC is only 15%, and most NSCLC patients are already in advanced stage at the time of diagnosis.3 At this time, chemotherapy is the main treatment method. Paclitaxel was originally extracted from Taxus brevifolia and is widely used in cancer treatment, such as cervical cancer, pancreatic cancer, and so on.4,5 In the treatment of NSCLC, paclitaxel has a good effect, and it’s still regarded as the first-line therapies for advanced NSCLC patients.6 Therefore, a deeper understanding of the molecular mechanism of paclitaxel in the treatment of lung adenocarcinoma will help to screen effective therapeutic targets. Tandem mass tag (TMT) and Isobaric Tags for Relative and Absolute Quantitation (iTRAQ) are quantitative techniques of peptide labeling in vitro developed by Thermo and AB SCIEX, respectively, with the same basic principles. TMT and iTRAQ are high-throughput screening techniques commonly used in quantitative proteomics in recent years. By combining with the N-terminal groups of peptides, the peptides can be labeled, and samples from different sources can be labeled with reagents of different molecular weights, thereby achieving comparison of proteomes between different samples.7,8 TMT/iTRAQ quantitative proteomics have applications in many fields, such as: Li et al used 8-plex iTRAQ to analyze the differentially expressed proteins of tolerance to salt stress in cotton roots.9 Zhao et al analyzed the differential expression of heat-resistant proteins in spinach with 8-plex iTRAQ to improve the understanding of spinach heat-resistant mechanism.10 Zou et al used a 6-plex TMT labeling and titanium dioxide-based phosphopeptide enrichment to quantitatively analyze the differential expression of phosphorylated proteins after ginsenoside Rg3 treatment of breast cancer cells.11 In addition, TMT technology is widely used in gastric cancer, liver cancer, breast cancer and other tumors to screen for differential proteins, tumor markers, and prognostic markers.12–14
In this study, TMT was used to detect the differentially expressed proteins in lung adenocarcinoma A549 cells treated with paclitaxel, and bioinformatics analysis was conducted to identify important protein molecules and signal pathways related to paclitaxel treatment of lung cancer. Explore the molecular mechanism of paclitaxel in the treatment of lung cancer, and provide new molecular targets for the precise treatment of lung cancer.
Materials and Methods
Cell Culture and Cell Viability Assay
The human lung cancer A549 cell line was purchased from the Chinese Academy of Sciences Type Culture Collection in Shanghai, China. Human A549 lung adenocarcinoma epithelial cells were cultured in RPMI-1640 medium (Beijing Solarbio Science & Technology Co., Ltd.) supplemented with 10% fetal bovine sera (Biological Industries). The effect of paclitaxel (Hainan Choitec Pharmaceuticals Co., Ltd.) on the growth and proliferation of A549 cells was measured using the MTT method and repeated three times. A549 cells were seeded in 96-well plates at a density of 104 cells/well, 100 μL/well with RPMI-1640 medium containing 10% FBS. After seeding for 24 h, the medium was removed and replaced with 100 μL of fresh medium containing serial concentrations of paclitaxel (2.5 μg/mL, 5 μg/mL, 10 μg/mL, 20 μg/mL, 40 μg/mL). After 48 h of incubation, the cells were treated with 20 μL of fresh medium containing 0.5 mg/mL MTT (Beijing Solarbio Science & Technology Co., Ltd.) and incubated at 37°C for 4 h. The solution was removed, and about 150 μL of DMSO (Beijing Solarbio Science & Technology Co., Ltd.) was added to each well to dissolve the purple formazan crystals. Absorbance was determined at 570 nm by using a microplate reader. Results were expressed as the percentage of MTT reduction relative to the absorbance of control cells.
Sample Preparation and TMT Labeling
A549 cells in logarithmic phase were collected and seeded at a density of 6×10⁵/10 mL in a 10 cm petri dish. The RPMI-1640 medium contained 10% serum, 5% CO2, and was incubated at 37°C. After 24 hours, they were divided into control group and paclitaxel group, with two dishes in each group. The control group was replaced with a normal medium, and the paclitaxel group was replaced with a medium containing 10 μg/mL paclitaxel, and all incubated for 48 hours at 37°C. Wash twice with 4°C pre-chilled PBS (Beijing Solarbio Science & Technology Co., Ltd.) buffer, collect cells, and retain cell pellet after centrifugation. Repeat the above steps three times to collect three batches of samples.
Extraction of protein from samples by SDT (4% SDS, 100 mM Tris/HCl pH 7.6, 0.1 M DTT) Pyrolysis.15 After centrifuged at 14,000 g for 40 min, the supernatant was quantified with the BCA Protein Assay Kit (Bio-Rad, USA). The protein sample was stored at −80 °C. Then protein extracts were processed using the filter aided proteome preparation (FASP) method for TMT experiments, peptide segment quantification at OD280.15
TMT Labeling
One hundred microgram peptide mixture of each sample was labeled using TMT reagent according to the manufacturer’s instructions (TMT Mass Tagging Kits and Reagents, Thermo Fisher Scientific).
The labeled peptide segments of each group were mixed equally and graded with the High pH Reversed-Phase Peptide Fractionation Kit (User Guide: Pierce High pH Reversed-Phase Peptide Fractionation Kit, Thermo Fisher Scientific). Firstly, the column was equilibrated with acetonitrile and 0.1% trifluoroacetic acid (TFA). Then the mixed labeled peptide samples were loaded, and pure water was added, desalination was carried out by low-speed centrifugation. Finally, the column-bound peptide was gradient eluted with acetonitrile solution of high pH with successively increasing concentration. After vacuum drying of each eluted peptide sample, the lyophilized samples were redissolved with 12 μL of 0.1% FA. And the peptide concentration was determined by OD280.
LC-MS/MS Data Acquisition
Each fraction was injected for nano-MS/MS analysis. Each grading sample was separated by HPLC system Easy nLC with nanoliter flow rate. The buffer Solution A is 0.1% formic acid aqueous solution, and the Solution B is 0.1% formic acid acetonitrile aqueous solution (84% acetonitrile). The chromatographic column is equilibrated with 95% Solution A, and the sample is loaded from the autosampler to the loading column (Thermo Scientific Acclaim PepMap100, 100 μm*2 cm, nanoViper C18). Separated by analytical column (Thermo scientific EASY column, 10 cm, ID75 μm, 3 μm, C18-A2), and the flow rate is 300 nL/min. Samples were separated by chromatography (Thermo Fisher Scientific, Inc.) and then analyzed by Q-exactive mass spectrometer. The detection method is positive ion, the scanning range of parent ion is 300–1800 M/Z, the resolution of the primary mass spectrum is 70,000 at 200 m/z, the AGC (Automatic gain control) target is 1e6, the Maximum IT is 50 ms, and the dynamic exclusion time is 60.0 s. The mass-to-charge ratios of peptides and peptide fragments were collected as follows: After each full scan, 20 fragments were collected (MS2 scan), MS2 Activation Type was HCD, Isolation window was 2 m/z, Secondary MS resolution was 17,500 at 200 m/z (TMT 6-plex), Normalized Collision Energy was 30 eV, Underfill was 0.1%.
Protein Identification and Quantitative Analysis
The data of mass spectrometry results were RAW files, which were identified and quantitatively analyzed by software Mascot 2.2 and Proteome Discoverer Version 1.4 (Thermo Fisher Scientific Inc.).
Differentially Expressed Proteins Definition and Cluster Analysis
Differentially expressed proteins (DEPs) were screened for criteria with fold changes greater than 1.2-fold (up-regulation≥1.2-fold or down-regulation≤0.83) and P value≤0.05. The volcano plot was constructed in order to visualize the DEPs between control groups and paclitaxel groups. In the volcano plot, multiples of protein expression difference (log Foldchanges) as abscissa X and P value of T-test (lg P value) as ordinate Y.
The studied protein relative expression data were used to performing hierarchical clustering analysis. Firstly, the quantitative information of the target protein set is normalized to the (−1,1) range. Then, Cluster 3.0 (http://bonsai.hgc.jp/~mdehoon/software/cluster/software.htm), the Java TrueView software (http://jtreeview.sourceforge.net) and Complex Heatmap R package (R Version 3.4) were used. Euclidean distance algorithm for similarity measure and average linkage clustering algorithm for clustering were selected when performing hierarchical clustering. Finally, a clustering heat map is generated to visualize the results.
Gene Ontology (GO) Annotation and Pathway Enrichment Analysis
The protein sequence data of DEPs were in batches retrieved from UniProtKB (Release 2016_10) in FASTA format. The NCBI BLAST+ software was used to identify homolog sequences from Swiss-Prot database (mouse) and transferred the functional annotation to the studied sequences. The top 10 blast hits (E-value <10-3) of the query sequences were retrieved and loaded into Blast2GO (Version 3.3.5) for GO mapping and annotation.16 The annotation parameters of BLAST2GO were as follows: E-value filter=10-6, default gradual EC weights, an annotation cutoff = 75, and GO weight =5.The sequences without BLAST hits and un-annotated sequences were selected to InterProScan against EBI databases for retrieving functional annotations, and then the InterProScan GO terms were merged to the annotation set.17 The GO annotation results were plotted by R scripts.
The protein sequences of DEPs in FASTA format were blasted against the online Kyoto Encyclopedia of Genes and Genomes (KEGG) database (http://geneontology.org/) to retrieve their KOs and were subsequently mapped to pathways in KEGG.18 The KAAS (KEGG Automatic Annotation Server) software was used to annotate the KEGG pathway.
To further explore the impact of DEPs in cell physiological process and the internal relations between DEPs, GO and KEGG pathway enrichment analysis were performed. All enrichment analyses were based on the Fisher’s exact test. The Benjamini-Hochberg correction multiple testing was performed to adjust the p-values. Only functional categories and pathways with p-values <0.05 were considered as significant.
Construction of PPI Network and Screening Hub Protein
The protein–protein interaction information of the studied proteins was retrieved from STRING software (http://string-db.org/) by their gene symbols. The results were downloaded in the XGMML format and imported into Cytoscape software (http://www.cytoscape.org/,version 3.2.1) to visualize and further analyze functional protein-protein interaction networks.19 Furthermore, the degree of each protein was calculated to evaluate the importance of the protein in the PPI network.
Identification by Western Blotting
According to the PPI network results, select the hub proteins from DEPs for WB verification. A549 cells in the logarithmic growth stage were divided into 2 groups: control group and 10 μg/mL paclitaxel group. After 48 h, A549 cell proteins were collected and extracted with RIPA (Beijing Solarbio Science & Technology Co., Ltd.) lysis buffer containing 1 mM PMSF (Beijing Solarbio Science & Technology Co., Ltd.). Protein concentration was determined by BCA (Beijing Solarbio Science & Technology Co., Ltd.) method. Then 20ng protein samples each group were separated by SDS-PAGE and electrotransferred onto PVDF membrane (Millipore, USA). The membranes were blocked with 5% skim milk for 1 h and incubated with primary antibodies overnight at 4°C. The following day, the membrane was washed three times with TBST (Beijing Solarbio Science & Technology Co., Ltd.), and incubated with secondary antibodies for 1 h at room temperature. At the last, the membrane was washed three times with TBST and the target bands were detected by ECL (Beijing Solarbio Science & Technology Co., Ltd.). GAPDH (Company ABclonal, Inc. Wuhan) was used as the internal control to normalize protein levels. The primary antibodies used in this study include CDK1 (Company ABclonal, Inc. Wuhan) and MCM5 (Company ABclonal, Inc. Wuhan). The secondary antibodies were from ABclonal too.
Results
Inhibitory Effect of Paclitaxel on A549 Cell Proliferation
A549 cells were treated with various concentrations of paclitaxel (2.5 μg/mL, 5 μg/mL, 10 μg/mL, 20 μg/mL, 40 μg/mL) for 48 h and cell viability was determined using MTT assay. The proliferation inhibition rate was significantly increased with the increase of paclitaxel concentration in a significant dose-dependent manner. Whereas, paclitaxel treatment had a significant effect on reducing cell viability at concentrations higher than 10 μg/mL. At concentrations of 10 μg/mL, paclitaxel significantly attenuated the cell viability to 48.77% (Figure 1). Experiments were repeated three times including five technical replicates for each testing condition.
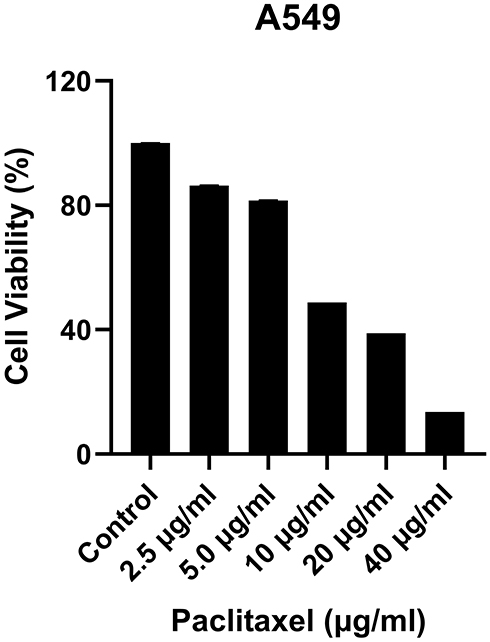 |
Figure 1 The effects of paclitaxel on the viability of A549 cells were evaluated by using MTT assay. The values are expressed as the means ± SD, (n=5). |
Protein Identification Results
In the 6-plex TMT-based quantitative proteomic studies, more than 5449 proteins were identified from the cell lysates of the Control and the Paclitaxel (10 μg/mL) groups. After statistical analysis, the protein identification results are presented in Table 1. For full lists of identified proteins and peptides see Supplementary Data 1 and 2.
 |
Table 1 Statistics of Protein Identification Results |
Differentially Expressed Proteins Screening
To explore the DEPs between paclitaxel group and control group, we applied TMT to select potential targets with 1.2-fold change differences as the screening criteria. The proteins with ratio values of more than 1.2-fold or less than 0.83-fold (P<0.05) were considered as differentially expressed proteins (DEPs). In paclitaxel group compared with control, 499 DEPs were identified, 281 (56.3%) of which were up regulated and 218 (43.7%) of which were down-regulated. The number of DEPs in Table 2. Table 3 lists the top 20 up-regulated and Table 4 the identified down-regulated proteins. See Supplementary Data 3 for full lists of significantly changed DEPs.
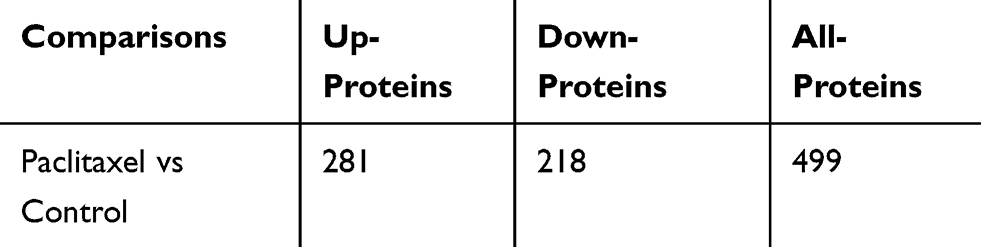 |
Table 2 Statistical Results of DEPs |
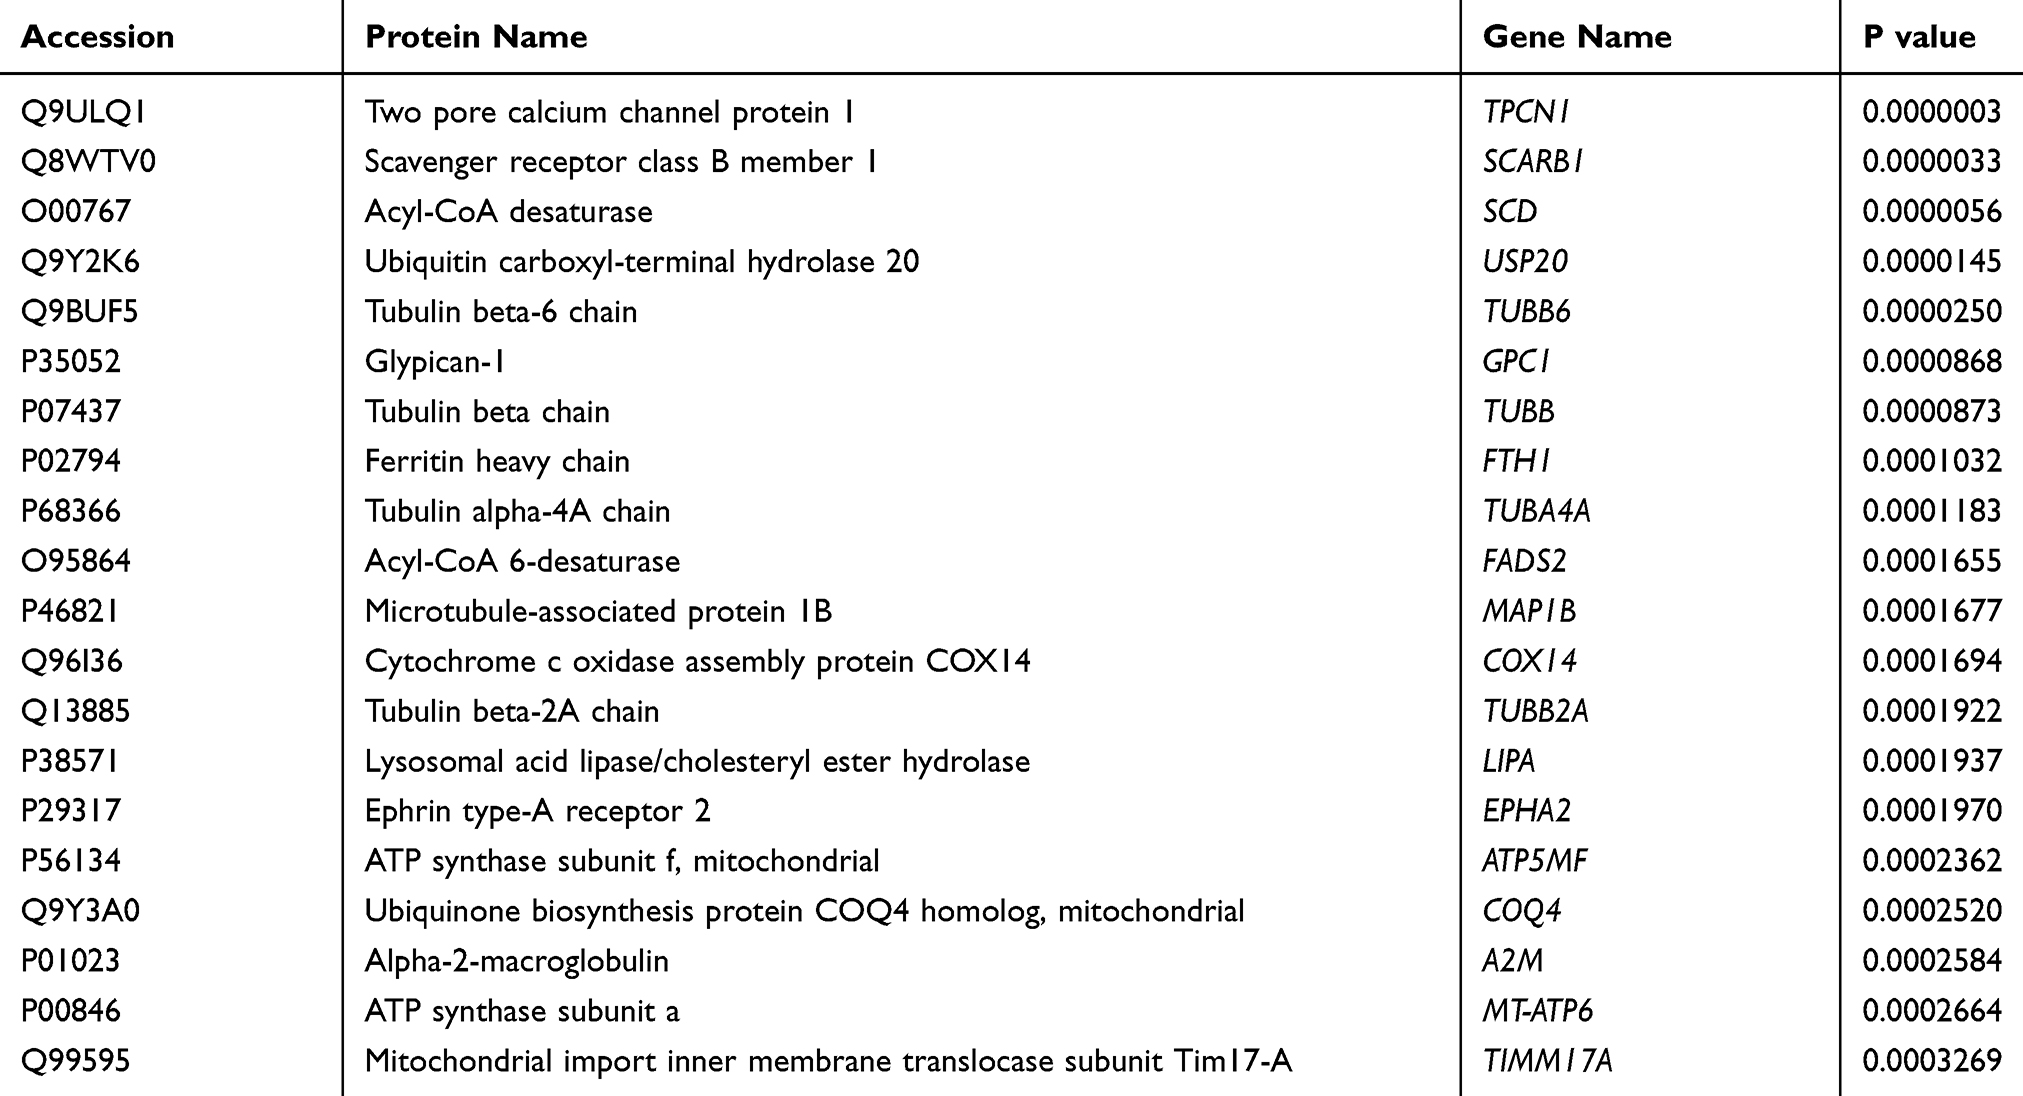 |
Table 3 Top 20 Up-Regulated Significant DEPs |
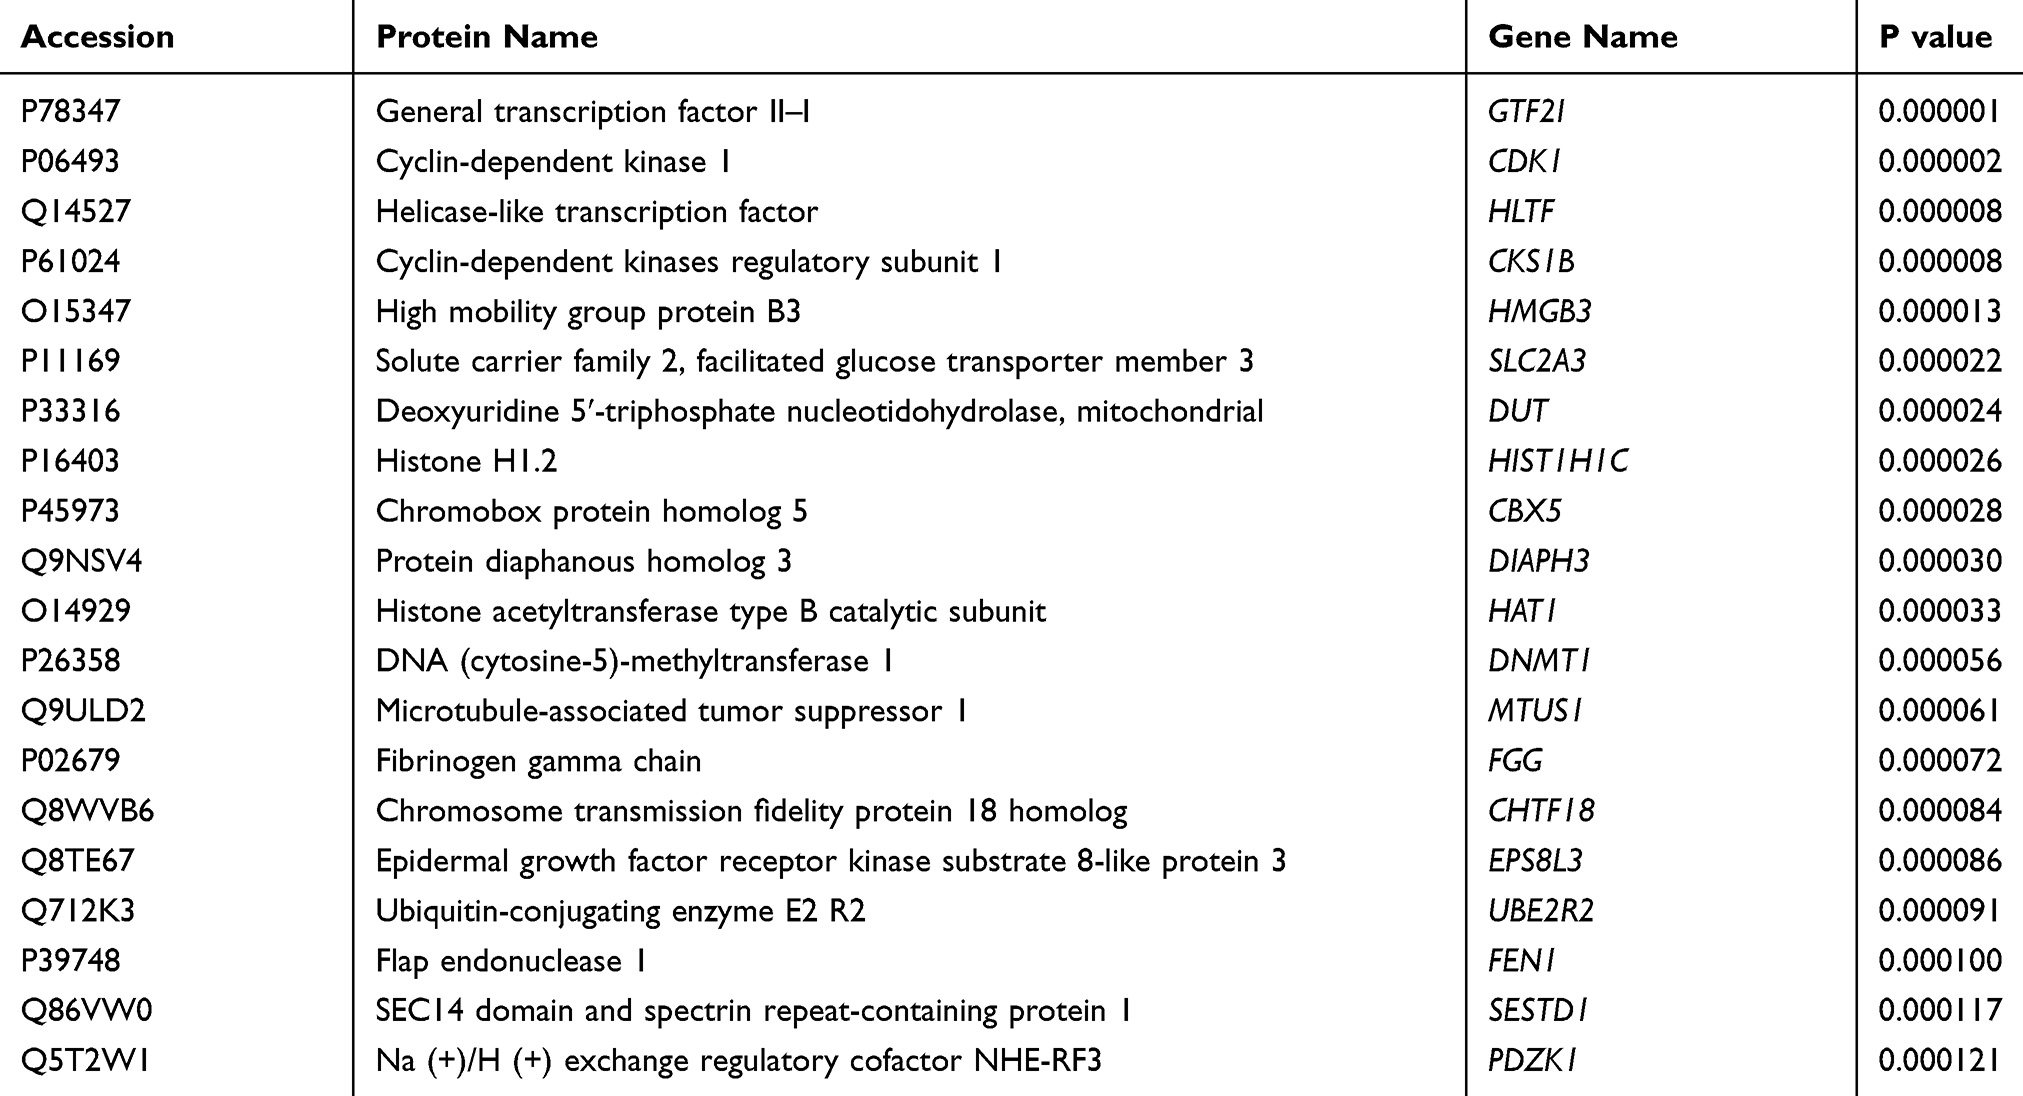 |
Table 4 Top 20 Down-Regulated Significant DEPs |
Volcano Plot of the Quantified DEPs
Proteins expression difference fold change as the horizontal axis and P value obtained from T-test as the vertical axis, which were used to map the volcano. Volcano plot showing the significant difference between the control and paclitaxel groups. The x-axis and y-axis represent log2 fold change (FC) of proteins and -log10 of the P-value, respectively. In Figure 2 each dot represents a protein. Red dots indicate a significant difference (FC≥1.2 or ≤0.83, P<0.05), and the black dots stand for no significant difference.
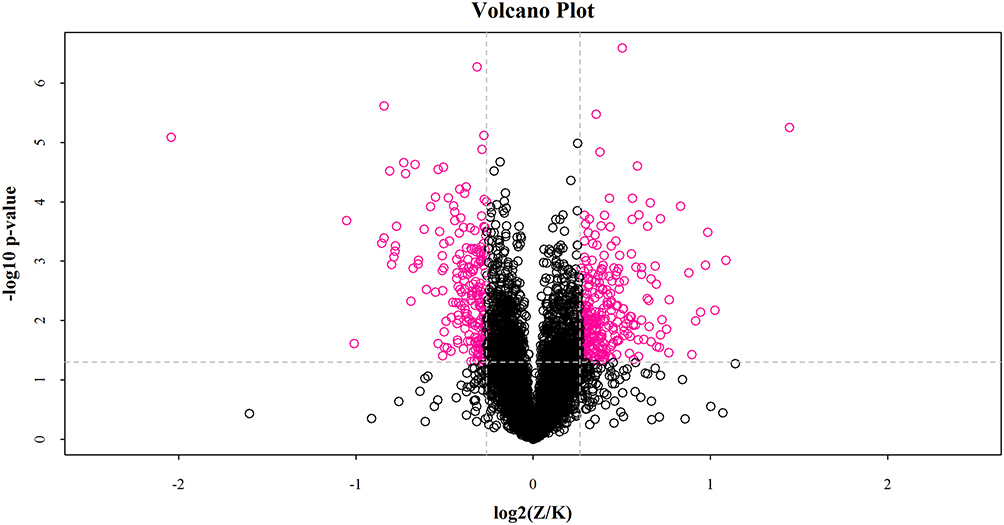 |
Figure 2 Volcano Plot of Differential Expression Analysis. In the log2(Z/K), Z represents Paclitaxel and K represents Control. The proteins with the largest and most statistically significant absolute fold-change between paclitaxel treatment and control are those at the upper left and right corners (red dots). |
Bioinformatics Analysis
Cluster Analysis of DEPs
In this study, hierarchical clustering was used to analyze the differential expression proteins in A549 cell lines treated with paclitaxel, and the data were displayed in the form of heat map. As shown in Figure 3, the DEPs obtained through the standard screening with fold changes greater than 1.2 times (P<0.05) can effectively separate the comparison group, thereby explaining the rationality of DEPs screening. In the clustering heat map, each row represents a protein, and each column corresponds to a group of samples. The abscissa displays the samples and the ordinate represents significantly DEPs. Red represents significantly up-regulated proteins, blue represents significantly down regulated proteins, and white represents proteins without quantitative information. See Supplementary Figure 1 for a full-size image.
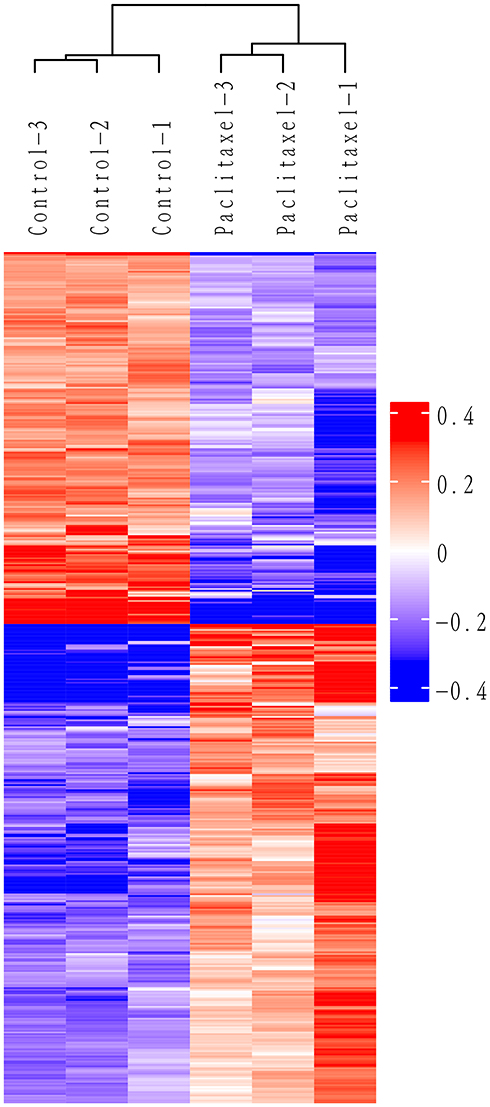 |
Figure 3 Cluster analysis of 499 DEPs. Each row represents one protein, and each column represents one sample. Red represent significantly upregulated proteins, blue represent significantly downregulated proteins, and white represent no significantly proteins. |
DEPs Gene Ontology Analysis
In this project, we use Blast2Go (http://www.blast2go.com/) software to annotate GO functions for all proteins identified.16 To characterize DEPs, the Gene Ontology (GO) terms including biological process (BP), molecular function (MF) and subcellular component (CC) were analyzed. The enrichment analysis of the DEPs was determined by Fisher’s exact test. P-values were calculated using Fisher’s exact test. As show in Figure 4, the color gradient represents the size of the p value; the color is from orange to red, and the nearer red represents the smaller the p value; the higher the significant level of enrichment of the corresponding GO annotation. The top 20 GO terms ranked by the FDR value are listed in Table 5. For full list of GO terms see Supplementary Data 4
 |
Table 5 Top 20 GO Terms |
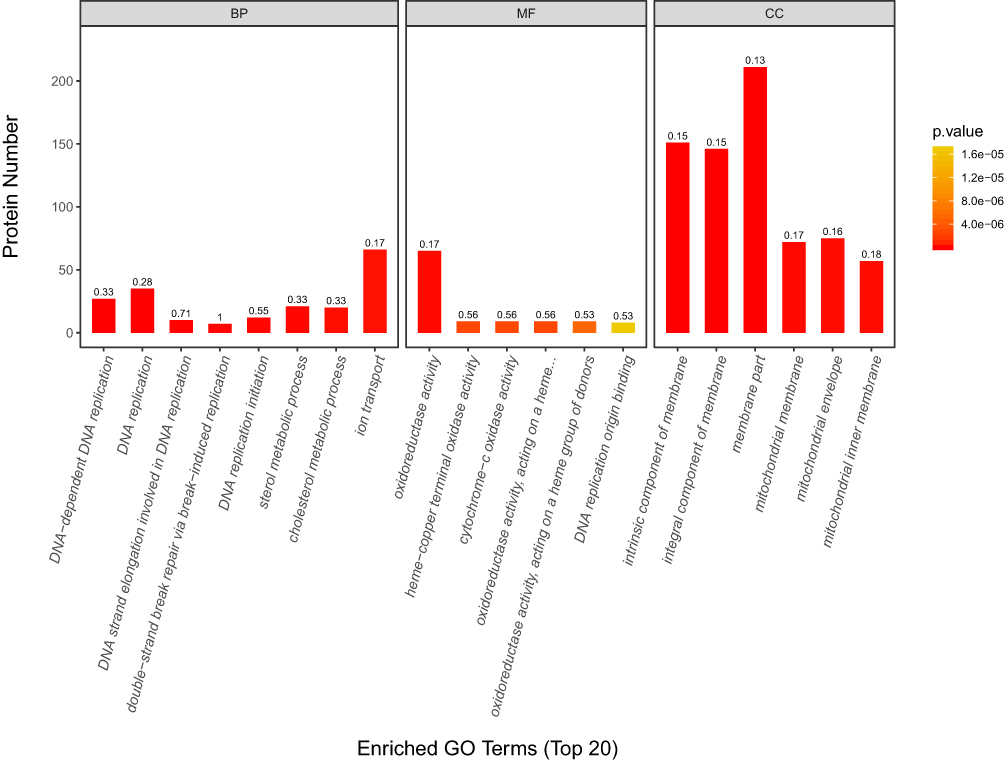 |
Figure 4 Enriched GO Terms (Top 20). The abscissa represents three GO categories: biological processes (BP), molecular functions (MF) and cellular components (CC). The left coordinate axis indicates the number of DEPs for each GO annotation. The numbers above each bar reflect the proportion of DEPs for every GO annotation. The smaller the p-value, the closer the color is to red. |
The analysis results show that the 515 GO items involved in Biological Process (BP). It is mainly involved in important BP such as DNA-dependent DNA replication, DNA replication, DNA strand elongation involved in DNA replication, double-strand break repair via break-induced replication, and DNA replication initiation. The top 10 GO terms of Biological Processes in Table 6. See Supplementary Figure 2 for GO level 2 BP.
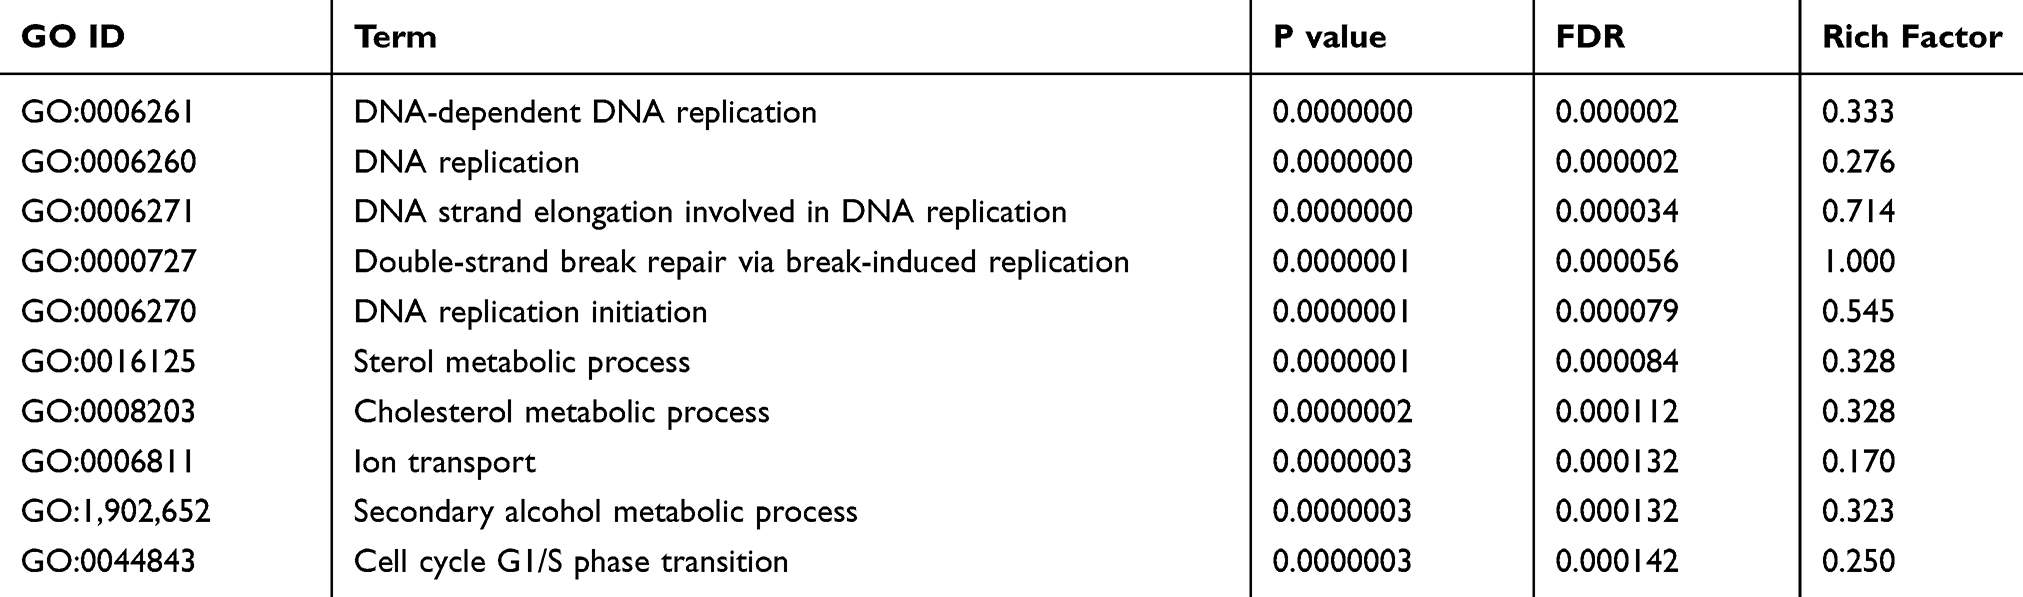 |
Table 6 Top 10 GO-Enriched Terms of Biological Processes (BP) |
DEPs involved 125 GO terms in the Molecular Function (MF). It is mainly involved in MF such as oxidoreductase activity, oxidoreductase activity, acting on a heme group of donors, oxygen as acceptor, cytochrome-c oxidase activity, heme-copper terminal oxidase activity and oxidoreductase activity, acting on a heme group of donors and so on. The top 10 GO terms of Molecular Function in Table 7. See Supplementary Figure 3 for GO level 2 MF.
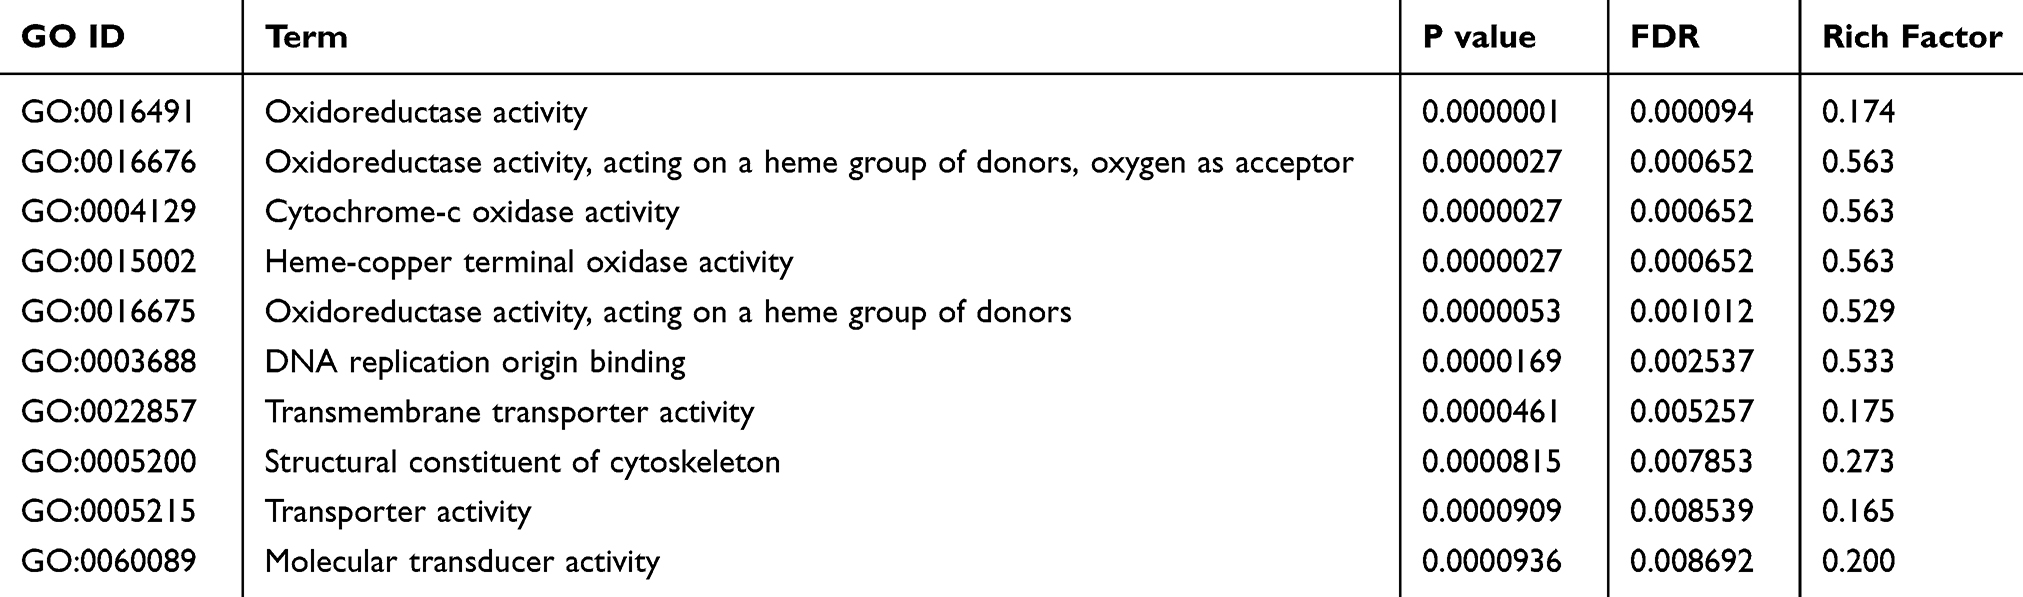 |
Table 7 Top 10 GO-Enriched Terms of Molecular Function (MF) |
In Cellular Component (CC), there are 123 GO items in total. They are mainly localized proteins such as intrinsic component of membrane, integral component of membrane, membrane part, mitochondrial membrane, and mitochondrial envelope. The top 10 GO terms of Cellular Component in Table 8. See Supplementary Figure 4 for GO level 2 CC.
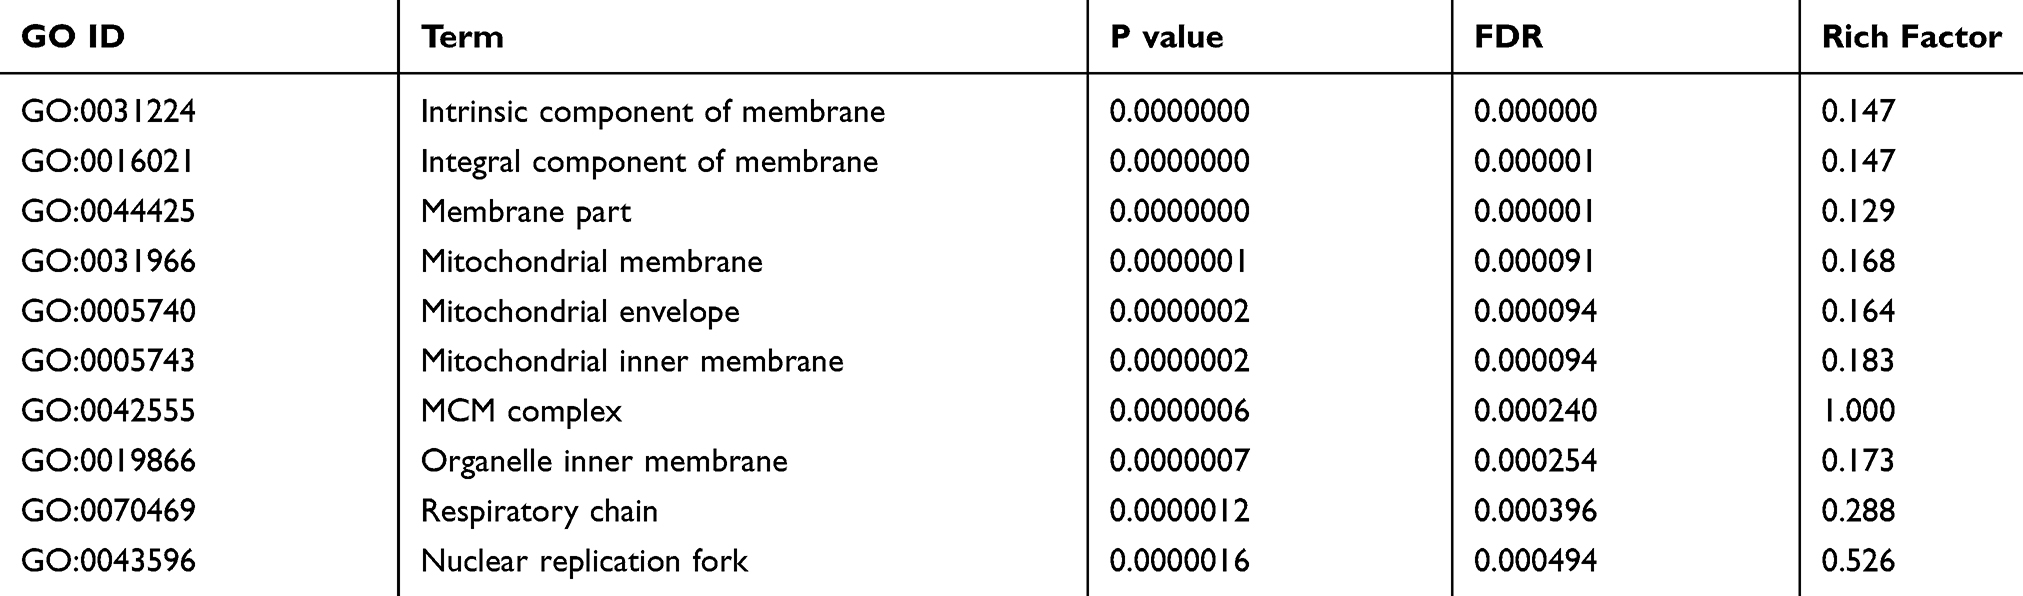 |
Table 8 Top 10 GO-Enriched Terms of Cellular Component (CC) |
GO enrichment analysis showed that the functions of these DEPs were mainly binding, catalytic activity, molecular function regulator, transporter activity and structural molecule activity. These DEPs are mainly involved in important biological processes such as cellular process, metabolic process, biological regulation, regulation of biological process and cellular component organization or biogenesis.
Paclitaxel Regulates Network Signaling Pathways in A549 Cells
Enrichment Analysis of KEGG Pathways for DEPs
KEGG pathway enrichment analysis of DEPs between the paclitaxel and control groups by Fisher’s exact test. A total of 31 pathways were enriched significantly P<0.05. These KEGG pathways were sorted in ascending order based on FDR value, and the top 5 most significantly enriched differentially were DNA replication, Steroid biosynthesis, Oxidative phosphorylation, Parkinson disease and Alzheimer disease. The top 20 enriched pathways are shown in Figure 5 and listed in Table 9. For full list of enriched KEGG pathways see Supplementary Data 5.
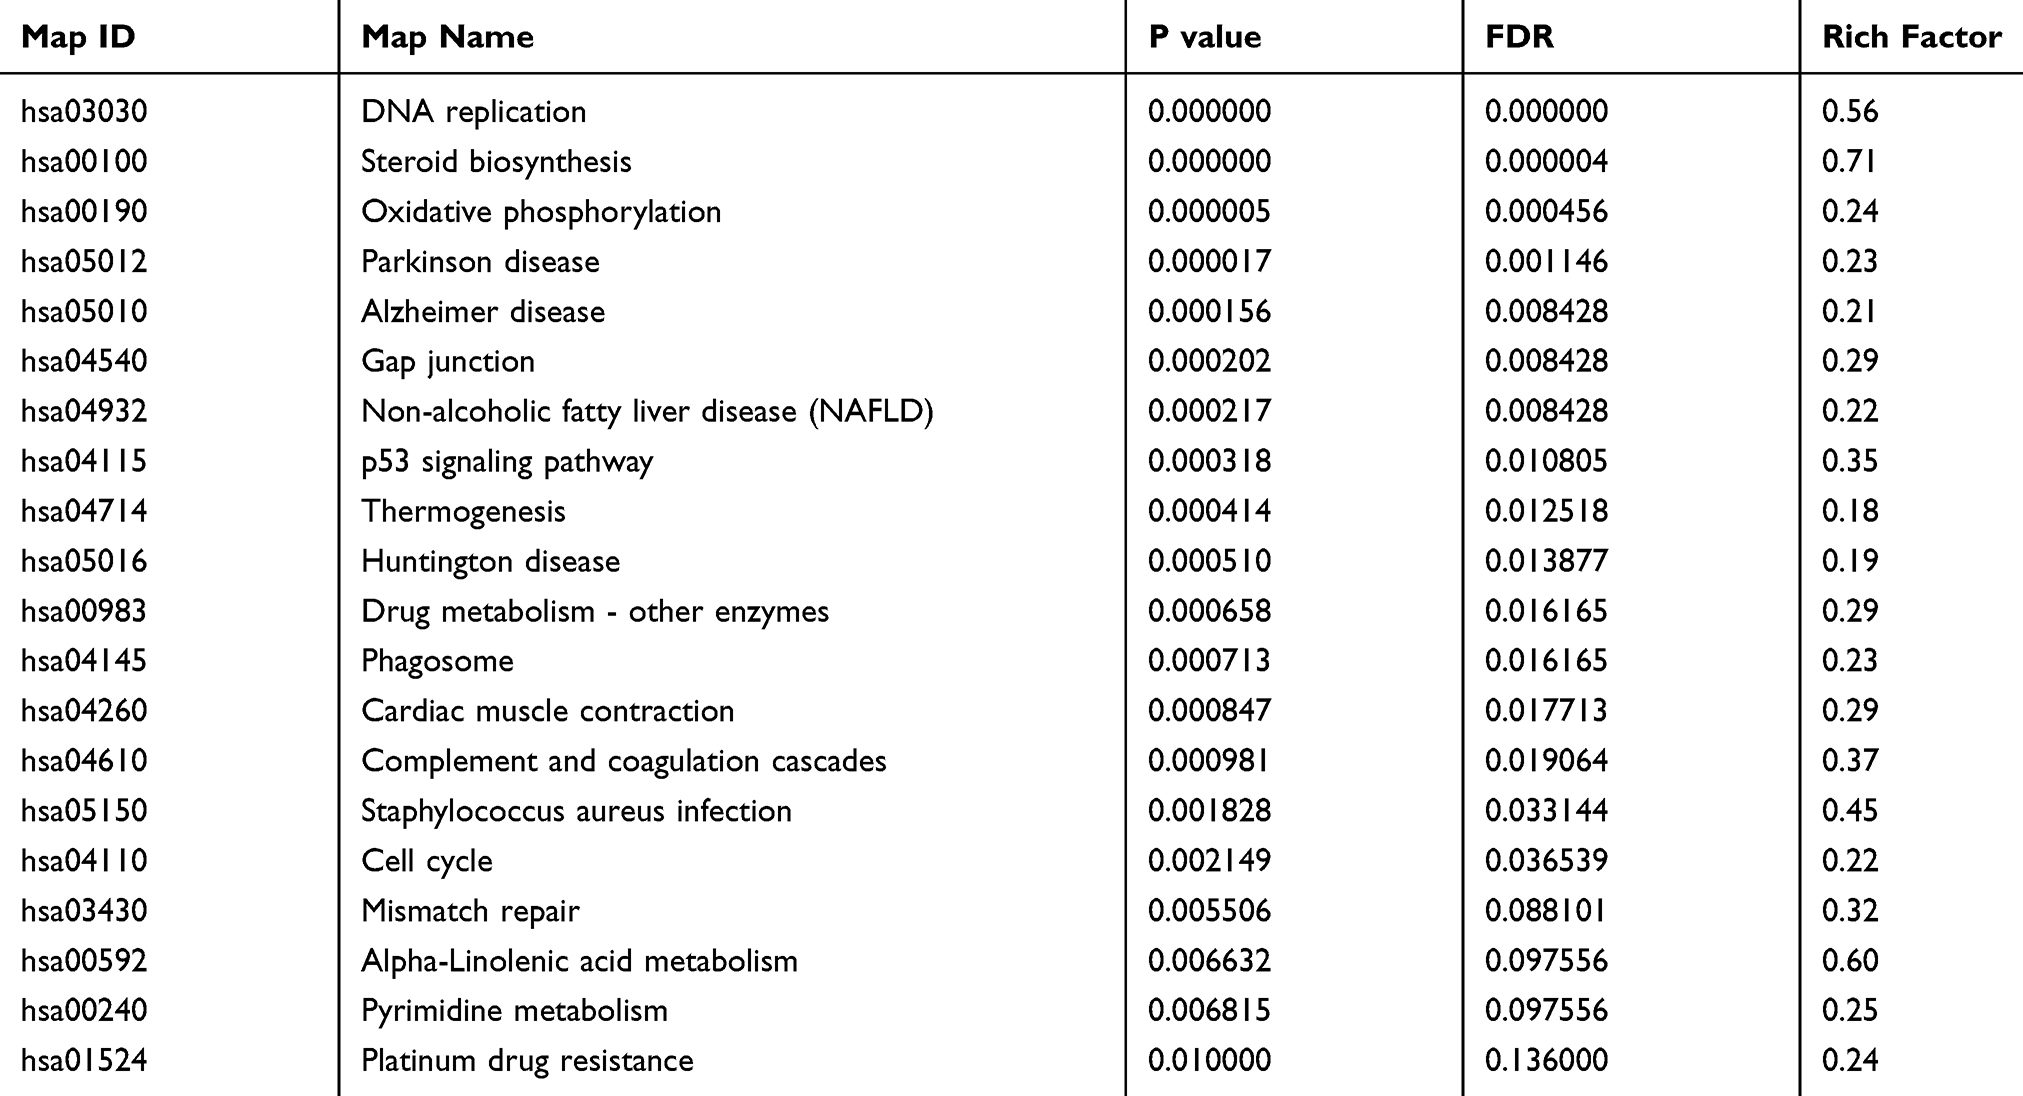 |
Table 9 Top 20 Most Enriched KEGG Pathways |
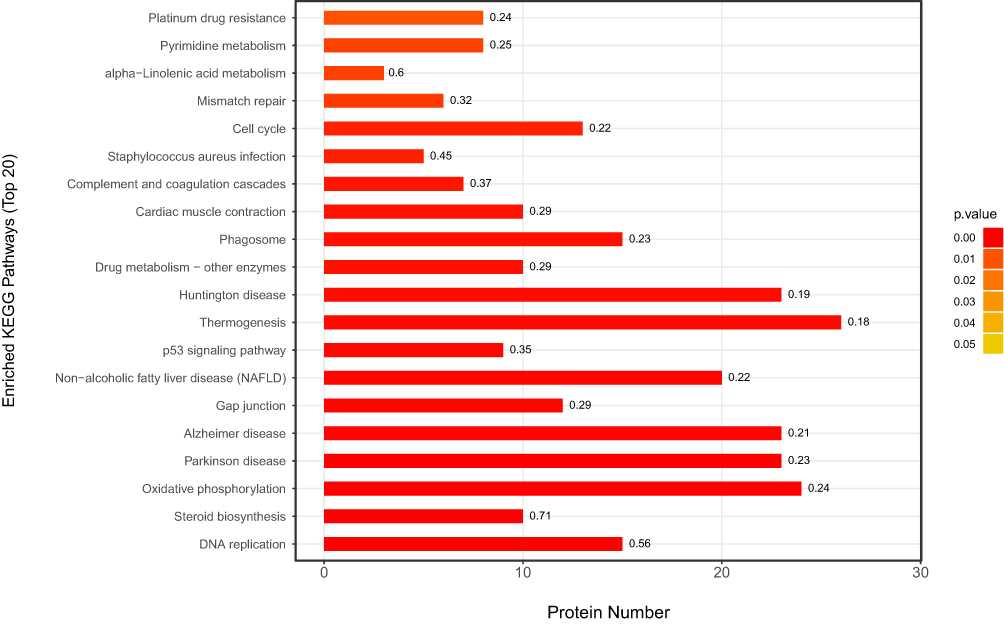 |
Figure 5 KEGG Pathway Enrichment of DEPs. The abscissa represents the number of proteins corresponding to KEGG pathway functions. The left coordinate axis indicates the significantly enriched KEGG pathways. The numbers on the right of each bar reflect the ratio of identified DEPs out of the total number of proteins in the pathway. The smaller the p-value, the closer the color is to red. |
The Protein–Protein Interaction Network Analysis
To establish functional links among the DEPs, the PPI network was constructed using Cytoscape. The protein interaction network created 293 nodes and 2291 edges with an average node degree of 15.6, as shown in Figure 6. The PPI network demonstrated that CDK1 (P06493), MCM5 (P33992), MCM2 (P49736), MCM3 (P25205), MCM4 (P33991) were the hub nodes of such protein-protein interaction. Most of these hub nodes are enriched in DNA replication pathway, especially the MCM proteins family. The top 20 hub proteins with the highest values of degree in Table 10.
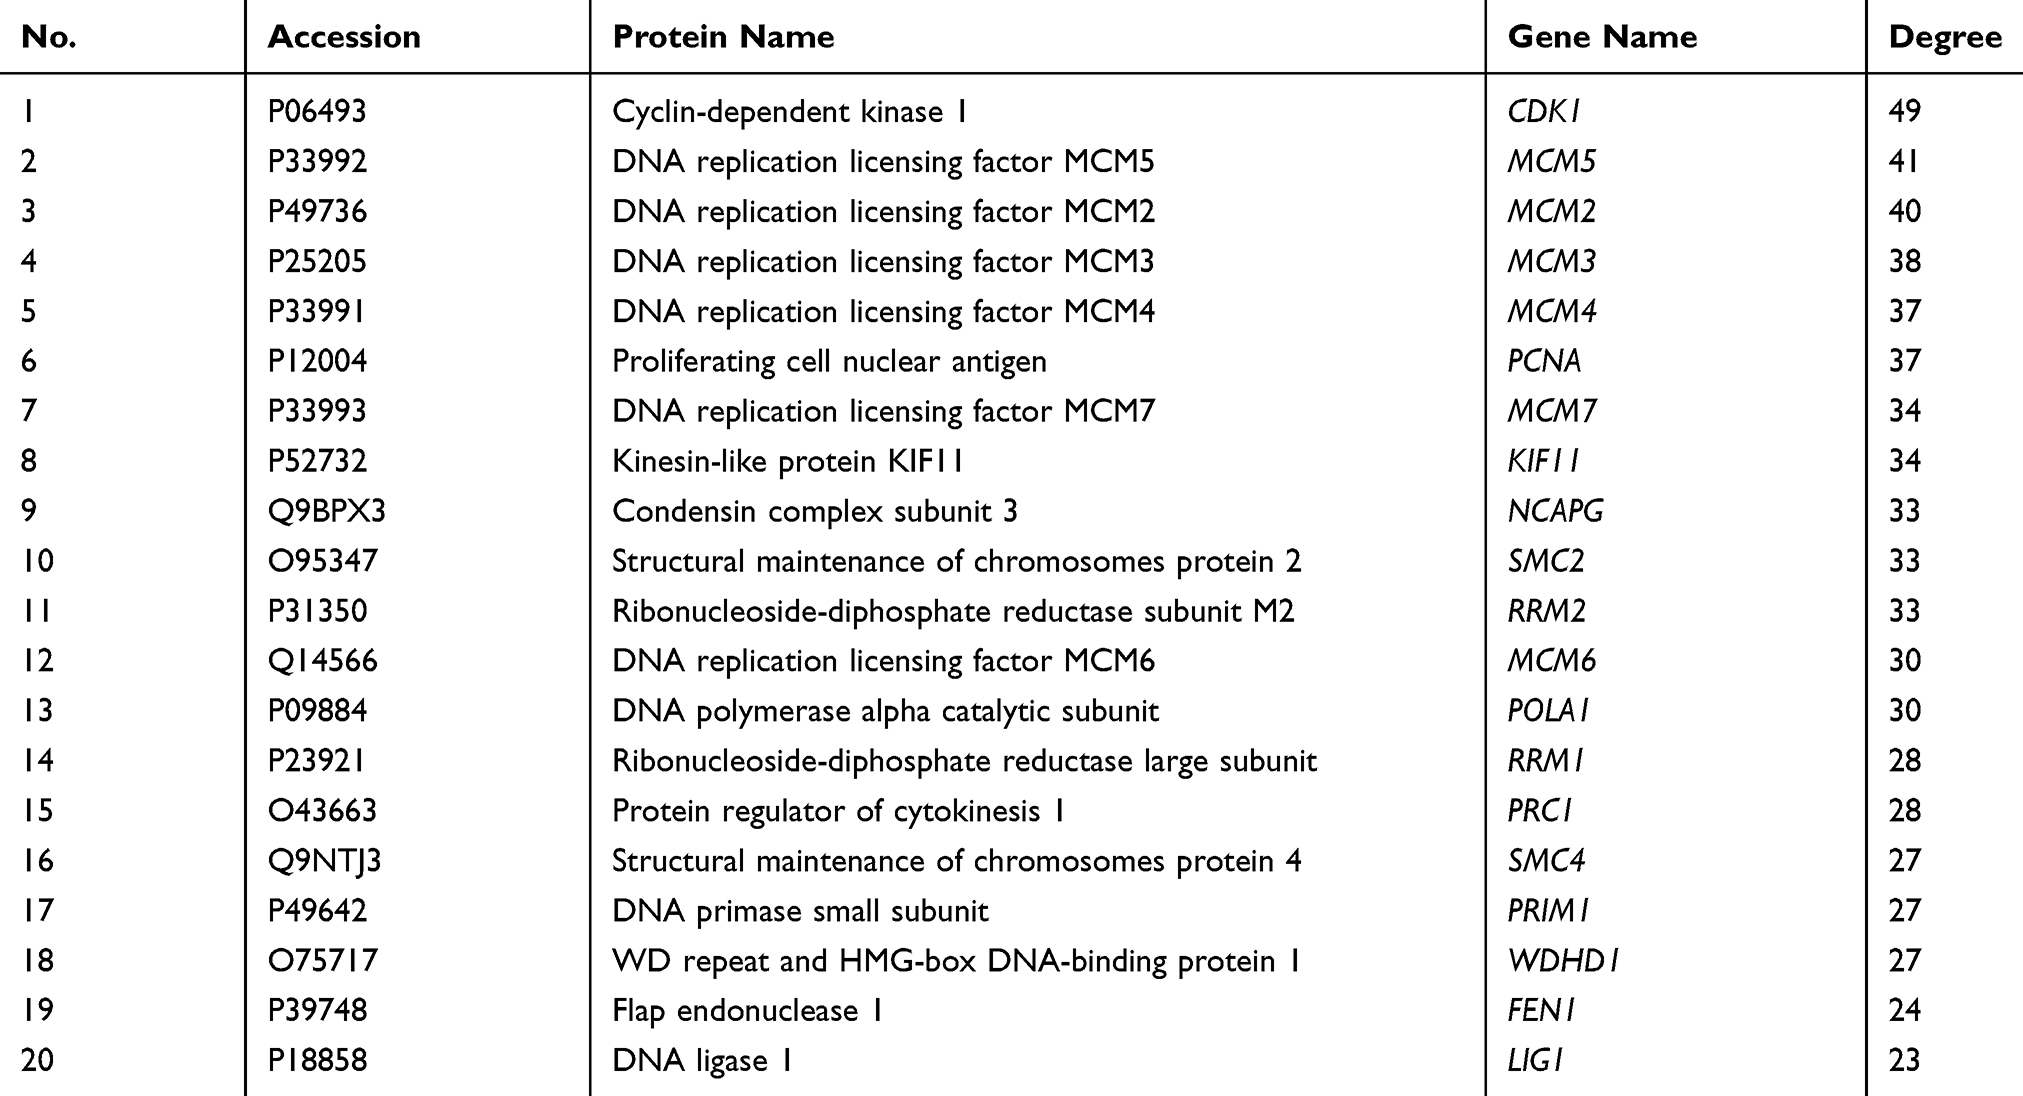 |
Table 10 The Top 20 Hub Proteins with the Highest Values of Degree |
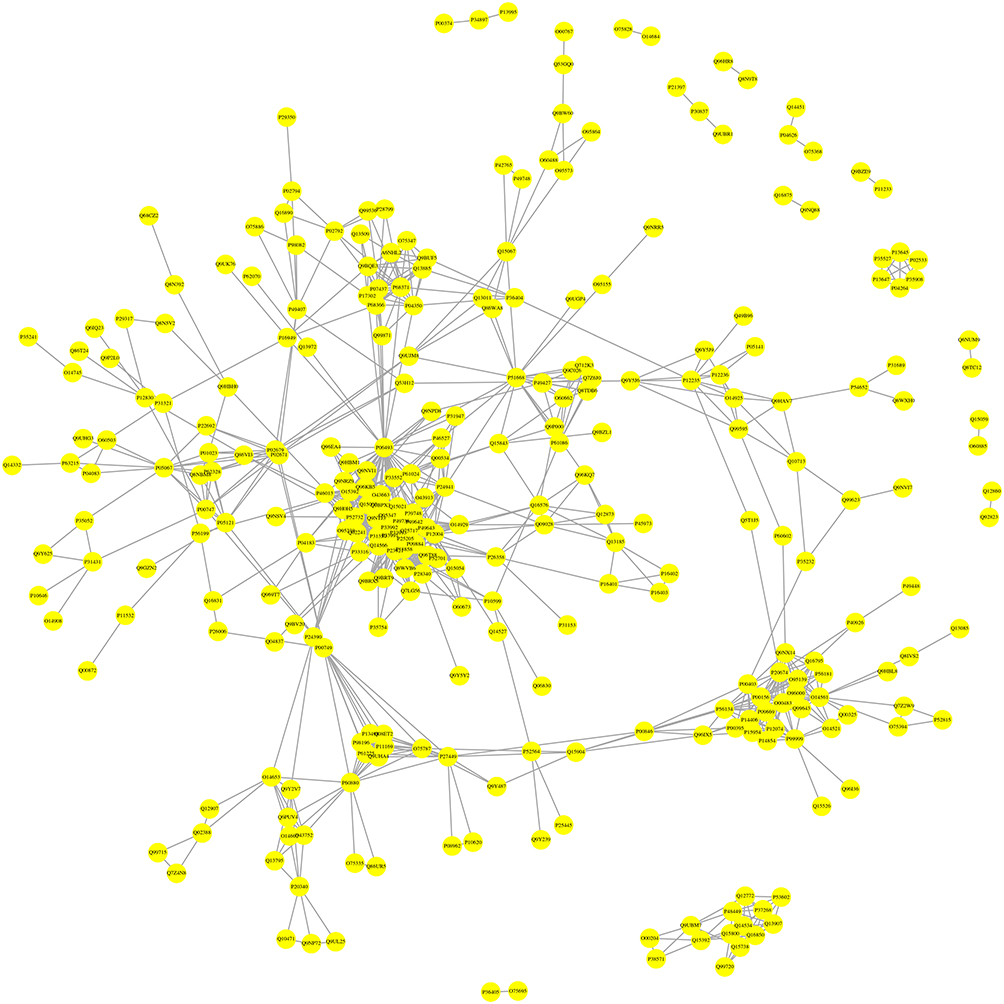 |
Figure 6 Protein–protein interaction network consisting of 499 DEPs. |
Western Blot Verification
According to the results of PPI network analysis, CDK1 (P06493) and MCM5 (P33992) were selected from the hub proteins, and their protein expression level was determined by Western Blot. Compared with the control group, the protein expression of CDK1 and MCM5 in the paclitaxel (10 μg/mL) treatment group were significantly down-regulated, as shown in Figure 7. The results of WB validation of the CDK1 and MCM5 were in accordance with the results of TMT proteomics.
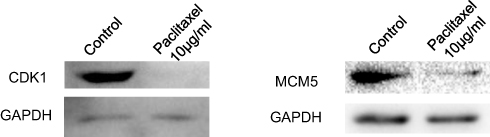 |
Figure 7 Western Blot Verification of CDK1 and MCM5. The protein expression of CDK1 and MCM5 were significantly down-regulated when A549 treated with 10μg/mL paclitaxel. |
Paclitaxel Significantly Up-Regulate Tubulins
Our results showed that the expression of tubulin TUBB6, TUBB, TUBA4A, TUBB2A in A549 cells treated with paclitaxel were significantly increased. And GO enrichment analysis showed that one of the main functions of these differentially expressed proteins was binding. This is consistent with previous reports that paclitaxel is a microtubule stabilizer that can bind to β-tubulin to stabilize microtubule polymers.20 In the study, these tubulins are involved in signaling pathways such as Gap Junction, Phagosome, Tight Junction, Apoptosis and Pathogenic Escherichia coli infection from the KEGG pathways analysis. The role of tubulins in these signaling pathways deserves further study.
Paclitaxel Inhibits DNA Replication
Pathway enrichment analysis showed that DNA Replication signaling was a major down-regulated pathway in A549 cells treated with paclitaxel. Nodes with a higher degree are hubs of the PPI network. Many of the hub proteins were enriched in DNA replication pathway, such as CDK1, MCM2-7, PLOA1, FEN1, LIG1, etc., and the expression levels of these hub proteins were all significantly down-regulated. And WB results showed that the protein expression of CDK1 and MCM5 in the paclitaxel group were significantly decreased. These findings suggest that paclitaxel may induce A549 cancer cell death by inhibiting DNA replication pathway. Figure 8 shows the details of the DNA replication pathway, where green is a significantly down-regulated protein and red is significantly up-regulated protein.
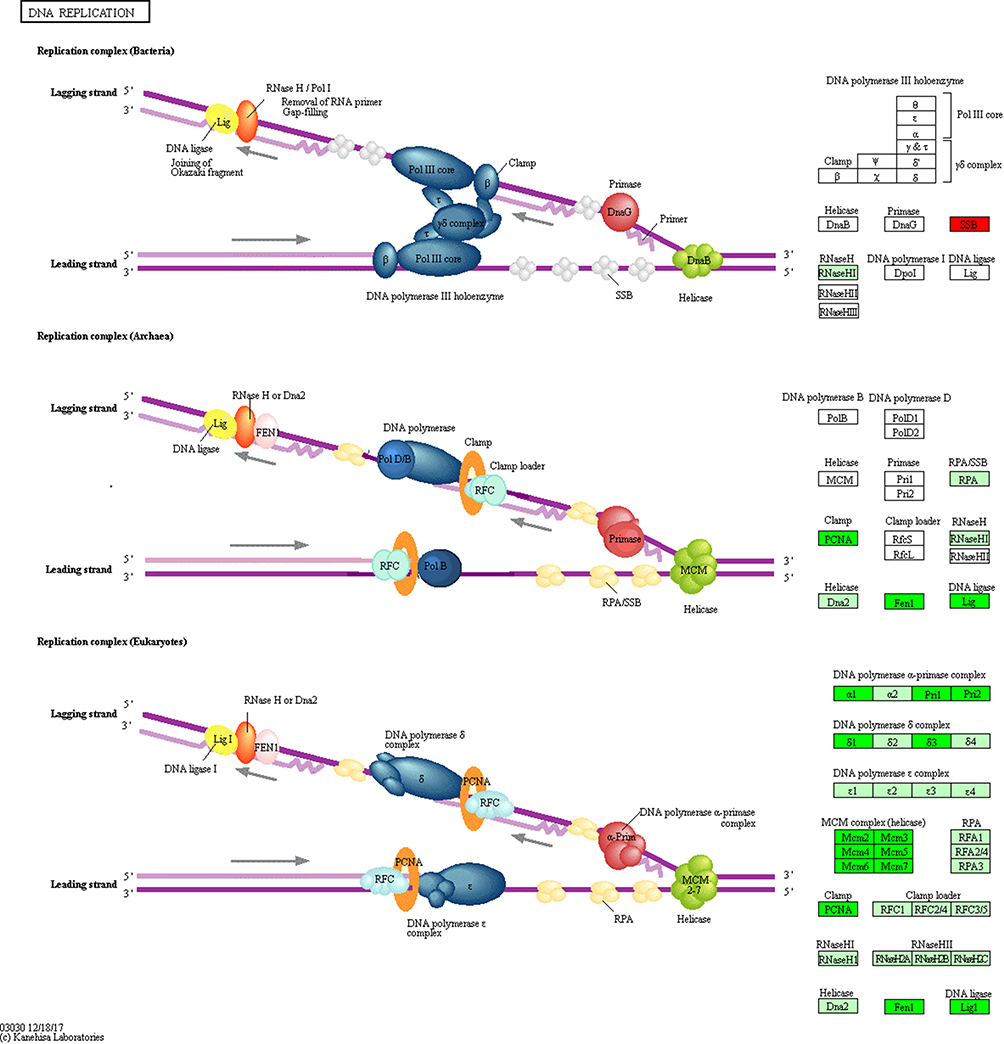 |
Figure 8 The DNA Replication Pathway from the KEGG Pathway hsa03030. Red box indicates up-regulation; green box indicates down-regulation; white indicates no significant change. The darker the color, the greater the statistical significance. |
Paclitaxel Inhibits A549 Cell Cycle
Regulating cell cycle distribution is an effective way to treat the proliferation of lung adenocarcinoma cells. The results demonstrated that paclitaxel significantly inhibited the expression of cell cycle proteins, CDK1,2,4,6, PCNA, Orc1-6, Mcm2-7, Kip1,2, Cyc A, Cyc B and Cyc D when compared with the controls (P<0.05). Paclitaxel significantly inhibited the cell cycle pathway of A549 cells, thereby contributing to anti-cancer effect. Figure 9 shows the details of the Cell Cycle pathway, where green is a significantly down-regulated protein and red is significantly up-regulated protein. All KEGG pathway figures from https://www.kegg.jp/kegg/.58
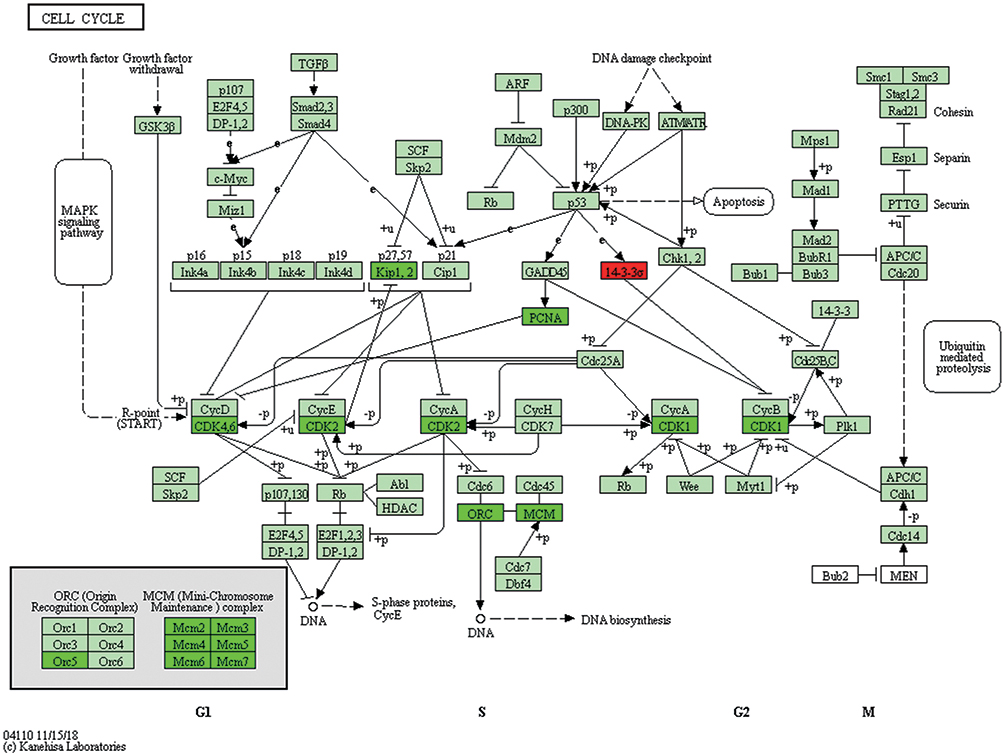 |
Figure 9 The Cell Cycle Pathway from the KEGG Pathway hsa04110. |
Discussion
Taken together, we applied TMT label-free quantitative proteomics approach to investigate the proteomic changes in A549 cells treated with paclitaxel, which led to the identification of 499 DEPs. Through bioinformatics analysis of these DEPs, revealed the molecular mechanism of paclitaxel in treating lung adenocarcinoma A549 cell and found several important proteins and pathways.
The microtubules are major components of the cytoskeleton, which are composed of α- and β-tubulin dimers. Microtubules are highly dynamic structures, and play essential roles in important biological processes such as sister chromatid separation, cell motility, cell migration, cell shape maintenance, intracellular transport and signal transduction.21,22 Paclitaxel is a tubulin stabilizer, which can bind to β-tubulin subunits of microtubules, enhance microtubules stability, inhibit microtubule dynamics, cause tumor cell growth stagnation in G2-M phase, and promote subsequent cell death.23–25 It is precisely because paclitaxel inhibits microtubule dynamics that in turn inhibits many of the above biological processes. In our study, the expression levels of these tubulins were significantly increased, such as TUBB6, TUBB, TUBA4A and TUBB2A. Combined with bioinformatics analysis, they participated in signaling pathways such as Gap Junction, Phagosome, Tight Junction, Apoptosis and Pathogenic Escherichia coli infection. Thus, tubulins and these pathways deserve further study in depth.
DNA replication is essential for cell proliferation, and several proteins involved in the pathway were inhibited. The minichromosome maintenance complex (MCM) family plays an important role in DNA replication. The MCM2-7 hexamer complex is the core of the replication helicase and is highly conserved.26,27 In G1-phase, MCM2-7 hexamer is loaded to the origin of DNA replication, forming a stable inactive dihexamer, which is an important part of the pre-replication complex (pre-RC).28,29 In eukaryotes, CDC45, the MCM2-7 helicase and GINS proteins form the CMG complex.30 The formation of CMG complex is promoted by phosphorylation of Dbf4-dependent protein kinase (DDK) and cyclin kinase (CDK), at the onset of S-phase.31 CMG is an active replication helicase that unwinds double-stranded DNA at the replication fork.32 The activated CMG uncouples the DNA double strand to facilitate loading of replication factors (such as DNA polymerase α/δ/ɛ).33 The MCM has the function of recruiting replication factors and can promote the replication forks.34,35 After DNA replication, the MCM2-7 complex gradually dissociated from chromatin to prevent DNA replication again.36
Cyclin-dependent kinase CDK1, an important player in the DNA replication pathway, was significantly down-regulated (Top 2) in our study. And CDK1 has the highest degree among the hub proteins in the PPI network. In different cell cycles, CDKs have different activities.37 In G1 phase, CDK is inactive, after entering S phase, CDK activity increases, and worked synergistically with DDK to activate the CMG complex.38 In eukaryotes, DNA replication starts simultaneously at multiple sites to accelerate large genome replication.39 CDK1 can promote the progress of DNA replication forks and prevent stagnation. Inhibition of CDK1 will cause the replication forks to stagnate or slowdown.40 Indeed, CDK1 is essential for DNA replication. So, it may be useful as a novel target of therapeutic modalities for lung adenocarcinoma.
After paclitaxel treatment, almost all proteins in the cell cycle pathway were inhibited. Some proteins are involved in both the DNA replication pathway and the cell cycle signaling pathway, such as CDKs, PCNA, MCM2-7, etc. CDKs are crucial for cell proliferation, and their activities regulate cell cycle. PCNA (Proliferating Cell Nuclear Antigen) is associated with tumor growth and progression.41 It is reported that DNA replication and cell cycle progression are coupled.42 Additionally, we speculated that there might be crosstalk between the DNA replication signaling and cell cycle signaling pathways.
TPCN1 (Two pore calcium channel protein 1) levels were significantly up-regulated after paclitaxel treatment in A549 cells. TPC (TPCN for gene name) is a member of the voltage-gated ion channel superfamily, which is located on the lysosome of the acidic organelle.43,44 There are three subtypes of TPC1, TPC2 and TPC3. Humans only express TPC1 and TPC2, forming Ca2+ channels in the form of dimers.45,46 In our study, TPCN1 was enriched in Calcium signaling pathway. TPC can regulate the whole or local intracellular Ca2+ concentration.43,47 Intracellular Ca2+ has been known to play critical roles in regulating tumorigenesis, cell proliferation, migration, and apoptosis.48–50 Several studies reported high expression of TPC1 in breast cancer, bladder cancer, and liver cancer, etc.51,52 When knocking down TPC1 or inhibiting TPC1 activity, it can inhibit cancer cell migration.53 Thus, TPCN1 may represent a molecular target for lung adenocarcinoma, and deserve future exploration.
After enrichment analysis, the oxidative phosphorylation pathway is significant. In this pathway, 113 proteins were significantly affected, of which 84 were down-regulated and 29 were up-regulated. In human cells, oxidative phosphorylation and glycolysis are the two primary metabolic pathways responsible for ATP production. Most cancer cells have been reported to obtain 70–90% of their ATP from oxidative phosphorylation, and the rest is produced by glycolysis.54,55 In breast cancer and liver cancer cells, graphene can inhibit migratory and invasion abilities by suppressing the oxidative phosphorylation pathway.56 However, PGC-1α activates mitochondrial oxidative phosphorylation to promote cell metastasis, in breast epithelial cancer cell 4T1.57 Taken together, we believe that the oxidative phosphorylation pathway plays an important role in the development of lung adenocarcinoma. However, whether paclitaxel can inhibit the oxidative phosphorylation pathway needs further verification. Oxidative phosphorylation is essential for all human cells. Unless specific cells can be targeted, it is not appropriate to inhibit oxidative phosphorylation pathway to treat cancer.
Conclusion
In this study, we combined TMT proteomics technology with bioinformatics to screen out the differential expression proteins from lung adenocarcinoma cell A549 treated with paclitaxel. These findings may provide useful pathways and key target proteins for the treatment of lung adenocarcinoma, and provide some basis for understanding the molecular mechanism of paclitaxel for lung adenocarcinoma.
In summary, paclitaxel promoted the death of lung adenocarcinoma cell A549 by the following points. First, tubulin TUBB, TUBB2A, TUBA4A, TUBB6 were significantly up-regulated. Paclitaxel, as a microtubule stabilizer, combined with tubulin to inhibit microtubule dynamics. Second, paclitaxel inhibited the DEPs in DNA replication pathway and the cell cycle pathway. In addition, these findings suggest that CDKs, MCMs and PCNA, etc., may be potential therapeutic targets of lung adenocarcinoma A549. These hub proteins and pathways effectively provide direction and ideas, which are worthy of further research and verification.
Acknowledgments
This research was supported by the National Natural Science Foundation of China (Grant No. U1304303), and the Research Nursery Project of Henan University of Traditional Chinese Medicine (MP2020-08). We also thank Shanghai Applied Protein Technology, Co. for providing technical support.
Disclosure
The authors report no conflicts of interest in this work.
References
1. Siegel RL, Miller KD, Jemal A. Cancer statistics, 2015. CA Cancer J Clin. 2015;65(1):5–29. doi:10.3322/caac.21254
2. Molina JR, Yang P, Cassivi SD, Schild SE, Adjei AA. Non-small cell lung cancer: epidemiology, risk factors, treatment, and survivorship. Mayo Clin Proc. 2008;83(5):584–594. doi:10.1016/S0025-6196(11)60735-0
3. Siegel RL, Miller KD, Jemal A. Cancer statistics, 2018. CA Cancer J Clin. 2018;68(1):7–30. doi:10.3322/caac.21442
4. Liu JJ, Ho JY, Lee HW, et al. Inhibition of Phosphatidylinositol 3-kinase (PI3K) signaling synergistically potentiates antitumor efficacy of paclitaxel and overcomes paclitaxel-mediated resistance in cervical cancer. Int J Mol Sci. 2019;20(14):3383. doi:10.3390/ijms20143383
5. Giordano G, Pancione M, Olivieri N, et al. Nano albumin bound-paclitaxel in pancreatic cancer: current evidences and future directions. World J Gastroenterol. 2017;23(32):5875–5886. doi:10.3748/wjg.v23.i32.5875
6. Socinski MA. Update on taxanes in the first-line treatment of advanced non-small-cell lung cancer. Curr Oncol. 2014;21(5):e691–e703. doi:10.3747/co.21.1997
7. Thompson A, Schafer J, Kuhn K, et al. Tandem mass tags: a novel quantification strategy for comparative analysis of complex protein mixtures by MS/MS. Anal Chem. 2003;75(8):1895–1904. doi:10.1021/ac0262560
8. Ross PL, Huang YLN, Marchese JN, et al. Multiplexed protein quantitation in Saccharomyces cerevisiae using amine-reactive isobaric tagging reagents. Mol Cell Proteomics. 2004;3(12):1154–1169. doi:10.1074/mcp.M400129-MCP200
9. Li W, Zhao F, Fang W, et al. Identification of early salt stress responsive proteins in seedling roots of upland cotton (Gossypium hirsutum L.) employing iTRAQ-based proteomic technique. Front Plant Sci. 2015;6:732. doi:10.3389/fpls.2015.00732
10. Zhao Q, Chen W, Bian J, et al. Proteomics and phosphoproteomics of heat stress-responsive mechanisms in Spinach. Front Plant Sci. 2018;9:800. doi:10.3389/fpls.2018.00800
11. Zou M, Wang J, Gao J, Han H, Fang Y. Phosphoproteomic analysis of the antitumor effects of ginsenoside Rg3 in human breast cancer cells. Oncol Lett. 2018;15(3):2889–2898. doi:10.3892/ol.2017.7654
12. Gao W, Xu J, Wang F, et al. Plasma membrane proteomic analysis of human gastric cancer tissues: revealing flotillin 1 as a marker for gastric cancer. Bmc Cancer. 2015;15. doi:10.1186/s12885-015-1343-5
13. Buczak K, Ori A, Kirkpatrick JM, et al. Spatial tissue proteomics quantifies inter- and intratumor heterogeneity in Hepatocellular Carcinoma (HCC). Mol Cell Proteomics. 2018;17(4):810–825. doi:10.1074/mcp.RA117.000189
14. Huang FK, Zhang G, Lawlor K, et al. Deep coverage of global protein expression and phosphorylation in breast tumor cell lines using TMT 10-plex isobaric labeling. J Proteome Res. 2017;16(3):1121–1132. doi:10.1021/acs.jproteome.6b00374
15. Wisniewski JR, Zougman A, Nagaraj N, Mann M. Universal sample preparation method for proteome analysis. Nat Methods. 2009;6(5):359–U360. doi:10.1038/nmeth.1322
16. Götz S, García-Gómez JM, Terol J, et al. High-throughput functional annotation and data mining with the Blast2GO suite. Nucleic Acids Res. 2008;36(10):3420–3435. doi:10.1093/nar/gkn176
17. Quevillon E, Silventoinen V, Pillai S, et al. InterProScan: protein domains identifier. Nucleic Acids Res. 2005;33(Web Server issue):W116–W120. doi:10.1093/nar/gki442
18. Moriya Y, Itoh M, Okuda S, Yoshizawa AC, Kanehisa M. KAAS: an automatic genome annotation and pathway reconstruction server. Nucleic Acids Res. 2007;35(Web Server issue):W182–W185. doi:10.1093/nar/gkm321
19. Szklarczyk D, Franceschini A, Wyder S, et al. STRING v10: protein-protein interaction networks, integrated over the tree of life. Nucleic Acids Res. 2015;43(Database issue):D447–D452. doi:10.1093/nar/gku1003
20. Xiao H, Verdier-Pinard P, Fernandez-Fuentes N, et al. Insights into the mechanism of microtubule stabilization by Taxol. Proc Natl Acad Sci U S A. 2006;103(27):10166–10173. doi:10.1073/pnas.0603704103
21. Carbonaro M, O’Brate A, Giannakakou P. Microtubule disruption targets HIF-1alpha mRNA to cytoplasmic P-bodies for translational repression. J Cell Biol. 2011;192(1):83–99. doi:10.1083/jcb.201004145
22. Dumontet C, Jordan MA. Microtubule-binding agents: a dynamic field of cancer therapeutics. Nat Rev Drug Discov. 2010;9(10):790–803.
23. Rao S, Horwitz SB, Ringel I. Direct photoaffinity labeling of tubulin with taxol. J Natl Cancer Inst. 1992;84(10):785–788. doi:10.1093/jnci/84.10.785
24. Yvon AM, Wadsworth P, Jordan MA. Taxol suppresses dynamics of individual microtubules in living human tumor cells. Mol Biol Cell. 1999;10(4):947–959. doi:10.1091/mbc.10.4.947
25. Steinmetz MO, Prota AE. Microtubule-targeting agents: strategies to hijack the cytoskeleton. Trends Cell Biol. 2018;28(10):776–792. doi:10.1016/j.tcb.2018.05.001
26. O’Donnell M, Langston L, Stillman B. Principles and concepts of DNA replication in bacteria, archaea, and eukarya. Cold Spring Harb Perspect Biol. 2013;5:7.
27. Costa A, Ilves I, Tamberg N, et al. The structural basis for MCM2-7 helicase activation by GINS and Cdc45. Nat Struct Mol Biol. 2011;18(4):471–477. doi:10.1038/nsmb.2004
28. Bell SP, Kaguni JM. Helicase loading at chromosomal origins of replication. Cold Spring Harb Perspect Biol. 2013;5(6):a010124. Published 2013 Jun 1. doi:10.1101/cshperspect.a010124
29. Evrin C, Clarke P, Zech J, et al. A double-hexameric MCM2-7 complex is loaded onto origin DNA during licensing of eukaryotic DNA replication. Proc Natl Acad Sci U S A. 2009;106(48):20240–20245. doi:10.1073/pnas.0911500106
30. Simon AC, Sannino V, Costanzo V, Pellegrini L. Structure of human Cdc45 and implications for CMG helicase function. Nat Commun. 2016;7. doi:10.1038/ncomms11638
31. Riera A, Barbon M, Noguchi Y, Reuter LM, Schneider S, Speck C. From structure to mechanism-understanding initiation of DNA replication. Genes Dev. 2017;31(11):1073–1088. doi:10.1101/gad.298232.117
32. Ilves I, Petojevic T, Pesavento JJ, Botchan MR. Activation of the MCM2-7 helicase by association with Cdc45 and GINS Proteins. Mol Cell. 2010;37(2):247–258. doi:10.1016/j.molcel.2009.12.030
33. Bochman ML, Schwacha A. The Mcm complex: unwinding the mechanism of a replicative helicase. Microbiol Mol Biol Rev. 2009;73(4):652–683. doi:10.1128/MMBR.00019-09
34. Costa A, Onesti S. The MCM complex: (just) a replicative helicase? Biochem Soc Trans. 2008;36:136–140. doi:10.1042/BST0360136
35. Heller RC, Kang S, Lam WM, Chen S, Chan CS, Bell SP. Eukaryotic origin-dependent DNA replication in vitro reveals sequential action of DDK and S-CDK kinases. Cell. 2011;146(1):80–91. doi:10.1016/j.cell.2011.06.012
36. Kuipers MA, Stasevich TJ, Sasaki T, et al. Highly stable loading of Mcm proteins onto chromatin in living cells requires replication to unload. J Cell Biol. 2011;192(1):29–41. doi:10.1083/jcb.201007111
37. Arias EE, Walter JC. Strength in numbers: preventing rereplication via multiple mechanisms in eukaryotic cells. Genes Dev. 2007;21(5):497–518. doi:10.1101/gad.1508907
38. Diffley JFX. Regulation of early events in chromosome replication. Curr Biol. 2004;14(18):R778–R786. doi:10.1016/j.cub.2004.09.019
39. Reusswig K-U, Pfander B. Control of eukaryotic DNA replication initiation-mechanisms to ensure smooth transitions. Genes. 2019;10(2). doi:10.3390/genes10020099
40. Liao H, Ji F, Geng X, et al. CDK1 promotes nascent DNA synthesis and induces resistance of cancer cells to DNA-damaging therapeutic agents. Oncotarget. 2017;8(53):90662–90673. doi:10.18632/oncotarget.21730
41. Wang Y, Chen T, Huang H, et al. miR-363-3p inhibits tumor growth by targeting PCNA in lung adenocarcinoma. Oncotarget. 2017;8(12):20133–20144. doi:10.18632/oncotarget.15448
42. Kelly TJ, Nurse P, Forsburg SL. Coupling DNA replication to the cell cycle. Cold Spring Harb Symp Quant Biol. 1993;58:637–644. doi:10.1101/SQB.1993.058.01.071
43. Patel S. Function and dysfunction of two-pore channels. Sci Signal. 2015;8(384):384. doi:10.1126/scisignal.aab3314
44. Patel S, Ramakrishnan L, Rahman T, et al. The endo-lysosomal system as an NAADP-sensitive acidic Ca2+ store: role for the two-pore channels. Cell Calcium. 2011;50(2):157–167. doi:10.1016/j.ceca.2011.03.011
45. Galione A, Morgan AJ, Arredouani A, et al. NAADP as an intracellular messenger regulating lysosomal calcium-release channels. Biochem Soc Trans. 2010;38:1424–1431. doi:10.1042/BST0381424
46. Zhu MX, Ma J, Parrington J, Calcraft PJ, Galione A, Evans AM. Calcium signaling via two-pore channels: local or global, that is the question. Am J Physiol Cell Physiol. 2010;298(3):C430–C441. doi:10.1152/ajpcell.00475.2009
47. Grimm C, Butz E, Chen -C-C, Wahl-Schott C, Biel M. From mucolipidosis type IV to Ebola: TRPML and two-pore channels at the crossroads of endo-lysosomal trafficking and disease. Cell Calcium. 2017;67:148–155. doi:10.1016/j.ceca.2017.04.003
48. Déliot N, Constantin B. Plasma membrane calcium channels in cancer: Alterations and consequences for cell proliferation and migration. Biochim Biophys Acta. 2015;1848(10 Pt B):2512–2522. doi:10.1016/j.bbamem.2015.06.009
49. Monteith GR, McAndrew D, Faddy HM, Roberts-Thomson SJ. Calcium and cancer: targeting Ca2+ transport. Nat Rev Cancer. 2007;7(7):519–530. doi:10.1038/nrc2171
50. Schultze-Mosgau A, Katzur AC, Arora KK, Stojilkovic SS, Diedrich K, Ortmann O. Characterization of calcium-mobilizing, purinergic P2Y (2) receptors in human ovarian cancer cells. Mol Hum Reprod. 2000;6(5):435–442. doi:10.1093/molehr/6.5.435
51. Brailoiu E, Churamani D, Cai X, et al. Essential requirement for two-pore channel 1 in NAADP-mediated calcium signaling. J Cell Biol. 2009;186(2):201–209. doi:10.1083/jcb.200904073
52. Ong Nam Phuong N, Grimm C, Schneider LS, et al. Two-pore channel function is crucial for the migration of invasive cancer cells. Cancer Res. 2017;77(6):1427–1438. doi:10.1158/0008-5472.CAN-16-0852
53. Grimm C, Bartel K, Vollmar AM, Biel M. Endolysosomal cation channels and cancer-A link with great potential. Pharmaceuticals (Basel). 2018;11(1):4. doi:10.3390/ph11010004
54. Zu XL, Guppy M. Cancer metabolism: facts, fantasy, and fiction. Biochem Biophys Res Commun. 2004;313(3):459–465. doi:10.1016/j.bbrc.2003.11.136
55. Cairns RA, Harris IS, Mak TW. Regulation of cancer cell metabolism. Nat Rev Cancer. 2011;11(2):85–95. doi:10.1038/nrc2981
56. Zhou H, Zhang B, Zheng J, et al. The inhibition of migration and invasion of cancer cells by graphene via the impairment of mitochondrial respiration. Biomaterials. 2014;35(5):1597–1607. doi:10.1016/j.biomaterials.2013.11.020
57. LeBleu VS, O’Connell JT, Herrera KNG, et al. PGC-l alpha mediates mitochondrial biogenesis and oxidative phosphorylation in cancer cells to promote metastasis. Nat Cell Biol. 2014;16(10):992–1003. doi:10.1038/ncb3039
58. Kanehisa M, Goto S. KEGG: kyoto encyclopedia of genes and genomes. Nucleic Acids Res. 2000;28(1):27–30. doi:10.1093/nar/28.1.27
 © 2020 The Author(s). This work is published and licensed by Dove Medical Press Limited. The
full terms of this license are available at https://www.dovepress.com/terms
and incorporate the Creative Commons Attribution
- Non Commercial (unported, 3.0) License.
By accessing the work you hereby accept the Terms. Non-commercial uses of the work are permitted
without any further permission from Dove Medical Press Limited, provided the work is properly
attributed. For permission for commercial use of this work, please see paragraphs 4.2 and 5 of our Terms.
© 2020 The Author(s). This work is published and licensed by Dove Medical Press Limited. The
full terms of this license are available at https://www.dovepress.com/terms
and incorporate the Creative Commons Attribution
- Non Commercial (unported, 3.0) License.
By accessing the work you hereby accept the Terms. Non-commercial uses of the work are permitted
without any further permission from Dove Medical Press Limited, provided the work is properly
attributed. For permission for commercial use of this work, please see paragraphs 4.2 and 5 of our Terms.