Back to Journals » International Journal of Nanomedicine » Volume 16
Analysis of Amount, Size, Protein Phenotype and Molecular Content of Circulating Extracellular Vesicles Identifies New Biomarkers in Multiple Myeloma
Authors Laurenzana I, Trino S, Lamorte D, Girasole M, Dinarelli S, De Stradis A, Grieco V ![]() , Maietti M, Traficante A, Statuto T
, Maietti M, Traficante A, Statuto T ![]() , Villani O, Musto P, Sgambato A, De Luca L, Caivano A
, Villani O, Musto P, Sgambato A, De Luca L, Caivano A
Received 25 January 2021
Accepted for publication 11 March 2021
Published 7 May 2021 Volume 2021:16 Pages 3141—3160
DOI https://doi.org/10.2147/IJN.S303391
Checked for plagiarism Yes
Review by Single anonymous peer review
Peer reviewer comments 3
Editor who approved publication: Dr Thomas Webster
Ilaria Laurenzana,1,* Stefania Trino,1,* Daniela Lamorte,1 Marco Girasole,2 Simone Dinarelli,2 Angelo De Stradis,3 Vitina Grieco,4 Maddalena Maietti,5 Antonio Traficante,5 Teodora Statuto,4 Oreste Villani,6 Pellegrino Musto,6 Alessandro Sgambato,7 Luciana De Luca,4,* Antonella Caivano4,*
1Laboratory of Preclinical and Translational Research, Centro di Riferimento Oncologico della Basilicata (IRCCS-CROB), Rionero in Vulture, PZ, Italy; 2Institute for the Study of the Structure of Matter, National Research Council (CNR), Rome, Italy; 3Institute for Sustainable Plant Protection, National Research Council (CNR), Bari, Italy; 4Laboratory of Clinical Research and Advanced Diagnostics, Centro di Riferimento Oncologico della Basilicata (IRCCS-CROB), Rionero in Vulture, PZ, Italy; 5Unit of Clinical Pathology, Centro di Riferimento Oncologico della Basilicata (IRCCS-CROB), Rionero in Vulture, PZ, Italy; 6Hematology and Stem Cell Transplantation Unit, Centro di Riferimento Oncologico della Basilicata (IRCCS-CROB), Rionero in Vulture, PZ, Italy; 7Scientific Direction, Centro di Riferimento Oncologico della Basilicata (IRCCS-CROB), Rionero in Vulture, PZ, Italy
*These authors contributed equally to this work
Correspondence: Antonella Caivano
Laboratory of Clinical Research and Advanced Diagnostics, IRCCS CROB, Rionero in Vulture, 85028, Potenza, Italy
Tel +39 0972 726395
Fax +39 0972 726482
Email [email protected]
Introduction: Extracellular vesicles (EVs) are naturally secreted cellular lipid bilayer particles, which carry a selected molecular content. Owing to their systemic availability and their role in tumor pathogenesis, circulating EVs (cEVs) can be a valuable source of new biomarkers useful for tumor diagnosis, prognostication and monitoring. However, a precise approach for isolation and characterization of cEVs as tumor biomarkers, exportable in a clinical setting, has not been conclusively established.
Methods: We developed a novel and laboratory-made procedure based on a bench centrifuge step which allows the isolation of serum cEVs suitable for subsequent characterization of their size, amount and phenotype by nanoparticle tracking analysis, microscopy and flow cytometry, and for nucleic acid assessment by digital PCR.
Results: Applied to blood from healthy subjects (HSs) and tumor patients, our approach permitted from a small volume of serum (i) the isolation of a great amount of EVs enriched in small vesicles free from protein contaminants; (ii) a suitable and specific cell origin identification of EVs, and (iii) nucleic acid content assessment. In clonal plasma cell malignancy, like multiple myeloma (MM), our approach allowed us to identify specific MM EVs, and to characterize their size, concentration and microRNA content allowing significant discrimination between MM and HSs. Finally, EV associated biomarkers correlated with MM clinical parameters.
Conclusion: Overall, our cEV based procedure can play an important role in malignancy biomarker discovery and then in real-time tumor monitoring using minimal invasive samples. From a practical point of view, it is smart (small sample volume), rapid (two hours), easy (no specific expertise required) and requirements are widely available in clinical laboratories.
Keywords: extracellular vesicles, biomarkers, hematological malignancies, nanoparticle tracking analysis, flow cytometry, digital PCR
Introduction
The field of cancer diagnostics, prognostication and monitoring has been recently impacted by new and exciting developments in the area of “liquid biopsy”.1,2 This novel approach analyzes circulating tumor cells and molecules (ie nucleic acids and proteins) that are secreted both from primary tumor and metastatic sites, thus indirectly and putatively providing a comprehensive information about different neoplastic disorders in single patients.3,4
In this context, extracellular vesicles (EVs) are lipid bilayer particles released by normal and neoplastic cells, that have been identified in different body fluids in addition to blood (eg saliva, urine, cerebrospinal fluid and breast milk) and have been reported to increase in patients with various types of tumors, including hematological malignancies (HMs).5–8 EVs may be small (sEVs; ~30–200 nm) or medium/large (m/lEVs; ~200–10,000 nm).9 They carry a selected cargo in terms of lipids, proteins and nucleic acids, and show specific surface antigens deriving from their parental cells.10,11
Notably, the EV lipid bilayer protects their molecular content from degradation of proteases and nucleases, thus providing well defined genetic/protein/lipid signatures associated with specific phenotypes.7 We and others have previously reported that the amount of circulating EVs (cEVs), expressing specific tumor antigens and microRNA in HM patients, correlates with clinical parameters and plays a prognostic role.5,10,12–14 Furthermore, HM EVs, including those derived from bone marrow (BM) microenvironment, mediate important biological activities, ie differentiation and homing of hematopoietic stem cells, transforming capacity, immune system responses and even therapeutic ability in the field of allogeneic transplantation.7,8,15–17 Thanks to their peculiar physical and biological characteristics, EVs in biofluids may be considered a true circulating “cell biopsy”, making them attractive as a new possible biomarker, as well as a potential therapeutic target in tumors.7
From a practical point of view, numerous protocols for cEV isolation are available, and most of them are based on the use of differential ultracentrifugation.18,19 Unfortunately, their implementation in clinical practice has been restricted, in part due to volume requirements, labor-intensive work-up, low reproducibility and finally to the methodology that is not usually met in basic clinical laboratories.18 Therefore, there is an urgent need to develop an EV enrichment method that overcomes the abovementioned limitations in order to facilitate the translation of research findings into the clinic.
Concerning EV characterization, in terms of size, amount, quality, and phenotype, different methods such as nanoparticle tracking analysis (NTA), atomic force (AFM) and transmission electron (TEM) microscopes and flow cytometry (FC) are usually applied depending on the type of information looked for.9,20,21 As for EV nucleic acid profiling, it is commonly determined by RT-qPCR or, increasingly, by next-generation techniques, eg next generation sequencing (NGS) and digital PCR.22–25
Here we provide a new simple and easy procedure to isolate lipoprotein free serum cEVs using a single centrifugation step suitable for subsequent EV characterization in terms of size, amount, phenotype and molecular content with particular attention to DNA and small RNA (Figure 1). Our procedure could be easily reproduced and employed in different contexts, including cancer patients. Therefore, we investigated its applicability in the multiple myeloma (MM) setting to demonstrate the potential clinical utility of EVs in the management of MM patients. MM is the second most frequent hematological neoplasm characterized by a clonal proliferation of plasma cells (PCs) in the BM.26 It is characterized by a clinical and biological heterogeneity that leads to variable responses to treatments and outcomes. Despite relevant therapeutic progresses during the last years, it remains today mostly incurable leading to a median survival of 5–7 years.26
 |
Figure 1 Workflow for isolation and characterization of serum circulating extracellular vesicles. |
The study was conceived to demonstrate the feasibility/employment of serum cEVs as a source of tumor biomarkers using simple, fast and sensitive procedures that can be complemented, when needed, by other in-depth analyses.
Materials and Methods
Serum Samples and MM Cell Line
Blood samples were obtained from 10 newly diagnosed MM patients and from 20 healthy subjects (HSs), matched for age, gender and lifestyle. Main clinical characteristics of all samples were reported in Table 1. Written informed consent was obtained from all subjects.
 |
Table 1 Main Clinical Information of Healthy and MM Subjects |
In order to obtain serum, 3 mL of peripheral blood (PB), drawn into Vacutainer SST II Advance tubes (Becton Dickinson, BD, Franklin, NJ, USA), were centrifuged at 974×g at room temperature for 10 min in centrifuge 5810 R (Eppendorf, Hamburg, Germany). Aliquots of 500 µL of serum were stored at −80°C until use. All blood draws were fasting and were processed within two hours.
Human MM cell line, RPMI-8226, was purchased from American Type Culture Collection (Rockville, MD, USA). Cells were cultured in RPMI 1640 medium (Gibco, Life Technologies, Carlsbad, CA, USA) supplemented with 10% FBS (Gibco), 1% of penicillin-streptomycin (Gibco) at 37°C and 5% CO2.
EV Isolation from Serum and Cell Culture Medium
For cEV isolation, 500 µL of serum were thawed at room temperature and transferred in a 1.5 mL tube. All samples were centrifuged at 200×g for five minutes at 4°C in a bench centrifuge (MicroCL 21R centrifuge, Thermo Scientific, Wilmington, DE, USA).
Supernatants were carefully aspirated off without disturbing pellets, transferred in new 1.5 mL tubes and centrifuged at 14,300×g for one hour at 4°C in a bench centrifuge. Supernatant was discarded and pellet was washed with 1 mL of 0.22 µm filtered Dulbecco’s PBS without calcium and magnesium salts (Gibco). After washing, EV pellets were resuspended in 500 µL of 0.02 µm filtered PBS and stored at −80°C until use.
To obtain cell line derived EVs, 40×106 cells were cultured at a density of 1.2×10⁶ cells/mL of RPMI 1640 medium without FBS for 48 h. Supernatant was collected for next analysis and EVs were obtained with bench centrifuge as reported above. EV pellet was washed with 0.2 µm filtered PBS and resuspended in 300 µL of 0.02 µm filtered PBS.
Nanoparticle Tracking Analysis
Size and concentration of EVs were defined using NanoSight NS300 (Malvern Panalytical Ltd, UK). Samples were diluted 1:6 in PBS in a final volume of 400 µL. Camera level and syringe pump flow were set to 15 and 50, respectively. Five repeat captures, each of 60 seconds, were acquired at controlled temperature of 26°C.
Detection threshold was set to four to reduce noise. Data were processed using NTA 3.2 software (Malvern Panalytical Ltd). D10 and D90 values, mode, mean and concentration were reported. D10 and D90 serve to identify the size range in which most of the particles are found and to weight the presence, proportion and importance of outsider particle sizes. Mode value indicates size of the highest amount of particles measured in the middle of D10 and D90 range.
Atomic Force Microscopy
Ten microliters of EV dilution (1:100) were deposited onto freshly cleaved mica and let dry for at least 12 h under a laminar flow hood. The employed AFM microscope has been designed in house and customized for an optimal analysis of biosystems.27 AFM measurements were performed in air, at room temperature and controlled (<30%) relative humidity.28 Measurements, in agreement with previously performed experiments13 were performed in contact mode, with probe force smaller than 1 nN from zero cantilever deflection, using silicon nitride Veeco MSCT probes (Camarillo, CA, USA) with a thermally calibrated elastic constant of 0.022±0.002 N/m. High resolution images were collected at a scanning speed ranging from three and four seconds/row and, typically, with a number of points corresponding to pixel size of five nanometers.
The AFM analysis has been performed by subtracting a background plane from the topography image, followed by a X and Y linearization to compensate the scanner-induced deformation. The particles have subsequently been mapped using the “mark by threshold” function in the slope+edge modality of the Gwyddion software package. The equivalent radius, ie the radius of the corresponding circle projected on the ground plane, for each vesicle has been collected and the resulting histograms (bin size=two nanometers) were fitted with Gaussian curves in order to identify the composing populations (in terms of mean value and standard deviation). Results have been used for comparison in the pie chart reported in the result section. Overall, more than 4000 vesicles from healthy individuals and 2400 from pathological subjects have been measured.
Transmission Electron Microscopy
Twenty microliters of EV sample suspension were applied to a Pioloform coated Nickel grid (200 mesh; TAAB Laboratories Equipment Ltd, Aldermaston, UK). The coated grid was floated for two minutes on the sample drop and rinsed on a 20 µL double distilled water drop. Negative staining was performed with 200 µL of 2% w/v uranyl acetate solution (TAAB Laboratories Equipment Ltd). After draining off the excess of staining solution by means of a filter paper, the specimen was transferred for examination in a Philips Morgagni 282D TEM, operating at 60 kV. Electron micrographs of negatively stained samples were photographed on Kodak electron microscope film 4489 (Kodak Company, Rochester, NY, USA).
Quantification of Proteins, Lipoproteins and Apolipoproteins in EVs
All measurements were performed on 500 µL of serum, EV pellet and its supernatant. Total proteins and albumin were measured by colorimetric assay using Total Protein and Albumin reagent kits (Beckman Coulter, Brea, CA, USA). Low density lipoproteins (LDL), high density lipoproteins (HDL) and triglycerides (TG) were measured by enzymatic assay using LDL-cholesterol, HDL-cholesterol and TG reagent Kits (Beckman Coulter).
The amount of very low density lipoproteins (VLDL) was obtained by the formula TG amount/5.29,30 Apo A1 and Apo B lipoproteins were measured by immune-turbidimetric test using Apo A1 and Apo B reagent kits (Beckman Coulter). All these analyses were conducted on the automatic analyzer AU680 (Beckman Coulter).
Flow Cytometric Analysis of EV Samples
EV samples were analyzed on FACS CANTO II using DIVA software (BD Biosciences, San Jose, CA, USA).
FC was abundantly washed for 15 min with clean, rinse solution and distilled water. Only when a flow rate of <50 events/second for PBS was registered, the FC was considered ready for analysis. Standard sheath fluid without further filtration was used in all measurements.
A mix of nanofluorescent particle beads (0.13 µm) and nanopolystyrene size standard kit (0.22, 0.45, 0.88 and 1.35 µm; Spherotech, IL, USA) was used to set up voltages for physical parameters forward scatter (FSC) and side scatter (SSC). All parameters, including FSC and SSC, were set up in logarithmic scale and height (H) parameter. Threshold was set on SSC and samples were acquired at low flow rate. To better identify the exact gates, Spherotech beads were visualized on a V500-H/SSC dot plot. Before each analysis, FC was properly washed, as previously reported.
Five microliters of EV samples were labeled with 40 µM of 5-carboxyfluorescein diacetate-succinimidyl ester (CFDA-SE, Sigma-Aldrich) in a reaction volume of 20 µL for 30 min at 37°C. CFDA-SE is a nonfluorescent molecule which when is hydrolyzed by intravesicular esterases, becomes the membrane not permeable fluorescent carboxyfluorescein-succinimidyl ester (CFSE).
After incubation, 3 µL of CFDA-SE labeled-EV samples were incubated with 100 ng of different conjugated antibodies for specific surface markers and their respective controls for 40 min at 37°C in a reaction volume of 30 µL.
Specifically, allophycocyanin (APC) anti-CD9 (clone M-L13, BD), APC anti-CD19 (clone SJ25C1, BD), phycoerythrin (PE) anti-CD20 (clone L27, BD), APC anti-CD38 (clone HB-7, BD), APC anti-CD45 (clone 2D1, BD), PE anti-CD138 (clone MI15, BD) and APC anti-CD235a (clone GA-R2 HIR2, BD) were used.
After labeling, 3 µL of EV samples were transferred in TruCount tubes (BD) containing 400 µL of 0.02 µm filtered PBS. A total of 50,000 events were immediately acquired in low flow rate.
EV concentration (EVs/mL) was calculated with the formula EVs/mL=GEV/GTC*TC/V* DF (GEV=number of events in CFSE+EV gate, GTC=number of events in TruCount bead gate, TC=number of TruCount beads in single TruCount tube, V=sample volume used in the analysis, DF=sample dilution factor). To calculate EVs positive for specific antibody (ie CD38, CD138, CD38/CD138), we referred to the GEV value, GEV=number of events in their specific dot plot quadrant.
Flow Cytometric Analysis of MM Cell Line
Surface marker expression was evaluated on RPMI-8226 cell line by cytometric analysis. In brief, after harvest, 100,000 cells were washed with PBS and incubated with PE anti-CD20 (clone L27, BD), APC anti-CD19 (clone SJ25C1, BD), PE anti-CD138 (clone MI15, BD) and APC anti-CD38 (clone HB-7, BD) monoclonal antibodies, at room temperature for 15 min in the dark. After incubation, cells were washed and suspended in 300 µL of PBS; 10,000 events were acquired on FACS CANTO II and analyzed by DIVA software (BD).
EV DNA and RNA Isolation and Characterization
To isolate nucleic acids from serum EVs, we adapted and modified a commercial kit, RNA/DNA/PROTEIN Purification Plus Micro Kit (NorgenBiotek Corporation, Canada), recommended for cultured animal cells, tissue samples, blood, fungi and plants. This kit indicates to add lysis buffer to pellets derived from different sources or to 50 μL of blood. We used, as input, 50 μL of EVs to which we added the lysis buffer, as indicated in the protocol, and 1 µL of carrier RNA (cat. no. 4382878 Applied Biosystems). Sequentially, DNA and RNA were eluted from spin columns in 50 μL elution buffer and 50 μL nuclease-free water, respectively, and stored at −80°C until use.
Total DNA and RNA were quantified with a NanoDrop 2000c spectrophotometer (Thermo Scientific). DNA was evaluated by electrophoresis in 1.5% agarose gel; SYBR safe stained gels were acquired with a ChemiDoc system and analyzed by Image Lab software (Bio-Rad). DNA concentration was measured using the High Sensitivity double strand (ds) DNA Qubit Assay kit and Qubit™ 2.0 fluorometer (Thermo Fisher Scientific, Wilmington, DE, USA) following manufacturer’s recommended protocol.
Size distribution of EV-RNA was assessed using Pico RNA chips in Agilent Bioanalyzer (Agilent Technologies Inc, Santa Clara, CA, USA), following manufacturer’s instructions.
RNA quantity was measured using the RNA High Sensitivity assay kit and Qubit™ 2.0 fluorometer (Thermo Fisher Scientific) following manufacturer’s recommended protocol.
Reverse Transcription (RT) of EV RNA
To normalize sample-to-sample variations in miRNA (miR) content, we used a fixed volume of eluted RNA as input for RT.31 cDNA was synthesized starting from 5 μL of extracted RNA using TaqMan miRNA Reverse Transcription Kit (Applied Biosystems, Foster City, CA, USA) and miR-21 specific RT primers (Applied Biosystems; cat. no.4427975, assay ID000397) following manufacturer’s instructions.
Digital PCR
MiR-21 and JAK-2 levels were quantified by QX200 droplet digital PCR (dPCR) system (Bio-Rad Laboratories, Hercules, CA, USA). For miR-21, 10 μL of the synthesized cDNA were added to a 2⨰ dPCR supermix for probe (Bio-Rad) and 1 μL 20⨰ TaqMan miRNA probe (Applied Biosystems) in a 20 μL reaction mix. For JAK-2, 10 μL of DNA were added to a 2⨰ dPCR supermix for probe (Bio-Rad) and 1 μL 20⨰ assay (cat. no. 10049550 Bio-Rad) in a 20 μL reaction mix. Then, droplets were generated by loading the mix into a plastic cartridge with 70 μL of Droplet Generation Oil (Bio-Rad).
Cartridges were placed into the Droplet Generator (Bio-Rad). In addition, a no template control was included in every assay. Droplets generated from each sample were carefully transferred to a 96-well PCR plate (Eppendorf) and PCR amplification was carried out on a thermal cycler. Cycling conditions were: 95°C for 10 min, then 40 cycles of 95°C for 15 seconds and 57°C (for miR-21) or 60°C (for JAK-2) for one minute, and finally 98°C for 10 min and 4°C infinite hold. A ramping rate of 2°C/second was used in every step. The plate was then read in the Droplet Reader (Bio-Rad) and analyzed using the QuantasoftTM version 1.7.4 software (Bio-Rad). The fraction of PCR-positive droplets was quantified assuming a Poisson distribution and the number of copies per microliter (no. copies/μL) for each sample was evaluated using the QuantaSoft software.
Statistical Analysis
Nonparametric, not paired (Mann–Whitney test) Student’s t-test was used to determine the significance of differences of size, EVs/mL, EV CD38MFI, CD138MFI, CD38+EVs/mL, CD138+EVs/mL, CD38/CD138+EVs/mL and miR-21 expression level between two groups (MM vs HSs). P-value ≤0.05 was considered to be statistically significant.
To assess the degree of association of two variables, the analysis of linear correlations was performed by means of Pearson’s correlation using GraphPad Prism 6.
Receiver operating characteristic (ROC) curves were generated. Data from EVs in HSs were plotted against values derived from the group of MM patients to give estimates of true positive values (sensitivity) and the proportion of false negatives (specificity). Plotted values were represented as a curve and the area under the curve (AUC) is indicative of diagnostic accuracy. An AUC=1 (100%) denoted full accuracy of the test. In this way, it is possible to discriminate normal from abnormal values, which give an estimate of a cut-off value for a specific test in a particular setting.
Results were defined statistically significant when P-value ≤0.05.
All statistical analysis were performed using the GraphPad Prism 6 software.
Results
Size, Quality, Amount and Antigen Profile of Serum EVs in Healthy Subjects
Sera from 20 HSs were subjected to 14,300×g for one hour at 4°C in a bench centrifuge and pellets were washed and resuspended in filtered saline buffer.
Three independent methods including NTA, AFM and TEM were employed to characterize the purified pellet of cEVs in terms of concentration, size and quality. As reported in Figure 2A, the particle size distribution provided by NTA showed a heterogeneous EV population with a size range between 90 and 800 nm, thus including both small and medium EVs (s and mEVs). NTA data are reported in Figure 2B; only 10% of particles were smaller than 92.6 nm (D10) and larger than 241 nm (D90), indicating that 80% of particles displayed a size ranging between 92.6 and 241 nm. The mode size of EVs was 105.7 nm. The concentration of s/mEVs ranged between 1×10⁸ and 20×108 EVs for mL of serum.
 |
Figure 2 Healthy serum EV characterization. (A) Representative histograms of hydrodynamic EV size distribution profiles of three HSs measured by NTA. (B) NTA data expressed as D10, D90, mode, mean and concentration as mean value ±standard error and median of 20 HS EVs. Minimum and maximum values for each parameter are indicated in parentheses. (C) Representative topography images and pie chart particle radius analysis of HS derived EVs obtained through AFM analysis. (D) Representative photos of HS derived EVs obtained by TEM (image magnification: 50k⨰ for upper image and 80k⨰ for bottom images). |
AFM analysis showed that the majority of the particles have a radius in the range 18–35 nm (Figure 2C). Finally, TEM analysis showed that EV pellet contained typical round particles with a diameter ranged approximately between 20 and 300 nm with a uniform outer membrane (double layer) (Figure 2D). Altogether these data indicated that purified cEVs ranged between 20 and 800 nm and are enriched in sEVs.
To rule out the presence of serum common contaminants in EV samples, total protein and albumin, HDL, LDL and VLDL, Apo A1 and Apo B apolipoproteins, were quantified in sera, in EV samples and in their respective supernatant after centrifugation.
Any types of protein were detected in EV samples, whereas they were easily quantified at comparable concentrations in sera and EV supernatants (Figure S1A–C).
To confirm the presence of bilayer membrane particles and their cell-origin, the cEV pellet was also analyzed with FC by labeling EVs and investigating the presence of cell specific antigens on their surface.
We set the FC using size calibration beads taking advantage of their autofluorescence (Figure 3A). Thresholds, SSC and FSC, were adjusted in order to view smaller beads up to 130 nm and to set an EV gate using the 0.02 μm filtered PBS (Figure 3B). In order to eliminate artifacts and to analyze only intact EVs, we labeled EVs with a membrane-permeant molecule, CFDA-SE (see Materials and Methods). Gated events were then selected for fluorescence above the background of non-stained EVs. We observed that CFSE positive (+) EVs in the SSC/FSC dot plot appear with a dimension <130 nm beads (Figure 3C). For absolute FC quantification of EVs, TruCount tubes were used. Mean and median concentration of CFSE positive (+) EVs in HSs are reported in Figure 3D. For EV cell origin identification, CFDA-SE-labeled EVs were stained with antibodies against erythrocyte (Eri) and leukocyte (Leu) antigens, such as CD235a and CD45, respectively. As reported in Figure 3E, our FC setting confirmed that the pellet contained Eri-EVs and Leu-EVs. Of note, all appropriate controls were used for the EV gate setting and data interpretation demonstrating that buffer plus antibody reagents without EVs did not affect fluorescence signals and that no antibody was contaminated or formed aggregates (Figure S2).
 |
Figure 3 Flow cytometer setting for HS EV characterization. (A) V500-H/SSC-H, FL1- H/SSC-H and FSC-H/SSC-H dot plots of beads with 0.13, 0.22, 0.45, 0.88 and 1.35 µm of diameter. (B) FL1-H/SSC-H and FSC-H/SSC-H dot plots of 0.02 µm filtered PBS. (C) CFSE FL1-H/SSC-H and FSC-H/SSC-H dot plots of a representative not labeled and CFDA-SE labeled HS EV sample. All plots were set with logarithmic and bi-exponential axis. Gate (CFSE+ EVs) in CFSE FL1-H/SSC-H plots represent EVs positive for CFSE. (D) Mean and median concentration of CFSE+ EVs derived from 20 HSs. (E) Representative cytometric analysis of CFSE+ EVs labeled with anti CD45 (Leu-EVs: leukocyte derived EVs), anti-CD235a (Eri-EVs: erythrocyte derived EVs) and not labeled (CTRL). |
Nucleic Acid Content in HS EVs
In order to extract nucleic acids from EVs and to optimize the amount of EV sample for the extraction, we adapted and modified a commercial kit protocol that allows the sequential isolation of DNA and RNA from cells/blood to a low input of EV samples (50 μL of serum) (see Materials and Methods).
We firstly verified the recovery of EV DNA with a NanoDrop spectrophotometer obtaining a mean concentration of 1235±579.7 ng/mL from 20 HS sera and visualized it by agarose gel electrophoresis (Figure S3). Next, dsDNA was quantified by fluorimetric assay, reporting a mean concentration of 9.66±4.2 ng/mL.
To overcome concentration discrepancy among these methods, we verified nucleic acid recovery rate quantifying Janus kinase (JAK-2) gene by dPCR starting from a fixed volume of eluted DNA for all HS samples. We obtained a good separation between JAK-2 positive and negative droplets (Figure 4A) detecting a very low amount of JAK-2 up to 0.4 copies/μL. Moreover, JAK-2 mean value was 0.55±0.2 copies/μL.
 |
Figure 4 Assessment of nucleic acids from EVs of healthy subjects (HSs). (A) One-dimensional scatter plot representing droplet distribution for JAK-2 assay. JAK-2 assay positive (green) and negative (black) droplet amplitudes in two representative HS EVs (E01 in the first panel and A01 in the second panel) and no template in negative control (H01 in the first panel and F01 in the second panel). (B) The electropherogram shows the size distribution in nucleotides (nt) and fluorescence intensity (FU) of total RNA by Bioanalyzer. The short peak at 25 nt is an internal standard. L and S indicate ladder and HS sample, respectively. (C) One-dimensional scatter plot represents droplet distribution for miR-21 assay. MiR-21 assay positive (blue) and negative (black) droplet amplitudes in three representative HS EVs (A01, B01, C01) and in negative control (H02). |
EV RNA was quantified by spectrophotometry (Figure S4) obtaining a mean concentration of 18,825±2185.3 ng/mL and its quality was evaluated (Figure 4B). Total EV RNA profile revealed a size distribution ranging from 25 to 4000 nucleotides. As expected, no peaks of ribosomal RNAs, 18S and 28S, were detected. A quantitative EV RNA assessment was also accomplished by fluorimetric assay obtaining a mean concentration of 0.45±0.01 ng/μL from 20 HS sera.
We further performed dPCR on RNA quantifying miR-21. A good separation between miR-21 positive and negative droplets was reported (Figure 4C). We also detected a very low amount of miR-21 up to 1.5 copies/μL with a mean value of 28.93±46.7 copies/μL.
Profiling of Circulating EVs for Malignancy Biomarker Discovery
In order to verify the suitability of our method in a clinical setting, we used it to isolate cEVs in HMs. Therefore, sera from 10 newly diagnosed MM patients were subjected to all steps described above and a comparison between MM and HS EVs was made.
Size, Quality, Concentration and Antigen Profile of MM EVs
NTA showed that MM EVs were polydispersed particles with a size range between 50 and 830 nm and that there were differences between MM and HSs (Figure 5A). In particular, the median of mode (120 nm) and D10 (104.3 nm) in MM were higher than in HSs (101.3 nm with p=not significant, and 92.9 nm with p=0.04, respectively), whereas D90 did not show difference between the two groups (Figure 5B). Median concentration of s/mEVs from MM sera was 9.1×10⁸ EVs for mL and it was significantly higher than in HS sera (6×10⁸ EVs for mL, p=0.03; Figure 5C). To determine the trade-off between sensitivity and specificity of EV size and concentration between HS and MM subjects, we used ROC curves. We established a cut-off value of >95.70 nm for D10; 80% sensitivity (Sen) and 65% specificity (Spe), p=0.04, Figure 5D; and of >7.6×10⁸EVs/mL for concentration; 80% Sen and 70% Spe, p=0.04, Figure 5E; which allowed to distinguish MM from HSs. AFM reported that the majority of MM particles have a radius in the range 18–40 nm (Figure 5F). In the comparison, we observed an increase, in percentage and size, of the average value of the largest EV population in MM (radius of 40 nm) compared to HSs (radius of 35 nm) (compare Figures 5F and 2C).
 |
Figure 5 Analysis of healthy and MM serum EVs by NTA, AFM and TEM. (A) Overlay of two representative MM EV and two representative HS EV size distribution profiles. Dot plots show (B) mode, D10 and D90, and (C) particle concentration of 20 HS EVs and 10 MM EVs. ROC curve analysis of (D) EV particle size D10 and (E) EV concentration in HS vs MM subjects. The horizontal bar indicates the median and statistical analysis is indicated with the p-value. (F) Representative topography images and pie chart particle radius analysis of MM derived EVs obtained through AFM analysis. (G) Representative photos of MM derived EVs obtained by TEM (image Magnification: 50k× for upper image and 80k× for bottom images). |
Analysis by TEM showed that MM EV pellet contained particles in the dimension range of 20–300 nm. Of note, the MM EV membrane was jagged and not uniform unlike HS-EVs (compare Figures 5G and 2D). Analysis of serum common contaminants showed that any types of proteins were detected in MM EV samples, whereas they were easily quantified at comparable concentrations in their respective sera and supernatants (Figure S5A–C).
FC analysis of cEVs showed that their concentration was significantly higher in MM patients compared to HSs (p=0.0007; Figure 6A). Of note, to verify the relationship between EV amount determined by FC and NTA, a Spearman correlation coefficient test was applied and a strong correlation was found (p=0.004; Figure S6).
 |
Figure 6 Comparison analysis of cytometric data of EVs isolated from 20 HS and 10 MM samples. (A) Representative dot plots of CFSE+EVs and comparative scatter plot of CFSE+ EVs for mL of serum. (B) Representative dot plots of CFSE+ EVs labeled with anti-CD138 PE and anti-CD38 APC and comparative scatter plot of CFSE+/CD38+ EVs, CFSE+/CD138+ EVs, CFSE+/CD38+CD138+ EVs for mL of serum. (C) Representative fluorescence intensity plots of CD138 and CD38 on EVs and comparative scatter plot of CD38 and CD138 MFI of CFSE+ EVs. ROC curve analysis of (D) EVs/mL, (E) CD38+ EVs/mL, (F) CD138+ EVs/mL, (G) CD38/138+ EVs/mL and (H) EV CD38 MFI in HS vs MM subjects. |
With regard to EV antigen profile definition, MM provided the opportunity to combine the use of two plasma cell-specific markers, such as CD38 and CD138 for FC analysis of EVs.
First, for the multiparametric FC setting, we labeled MM cell line RPMI-8226 which displayed high CD38 and median CD138 levels (Figure S7A and B). The FC setting allowed the identification of single CD38+EVs, CD138+EVs and double CD38/CD138+EVs. These EVs were negative for CD19 and CD20 expression (Figure S7C). Of note, EV CD38 and CD138 expression levels were in line with that found on their parental cells: in fact, EVs expressed higher levels of CD38 than CD138 similar to that observed in parental cells (Figure S7D and B, respectively). All appropriate controls were used for the gate setting and data interpretation (Figure S8).
We then tested EVs isolated from HSs with the same antibodies and found that single CD38+, CD138+EVs and double CD38/CD138+ EVs can be also detected in HS sera. Their amount, however, was statistically higher in MM patients respect to HSs (p=0.009, p=0.02 and p=0.005 respectively, Figure 6B). A statistically significant difference of CD38 expression levels (mean fluorescence intensity=MFI), but not for CD138 MFI, was observed, between the two groups (Figure 6C). In particular, CD38 MFI was lower in MM than in HS-derived EVs (p=0.0003).
We further performed ROC analysis to evaluate the discriminatory efficacy of both total and specific antigen-EV concentration and CD38MFI in distinguishing MM patients and control subjects. ROC analysis established the followed cut-off values of: (i) >1.7×10⁸ EVs/mL (80% Sen and 65% Spe, p=0.001; Figure 6D), (ii) >77,583 CD38+EVs/mL (80% Sen and 80% Spe, p=0.04 Figure 6E), (iii) >6.7×10⁶ CD138+EVs/mL (80% Sen and 80% Spe, p=0.01; Figure 6F), (iv) >354,254 CD38/CD138+EVs/mL (90% Sen and 80% Spe, p=0.0083; Figure 6G), and finally (v) >182.5 CD38 MFI (100% Sen and 85% Spe, p=0.0004; Figure 6H) that allowed us to distinguish MM patients from HSs.
Molecular Content of EVs
We quantified DNA amount extracted from EVs of MM patients. A mean concentration of 1010±523.8 ng/mL and 8.1±2.05 ng/mL was obtained using spectrophotometry and fluorometry analyses, respectively.
Moreover, RNA from MM EVs showed a mean concentration of 20,480±3,704.9 ng/mL and 0.52±0.06 ng/μL by spectrophotometric and fluorometric (Figure S9 and Figure 7A, respectively) assays, respectively. Moreover, we quantified miR-21 expression in MM patient-derived EVs detecting a mean level of 9.07±11.1 copies/μL. Of note, droplet dPCR allowed to quantify a very low amount of EV miR-21 up to 1.3 copies/μL in each sample (Figure 7B).
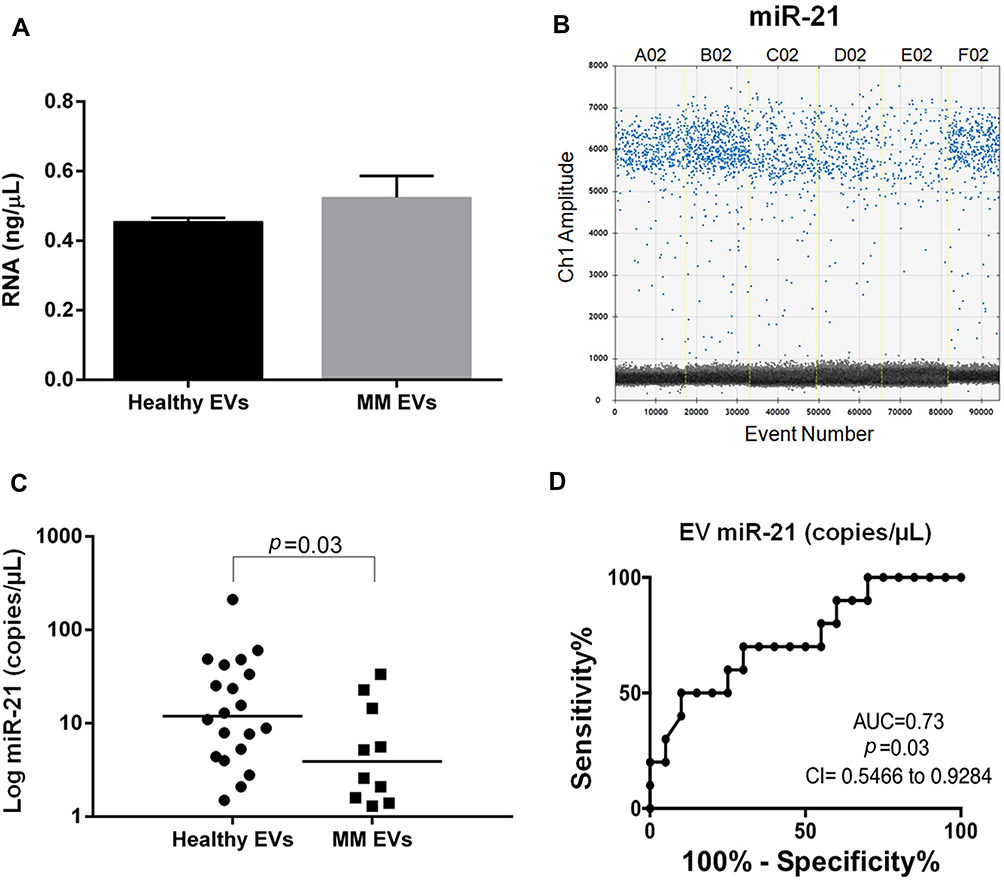 |
Figure 7 EV RNA and miR-21 analysis and miR-21 accuracy assessment in MM. (A) RNA concentration assessment (ng/μL) by Qubit in healthy and MM EVs. (B) One-dimensional scatter plot represents droplet distribution for miR-21 assay. MiR-21 assay positive (blue) and negative (black) droplet amplitudes in three representative HS EVs (A02, B02, C02) and in three representative MM EVs (D02, E02, F02). (C) Absolute quantification of serum EV miR-21 in 20 HSs and 10 MM patients. miR-21 levels are reported as copies/μL of dPCR reaction. Values are reported in log scale (y-axis). The median level in each group is indicated by the horizontal bar. Statistical analysis is indicated with the p-value. (D) ROC curve analysis of EV miR-21 (copies/μL) in 20 HS vs 10 MM subjects. |
The comparison between healthy and MM subjects, displayed a miR-21 heterogeneous expression in both groups and a significant lower level in MM patients (p=0.03; Figure 7C).
We applied ROC analysis to evaluate the discriminatory efficacy of miR-21 amount in distinguishing MM patients and control subjects establishing a cut-off value <6.6 copies/μL (70% Sen and 70% Spe, p=0.03; Figure 7D).
Association Between EV Biomarkers and MM Clinical Features
In order to provide a preliminary investigation of the clinical relevance of EVs in MM, we correlated EV characteristics with different clinical features including BM plasma cell (BM-PC) percentage, serum free light chain (sFLC) amount, disease stage (International Staging System, ISS) and bone lesions.
Absolute number of CD38/138+EVs/mL showed a positive correlation trend with the BM-PC percentage, while a negative correlation trend was observed between CD138+EVs, CD38+EVs, EV CD138 and EV CD38 and BM-PCs (Figure S10).
MM patients showed positive linear correlation coefficients for CD38/138+ EVs/mL and CD138EV-MFI and involved sFLCkappa (r=0.74, p=0.02 and r=0.64, p=0.05 respectively; Figure 8A and C), while the value of CD138+EVs/mL of serum showed a decreasing trend when compared to FLCs (r=−0.8, p=0.01; Figure 8B). No significant correlation was found between other EV biomarkers and sFLCkappa and sFLClambda (Figure S11). Overall, the characteristic increase of BM-PCs and sFLCkappa of our MM cohort was associated with an increase of CD38/138+ EVs and with a reduction of CD138+EVs (Figure S10 and Figure 8A and B). Concentration of CD38+ and CD38/138+EVs, EV CD138MFI and EV NTA data (mode and D90) were higher in patients with ISS3 compared with those in ISS1-2, although the difference was not statistically significant. In addition, a trend of positive association between high EV miR-21 levels in MM and ISS3 was found (Figure S12). In MM bone disease, CD138+ EV amount was higher in MM patients (n=6) with >3 bone lesions than in patients (n=3) with ≤3 bone lesions detected by magnetic resonance imaging (p=0.26), while a reduction of CD38/CD138+EVs/mL was associated with an increased number of bone lesions in a not significant manner (Figure 8D and E and Figure S13).
 |
Figure 8 Association between EV characteristics and MM clinical features. Spearman correlation coefficient (r) analysis between sFLCkappa and (A) CD38/CD138+ EV number/mL, (B) CD138+ EVs/mL, (C) EV CD138 MFI of 10 MM patients. Association between bone lesion number and (D) CD138+ EVs/mL and (E) CD38/CD138+ EV number of 10 MM patients. Statistical analysis is indicated with the p-value. |
Discussion
The identification of novel noninvasive biomarkers to improve early diagnosis and disease prognosis, as well as to support personalized treatment and monitoring, is a major clinical priority in oncology. Therefore, capturing potential cancer biomarkers from blood-based biofluids is of particular interest for clinical applications. In this context, EVs, thanks to their characteristic of circulating “cell-biopsy” carrying molecular information and phenotype of cell source, have proven to be new potential biomarkers for screening, diagnosis, and monitoring of tumors including hematological neoplasms.32–35 Therefore, the ability to accurately detect and analyze tumor EVs in peripheral blood (PB) of patients is of remarkable importance.
We have developed an entire workflow for the analysis of EV biomarkers based on (i) minimal invasive and small volume sampling, (ii) isolation of EVs, and (iii) their profiling, demonstrating its application firstly in healthy settings and then in a hematological malignancy, like MM.
Here we hypothesized and demonstrated that circulating EVs, detectable in PB, can provide information which reflect what happens in the human body including BM niche that is the “origin site” of different HMs. The BM biopsy, for MM, and generally the traditional tumor biopsy, is the standard method for the analysis of neoplastic cells.36
This approach however: (i) is quite invasive; (ii) is often not representative of the “spatial” heterogeneity of tumors, and (iii) does not reflect tumor molecular variety in a single patient. In this context, we and others have previously reported that PB, specifically serum of patients with cancer, including HMs, is a rich source of cEVs.37 In particular, when tissue biopsy is not possible, the cEV-based approach could be useful as alternative. Here, a small volume sample (500 µL) of PB serum from HS and MM subjects was chosen as source of cEVs.8
The determination of the optimal strategy to isolate EVs is a critical step toward retrieving the maximal amount while ensuring the recovery of different vesicle subtypes. Various methods including density gradient centrifugation, antibody affinity columns and precipitation/ultracentrifugation techniques have been proposed to isolate EVs.38 However, most of them require substantial time, great biofluid volume, instruments and expertise that limit their point-of-care clinical translation. Our EV isolation procedure is based on requirements usually met in basic clinical laboratories (no specific expertise required) like a bench centrifuge to perform two centrifuge steps for a total of two hours. Interestingly, this method allowed us to isolate both small and medium EVs in a dimensional range of 36–800 nm, as result of the combination of three independent size determination methods, including NTA, TEM and AFM, as recommended by the International Society of Extracellular Vesicles (ISEV).9 NTA technology identified in all HS and MM samples most of the particles in the range of 50–200 nm, and also detected particles between 300 and 800 nm (mEVs), although present in smaller quantities. Of note, NTA has a lower detection limit of about ±60 nm, causing smaller EVs to be underrepresented or absent from analysis.39 However, the presence of very small EVs, with observed radii smaller than 40 nm, was detected by AFM.
It is still not possible to propose specific and universal markers to distinguish sEV and m/l-EV subpopulations.9 In any case, following ISEV2018 suggestions, we assessed some cell/tissue specific markers such as CD45 and CD9 (data not shown) and we used methods based on size definition, demonstrating the presence of different types of EVs.9 Collectively, we isolated EVs enriched in sEVs (mode value around 100–120 nm). This finding was quite surprising since these types of EVs are generally isolated by applying an ultracentrifuge step, which is one of the most commonly used isolation methods in the EV field.13,40
It is well known that ultracentrifuge is not immediately applicable in a clinical setting and, even more, leads to EV co-purification with lipoproteins and soluble proteins41 hampering downstream EV analyses, such as count and molecular content analysis.42 This co-purification is an unresolved problem common to other EV isolation methods, such as ExoKit and density gradient.42 Interestingly, we demonstrated that our EV samples are free from total serum proteins, including lipoprotein complexes (7–80 nm) and albumin, favoring a deeper and more specific EV associated-biomarker discovery studies without problems in deep downstream EV analysis. Size comparison between EVs isolated from MM patients and HSs with our method demonstrated that most of MM-EVs were a little larger than HS-EVs as confirmed by NTA mode (120 vs 101 nm, respectively); similarly, AFM data confirm a shift of the EV radius distribution toward higher value and evidence a queue of relatively large values (up to more than 100 nm radii) in MM. Our data are in agreement with MM EV size reported by Zhang et al who isolated cEVs by using ultracentrifuge steps.43
Interestingly, TEM showed a morphologic heterogeneity in MM-EVs which were round or jagged with an irregular surface with respect to uniform round EVs detected in HSs.44 This difference was also reported in other diseases using different methods to isolate EVs.45,46
Overall, we provided evidence that (i) our procedure allows the isolation of contaminant free EV from 500 µL of serum within only two hours, and (ii) EV size (D10 parameter) represents a biomarker able to distinguish MM patients from HSs with a great specificity (80%) and sensitivity (80%).
EV concentration was investigated by NTA and conventional FC, which are currently the most widely used techniques for EV quantification.40 Generally, FC seems most suitable for analysis of m/lEV subsets.39 Using a fluorescent EV intracellular (from now “intravesicular”) labeling, firstly we eliminated the detection of artifacts (not bilayer particles) and, secondly we were able to detect EVs apparently similar or smaller than 130 nm beads, otherwise not detectable using physical parameter setting (SSC/FSC). In fact, fluorescence, rather than light scatter, used as trigger greatly improved FC EV detection.47–49 Next, by adding known concentrations of beads to our samples, we were able to count EVs using FC.12
NTA and FC indicated a median concentration of HS EVs of 6.10×10⁸/mL and 1.19×10⁸/mL, respectively. A similar result was obtained for MM patients (9.1×10⁸ EVs/mL vs 2.6×10⁸ EVs/mL from NTA vs FC, respectively). Cleary, the NTA-derived EV concentration was higher than the obtained using FC and this is likely because NTA is able to detect and quantify EVs below the detection limit of FC. This hypothesis was supported by the strong correlation found between NTA and FC EV count (p=0.004). Anyhow, concentration of cEVs appeared to be higher in MM patients than in HSs (1.5–2.5 fold increase) with both quantification methods and it was in line with blood EV concentration reported from other authors.50 These counts could be considered EV biomarkers to distinguish MM from HS with a great sensitivity (80%).
Cell lineage markers provide useful information for determining and distinguishing cellular source of EVs. Indeed, the detection of CD41, CD235a and CD45 on the EV surface allowed to identify platelet, red blood cell (RBC) and leucocyte-derived EVs, respectively, demonstrating that blood EVs mainly derived from these cells.47,51–56 We and others reported the detection of serum cEVs released from different cells, such as myeloid, lymphoid, platelet and endothelial cells, in different disease settings.8,12,57 In agreement with these studies, here we have also demonstrated the detection of leukocyte and RBC derived EVs and, more important, of tumor-EVs. We chose MM to test our EV-based procedure because it is the second most frequent hematological malignancy and because MM cells are identified in FC using two specific PC markers, such as CD38 and CD138. Thus, we could use them to analyze EVs isolated from MM patients.
First, by using MM cell line-derived EVs as a setting model, we demonstrated that the expression level of CD38 and CD13858 on EVs reflected the parental cells and that conventional FC allowed robust multicolor analyses of EVs. Then, in both HS and MM sera, we detected single positive CD38+ or CD138+ and double CD38/138+ EVs. Their concentration was on average twofold greater in MM patients compared to HSs whereas CD38 expression level was lower (0.6–0.7-fold decrease) in MM-EVs compared to HS-EVs.
We reasonably believe that double positive cEVs in PB can derive from normal or myeloma PCs present in the body, including BM which is MM origin site. Our idea was supported by a positive correlation trend found in MM between CD38/138+EV levels and the percentage of BMPCs which has been also reported by other authors.43
For CD38+EVs and CD138+EVs, we cannot completely exclude that they could derive from other cells as well as PCs, since CD38 is also detectable in other lymphoid (NK cells, B cells and activated T cells) and myeloid cell populations (monocytes, early osteoclast progenitors),59 while CD138 is also expressed in epithelial cells.60,61
Moreover, our data combining the increase of CD38+EVs amount with CD38 reduced expression in MM vs HSs could indicate that, for MM cells, it is more important to release a great number of CD38+EVs rather than EVs expressing high levels of CD38.
A higher level of plasma CD138+EVs/mL and CD38+EVs/mL in MM patients vs HSs and their correlation with tumor burden has been previously reported.12,62 Of note, concurrently with our work, plasma CD138+ EVs were found in both MM PB and BM and it was reported their diagnostic potential in 61 MM patients.43 Despite the different EV isolation technique and phenotype characterization, our results are in total agreement with Zhang’s findings and provide further support to the translational relevance of EV-associated biomarkers in MM and their potential use in a clinical setting. Indeed, CD38 and CD138 expression on EVs might provide useful diagnostic information to distinguish between MM and HS with a high sensitivity. Of note, the presence of circulating CD38+EVs should be considered during anti-CD38 treatment in MM.63 We believe that cEV can interfere with it, on one side subtracting the anti-CD38 antibody in circulation and making the anti-CD38 MM treatment less effective, and on the other CD38+EVs plus anti-CD38 antibody could represent an MM “immune” escape strategy. Future studies will be needed to verify these hypothesis. From a clinical point of view, our preliminary results revealed a significant correlation between clinical parameters, such as sFLCkappa concentration,64 and amount of tumor-specific EVs and expression level of CD138+ EVs. Specifically, the increase of sFLCkappa concentration was correlated to an increase of CD38+/CD138+EVs/mL and EV-CD138 expression levels and to a reduction of CD138+EVs/mL uncovering an existing relationship between FLCs and specific EVs. In fact, FLCs like EVs are released from cells, in particular from PCs, in order to circulate freely. It is possible that the observed relationship between sFLC and EVs serum levels might simply be due to the fact that they are released by the same cells. However, it is also plausible that EVs, as well as FLC released into serum, might be somehow intertwined but this hypothesis remains to be elucidated. Anyway, it is of interest that, in our cohort of patients, the specific MM clinical features, like the increase of BM-PCs and of sFLCkappa, were accompanied by an increase of PC-EVs (as CD38+/138+ EVs) supporting the idea that BM-PCs simultaneously release sFLCkappa and EVs; thus, their combination could have potential clinical relevance. In this setting, it is noteworthy that a clinical trial is currently ongoing to investigate the prognostic role of EVs in MM patients (MM, Eudract 2017-004003-46).
Regarding other MM clinical parameters, we observed a positive trend between BM PC percentage and bone lesions, and EV associated biomarkers. Again, this finding is in agreement with Zhang et al who reported a positive correlation between CD138+EV concentration and the number of MM bone lesions.43
Concerning to EV content, we were able to obtain both EV DNA and RNA from 50 µL of serum (within only one hour), with a good amount and quality. To our knowledge, this is the first method allowing to simultaneously detect both nucleic acids from EVs. We measured DNA and RNA concentration using spectro- and fluorimetric-methods, but results were variable and often showed undetectable levels of RNA. For these reasons, we decided to further investigate the quality of extracted nucleic acids by evaluating the presence of JAK-2 on EV DNA and miR-21 level on RNA using droplet dPCR. Droplet dPCR, which avoids some of the problems of other molecular techniques, allows the absolute quantification of low quantity of nucleic acids, including those free in body fluids, and in EVs, with high sensitivity.65,66 We chose to quantify miR-21 not only because it is an abundantly expressed miRNA in mammalian cells but also because its deregulation is associated with numerous types of cancer,67–69 including MM. In this neoplasm, miR-21 was found upregulated acting as an oncomiRNA.70–72
Of note, we reported miR-21 downregulation in MM EVs detecting up to 0.4 copies/µL highlighting the sensitivity of dPCR even with very low quantities of RNA. Our preliminary results suggest that, despite its heterogeneity in HS, EV miR-21 concentration might be an EV biomarker useful to distinguish MM from controls with good sensitivity. Studies are ongoing to confirm its potential clinical relevance in a large cohort of MM patients.
Finally, our method also allowed us to extract and quantify EV DNA. It has been reported that EVs carry DNA that may range in size from 100 base pairs to several kilobase pairs73 or even fragments up to two million base pairs long.74 EV-associated DNA may be single, double-stranded or mitochondrial DNA.73,75,76 At present, the functional significance of EV-DNA is largely unknown. Several studies have shown that EV-DNA reflects both qualitatively73,77–82 and quantitatively74,75 the parental cell genome DNA.
Thus, evaluation of EV-DNA could provide useful information for a better management of several types of diseases, besides cancer, and the availability of a simple method for its isolation is essential for its implementation in a routine clinical setting.
Conclusion
In this study, we have defined conditions and critical parameters necessary to achieve a high sensible detection of EV associated-biomarkers. EVs are highly stable and easily quantified in serum. Therefore, biological samples can be analyzed with minimal sample processing and the use of NTA, FC and dPCR for EV routine screening of biological samples can become a reality for monitoring tumor patients. To our knowledge, this is the first approach that, using only a bench centrifugation step, allows the efficient isolation of protein contaminant free EVs suitable for subsequent characterization (size, count, surface antigens and intravesicular nucleic acids). The total procedure requires at most six hours, with minimal in-hand manipulation. Overall, these technological adaptations allowed us to meet our primary purpose, which was to be as easy and as simple as possible in analyzing all circulating EV-associated biomarkers to optimize screening for tumor EVs. From a clinical point of view, our study provides further evidence that EVs isolated from serum are a source of biomarkers for hematological neoplasms. Our aim was not to provide definitive conclusions on the clinical use of EV-related biomarkers, but to identify new circulating EV associated-biomarkers in tumors, potentially investigable with approaches/procedures available in clinical cancer laboratories providing a basis for further exploration of their possible role as a noninvasive biomarker in MM and in other malignancies.
Ethics Statement
The authors confirm that this study was approved by the Ethics Committee of IRCCS CROB (Prot 3725; 7-2-2008) and that all participants provided informed consent to take part in this study. The authors confirm that this study complied with the Declaration of Helsinki.
Acknowledgments
The authors would like to thank medical doctors of the Department of Hematology of IRCCS CROB, Giuseppe Pietrantuono and Giovanna Mansueto, for providing care and clinical information of patients. This work was supported by the Italian Society of Experimental Hematology (SIES) fellowship. This paper is dedicated to memory of our mentor Prof. Luigi Del Vecchio who left a great void.
Author Contributions
All authors made substantial contributions to conception and design, acquisition of data, or analysis and interpretation of data; took part in drafting the article or revising it critically for important intellectual content; agreed to submit to the current journal; gave final approval of the version to be published; and agree to be accountable for all aspects of the work.
Funding
This work was supported by the Italian Ministry of Health—Ricerca Corrente 2019.
Disclosure
The authors report no conflicts of interest in this work.
References
1. Castro-Giner F, Gkountela S, Donato C, et al. Cancer diagnosis using a liquid biopsy: challenges and expectations. Diagnostics (Basel, Switzerland). 2018;8(2). doi:10.3390/diagnostics8020031
2. Mathai R, Vidya R, Reddy B, et al. Potential utility of liquid biopsy as a diagnostic and prognostic tool for the assessment of solid tumors: implications in the precision oncology. J Clin Med. 2019;8(3):373. doi:10.3390/jcm8030373
3. Yang C, Xia BR, Jin WL, Lou G. Circulating tumor cells in precision oncology: clinical applications in liquid biopsy and 3D organoid model. Cancer Cell Int. 2019;19(1). doi:10.1186/s12935-019-1067-8
4. Kelley SO, Pantel K, New A. Era in liquid biopsy: from genotype to phenotype. Clin Chem. 2019. doi:10.1373/clinchem.2019.303339
5. Boyiadzis M, Whiteside TL. Plasma-derived exosomes in acute myeloid leukemia for detection of minimal residual disease: are we ready? Expert Rev Mol Diagn. 2016;16(6):623–629. doi:10.1080/14737159.2016.1174578
6. Caivano A, Del Vecchio L, Musto P. Do we need to distinguish exosomes from microvesicles in hematological malignancies? Leukemia. 2017;31(9):2009–2010. doi:10.1038/leu.2017.205
7. Caivano A, La Rocca F, Laurenzana I, et al. Extracellular vesicles in hematological malignancies: from biology to therapy. Int J Mol Sci. 2017;18(6):1183. doi:10.3390/ijms18061183
8. Shah R, Patel T, Freedman JE. Circulating Extracellular Vesicles in Human Disease. N Engl J Med. 2018;379(10):2179–2181. doi:10.1056/NEJMc1813170
9. Théry C, Witwer KW, Aikawa E, et al. Minimal information for studies of extracellular vesicles 2018 (MISEV2018): a position statement of the International Society for Extracellular Vesicles and update of the MISEV2014 guidelines. J Extracell Vesicles. 2018;7(1):1535750. doi:10.1080/20013078.2018.1535750
10. De Luca L, D’Arena G, Simeon V, et al. Characterization and prognostic relevance of circulating microvesicles in chronic lymphocytic leukemia. Leuk Lymphoma. 2017;58(6). doi:10.1080/10428194.2016.1243790
11. Panagopoulou MS, Wark AW, Birch DJS, Gregory CD. Phenotypic analysis of extracellular vesicles: a review on the applications of fluorescence. J Extracell Vesicles. 2020;9(1):1710020. doi:10.1080/20013078.2019.1710020
12. Caivano A, Laurenzana I, De Luca L, et al. High serum levels of extracellular vesicles expressing malignancy-related markers are released in patients with various types of hematological neoplastic disorders. Tumor Biol. 2015;36(12). doi:10.1007/s13277-015-3741-3
13. Caivano A, La Rocca F, Simeon V, et al. MicroRNA-155 in serum-derived extracellular vesicles as a potential biomarker for hematologic malignancies – a short report. Cell Oncol. 2017;40(1):97–103. doi:10.1007/s13402-016-0300-x
14. Manier S, Liu CJ, Avet-Loiseau H, et al. Prognostic role of circulating exosomal miRNAs in multiple myeloma. Blood. 2017;129(17):2429–2436. doi:10.1182/blood-2016-09-742296
15. De Luca L, Trino S, Laurenzana I, et al. Mesenchymal stem cell derived extracellular vesicles: a role in hematopoietic transplantation? Int J Mol Sci. 2017;18(5):1022. doi:10.3390/ijms18051022
16. Laurenzana I, Lamorte D, Trino S, et al. Extracellular vesicles: a new prospective in crosstalk between microenvironment and stem cells in hematological malignancies. Stem Cells Int. 2018;2018:1–11. doi:10.1155/2018/9863194
17. Trino S, Lamorte D, Caivano A, et al. Micrornas as new biomarkers for diagnosis and prognosis, and as potential therapeutic targets in acute myeloid leukemia. Int J Mol Sci. 2018;19(2):460. doi:10.3390/ijms19020460
18. Konoshenko MY, Lekchnov EA, Vlassov AV, Laktionov PP. Isolation of extracellular vesicles: general methodologies and latest trends. Biomed Res Int. 2018;2018:8545347. doi:10.1155/2018/8545347
19. Lucchetti D, Fattorossi A, Sgambato A. Extracellular vesicles in oncology: progress and pitfalls in the methods of isolation and analysis. Biotechnol J. 2019;14(1):1700716. doi:10.1002/biot.201700716
20. Coumans FAW, Brisson AR, Buzas EI, et al. Methodological guidelines to study extracellular vesicles. Circ Res. 2017;120(10):1632–1648. doi:10.1161/CIRCRESAHA.117.309417
21. Van Deun J, Mestdagh P, Agostinis P, et al. EV-TRACK: transparent reporting and centralizing knowledge in extracellular vesicle research. Nat Methods. 2017;14:228–232. doi:10.1038/nmeth.4185
22. Ulrich BC, Paweletz CP. Cell-free DNA in oncology: gearing up for clinic. Ann Lab Med. 2018;38(1):1–8. doi:10.3343/alm.2018.38.1.1
23. Balaji SA, Shanmugam A, Chougule A, et al. Analysis of solid tumor mutation profiles in liquid biopsy. Cancer Med. 2018;7(11):5439–5447. doi:10.1002/cam4.1791
24. Nakamura S, Yokoyama K, Yusa N, et al. Circulating tumor DNA dynamically predicts response and/or relapse in patients with hematological malignancies. Int J Hematol. 2018;108(4):402–410. doi:10.1007/s12185-018-2487-2
25. Nardelli C, Granata I, Iaffaldano L, et al. miR-138/miR-222 overexpression characterizes the miRNome of amniotic mesenchymal stem cells in obesity. Stem Cells Dev. 2017;26(1):4–14. doi:10.1089/scd.2016.0127
26. Kumar SK, Rajkumar V, Kyle RA, et al. Multiple myeloma. Nat Rev Dis Prim. 2017;3:17046. doi:10.1038/nrdp.2017.46
27. Girasole M, Cricenti A, Generosi R, et al. Different membrane modifications revealed by atomic force/lateral force microscopy after doping of human pancreatic cells with Cd, Zn, or Pb. Microsc Res Tech. 2007;70(10):912–917. doi:10.1002/jemt.20486
28. Carelli-Alinovi C, Dinarelli S, Sampaolese B, Misiti F, Girasole M. Morphological changes induced in erythrocyte by amyloid beta peptide and glucose depletion: a combined atomic force microscopy and biochemical study. Biochim Biophys Acta Biomembr. 2019;1861(1):236–244. doi:10.1016/j.bbamem.2018.07.009
29. Laurenzana I, Caivano A, La Rocca F, et al. A pyrazolo[3,4-d]pyrimidine compound reduces cell viability and induces apoptosis in different hematological malignancies. Front Pharmacol. 2016;7. doi:10.3389/fphar.2016.00416
30. The National Cholesterol Education Program Working Group on Lipoprotein Measurement - PubMed. National cholesterol education program recommendations for triglyceride measurement: executive summary; 2021. Available from: https://pubmed.ncbi.nlm.nih.gov/7586511/.
31. Tavano F, Gioffreda D, Valvano MR, et al. Droplet digital PCR quantification of miR-1290 as a circulating biomarker for pancreatic cancer. Sci Rep. 2018;8(1):16389. doi:10.1038/s41598-018-34597-z
32. De Luca L, Laurenzana I, Trino S, Lamorte D, Caivano A, Musto P. An update on extracellular vesicles in multiple myeloma: a focus on their role in cell-to-cell cross-talk and as potential liquid biopsy biomarkers. Expert Rev Mol Diagn. 2019;19(3):249–258. doi:10.1080/14737159.2019.1583103
33. Zheng X, Xu K, Zhou B, et al. A circulating extracellular vesicles-based novel screening tool for colorectal cancer revealed by shotgun and data-independent acquisition mass spectrometry. J Extracell Vesicles. 2020;9(1):1750202. doi:10.1080/20013078.2020.1750202
34. Nanou A, Miller MC, Zeune LL, et al. Tumour-derived extracellular vesicles in blood of metastatic cancer patients associate with overall survival. Br J Cancer. 2020;122(6):801–811. doi:10.1038/s41416-019-0726-9
35. Vinik Y, Ortega FG, Mills GB, et al. Proteomic analysis of circulating extracellular vesicles identifies potential markers of breast cancer progression, recurrence, and response. Sci Adv. 2020;6(40):eaba5714. doi:10.1126/sciadv.aba5714
36. Romano A, Palumbo GA, Parrinello NL, Conticello C, Martello M, Terragna C. Minimal residual disease assessment within the bone marrow of multiple myeloma: a review of caveats, clinical significance and future perspectives. Front Oncol. 2019;9:699. doi:10.3389/fonc.2019.00699
37. Osti D, Bene MD, Rappa G, et al. Clinical significance of extracellular vesicles in plasma from glioblastoma patients. Clin Cancer Res. 2019;25(1):266–276. doi:10.1158/1078-0432.CCR-18-1941
38. Doyle LM, Wang MZ. Overview of extracellular vesicles, their origin, composition, purpose, and methods for exosome isolation and analysis. Cells. 2019;8(7):727. doi:10.3390/cells8070727
39. van der Pol E, Coumans FAW, Grootemaat AE, et al. Particle size distribution of exosomes and microvesicles determined by transmission electron microscopy, flow cytometry, nanoparticle tracking analysis, and resistive pulse sensing. J Thromb Haemost. 2014;12(7):1182–1192. doi:10.1111/jth.12602
40. Gardiner C, Vizio DD, Sahoo S, et al. Techniques used for the isolation and characterization of extracellular vesicles: results of a worldwide survey. J Extracell Vesicles. 2016;5(1):32945. doi:10.3402/jev.v5.32945
41. Sódar BW, Kittel Á, Pálóczi K, et al. Low-density lipoprotein mimics blood plasma-derived exosomes and microvesicles during isolation and detection. Sci Rep. 2016;6. doi:10.1038/srep24316
42. Brennan K, Martin K, FitzGerald SP, et al. A comparison of methods for the isolation and separation of extracellular vesicles from protein and lipid particles in human serum. Sci Rep. 2020;10(1):1–13. doi:10.1038/s41598-020-57497-7
43. Zhang L, Lei Q, Wang H, et al. Tumor-derived extracellular vesicles inhibit osteogenesis and exacerbate myeloma bone disease. Theranostics. 2019;9(1):196–209. doi:10.7150/thno.27550
44. Kotrbová A, Štěpka K, Maška M, et al. TEM ExosomeAnalyzer: a computer-assisted software tool for quantitative evaluation of extracellular vesicles in transmission electron microscopy images. J Extracell Vesicles. 2019;8(1):1560808. doi:10.1080/20013078.2018.1560808
45. Zlotogorski-Hurvitz A, Dayan D, Chaushu G, Salo T, Vered M. Morphological and molecular features of oral fluid-derived exosomes: oral cancer patients versus healthy individuals. J Cancer Res Clin Oncol. 2016;142(1):101–110. doi:10.1007/s00432-015-2005-3
46. Xie C, Ji N, Tang Z, Li J, Chen Q. The role of extracellular vesicles from different origin in the microenvironment of head and neck cancers. Mol Cancer. 2019;18(1):83. doi:10.1186/s12943-019-0985-3
47. Arraud N, Gounou C, Turpin D, Brisson AR. Fluorescence triggering: a general strategy for enumerating and phenotyping extracellular vesicles by flow cytometry. Cytometry A. 2016;89(2):184–195. doi:10.1002/cyto.a.22669
48. Poncelet P, Robert S, Bailly N, et al. Tips and tricks for flow cytometry-based analysis and counting of microparticles. Transfus Apher Sci. 2015;53(2):110–126. doi:10.1016/j.transci.2015.10.008
49. Rousseau M, Belleannee C, Duchez A-C, et al. Detection and quantification of microparticles from different cellular lineages using flow cytometry. Evaluation of the impact of secreted phospholipase A2 on microparticle assessment. PLoS One. 2015;10(1):e0116812. doi:10.1371/journal.pone.0116812
50. Johnsen KB, Gudbergsson JM, Andresen TL, Simonsen JB. What is the blood concentration of extracellular vesicles? Implications for the use of extracellular vesicles as blood-borne biomarkers of cancer. Biochim Biophys Acta Rev Cancer. 2019;1871(1):109–116. doi:10.1016/j.bbcan.2018.11.006
51. Aatonen MT, Ohman T, Nyman TA, Laitinen S, Grönholm M, Siljander PR-M. Isolation and characterization of platelet-derived extracellular vesicles. J Extracell Vesicles. 2014;3(1). doi:10.3402/jev.v3.24692
52. Boilard E, Duchez AC, Brisson A. The diversity of platelet microparticles. Curr Opin Hematol. 2015;22(5):437–444. doi:10.1097/MOH.0000000000000166
53. Flaumenhaft R, Dilks JR, Richardson J, et al. Megakaryocyte-derived microparticles: direct visualization and distinction from platelet-derived microparticles. Blood. 2009;113(5):1112–1121. doi:10.1182/blood-2008-06-163832
54. Gitz E, Pollitt AY, Gitz-Francois JJ, et al. CLEC-2 expression is maintained on activated platelets and on platelet microparticles. Blood. 2014;124(14):2262–2270. doi:10.1182/blood-2014-05-572818
55. Heijnen HFG, Schiel AE, Fijnheer R, Geuze HJ, Sixma JJ. Activated platelets release two types of membrane vesicles: microvesicles by surface shedding and exosomes derived from exocytosis of multivesicular bodies and α-granules. Blood. 1999;94(11):3791–3799. doi:10.1182/blood.v94.11.3791.423a22_3791_3799
56. Nanou A, Zeune LL, Terstappen LWMM. Leukocyte-derived extracellular vesicles in blood with and without EpCAM enrichment. Cells. 2019;8(8):937. doi:10.3390/cells8080937
57. Sproviero D, La Salvia S, Colombo F, et al. Leukocyte derived microvesicles as disease progression biomarkers in slow progressing amyotrophic lateral sclerosis patients. Front Neurosci. 2019;13:344. doi:10.3389/fnins.2019.00344
58. Rawstron AC, Orfao A, Beksac M, et al. Report of the European Myeloma Network on multiparametric flow cytometry in multiple myeloma and related disorders. Haematologica. 2008;93(3):431–438. doi:10.3324/haematol.11080
59. Morandi F, Horenstein AL, Costa F, Giuliani N, Pistoia V, Malavasi F. CD38: a target for immunotherapeutic approaches in multiple myeloma. Front Immunol. 2018;9:2722. doi:10.3389/fimmu.2018.02722
60. Lonsdale J, Thomas J, Salvatore M, et al. The genotype-tissue expression (GTEx) project. Nat Genet. 2013;45(6):580–585. doi:10.1038/ng.2653
61. Xian X, Gopal S, Couchman JR. Syndecans as receptors and organizers of the extracellular matrix. Cell Tissue Res. 2010;339(1):31–46. doi:10.1007/s00441-009-0829-3
62. Krishnan SR, Luk F, Brown RD, Suen H, Kwan Y, Bebawy M. Isolation of human CD138+microparticles from the plasma of patients with multiple myeloma. Neoplasia. 2016;18:25–32. doi:10.1016/j.neo.2015.11.011
63. Costa F, Dalla Palma B, Giuliani N. CD38 expression by myeloma cells and its role in the context of bone marrow microenvironment: modulation by therapeutic agents. Cells. 2019;8(12):1632. doi:10.3390/cells8121632
64. Dispenzieri A, Kyle R, Merlini G, et al. International Myeloma Working Group guidelines for serum-free light chain analysis in multiple myeloma and related disorders. Leukemia. 2009;23(2):215–224. doi:10.1038/leu.2008.307
65. Hindson BJ, Ness KD, Masquelier DA, et al. High-throughput droplet digital PCR system for absolute quantitation of DNA copy number. Anal Chem. 2011;83(22):8604–8610. doi:10.1021/ac202028g
66. Takahashi K, Yan IK, Kim C, Kim J, Patel T. Analysis of extracellular RNA by digital PCR. Front Oncol. 2014. doi:10.3389/fonc.2014.00129
67. Feng YH, Tsao CJ. Emerging role of microRNA-21 in cancer (Review). Biomed Rep. 2016;5(4):395–402. doi:10.3892/br.2016.747
68. Wu X, Ding M, Lin J. Three-microRNA expression signature predicts survival in triple-negative breast cancer. Oncol Lett. 2020;19(1):301–308. doi:10.3892/ol.2019.11118
69. Sahraei M, Chaube B, Liu Y, et al. Suppressing miR-21 activity in tumor-associated macrophages promotes an antitumor immune response. J Clin Invest. 2019;129(12):5518–5536. doi:10.1172/JCI127125
70. Leone E, Morelli E, Di Martino MT, et al. Targeting miR-21 inhibits in vitro and in vivo multiple myeloma cell growth. Clin Cancer Res. 2013;19(8):2096–2106. doi:10.1158/1078-0432.CCR-12-3325
71. Wang J-H, Zhou -W-W, Cheng S-T, Liu B-X, Liu F-R, Song J-Q. Downregulation of Sprouty homolog 2 by microRNA-21 inhibits proliferation, metastasis and invasion, however promotes the apoptosis of multiple myeloma cells. Mol Med Rep. 2015;12(2):1810–1816. doi:10.3892/mmr.2015.3567
72. Löffler D, Brocke-Heidrich K, Pfeifer G, et al. Interleukin-6-dependent survival of multiple myeloma cells involves the Stat3-mediated induction of microRNA- 21 through a highly conserved enhancer. Blood. 2007;110(4):1330–1333. doi:10.1182/blood-2007-03-081133
73. Thakur BK, Zhang H, Becker A, et al. Double-stranded DNA in exosomes: a novel biomarker in cancer detection. Cell Res. 2014;24(6):766–769. doi:10.1038/cr.2014.44
74. Vagner T, Spinelli C, Minciacchi VR, et al. Large extracellular vesicles carry most of the tumour DNA circulating in prostate cancer patient plasma. J Extracell Vesicles. 2018;7(1):1505403. doi:10.1080/20013078.2018.1505403
75. Balaj L, Lessard R, Dai L, et al. Tumour microvesicles contain retrotransposon elements and amplified oncogene sequences. Nat Commun. 2011;2(1). doi:10.1038/ncomms1180
76. Guescini M, Genedani S, Stocchi V, Agnati LF. Astrocytes and Glioblastoma cells release exosomes carrying mtDNA. J Neural Transm. 2010;117(1):1–4. doi:10.1007/s00702-009-0288-8
77. Allenson K, Castillo J, San Lucas FA, et al. High prevalence of mutant KRAS in circulating exosome-derived DNA from early-stage pancreatic cancer patients. Ann Oncol off J Eur Soc Med Oncol. 2017;28(4):741–747. doi:10.1093/annonc/mdx004
78. Castellanos-Rizaldos E, Grimm DG, Tadigotla V, et al. Exosome-based detection of EGFR T790M in plasma from non–small cell lung cancer patients. Clin Cancer Res. 2018;24(12):2944–2950. doi:10.1158/1078-0432.CCR-17-3369
79. Kahlert C, Melo SA, Protopopov A, et al. Identification of double-stranded genomic DNA spanning all chromosomes with mutated KRAS and p53 DNA in the serum exosomes of patients with pancreatic cancer. J Biol Chem. 2014;289(7):3869–3875. doi:10.1074/jbc.C113.532267
80. Möhrmann L, Huang HJ, Hong DS, et al. Liquid biopsies using plasma exosomal nucleic acids and plasma cell-free DNA compared with clinical outcomes of patients with advanced cancers. Clin Cancer Res. 2018;24(1):181–188. doi:10.1158/1078-0432.CCR-17-2007
81. San Lucas FA, Allenson K, Bernard V, et al. Minimally invasive genomic and transcriptomic profiling of visceral cancers by next-generation sequencing of circulating exosomes. Ann Oncol off J Eur Soc Med Oncol. 2016;27(4):635–641. doi:10.1093/annonc/mdv604
82. Yang S, Che SPY, Kurywchak P, et al. Detection of mutant KRAS and TP53 DNA in circulating exosomes from healthy individuals and patients with pancreatic cancer. Cancer Biol Ther. 2017;18(3):158–165. doi:10.1080/15384047.2017.1281499
 © 2021 The Author(s). This work is published and licensed by Dove Medical Press Limited. The
full terms of this license are available at https://www.dovepress.com/terms
and incorporate the Creative Commons Attribution
- Non Commercial (unported, 3.0) License.
By accessing the work you hereby accept the Terms. Non-commercial uses of the work are permitted
without any further permission from Dove Medical Press Limited, provided the work is properly
attributed. For permission for commercial use of this work, please see paragraphs 4.2 and 5 of our Terms.
© 2021 The Author(s). This work is published and licensed by Dove Medical Press Limited. The
full terms of this license are available at https://www.dovepress.com/terms
and incorporate the Creative Commons Attribution
- Non Commercial (unported, 3.0) License.
By accessing the work you hereby accept the Terms. Non-commercial uses of the work are permitted
without any further permission from Dove Medical Press Limited, provided the work is properly
attributed. For permission for commercial use of this work, please see paragraphs 4.2 and 5 of our Terms.