")
Back to Journals » Drug Design, Development and Therapy » Volume 16
Analysis of Acrylamide and Glycidamide in Dried Blood Spot of Smokers Using Ultra-High-Performance Liquid Chromatography–Tandem Mass Spectrometry
Authors Harahap Y , Lahilla AA, Jautan AS, Hafidz A, Sunarsih S
Received 17 November 2021
Accepted for publication 26 January 2022
Published 28 February 2022 Volume 2022:16 Pages 521—531
DOI https://doi.org/10.2147/DDDT.S346892
Checked for plagiarism Yes
Review by Single anonymous peer review
Peer reviewer comments 3
Editor who approved publication: Dr Tuo Deng
Yahdiana Harahap,1,2 Afaf Amma Lahilla,1 Anastasia Sharon Jautan,1 Amiral Hafidz,1 Sunarsih Sunarsih3
1Faculty of Pharmacy, Universitas Indonesia, Depok, Indonesia; 2Faculty of Military Pharmacy, Republic of Indonesia Defense University, Bogor, Indonesia; 3Dea Medika Clinic, Bogor, Indonesia
Correspondence: Yahdiana Harahap, Email [email protected]
Introduction: Acrylamide is a genotoxic substance that can be found in cigarette smoke. Acrylamide is metabolized by the CYP2E1 enzyme in the body to form glycidamides, an epoxide that is reactive to DNA and can form carcinogenic adducts. Therefore, exposure to acrylamide can potentially cause cancer. This study aims to analyze the levels of acrylamide and glycidamide in dried blood spot samples of smokers using propanamide as an internal standard and non-smokers as the control subjects.
Methods: Dried blood spot samples were extracted using the protein precipitation method and then analyzed by liquid chromatography-tandem mass spectrometry. Mass detection was performed using positive type electro spray ionization and multiple reaction monitoring type with m/z 72.0> 55.02 for acrylamide, 88.1> 45.0 for glycidamide, and 74.0> 57.1 for propanamide as the internal standard.
Results: Acrylamide and glycidamide levels in the dried blood spot sample of smokers ranged between 3.91 – 10.25 μg/mL and 1.006– 3.58 μg/mL, respectively. Data of the non-smokers on acrylamide and glycidamide levels were 0.75– 3.16 μg/mL and 0– 0.91 μg/mL.
Discussion: The significant value of acrylamide and glycidamide between smokers and non-smokers was p < 0.05, which showed that there is a significant difference between acrylamide and glycidamide concentration in smokers and non-smoker subjects. The results of this study suggest that dried blood spots can be used to determine acrylamide and glycidamide levels in humans. Theoretically, acrylamide and glycidamide concentration should correlate to each other; however in reality, there are other factors (such as CYP2E1 polymorphism, dietary intake, etc) that can cause variation in their respective concentration.
Keywords: acrylamide, dried blood spot, glycidamide, LC-MS/MS, smoker
Introduction
Smoking is a known health problem. In Indonesia, about 31.0% of the people above the age of 17 smoke cigarettes.1 Tobacco contains a lot of harmful chemicals, among which is acrylamide (AA). Exposure to AA can cause toxic effects such as nephrotoxicity, reproduction toxicity, and is carcinogenic in experimental animals.2 AA is metabolized by CYP2E1, producing glycidamide (GA). The International Agency of Research on Cancer (IARC) has classified AA into group 2A, which is a compound that might cause cancer in humans.3 Glycidamide has been found to bind with DNA to form several DNA adducts. The most common form of GA DNA adduct is N7-GA-guanine.4
Currently, there are a lack of understanding of the risk of exposure to AA and GA from smoking. To predict the risk of exposure to AA and GA in humans, we can measure its concentration in the blood. Therefore, the analysis needs to be done with a method that is both specific and sensitive. Liquid Chromatography-Tandem Mass Spectrometry (LC-MS/MS) can be used to quantify AA and GA concentration in blood. Previously, research on AA and GA has been carried out in various biological matrices5 and toxicokinetic tests of AA and GA have been carried out in mice.6 Also, analysis of AA in dried blood spots of lung cancer has been done.7 Meanwhile, there is no analysis method for the simultaneous analysis of AA and GA in smoker’s DBS samples.
This study aims to determine the levels of AA and GA, with propanamide (PA) as the internal standard in blood samples from subjects who smoke and healthy subjects who do not smoke (controls) using LC-MS/MS. Compared to the study that has been done by Harahap et al7 on acrylamide, this study adds the analysis of GA content in DBS sample of smokers as well. Previously, a validated method of AA and GA in DBS has been developed.7 In this study, we used a modified method that was optimized and validated by Harahap et al.7
Materials and Methods
Chemicals and Materials
Acrylamide, Glycidamide, and Propanamide were purchased from Sigma-Aldrich (Singapore). Formic acid HPLC grade, methanol HPLC grade, and acetonitrile HPLC grade were obtained from Merck (Darmstadt, Germany). Whatman® 903 Protein Saver Card was obtained from Sigma-Aldrich. The whole blood was from Palang Merah Indonesia (Indonesian Red Cross Society).
Preparation of Solutions and Standards
AA, GA, and PA stock solutions were prepared by dissolving 10 mg of each substance in 10 mL of ultrapure water to obtain a concentration of 1000 μg/mL. The stock solution of AA and GA was diluted with whole blood to obtain the working solution at a range of 1–40 μg/mL. Quality control samples (QCs) of AA and GA were prepared separately in the same procedure with the working solution at a concentration of 3 μg/mL, 30 μg/mL, and 45 μg/mL for low (QCL), medium (QCM), and high (QCH) concentration. The stock solution of PA was diluted with ultrapure water to obtain a concentration of 10 μg/mL.
Sample Preparation
The working solutions of AA and GA were spotted as much as 30 μL on the DBS paper and then dried at room temperature for 2 h. After drying, 100 μL of the internal standard (10 μg/mL PA solution) was added to the sample cup. The analytes were extracted using 500 μL methanol and ultrapure water (1:1). The mixture was vortexed on a vortex mixer for 30s, sonicated for 5 min, and centrifuged at 4015 g for 1 min. Then, 400 μL of the supernatant was evaporated under nitrogen gas at 45°C for 1 h and pressure 5 psi. The dried sample was reconstituted with 100 μL of 0.2% formic acid in water and acetonitrile (60:40 v/v) and sonicated for 15 min. The sample was vortexed on a vortex mixer for 30s and centrifuged at 737 g for 5 min. Then, 70 μL of the supernatant was inserted into a vial and 5 μL of the final mixture was injected into LC-MS/MS.
LC-MS/MS
The analysis was performed with LC-MS/MS using the Acquity UPLC BEH C18 column (1.7 μm; 100 mm × 2.1 mm). The mobile phase was a mixture of 0.2% formic acid in water and acetonitrile (60:40 v/v) with gradient elution. Detection was carried out at a mass spectrometer, using positive ESI and MRM type, with m/z 72.0>55.02 for AA, 88.1>45.0 for GA, and 74.0>57.1 for PA. The capillary voltage used is 3.50 kV with 22V cone voltage for AA and PA, and 16V for GA. Desolvation temperature, gas flow rate, and gas cone source flow rate were set at 400°C, 650 L/h, and 1 L/h. The voltage in the collision chamber for AA, GA, and PA is 8V, 9V, and 9V, respectively. The injection volume used is 5 μL.
Method Validation
Analysis of AA and GA in DBS was performed by using a validated bioanalysis method from Harahap et al.8 The partial validation assay is used to validate modifications of the previously fully validated bioanalysis method. The partial validation assay was performed based on the Food and Drug Administration guidelines for the validation of bioanalysis. The partial validation parameters are linearity, accuracy, and precision.9
Selectivity and Specificity
The selectivity and sensitivity were evaluated by analyzing six different blank whole blood and whole blood at LLOQ concentrations. The endogenous interference value should be less than 20% of the peak area at the LLOQ concentration and should be less than 5% of the internal standard.
Carry Over
Carryover was tested by injecting concentrations of AA and GA on Upper Limit of Quantification (ULOQ), blank, and LLOQ, respectively, for five replicas. The resulting interference value should be less than 20% of the peak area of the analyte at LLOQ concentration.
Linearity
All calibration curves consisted of a blank sample, zero samples, and a concentration range of 1–40 μg/mL for both AA and GA were spotted onto the DBS card. The sample was analyzed by plotting the peak area ratio between the peak area of AA and PA. The calibration curve is acceptable if correlation (r) is greater than 0.98, the non-zero calibration concentration has a concentration of ± 15% of the theoretical nominal concentration, except for LLOQ ± 20% of the nominal concentration. A least six non-zero calibration concentrations and 75% of the non-zero calibration concentration must meet the above criteria in any validation process.
Accuracy and Precision
Accuracy and precision were performed in five replicates for each analysis at concentrations of LLOQ, QCL, QCM, and QCH for AA and GA, respectively. The comparison of nominal concentration and theoretical concentration was calculated for accuracy and %CV value for precision value. The accuracy and precision are acceptable if the concentration ratio value and %CV should not exceed ± 15% for all concentrations except for LLOQ should not exceed ± 20%.
Recovery
The recovery test was assessed by comparing the extracted sample with the blank sample that was spiked post-extraction at QCL, QCM, and QCH concentrations.
Dilution Integrity
A dilution integrity test was conducted on five replicas of 5000 ng/mL acrylamide and glycidamide blood samples for each dilution factor. The dilution must not affect accuracy and precision with the requirement of nominal concentration values and %CV must not exceed ± 15%.
Matrix Effect
The matrix effect was analyzed by comparing the AA, GA, and PA peak area in the standard solution and the blood. The matrix effect test meets the requirements if the % CV of the matrix factor normalized by the internal standard is not more than 15%.
Stability
The stability of DBS samples and stock solutions at room temperature (25°C) and refrigerator (4°C) were determined. Stability was assessed from the ratio between the peak area of the measurement results of the sample after being stored under certain conditions for a certain time to the peak area of the measurement results of the sample prepared shortly before injection. The obtained value should not exceed 15% except for the stock solution should not exceed 10%.
Analysis of Acrylamide and Glycidamide in DBS of Smokers
This study has obtained an ethical review from the Human Research Ethics Committee of Universitas Indonesia with the number KET-147/UN2.F1/ETIK/PPM.00.02/2020 which comply to the Declaration of Helsinki. Dried blood spots were collected from 48 subjects consisting of 22 smokers and 26 non-smokers as control subjects. The smokers’ subjects contain 18 males and four females, whereas the non-smokers’ subjects contain 23 males and three females. All of the subjects signed the informed consent as a form of willingness to participate in the study. All subjects filled out the questionnaire about habits of smoking and consuming foods containing AA.
The study inclusion criteria of the smoking group were smokers aged >17 years, consuming ≥10 cigarettes/day, and exposed to cigarette smoke from the environment. The study inclusion criteria of the non-smoker subjects were aged 6–75 years, not an active or passive smoker, consuming foods that contain a small amount of AA, and was willing not to consume those foods for at least 72 hours before and during the blood sampling process.
Blood samples were taken by finger prick with a sterile lancet needle and ± 100 µL blood samples were collected in a 0.5 mL K3EDTA vacutainer. Thirty microliters of blood was immediately spotted on the DBS paper using a calibrated pipette and dried for about 2 h at room temperature. The DBS paper was stored in a sealed bag containing a silica gel at room temperature until the time for analysis. Data processing was performed on the results of AA and GA analysis in DBS samples of smokers and non-smokers. Significant differences between smokers and non-smoker subjects were obtained from statistical tests performed using the independent sample t-test and Mann–Whitney test.
Results and Discussion
Chromatography System and Sample Preparation
A triple quadrupole LC-MS/MS with multiple reaction monitoring (MRM) mode was used in this study because simultaneous analysis of AA and GA needed an analytical method that is both selective and sensitive. LC-MS/MS with triple quadrupole is accurate, sensitive, and comprehensive because it can detect the parent ions and fragments of parent ions after collision (daughter ion) at the same time.10 Multiple reaction monitoring gives a high selectivity and low interference because it monitors a predetermined precursor (parent) ion and product (daughter) ion pair.11
One of the key aspects of analyses in any biological matrix, especially blood, is the sample preparation method. A proper sample preparation method should be able to separate analytes from other biological components. The sample preparation method used in this study is described above. The method that was used is protein precipitation. It was chosen because it was rapid, adaptable to high throughput screening, and relatively simple.
Full Validation
The method used in this study is applied from a full validated method of AA and GA analysis in DBS using LC-MS/MS that was performed by Harahap et al.8 The method was validated according to FDA’s guidelines. All parameters tested were valid according to FDA guidelines. The method was also linear in the concentration range of 1–40 µg/mL. The results of accuracy-precision and matrix effect are shown in Table 1.
 |
Table 1 Accuracy-Precision and Matrix Effect |
Partial Validation
Partial validation was conducted to ensure that the modified bioanalytical method from Harahap et al7 was still valid. The partial validation parameters that were done in this study were within-run accuracy, precision, and calibration curve. The result showed that the parameters tested were within FDA requirements. The accuracy results showed that % diff value was in the range of −19.30% to 18.33% at LLOQ concentration and −11.49% to 14.15% at QCL, QCM, and QCH concentration for AA. The accuracy-test for GA was in the range of 3.49% to 19.01 at LLOQ concentration and −14.44% to 12.63% at all other concentrations. Furthermore, the result of the precision test for AA and GA respectively were in the range of 0.33% to 16.68% and 5.41% to 11.43%. These results are shown in Table 2. The calibration curves were linear at the concentration range of 1–40 µg/mL with the correlation coefficient (r) 0.9978 and 0.9971 for AA and GA, respectively.
 |
Table 2 Accuracy-Precision of Partial Validation |
Analysis of Acrylamide and Glycidamide in DBS of Smokers
The analysis results showed that all of the smoker’s samples contained AA and GA. Overall, the lowest AA concentration found was 3.91021 µg/mL in SP08, and the highest level was 10.2582 µg/mL in SP7. Meanwhile, the lowest concentration of GA was 1.0062 µg/mL in SP11, and the highest concentration was 3.5801 µg/mL in SP2. The chromatogram of the subject mentioned were shown in Figure 2. Figure 2A shows the sample of subject SP8, (B) sample of subject SP7, (C) sample of subject SP11, and (D) sample of subject SP2.
The average concentration of AA in the DBS samples of smokers was 6.8277 µg/mL, while the average GA concentration was 1.78768 µg/mL. AA and GA content in both smoker subjects and non-smokers control are summarized in Figure 1. Figure 1 shows the acrylamide and glycidamide contents in subjects. Figure 1A is the AA concentration in smokers and non-smokers, Figure 1B is the GA levels in the two groups of subjects.
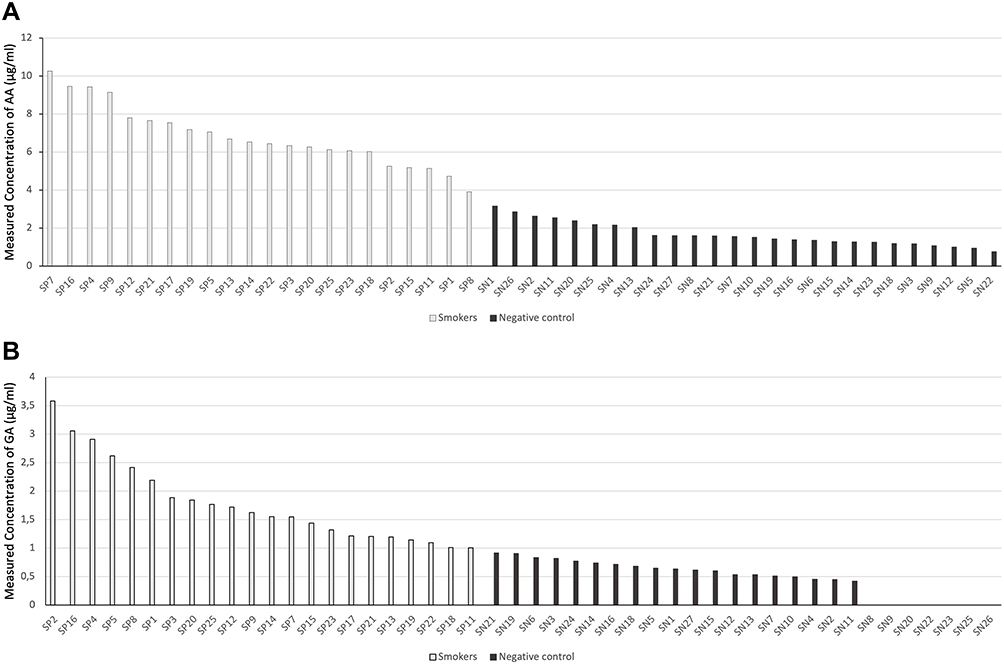 |
Figure 1 SP: Subject code for the subject group of smokers, SN: Subject code for the subject group of non-smokers. (A) Acrylamide levels in smokers and non-smokers, (B) Glycidamide levels in smokers and non-smokers. |
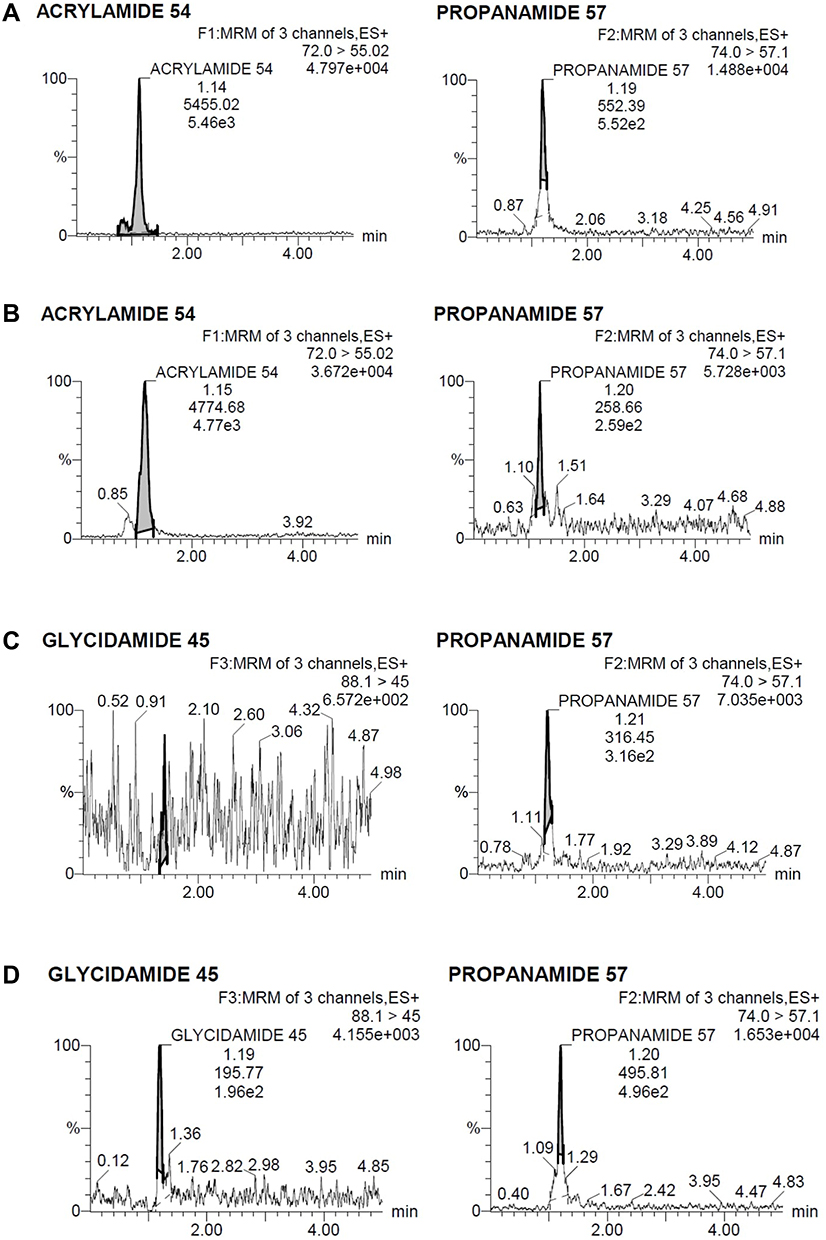 |
Figure 2 Chromatogram of the analytes in the smokers. (A) Sample of subject SP8, (B) sample of subject SP7, (C) sample of subject SP11, and (D) sample of subject SP2. |
The analysis results of non-smoker’s DBS samples showed that all of the samples contained AA in a certain concentration, but not all the samples contained GA. The AA and GA found in non-smoker’s DBS samples were much lower than those found in smoker subjects. The lowest AA concentration found was in the subject code of SN22, 0.7585 µg/mL, and the highest concentration was in the subject code of SN1, 3.1607 µg/mL. Seven of the non-smoker’s DBS samples showed no trace of GA. The highest GA concentration found was 0.9143 µg/mL in SN21. The average concentration of AA and GA in the DBS samples of non-smoker were 1.6722 µg/mL, and 0.4718 µg/mL, respectively. The chromatogram of non-smokers mentioned are shown in Figure 3. Figure 3 shows the chromatogram of the analytes in the non-smokers. Figure 3A is the sample of subject SN22, Figure 3B is the sample of subject SN1, and Figure 3C is the sample of subject SN21.
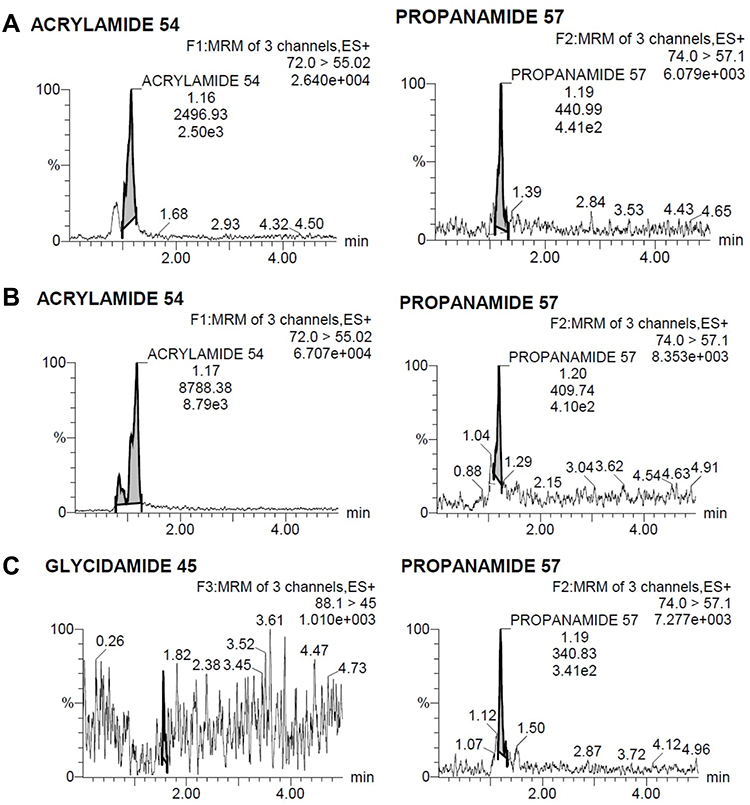 |
Figure 3 Chromatogram of the analytes in the non-smokers. (A) Sample of subject SN22, (B) sample of subject SN1, and (C) sample of subject SN21. |
This study found that cigarettes contribute to the increase of AA and GA concentrations in smoker subjects compared to non-smoker subjects. Based on the statistical test data, the significant value (p-value) between AA smokers and non-smokers was p < 0.05 and the significant value between GA smokers and non-smokers was p < 0.05. It can be concluded that there is a significant difference between AA and GA concentration in smokers and non-smokers. Smoker subjects have varying concentrations of AA and GA due to several factors such as differences in the number of cigarettes smoked, dietary intakes, genetic factors, and time since the exposure of acrylamide. The AA concentration in 1 cigarette is 1 µg or more.12 Besides cigarette smoke, a high amount of AA is also found in potato chips, French fries, and coffee.13
There are still small concentrations of AA and GA in non-smoker subjects even though they are not smoking a cigarette. This might occur due to consuming some foods that contain acrylamide. However, the concentrations of AA and GA in non-smokers were lower than in smoker subjects. SP7 is the smoker subject with the highest AA concentration. Based on the data obtained from the questionnaire about the habit of smoking and dietary intake as shown in Table 3, SP7 consumes the most foods that contain AA, has been an active smoker for a several years, is exposed to cigarette smoke from family, friends, and the environment. SP2 has the highest GA concentration, not SP7. This result is caused by the metabolism of AA in the human body. AA can be metabolized to GA by the enzyme CYP450 2E1 or can be conjugated with GSH to be excreted in urine.14,15 Because of this, not all AA will be converted into GA. However, at least 6% of AA is converted to GA.16 The enzyme activity in the human body as influenced by genetic factors and habits such as alcohol consumption and smoking, which cause enzymes to have different levels of catalytic activity. In addition, the T-allele of rs2480258 was found to reduce CYP2E1 activity and thus decrease its ability to convert AA into GA in the body.17 Therefore, the ratio of AA and GA are varying.
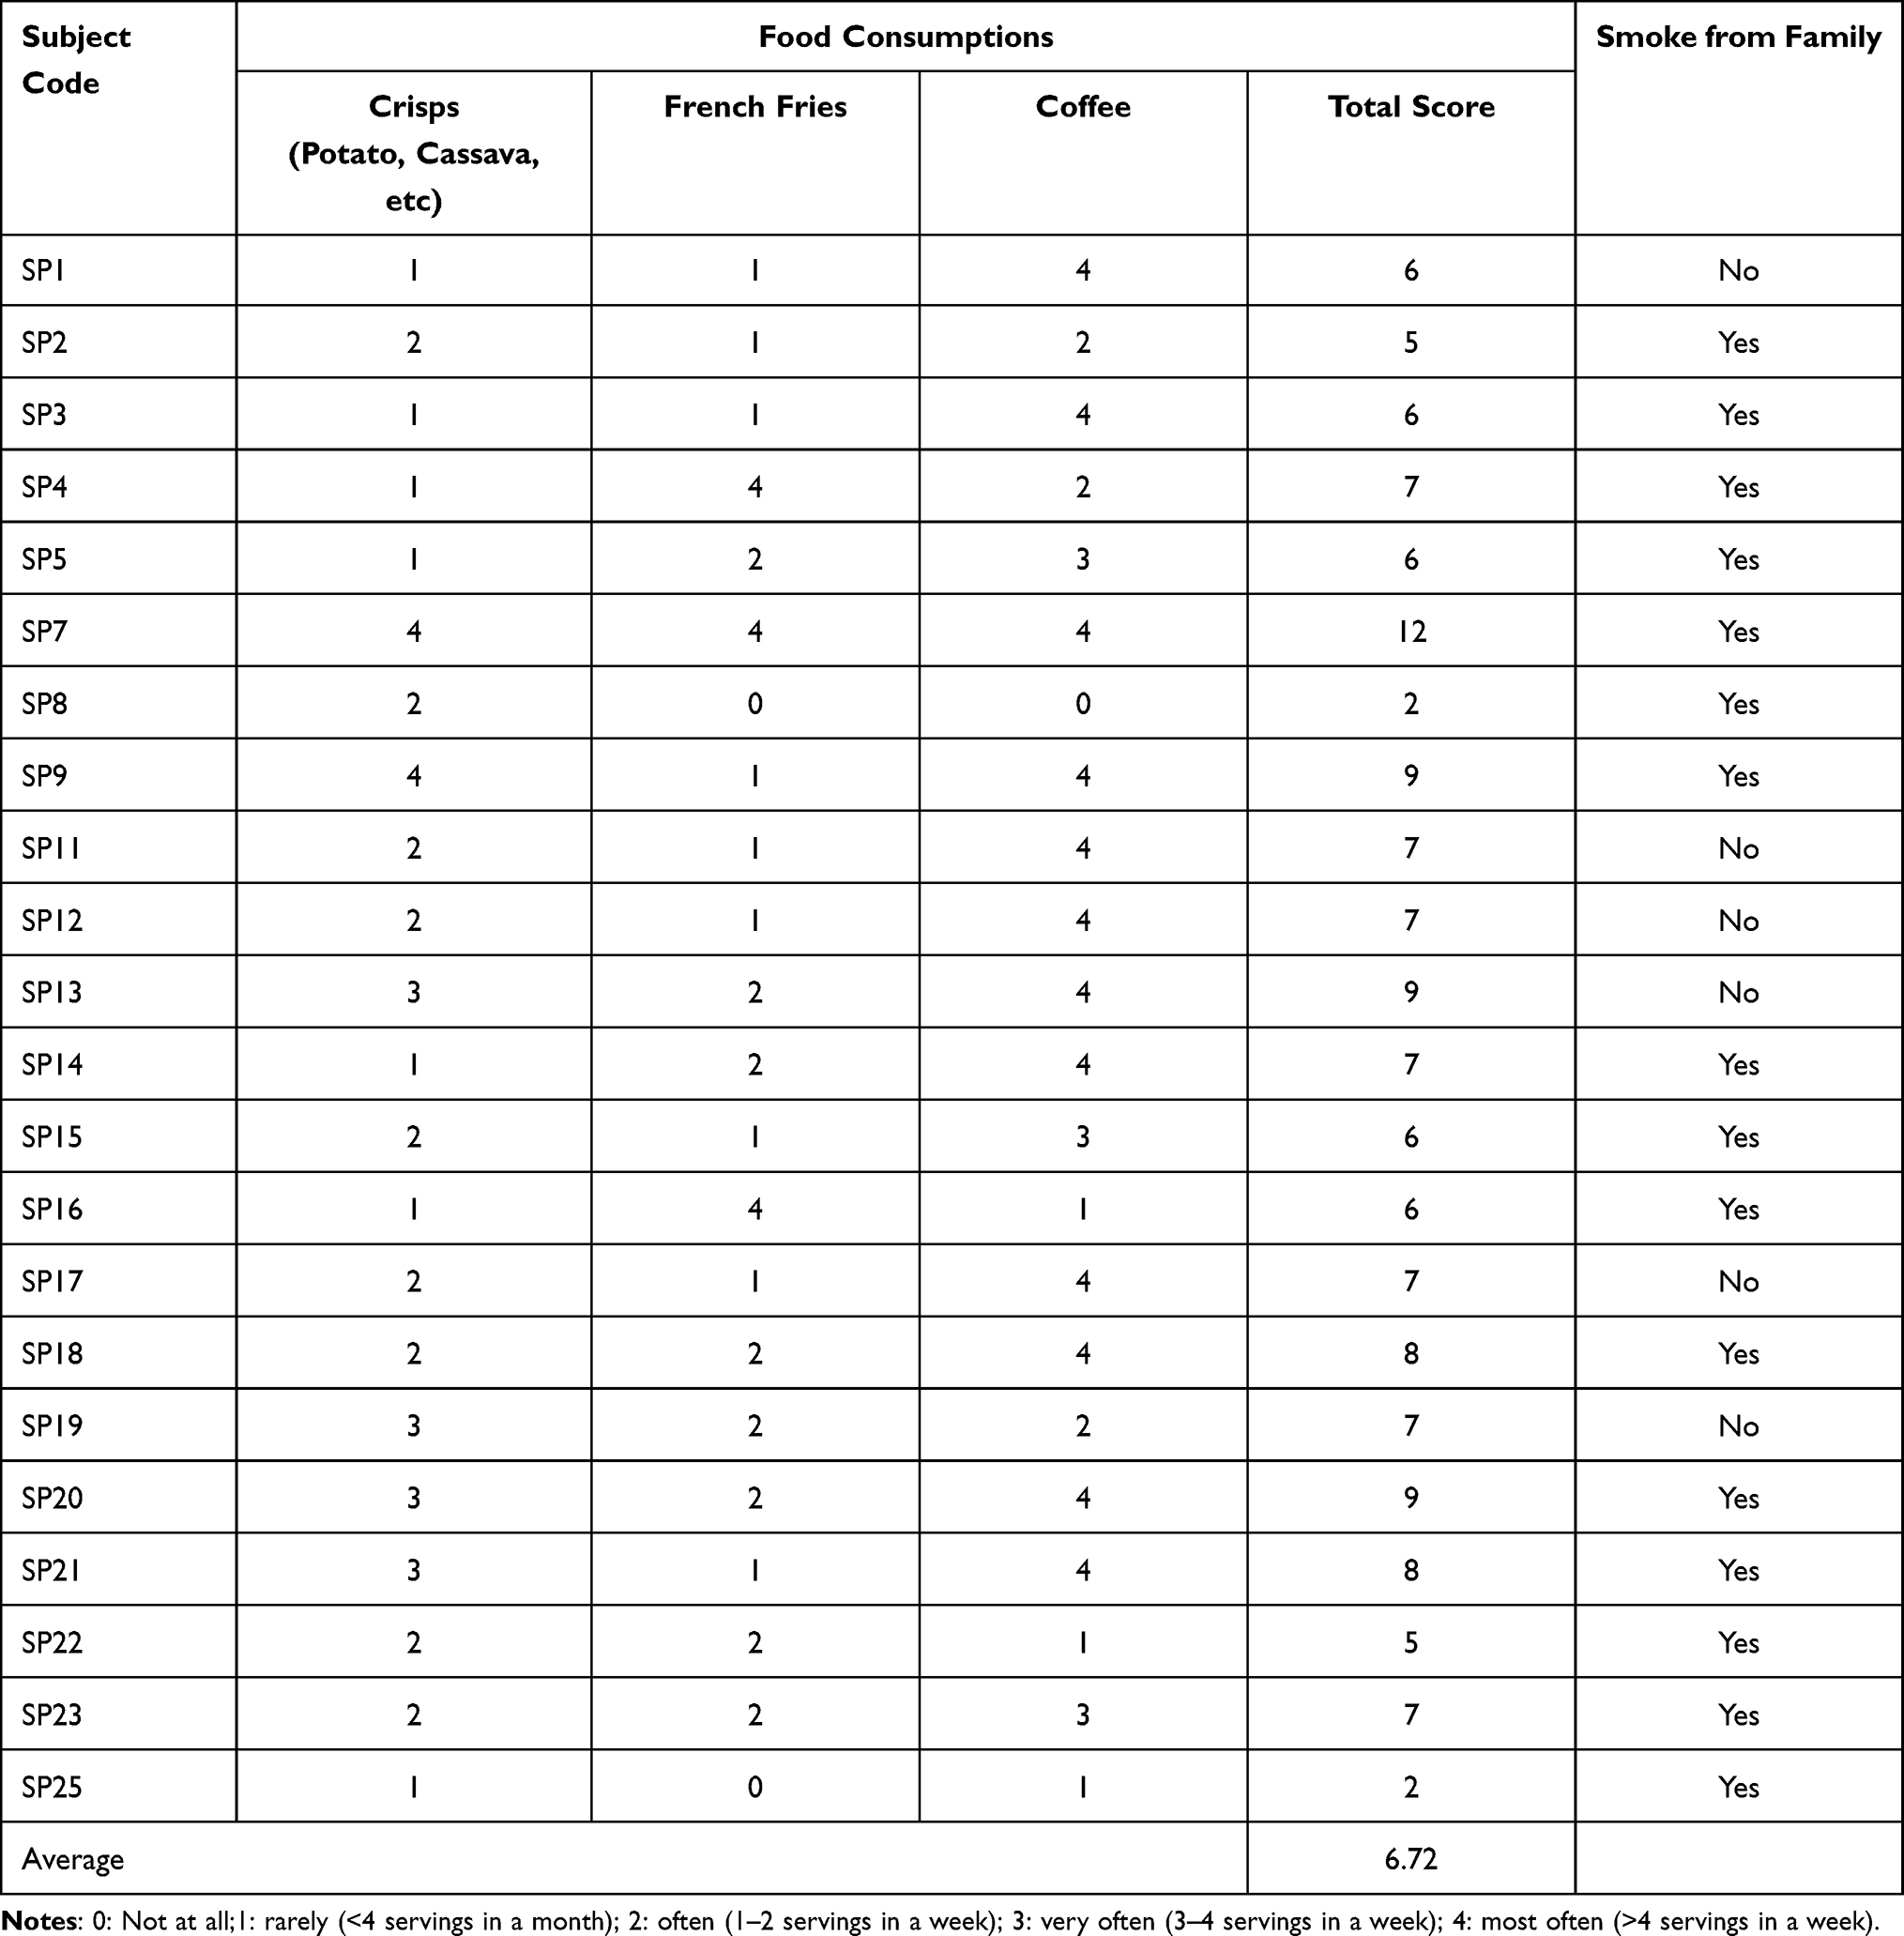 |
Table 3 Smoker Subject Eating Habit and Family Exposure |
Previously, there have been studies that analyze AA in DBS sample of lung cancer patients, though that study only analyzes AA without GA.7 The result of said study7 shows that there is no significant difference between AA levels of lung cancer patients and healthy subjects. This could be caused by factors such as patients have stopped smoking for some time, dietary intakes, etc. Besides GA, to predict risk of exposure from AA, N7-GA-guanine can also be used as a biomarker. However, there have not been any studies that uses N7-GA-guanine in DBS sample to predict AA exposure. DBS can also be used to analyze other compounds such as O6-methyl-guanine, a cyclophosphamide DNA adduct.18
Conclusion
The levels of AA in smoker subjects ranged from 3.91 µg/mL to 10.25 µg/mL of blood, and the GA is 1.006–3.58 µg/mL of blood. The significant value of both AA and GA between smokers and non-smokers was p < 0.05, which indicated that there is a significant difference between AA and GA concentration in smokers and non-smokers. In theory, acrylamide and glycidamide concentration should correlate. However, there are other factors (such as CYP2E1 polymorphism, dietary intake, etc) that can cause variation in their respective concentrations. These results suggest that DBS can be used to determine the concentration of AA and GA in human blood.
Ethical Approval
This study has obtained an ethical review from the Human Research Ethics Committee of Universitas Indonesia with the number KET-147/UN2.F1/ETIK/PPM.00.02/2020 which comply to the Declaration of Helsinki.
Informed Consent
All subjects signed the informed consent as a form of willingness to participate in the study. All subjects filled out the questionnaire about habits of smoking and consuming foods containing AA.
Acknowledgments
Directorate of Research and Community Services (DRPM) Universitas Indonesia, Depok, Indonesia, for the financial support of this research.
Disclosure
The authors report no conflicts of interest in this work.
References
1. World Health Organization. Country profile Indonesia WHO report on the global tobacco epidemic; 2019: 1–10. Available from: https://www.who.int/tobacco/surveillance/policy/country_profile/idn.pdf.
2. Zamani E, Shokrzadeh M, Fallah M, Shaki F. A review of acrylamide toxicity and its mechanism. Pharm Biomed Res. 2017;3(1):1–7. doi:10.18869/acadpub.pbr.3.1.1
3. Zhivagui M, Ng AWT, Ardin M, et al. Experimental and pan-cancer genome analyses reveal widespread contribution of acrylamide exposure to carcinogenesis in humans. Genome Res. 2019;29(4):521–531. doi:10.1101/gr.242453.118
4. Besaratinia A, Pfeifer GP. DNA adduction and mutagenic properties of acrylamide. Mutation Res. 2005;580(1–2):31–40. doi:10.1016/j.mrgentox.2004.10.011
5. Kim TH, Shin S, Kim KB, et al. Determination of acrylamide and glycidamide in various biological matrices by liquid chromatography-tandem mass spectrometry and its application to a pharmacokinetic study. Talanta. 2015;131:46–54. doi:10.1016/j.talanta.2014.07.042
6. Doerge DR, Young JF, McDaniel LP, Twaddle NC, Churchwell MI. Toxicokinetics of acrylamide and glycidamide in Fischer 344 rats. Toxicol Appl Pharmacol. 2005;208(3):199–209. doi:10.1016/j.taap.2005.03.003
7. Harahap Y, Elysia C, Starlin Z, Jayusman AM. Analysis of acrylamide in dried blood spots of lung cancer patients by ultrahigh-performance liquid chromatography tandem mass spectrometry. Int J Anal Chem. 2020;(2020:1–7. doi:10.1155/2020/2015264
8. Harahap Y, Hafidz A, Saputri FC. Bioanalytical method validation of acrylamide and glycidamide in dried blood spot using ultra high performance liquid chromatography tandem mass spectrometry. SRP. 2020;11(11):1192–1198.
9. FDA. Bioanalytical Method Validation Guidance of Industry. U.S. Department of Health and Human Services; 2018. Available from: https://www.fda.gov/files/drugs/published/Bioanalytical-Method-Validation-Guidance-for-Industry.pdf.
10. Wang EH, Combe PC, Schug KA. Multiple reaction monitoring for direct quantitation of intact proteins using a triple quadrupole mass spectrometer. J Am Soc Mass Spectrom. 2016;27(5):886–896. doi:10.1007/s13361-016-1368-2
11. Pang B, Zhu Y, Lu L, Gu F, Chen H. The applications and features of liquid chromatography-mass spectrometry in the analysis of traditional Chinese medicine. Evid Based Compl Altern Med. 2016;2016:1–7. doi:10.1155/2016/3837270
12. Moldoveanu SC, Gerardi AR. Acrylamide analysis in tobacco, alternative tobacco products, and cigarette smoke. J Chromatogr Sci. 2011;49:234–242. doi:10.1093/chrsci/49.3.234
13. FDA. Acrylamide and diet, food storage, and food preparation; 2017. Available from: https://www.fda.gov/food/chemicals/acrylamide-and-diet-food-storage-and-food-preparation.
14. Baker MK, Nagy TR, Barner S, Groopman J. Dietary acrylamide and human cancer: a systematic review of literature. Nutr Cancer. 2014;66:774–790. doi:10.1080/01635581.2014.916323
15. Wang P, Ji R, Ji J, Chen F. Changes of metabolites of acrylamide and glycidamide in acrylamide exposed rats pretreated with blueberry anthocyanins extract. Food Chem. 2019;274:611–619. doi:10.1016/j.foodchem.2018.08.058
16. Koszucka A, Nowak A, Nowak I, Motyl I. Acrylamide in human diet, its metabolism, toxicity, inactivation and the associated European Union legal regulations in food industry. Crit Rev Food Sci Nutr. 2019;60(10):1677–1692. doi:10.1080/10408398.2019.1588222
17. Pelle L, Carlsson H, Cipollini M, et al. The polymorphism rs2480258 within CYP2E1 is associated with different rates of acrylamide metabolism in vivo in humans. Arch Toxicol. 2018;92(6):2137–2140. doi:10.1007/s00204-018-2211-2
18. Harahap Y, Tanujaya AT, Nurahman F, Vianney AM, Purwanto DJ. Determination of O6-methylguanine in dried blood spot of breast cancer patients after cyclophosphamide administration. Heliyon. 2021;7:7. doi:10.1016/j.heliyon.2021.e07558
 © 2022 The Author(s). This work is published and licensed by Dove Medical Press Limited. The
full terms of this license are available at https://www.dovepress.com/terms.php
and incorporate the Creative Commons Attribution
- Non Commercial (unported, v3.0) License.
By accessing the work you hereby accept the Terms. Non-commercial uses of the work are permitted
without any further permission from Dove Medical Press Limited, provided the work is properly
attributed. For permission for commercial use of this work, please see paragraphs 4.2 and 5 of our Terms.
© 2022 The Author(s). This work is published and licensed by Dove Medical Press Limited. The
full terms of this license are available at https://www.dovepress.com/terms.php
and incorporate the Creative Commons Attribution
- Non Commercial (unported, v3.0) License.
By accessing the work you hereby accept the Terms. Non-commercial uses of the work are permitted
without any further permission from Dove Medical Press Limited, provided the work is properly
attributed. For permission for commercial use of this work, please see paragraphs 4.2 and 5 of our Terms.