")
Back to Journals » Journal of Inflammation Research » Volume 16
Analysis and Verification of Glycosylation Characteristics of Septic Acute Kidney Injury
Received 22 September 2023
Accepted for publication 28 November 2023
Published 5 December 2023 Volume 2023:16 Pages 5881—5897
DOI https://doi.org/10.2147/JIR.S437266
Checked for plagiarism Yes
Review by Single anonymous peer review
Peer reviewer comments 2
Editor who approved publication: Professor Ning Quan
Si Chen, Hua Gan
Department of Nephrology, The First Affiliated Hospital of Chongqing Medical University, Chongqing, 400016, People’s Republic of China
Correspondence: Hua Gan, Email [email protected]
Background: Septic acute kidney injury (S-AKI) results from an imbalance in the regulation of systemic inflammatory responses. Glycosylation plays an important role in inflammatory responses. However, the relationship between S-AKI and glycosylation is unclear.
Methods: The datasets of the public platform were analyzed using R language to obtain glycosylation-related differentially expressed genes (GRDEGs) in S-AKI. Gene Ontology (GO) and Kyoto Encyclopedia of Genes and Genomes pathway (KEGG) enrichment analyses were performed for GRDEGs. Hub genes were obtained using three machine learning algorithms and their diagnostic values were evaluated using receiver operating characteristic (ROC) curves. The relationships between the hub genes, immune cells, and signaling pathways were analyzed, and the upstream miRNAs, transcription factors, and compounds of the hub genes were predicted. Mouse models of AKI with sepsis were constructed and the expression of the hub genes was verified.
Results: We obtained 45 GRDEGs that were mainly enriched in glycoprotein metabolism and immune inflammatory response, such as “O-glycan biosynthesis”, “phagosome”, “pathogenic Escherichia coli infection”, “glycosyltransferase activity”, etc. Seven hub genes that have potential diagnostic value were identified and were associated with the regulation of immune cells. Through gene set enrichment analysis (GSEA) of hub genes, it was found that these genes may be involved in metabolism, signaling transduction, and inflammation-related signaling pathways, such as “metabolism of amino and derivatives”, “RHO GTPase cycle”, “transport of small molecules”, “neutrophil degranulation”, “immune system”, etc. We then predicted 100 miRNAs, 60 TFs, and 23 compounds of the hub genes using forecasting tools. Finally, animal experiments confirmed the differential expression of ASGR1, UMOD, SPTBN1, and ADAMTS17.
Conclusion: This study identified and validated four biomarkers associated with abnormal glycosylation that could be potential targets for AKI in sepsis.
Keywords: acute kidney injury, sepsis, glycosylation, hub genes, bioinformatics
Introduction
Severe sepsis frequently presents with multiorgan dysfunction, with the kidneys being particularly susceptible. The mortality rate of sepsis accompanied by acute kidney injury (AKI) is much higher than that without AKI, resulting in a significant societal and medical burden.1,2 Consequently, the timely diagnosis and treatment of AKI in sepsis are of utmost importance. Several early markers of renal injury, such as NGAL and KIM-1, have improved early detection of AKI. However, additional biomarkers are needed to predict the severity of AKI in sepsis.3 Moreover, current treatments are mainly symptomatic, including anti-infective measures and fluid replacement, and there is still a lack of targeted therapies. Although the concept of regulating inflammation in sepsis has great theoretical potential, previous attempts at targeted immune regulation of inflammatory mediators have been unsuccessful.4,5 Consequently, it is necessary to understand the mechanisms of inflammation regulation and propose novel approaches to diagnose and treat AKI in sepsis.
The regulation of glycosylation during inflammation has become a hot topic. Several studies have explored the role of glycosylation in acute inflammation. Significant abnormalities in glycosylation have been observed in the pathological process of sepsis, the main features of which are decreased GlcNAc separation and increased core 1/3o-glycans.6,7 Studies have also described subtypes of glycoproteins, such as alpha-1-antichymotrypsin and IgG.8–10 In patients with severe coronavirus disease-2019 (COVID-19) infection, high concentrations of afucosylated IgG antibodies amplify proinflammatory cytokine release and acute phase responses; therefore, antibody glycosylation plays a key role in the immune response to enveloped viruses, including in COVID-19.11 These glycosylation abnormalities have been found to have a significant correlation with the prognosis of the patient.12,13 Furthermore, the impact of abnormal glycosylation facilitated by glycoproteins on the release of high-mobility proteins and their consequential effects on the inflammatory response have been acknowledged.14 Proinflammatory cytokines have been shown to modify the synthesis pathways of substrates and the expression of glycosyltransferases necessary for N-glycan biosynthesis. Consequently, these alterations in N-glycosylation can effectively regulate multiple facets of immune cell processes, such as pathogen recognition and micro-inflammatory response. This contributes to the development and progression of the disease.15
Despite the evident alterations in glycosylation observed in sepsis, there is a lack of literature on the involvement of abnormal glycosylation in AKI. This study aimed to use high-throughput sequencing data to identify and analyze differentially expressed glycosylation-related genes in septic AKI (S-AKI). Furthermore, our objective was to investigate their potential biological functions and propose potential targets for diagnosis and treatment.
Materials and Methods
Collection and Processing of the S-AKI Dataset
Through the NCBI Gene Expression Omnibus database, with the keywords “sepsis, AKI”, we searched the datasets that meet the requirements: GSE122274, GSE139061, including high-throughput kidney tissue mRNA sequencing data from 27S-AKI samples and nine control samples. The platform for this dataset was GPL20301. Using the R packages “limma” and “sva”, we merged the GSE122274 and GSE139061 datasets and removed the batch effect; we used the R packages “FactoMineR” and “factoextra” to draw and use the R language preprocessCore package to normalize the datasets.
Screening and Enrichment Analysis of Differentially Expressed Genes (DEGs)
Using the R language limma package to analyze DEGs between S-AKI and control and screen differential genes according to the criteria of |logFC|>1, adj.P.Val<0.05. The R language “clusterProfiler” package was used to perform Gene Ontology (GO) annotation and Kyoto Encyclopedia of Genes and Genomes (KEGG) enrichment analyses of the DEGs. GO annotations are displayed for biological processes (BP), cell components (CC), and molecular functions (MF).
Glycosylation-Related Differentially Expressed Genes (GRDEGs) and Enrichment Analysis
The datasets related to glycosylation were retrieved from the molecular signature database (MSigDB, http://www.gsea-msigdb.org/gsea/msigdb/), and the above DEGs were extracted for intersection with the glycosylation dataset. The DEGs obtained by the intersection were subjected to GO annotation and KEGG enrichment analysis, and the STRING database (https://string-db.org/) was used to make PPIs.
Hub Genes Based on Machine Learning Algorithm
Three machine learning methods with R language were used to screen the hub genes: LASSO regression, random forest, and support vector machine (SVM). Subsequently, the intersection of the genes obtained from these three models was analyzed. Diagnostic performance was evaluated using the receiver operating characteristic (ROC) and AUC.
Immune Cell Infiltration
We evaluated the degree of immune cell infiltration (ssGSEA function of R language GSVA package) to analyze the correlation of immune cell infiltration in samples, the difference in immune cell infiltration between the S-AKI and control groups, and the correlation between the hub genes and immune cell infiltration.
Single-Gene Correlation Analysis
A correlation analysis was performed between the hub genes and all genes. Heat maps were used to display the expression of correlated top 50 genes, and the R language clusterProfiler package was used to perform gene set enrichment analysis (GSEA) of each hub gene.
miRNA/Transcription Factor-Hub Gene
The RegNetwork database (https://regnetworkweb.org/) was used to predict miRNAs and transcription factors (TFs) upstream of the hub genes.
Hub Gene-Compound Network Analysis
Possible binding compounds for the hub genes were analyzed using the NetworkAnalyst database (https://www.networkanalyst.ca/).
Animal Experiments
All animal experiments were approved by the Three Gorges Hospital Affiliated to Chongqing University. A total of 10 male C57BL6/J mice were purchased, of which five were injected with LPS 10 mg/kg and assigned to the experimental group, and the other five were injected with normal saline and assigned to the control group. Blood and kidney tissues were collected 24 h later. Blood samples were tested using a fully automated biochemical detector to detect urea nitrogen and creatinine levels (Hitachi Co., Ltd., Tokyo, Japan). Part of the kidney tissue was prepared as paraffin sections and H&E staining was performed. Another suitable kidney tissue was taken for qRT-PCR and finally calculated using the 2−ΔΔct method by the relative mRNA expression levels. Primers of hub genes were designed using Primer BLAST (http://www.ncbi.nlm.nih.gov), and primer sequences in Supplementary Table 1.
Results
DEGs and Enrichment Analysis in S-AKI
First, the two datasets were combined, and the batch processing effect was eliminated (Figure 1A and B). The two datasets were normalized and presented as boxplots before and after homogenization (Figure 1C and D). By analyzing high-throughput transcriptome sequencing data of 27 patients with S-AKI and nine normal controls, the DEGs were screened with |logFC|>1, adj.P.Val<0.05, which included 1172 upregulated genes and 1010 downregulated genes. A heat map (Figure 1E) and volcano map (Figure 1F) were used to visualize the downregulated and upregulated genes. GO enrichment analyses were performed on these DEGs (Figure 2A–C), which appeared to be closely related to cell composition and function, such as “small molecule catabolic process”, “apical part of a cell”, and “metal ion transmembrane transporter activity”. Furthermore, KEGG (Figure 2D) was related to metabolism, such as “glycolysis/gluconeogenesis”, and “glycine, serine, and threonine metabolism”.
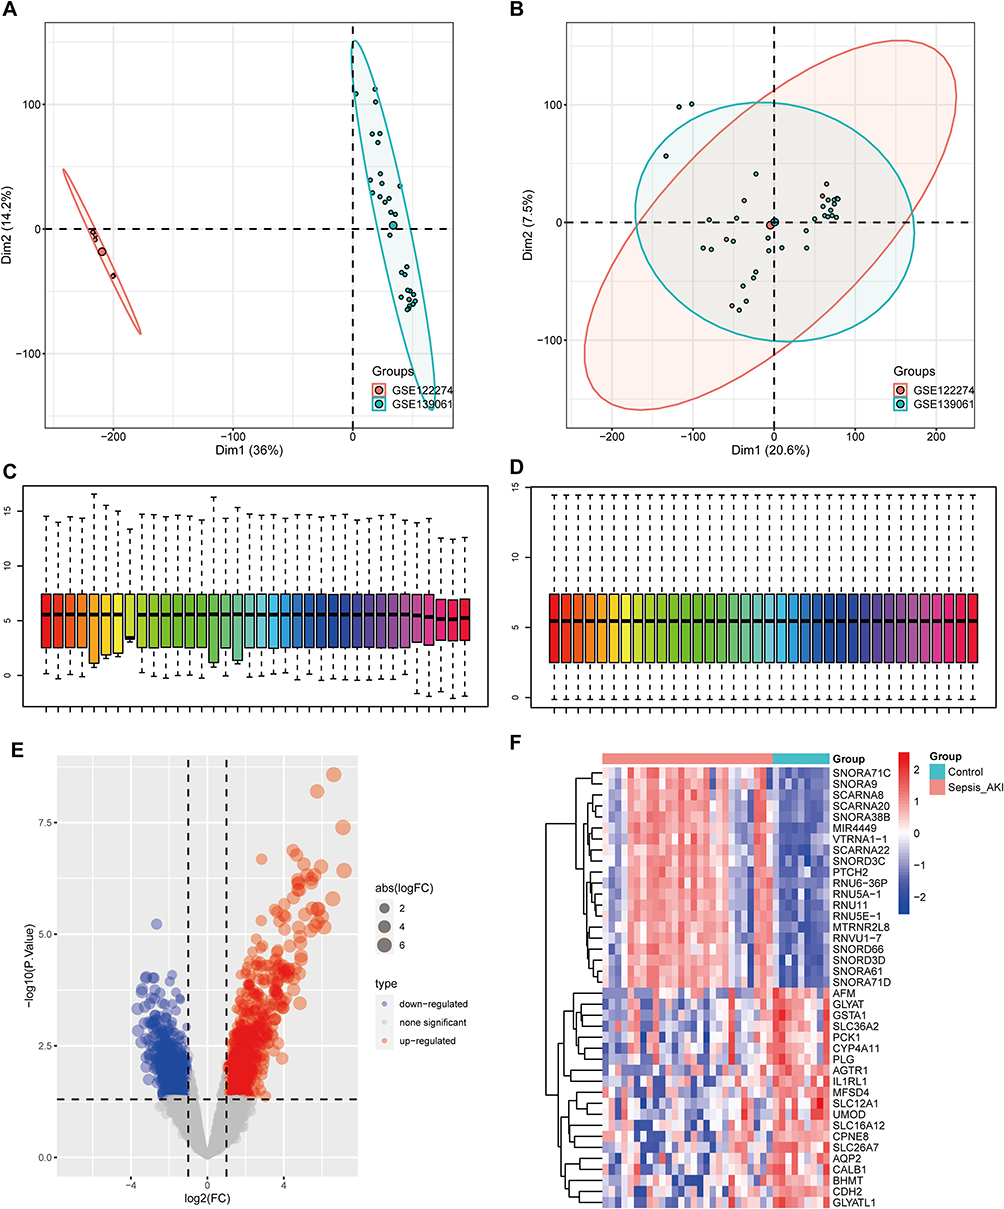 |
Figure 1 Differentially expressed genes (DEGs) in septic acute kidney injury (S-AKI). (A and B) Principal component analysis (PCA) before and after elimination of batch effects. (C and D) Gene expression level statistics of the dataset before and after homogenization. (E) Volcano map showing DEGs between S-AKI and control. (F) Heatmap showing DEGs between S-AKI and control. |
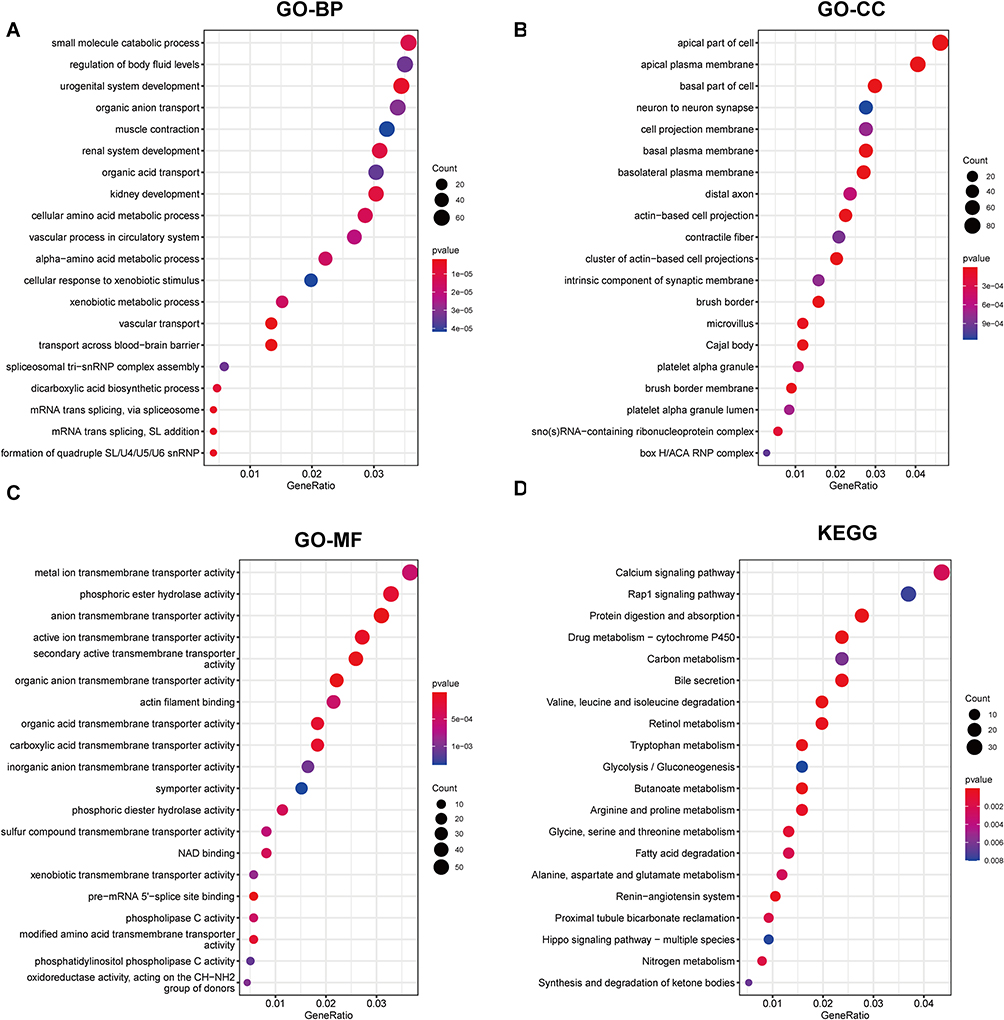 |
Figure 2 Enrichment analysis in DEGs. (A–C) GO annotations, which include BP, CC, and MF. (D) KEGG. |
Differential Expression and Enrichment Analysis of Glycosylation-Related Genes
The glycosylation-related DEGs were represented by a volcano map (Figure 3A) and heat map (Figure 3B), and a boxplot was used to show specific expressions (Figure 3C). The above DEGs and glycosylated datasets were intersected to obtain 45 GRDEGs, of which 14 were upregulated (Figure 4A) and 31 were downregulated (Figure 4B). We performed GO and KEGG enrichment analyses on GRDEGs using R software to identify the potential functions of glycosylation-related genes in the development of AKI in sepsis. BP analysis showed that these genes were related to glycoprotein metabolism, protein glycosylation modification, and glycoprotein biosynthesis in the S-AKI group. In CCs, these genes were involved in the endoplasmic reticulum-Golgi intermediate compartment, coated vesicles, and anchored components of the membrane. For MF, these genes were involved in certain key functions, such as “glycosyltransferase activity”, “hexosyltransferase activity”, and “structural constituent of the cytoskeleton” (Figure 4C). Furthermore, the KEGG pathway enrichment analysis showed that these genes were related to other types of O-glycan biosynthesis, proteoglycans in cancer, and phagosomes (Figure 4D). The corresponding relationships between KEGG’s top 5 pathways and the GRDEGs were found (Figure 4E). The interactions between these 45 GRDEGs were shown through a network of protein-protein interactions (PPI) (Supplementary Figure 1).
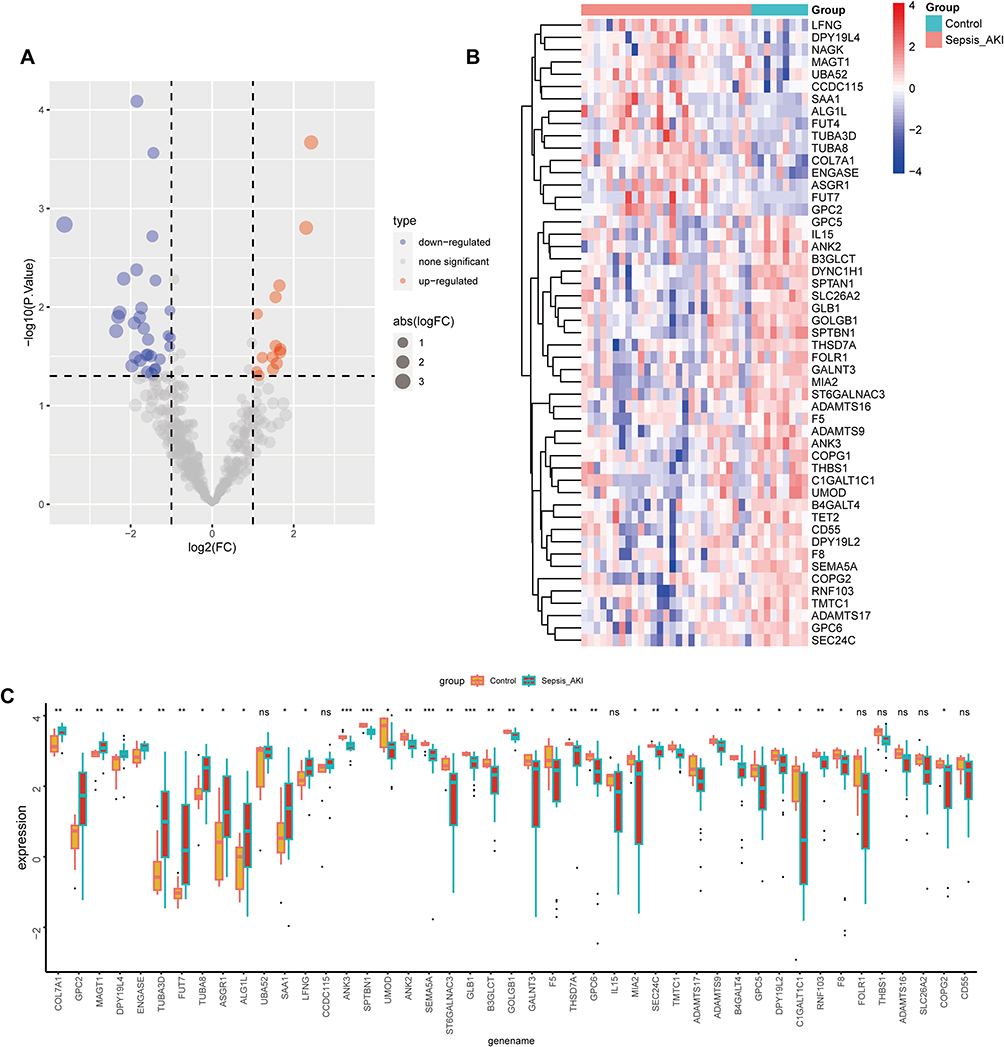 |
Figure 3 Glycosylation-related DEGs (GRDEGs) in S-AKI. (A and B) Volcano and heat map of GRDEGs in S-AKI. (C) The expression of 45 GRDEGs in S-AKI. *p<0.05, **p<0.01, ***p<0.001. |
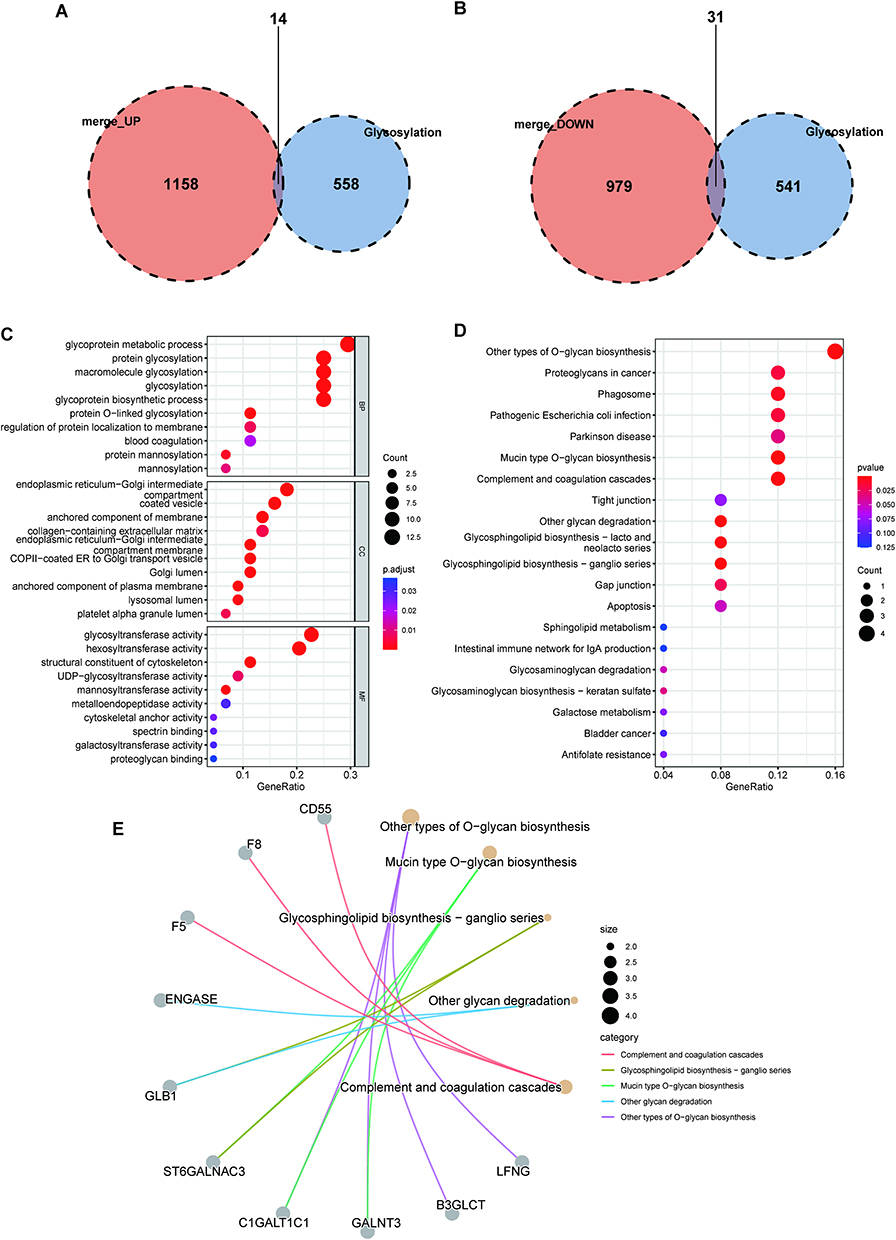 |
Figure 4 Enrichment analysis of GRDEGs. (A) Venn diagram of glycosylation-related genes and upregulated DEGs. (B) Venn diagram of glycosylation-related genes and downregulated DEGs. (C) The GO annotation of GRDEGs. (D) The KEGG analysis of GRDEGs. (E) The correlation between the top 5 KEGG pathway with GRDEGs. |
Hub Genes Based on Machine Learning Algorithm
Three machine learning algorithms were used to select the hub genes among the GRDEGs in S-AKI. LASSO regression (R package glmnet) was used to select 11 genes (Figure 5A), random forest (R language random forest) was used to select 15 genes (Figure 5B), and SVM (R package kernlab) was used to select 45 genes (Figure 5C). Seven hub genes were obtained by the intersection of three machine learning methods, namely, ENGASE, ANK3, UMOD, COL7A1, SPTBN1, ADAMTS17, and ASGR1. Hub genes were visualized with a Venn diagram (Figure 5D), showing correlations between the seven hub genes (Figure 5E).
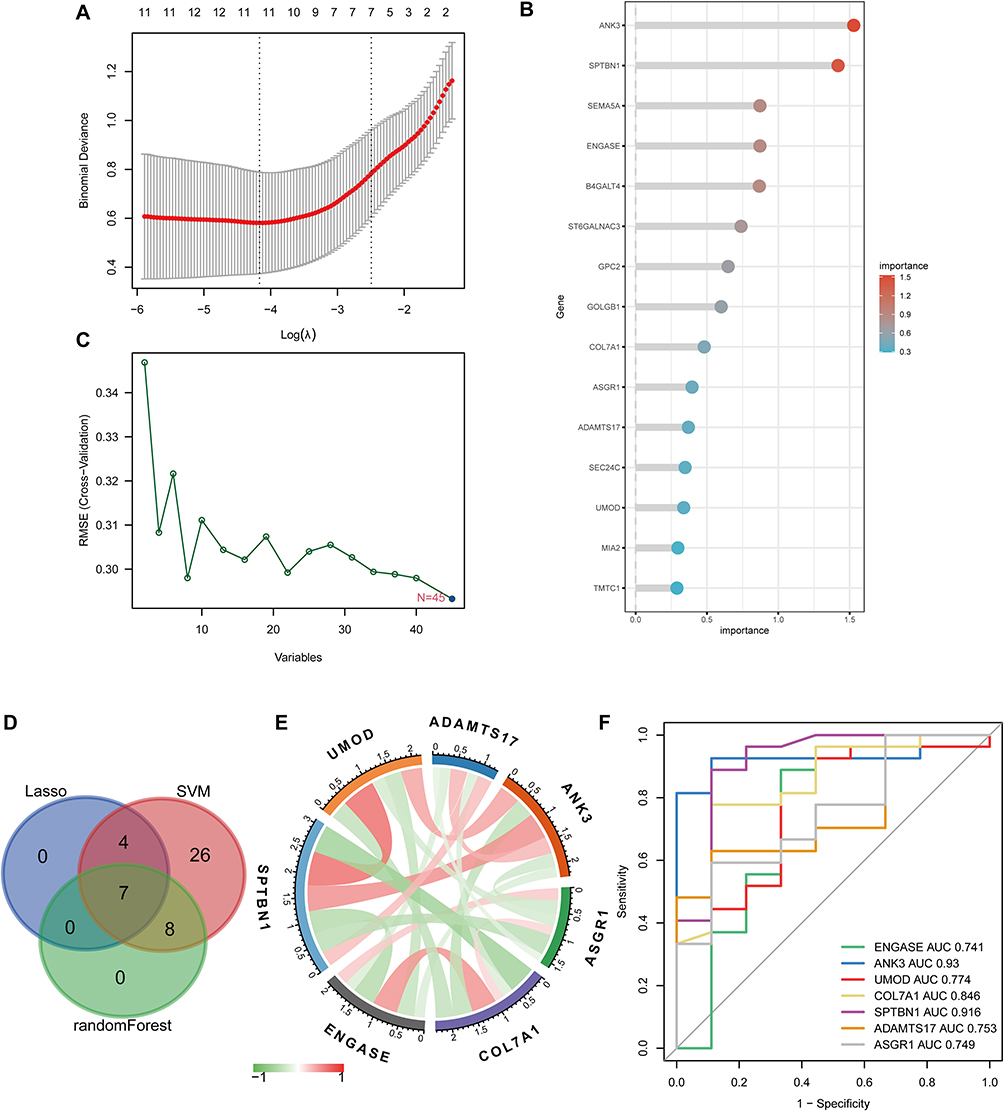 |
Figure 5 Hub genes selection based on machine learning algorithms. (A) LASSO regression screened for 11 genes. (B) Random forest screened for 15 genes. (C) SVM screened for 45 genes. (D) Venn diagram showing the hub genes shared by LASSO, random forest, and SVM-RFE algorithms. (E) The correlation between the 7 hub genes. (F) ROC curve of 7 gene signatures in S-AKI diagnosis. |
ROC Curve Analysis
ROC curve analysis was performed to further verify the diagnostic value of these glycosylation-related hub genes for S-AKI. The AUCs of these seven hub genes were all greater than 0.70, indicating that they have good specificity and sensitivity and can be used as diagnostic markers for AKI in sepsis (Figure 5F).
Distribution Patterns of Immune Cell Subtypes
The correlation between immune cell infiltration in individual samples is shown in Figure 6A. Individual differences in the proportion of immune cells were observed between the two groups. The proportion of macrophages and mast cells in the S-AKI group was significantly higher than in the normal group, while the proportion of type 2 T helper cells was lower than in the normal group (Figure 6B). ANK3 expression was negatively correlated with macrophages. ASGR1 was negatively correlated with type 2 T helper cells. COL7A1 was positively correlated with mast cells and macrophages. ENGASE expression was negatively correlated with type 2 T helper cells. SPTBN1 expression was positively correlated with type 2 T helper cells and negatively correlated with mast cells and macrophages. UMOD expression was negatively correlated with the number of macrophages (Figure 6C).
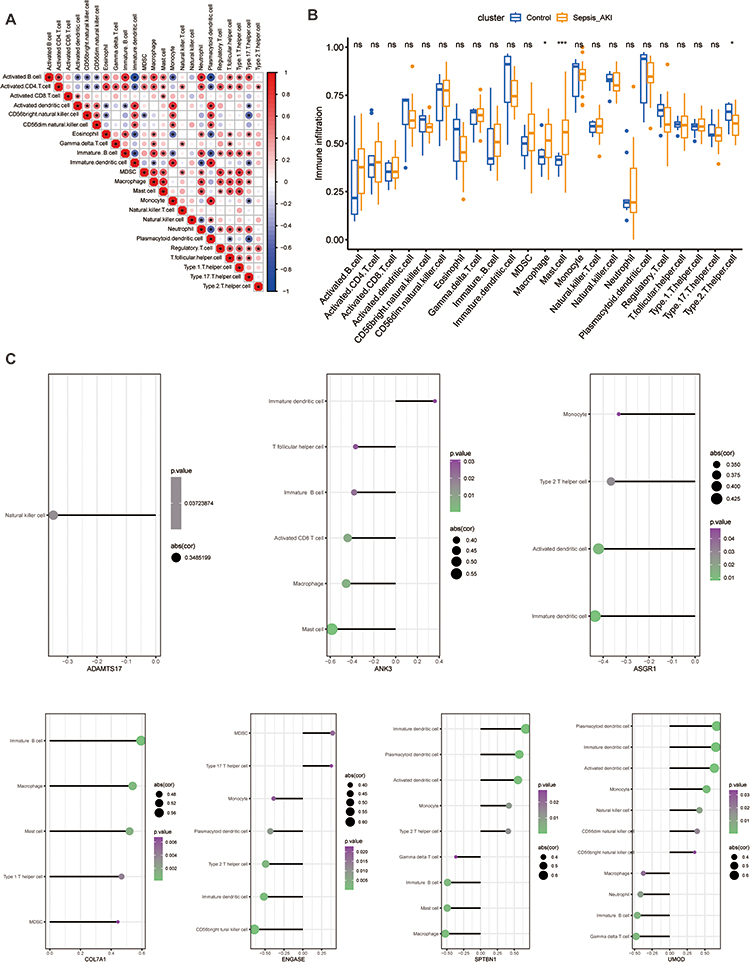 |
Figure 6 The characteristics of immune cell infiltration between the S-AKI and control groups. (A) Demonstrate the correlation of immune cell infiltration in S-AKI. (B) Differences in immune cell infiltration between the S-AKI and control groups. *p<0.05, ***p<0.001. (C) The correlation of 7 hub genes with immune cell infiltration. |
Single-Hub Gene Correlation Analysis and GSEA Analysis
Correlation analyses between the seven hub genes and all genes were performed, and the expression of the correlated top 50 genes was shown using heat maps (Figure 7). Signaling pathways related to hub genes were identified using GSEA (Figure 8). SPTBN1 and UMOD were enriched in “metabolism” and “metabolism of RNA”, and ENGASE was enriched in “metabolism of amino and derivatives”. ADAMTS17 was enriched in “inter-Golgi and retrograde Golgi-to-ER traffic”, ANK3 was enriched in “RHO GTPase cycle”, “transport of small molecules”, ASGR1 was enriched in “RHO GTPase cycle”, “neutrophil degranulation”, “immune System”, COL7A1 was enriched in “mitochondrial protein import”.
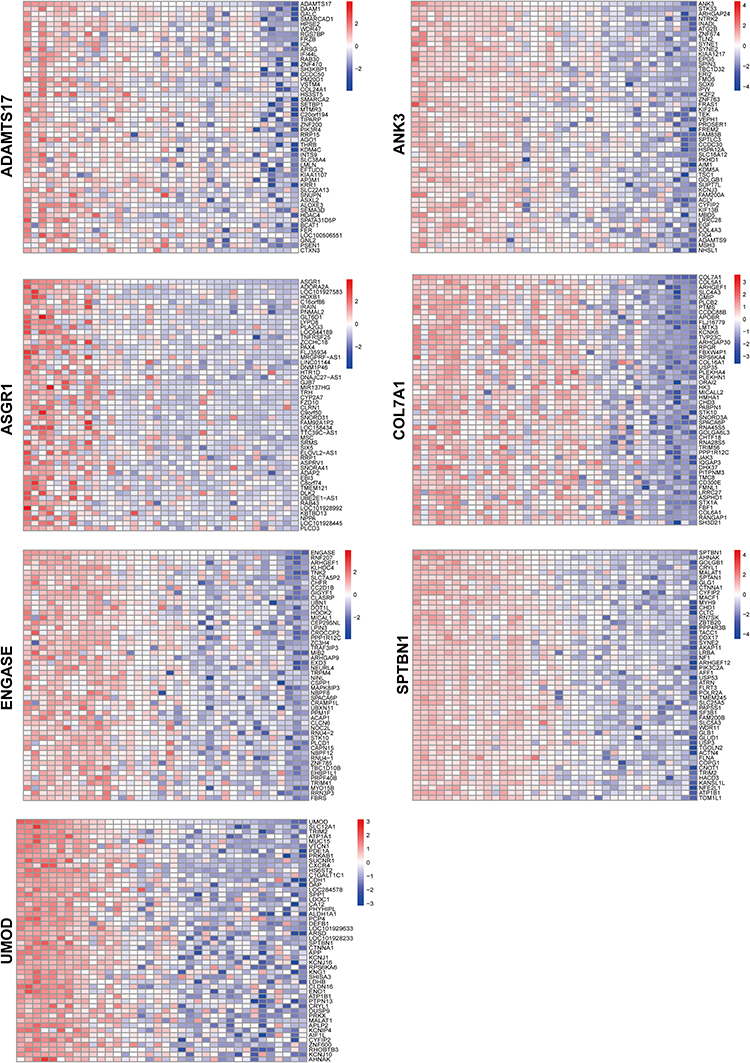 |
Figure 7 The heat map of correlation analysis related hub genes. |
 |
Figure 8 The Gene Set Enrichment Analysis (GSEA) of hub genes in S-AKI. |
miRNA/Transcription Factor-Hub Gene
The RegNetwork database was used to predict miRNAs and TFs upstream of the hub genes. Finally, we identified 100 miRNAs from seven common hub genes and 115 mRNA-miRNA pairs. We identified 60 TFs for seven common hub genes and 78 mRNA-TF pairs. Based on the predicted results, a co-expression network of mRNAs and miRNAs consisting of 107 nodes and 115 edges and mRNAs and TFs expression network consisting of 67 nodes and 78 edges were constructed using the RegNetwork database (Figure 9). There were 14 miRNAs and 16 TFs modulating ADAMTS17, 20 miRNAs and 23 TFs modulating ANK3, 19 miRNAs and 16 TFs modulating COL7A1, 43 miRNAs and 14 TFs modulating SPTBN1, 19 miRNAs AND 2TFs modulating UMOD, 5TFs modulating ASGR1, and 2TFs modulating ENGASE.
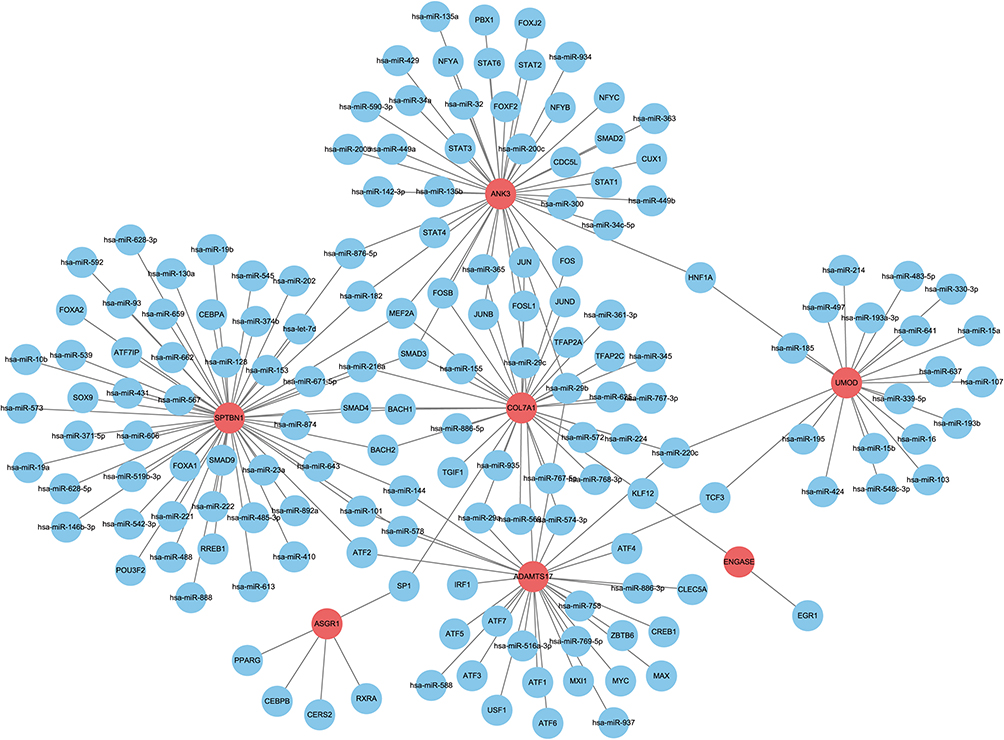 |
Figure 9 The miRNAs-mRNA and TFs-mRNA network diagram. |
Hub Gene-Compound Network Analysis
Using the NetworkAnalyst database (https://www.networkanalyst.ca/), we screened 23 drugs that simultaneously targeted two or more hub genes and constructed a hub gene-compound network map containing 30 nodes (23 drugs and seven hub genes) (Figure 10). From this network map, we obtained a potential hub gene drug. For example, quercetin downregulated ENGASE expression, while ASGR1 and ADAMTS17 expressions were upregulated. Acetaminophen targets COL7A1 and ASGR1 and upregulated them. Dexamethasone targets COL7A1 and SPTBN1 and upregulated them. In addition, the anti-rheumatic agents cyclosporine and trichostatin A were also targets of these hub genes.
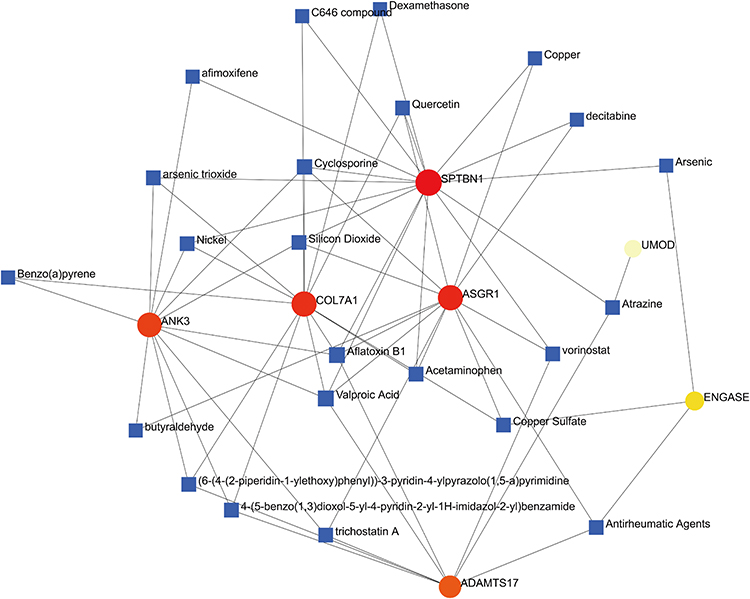 |
Figure 10 Gene-compound network diagram. |
The Validation of DEARGs in Animal Experiments
An animal model of S-AKI was effectively constructed, as evidenced by significantly elevated levels of blood urea nitrogen and creatinine in the model group compared to the control group, as supported by statistical analysis (Figure 11B). Histological examination by H&E staining revealed significant tubular epithelial cell swelling and infiltration of inflammatory cells in S-AKI (Figure 11A). qRT-PCR analysis revealed that ASGR1 gene expression was upregulated and the expression of the UMOD, SPTBN1, and ADAMTS17 genes was downregulated in S-AKI. The expression levels of ENGASE, ANK3, and COL7A1 did not differ significantly (Figure 11C).
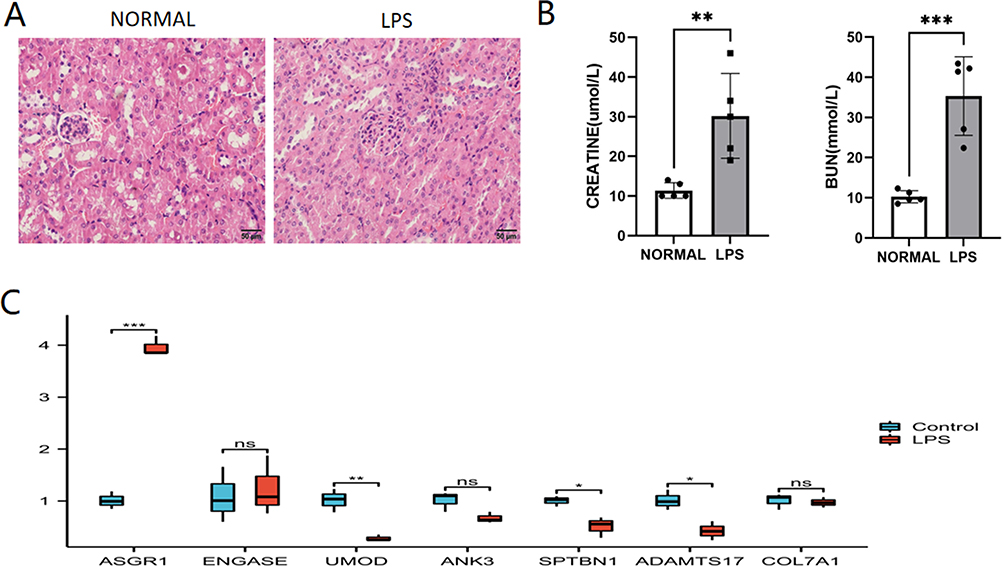 |
Figure 11 The validation of GRDEGs in animal experiments. (A) HE staining of S-AKI. Scale bar: 50um. (B) BUN and creatinine levels in mouse normal and LPS groups. (C) qRT-PCR analysis of the hub genes. Student’s t-test. Data shown mean ± SEM, n = 5. *P<0.05; **P<0.01;***P<0.005. |
Discussion
In recent years, there has been an increasing focus on the role of glycosylation abnormalities in kidney disease. Specifically, in IgA nephropathy, galactose-deficient IgA1 (Gd-IgA1) has been observed in partial O-glycans of circulating IgA1 in patients, as well as in the evaluation of glomerular mesangial immune deposits.16 Additionally, in an investigation of the pathogenesis of diabetic nephropathy, it was observed that inadequate blood sugar regulation could disrupt the N-glycosylation process, which, in turn, could alter protein functionality and contribute to the development of diabetic nephropathy.17,18 Santorelli et al used LC-MS/MS to qualitatively and quantitatively assess urinary N-glycoproteins at various stages of clear-cell renal cell carcinoma and in control subjects. These findings revealed notable discrepancies in certain glycoproteins that influence the occupancy of glycosylation sites between patients and controls.19
However, there is a lack of studies on the characteristics of glycosylation abnormalities, specifically in the cases of AKI that occur in sepsis. Utilizing microarray technology and bioinformatics analysis in the field of medicine allows the identification of genetic alterations at the gene level in various diseases, thus facilitating the exploration of the pathogenesis of the disease.20,21 This study aimed to analyze the genetic changes related to glycosylation in cases of AKI that occur in sepsis with the aim of uncovering the underlying pathophysiological mechanisms using bioinformatic techniques.
Initially, by performing an enrichment analysis on genes that show differential expression in the context of AKI caused by sepsis, we observed a significant enrichment in the pathways of “glycolysis/gluconeogenesis” and “glycine, serine, and threonine metabolism”. This finding implied that DEGs were actively involved in the metabolic processes of glucose and amino acids.
When DEGs were intersected with glycosylation-related genes, we identified 45 DEGs associated with AKI glycosylation during sepsis. To further explore the roles of glycosylation-related genes in AKI and sepsis, KEGG and GO analyses were performed. These DEGs were mainly enriched in KEGG analysis in “other types of O-glycan biosynthesis”, “proteoglycans in cancer”, “phagosome”, and “pathogenic Escherichia coli infection”, suggesting that glycosylation was involved in the immune inflammatory response. Meanwhile, DEGs in the GO analysis were mainly enriched in the “glycoprotein metabolic process”, “endoplasmic reticulum-Golgi intermediate compartment”, and “glycosyltransferase activity”, suggesting that these genes may play a role in regulating glycoprotein metabolism and glycosyltransferase activity. We speculated that these glycosylated DEGs mainly affect glycoprotein metabolism through glycosyltransferases and participate in the regulation of inflammatory immune responses.
LASSO regression, random forest, and SVMs are important tools for machine learning, have good classification and predictive performance, and are widely used in the diagnosis of diseases and medical assistance.22–24 In this study, a combination of the LASSO regression model, random forest, and SVM-RFE algorithm was used to select the candidate biomarkers with the highest diagnostic value: ENGASE, ANK3, UMOD, COL7A1, SPTBN1, ADAMTS17, and ASGR1; we also used ROC curves to evaluate the diagnostic ability of the hub genes in S-AKI. These seven genes (ENGASE, ANK3, UMOD, COL7A1, SPTBN1, ADAMTS17, and ASGR1) may be able to diagnose S-AKI with good specificity and sensitivity. Finally, we determined the differential expression of ASGR1, UMOD, SPTBN1, and ADAMTS17 in animal experiments.
These hub genes are currently less studied in AKI in sepsis but have been studied in other kidney diseases. ANK3 was distributed in the proximal and distal convoluted tubules of the kidney and was expressed in the renal tissues of patients with kidney cancer, and the abundance of ANK3 in kidney cancer tissues was positively correlated with the prognosis.25 The gene encoding uromodulin illustrates how a kidney-specific protein of major physiological importance is involved in a spectrum of kidney disorders.26 The in vitro knockdown of COL7A1 expression significantly affected ccRCC cell migration.27 SPTBN1 abrogates renal clear-cell carcinoma progression via glycolytic reprogramming in a GPT2-dependent manner.28 ASGR1 could regulate the differentiation of monocytes into macrophages through the NF-κB/ATF5 pathway, thus promoting liver injury in patients with sepsis.29
For the correlation analysis of the hub genes and all genes, specific signaling pathways involved in the seven hub genes were explored. The GSEA results showed that SPTBN1 and UMOD were enriched in “metabolism” and “metabolism of RNA”, and ENGASE was enriched in “metabolism of amino and derivatives”, suggesting that these three core genes can participate in the progression of AKI in sepsis by affecting the body’s metabolism. ADAMTS17 was enriched in “inter-Golgi and retrograde Golgi-to-ER traffic”, ANK3 was enriched in “RHO GTPase cycle”, “transport of small molecules”, ASGR1 was enriched in “RHO GTPase cycle”, “neutrophil degranulation”, “immune system”, COL7A1 was enriched in “mitochondrial protein import”. Enrichment analysis showed that hub genes play a role in the functions of organelles, protein transport pathways, and immune-related pathways.
To observe the regulatory changes in immune cells in S-AKI, we used the transcriptome deconvolution algorithm CIBERSORT to calculate the proportion of immune cell subsets in septic kidney tissues to better understand the role of leukocyte infiltration and the inflammatory response in S-AKI. The results showed that the proportion of macrophages and mast cells in the S-AKI group was higher than that in the normal group, while the proportion of type 2 T helper cells was lower than that in the normal group. We further investigated the relationship between immune cell infiltration and hub genes in sepsis-AKI and found that these pivotal genes were associated with mast cells, macrophages, and type 2 T helper cells.
The initial activation of mast cells during the early phases of AKI stimulates an inflammatory response through the release of inflammatory mediators. Furthermore, this activation also facilitates the progression of fibrosis during the later stages of AKI, ultimately resulting in chronic alterations within the acute kidney injury condition.30
In sepsis, AKI is often accompanied by tubular injury and subsequent tissue repair. When macrophages are activated and infiltrate kidney tissue, they differentiate into M1 or M2 type at different pathological stages and protect the kidney by destroying pathogenic bacteria or repairing damaged tissues.31
Finally, we predicted the miRNAs and transcription factors upstream of the genes and analyzed the compounds to which the hub genes could bind, providing some clues for exploring potential therapeutics.
However, our study has certain limitations. First, the relatively small sample size of the dataset may have introduced some bias into our experimental results; larger sample sizes and more optimized sequencing technologies are needed to help obtain more accurate prognostic models. Second, we only preliminarily verified the expression difference of the hub genes through in vitro experiments and further explored its specific mechanism of action at a later stage. Our current study preliminarily explored the role of glycosylation in AKI in sepsis, and future research has the potential to broaden and deepen our understanding of this field.
Conclusion
In this study, the relationship between glycosylation modification and AKI in sepsis was explored at the gene transcription level; the hub gene was determined using machine learning algorithms, the relationship between the hub gene and immune cells and signaling pathways was analyzed, and the diagnostic value of these hub genes was evaluated. Finally, we predicted upstream miRNAs, transcription factors, and potential therapeutic chemicals of the pivot gene, providing new ideas for the diagnosis and treatment of AKI in sepsis.
Data Sharing Statement
Data, including GSE122274 and GSE139061, were downloaded from the NCBI for Biotechnology Information Gene Expression Omnibus database (GEO, http://www.ncbi.nlm.nih.gov/geo).
Ethics
All datasets in the present study were downloaded from public GEO database, which allowed researchers to download and analyze public datasets for scientific purposes, and the public data used in this study have been reviewed and exempted by the Institutional Ethics Committee of Chongqing University Three Gorges Hospital. The animal experiments were ethically reviewed, approved, regulated, and supervised by the Institutional Ethics Committee of Chongqing University Three Gorges Hospital (ethics number:SXYYWD2023-016). All animal experiments were in line with the Guide for the Animal Care and Use Committee of Chongqing University Three Gorges Hospital.
Author Contributions
All authors made a significant contribution to the work reported, whether that is in the conception, study design, execution, acquisition of data, analysis and interpretation, or in all these areas; took part in drafting, revising or critically reviewing the article; gave final approval of the version to be published; have agreed on the journal to which the article has been submitted; and agree to be accountable for all aspects of the work.
Disclosure
The authors report no conflicts of interest in this work.
References
1. Kellum JA, Chawla LS, Keener C, et al. The effects of alternative resuscitation strategies on acute kidney injury in patients with septic shock. Am J Respir Crit Care Med. 2016;193(3):281–287. doi:10.1164/rccm.201505-0995OC
2. Peerapornratana S, Manrique-Caballero CL, Gómez H, et al. Acute kidney injury from sepsis: current concepts, epidemiology, pathophysiology, prevention and treatment. Kidney Int. 2019;96(5):1083–1099. doi:10.1016/j.kint.2019.05.026
3. Zhang Z. Biomarkers, diagnosis and management of sepsis-induced acute kidney injury: a narrative review. Heart Lung Vessel. 2015;7(1):64–73.
4. Lee J, Levy MM. Treatment of patients with severe sepsis and septic shock: current evidence-based practices. R I Med J. 2019;102(10):18–21.
5. Gotts JE, Matthay MA. Sepsis: pathophysiology and clinical management. BMJ. 2016;353:i1585. doi:10.1136/bmj.i1585
6. Heindel DW, Chen S, Aziz PV, et al. Glycomic analysis reveals a conserved response to bacterial sepsis induced by different bacterial pathogens. ACS Infect Dis. 2022;8(5):1075–1085. doi:10.1021/acsinfecdis.2c00082
7. Kim DG, Baek I, Lee Y, et al. Structural basis for SdgB- and SdgA-mediated glycosylation of staphylococcal adhesive proteins. Acta Crystallogr D Struct Biol. 2021;77(Pt 11):1460–1474. doi:10.1107/S2059798321010068
8. Čaval T, Lin Y-H, Varkila M, et al. Glycoproteoform profiles of individual patients’ plasma alpha-1-antichymotrypsin are unique and extensively remodeled following a septic episode. Front Immunol. 2020;11:608466. doi:10.3389/fimmu.2020.608466
9. Novokmet M, Lukić E, Vučković F, et al. Changes in IgG and total plasma protein glycomes in acute systemic inflammation. Sci Rep. 2014;4(1):4347. doi:10.1038/srep04347
10. Joenvaara S, Saraswat M, Kuusela P, et al. Quantitative N-glycoproteomics reveals altered glycosylation levels of various plasma proteins in bloodstream infected patients. PLoS One. 2018;13(3):e0195006. doi:10.1371/journal.pone.0195006
11. Larsen MD, de Graaf EL, Sonneveld ME, et al. Afucosylated IgG characterizes enveloped viral responses and correlates with COVID-19 severity. Science. 2021;371(6532):6532. doi:10.1126/science.abc8378
12. de Haan N, Boeddha NP, Ekinci E, et al. Differences in IgG Fc glycosylation are associated with outcome of pediatric meningococcal sepsis. mBio. 2018;9(3). doi:10.1128/mBio.00546-18
13. DeCoux A, Tian Y, DeLeon-Pennell KY, et al. Plasma glycoproteomics reveals sepsis outcomes linked to distinct proteins in common pathways. Crit Care Med. 2015;43(10):2049–2058. doi:10.1097/CCM.0000000000001134
14. Kim YH, Kwak MS, Park JB, et al. N-linked glycosylation plays a crucial role in the secretion of HMGB1. J Cell Sci. 2016;129(1):29–38. doi:10.1242/jcs.176412
15. Radovani B, Gudelj I. N-Glycosylation and inflammation; the not-so-sweet relation. Front Immunol. 2022;13:893365. doi:10.3389/fimmu.2022.893365
16. Suzuki H, Novak J. IgA glycosylation and immune complex formation in IgAN. Semin Immunopathol. 2021;43(5):669–678. doi:10.1007/s00281-021-00883-8
17. Dotz V, Lemmers RFH, Reiding KR, et al. Plasma protein N-glycan signatures of type 2 diabetes. Biochim Biophys Acta Gen Subj. 2018;1862(12):2613–2622. doi:10.1016/j.bbagen.2018.08.005
18. Memarian E, ‘t Hart LM, Slieker RC, et al. Plasma protein N- glycosylation is associated with cardiovascular disease, nephropathy, and retinopathy in type 2 diabetes. BMJ Open Diabetes Res Care. 2021;9(1):e002345. doi:10.1136/bmjdrc-2021-002345
19. Santorelli L, Capitoli G, Chinello C, et al. In-depth mapping of the urinary N-glycoproteome: distinct signatures of ccRCC-related progression. Cancers. 2020;12(1):239. doi:10.3390/cancers12010239
20. Kim JH. Bioinformatics and genomic medicine. Genet Med. 2002;4(6 Suppl):62s–65s. doi:10.1097/00125817-200211001-00013
21. Prokop JW, May T, Strong K, et al. Genome sequencing in the clinic: the past, present, and future of genomic medicine. Physiol Genomics. 2018;50(8):563–579. doi:10.1152/physiolgenomics.00046.2018
22. Choi RY, Coyner AS, Kalpathy-Cramer J, Chiang MF, Campbell JP. Introduction to machine learning, neural networks, and deep learning. Transl Vis Sci Technol. 2020;9(2):14.
23. Huang M-L, Hung Y-H, Lee WM, et al. SVM-RFE based feature selection and Taguchi parameters optimization for multiclass SVM classifier. ScientificWorldJournal. 2014;2014:795624. doi:10.1155/2014/795624
24. McEligot AJ, Poynor V, Sharma R, et al. Logistic LASSO regression for dietary intakes and breast cancer. Nutrients. 2020;12(9):2652. doi:10.3390/nu12092652
25. Somsuan K, Aluksanasuwan S. Bioinformatic analyses reveal the prognostic significance and potential role of ankyrin 3 (ANK3) in kidney renal clear cell carcinoma. Genomics Inform. 2023;21(2):e22. doi:10.5808/gi.23013
26. Devuyst O, Bochud M, Olinger E. UMOD and the architecture of kidney disease. Pflugers Arch. 2022;474(8):771–781. doi:10.1007/s00424-022-02733-4
27. Koca D, Séraudie I, Jardillier R, et al. COL7A1 expression improves prognosis prediction for patients with clear cell renal cell carcinoma atop of stage. Cancers. 2023;15(10):2701. doi:10.3390/cancers15102701
28. Wu J, Miao C, Wang Y, et al. SPTBN1 abrogates renal clear cell carcinoma progression via glycolysis reprogramming in a GPT2-dependent manner. J Transl Med. 2022;20(1):603. doi:10.1186/s12967-022-03805-w
29. Shi R, Wang J, Zhang Z, et al. ASGR1 promotes liver injury in sepsis by modulating monocyte-to-macrophage differentiation via NF-κB/ATF5 pathway. Life Sci. 2023;315:121339. doi:10.1016/j.lfs.2022.121339
30. Summers SA, Chan J, Gan P-Y, et al. Mast cells mediate acute kidney injury through the production of TNF. J Am Soc Nephrol. 2011;22(12):2226–2236. doi:10.1681/ASN.2011020182
31. Huen SC, Cantley LG. Macrophages in renal injury and repair. Annu Rev Physiol. 2017;79(1):449–469. doi:10.1146/annurev-physiol-022516-034219
 © 2023 The Author(s). This work is published and licensed by Dove Medical Press Limited. The full terms of this license are available at https://www.dovepress.com/terms.php and incorporate the Creative Commons Attribution - Non Commercial (unported, v3.0) License.
By accessing the work you hereby accept the Terms. Non-commercial uses of the work are permitted without any further permission from Dove Medical Press Limited, provided the work is properly attributed. For permission for commercial use of this work, please see paragraphs 4.2 and 5 of our Terms.
© 2023 The Author(s). This work is published and licensed by Dove Medical Press Limited. The full terms of this license are available at https://www.dovepress.com/terms.php and incorporate the Creative Commons Attribution - Non Commercial (unported, v3.0) License.
By accessing the work you hereby accept the Terms. Non-commercial uses of the work are permitted without any further permission from Dove Medical Press Limited, provided the work is properly attributed. For permission for commercial use of this work, please see paragraphs 4.2 and 5 of our Terms.