Back to Journals » Journal of Hepatocellular Carcinoma » Volume 8
An Optimal Ablative Margin of Small Single Hepatocellular Carcinoma Treated with Image-Guided Percutaneous Thermal Ablation and Local Recurrence Prediction Base on the Ablative Margin: A Multicenter Study
Authors Li FY, Li JG ![]() , Wu SS, Ye HL, He XQ
, Wu SS, Ye HL, He XQ ![]() , Zeng QJ, Zheng RQ, An C, Li K
, Zeng QJ, Zheng RQ, An C, Li K
Received 4 August 2021
Accepted for publication 26 October 2021
Published 15 November 2021 Volume 2021:8 Pages 1375—1388
DOI https://doi.org/10.2147/JHC.S330746
Checked for plagiarism Yes
Review by Single anonymous peer review
Peer reviewer comments 2
Editor who approved publication: Dr Ahmed Kaseb
Feng-Yao Li,1,* Jian-Guo Li,2,* Song-Song Wu,3 Huo-Lin Ye,1 Xu-Qi He,1 Qing-Jing Zeng,1 Rong-Qin Zheng,1 Chao An,4 Kai Li1
1Department of Ultrasound, Guangdong Key Laboratory of Liver Disease Research, The Third Affiliated Hospital of Sun Yat-sen University, Guangzhou, People’s Republic of China; 2The Department of Infectious Disease,The Third Affiliated Hospital of Sun Yat-sen University, Guangzhou, People’s Republic of China; 3Shengli Clinical Medical College of Fujian Medical University, Department of Ultrasonography,Fujian Provincial Hospital, Fuzhou, People’s Republic of China; 4Department of Minimal Invasive Intervention, Sun Yat-sen University Cancer Center, State Key Laboratory of Oncology in South China, Collaborative Innovation Center for Cancer Medicine, Guangzhou, People’s Republic of China
*These authors contributed equally to this work
Correspondence: Chao An; Kai Li Tel +862087343272
; +862085252010
Email [email protected]; [email protected]
Objective: To explore the best ablative margin (AM) for single hepatocellular carcinoma (HCC) patients with image-guided percutaneous thermal ablation (IPTA) based on MRI–MRI fusion imaging, and to develop and validate a local tumor progression (LTP) predictive model based on the recommended AM.
Methods: Between March 2014 and August 2019, 444 treatment-naïve patients with single HCC (diameter ≤ 3 cm) who underwent IPTA as first-line treatment from three hospitals were included, which were randomly divided into training (n= 296) and validation (n = 148) cohorts. We measured the ablative margin (AM) by MRI–MRI fusion imaging based on pre-ablation and post-ablation images. Then, we followed up their LPT and verified the optimal AM. Risk factors related to LTP were explored through Cox regression models, the nomogram was developed to predict the LTP risk base on the risk factors, and subsequently validated. The predictive performance and discrimination were assessed and compared with conventional indices.
Results: The median follow-up was 19.9 months (95% CI 18.0– 21.8) for the entire cohort. The results revealed that the tumor size (HR: 2.16; 95% CI 1.25– 3.72; P = 0.003) and AM (HR: 0.72; 95% CI, 0.61– 0.85; P < 0.001) were independent prognostic factors for LTP. The AM had a pronounced nonlinear impact on LTP, and a cut-off value of 5-mm was optimal. We developed and validated an LTP predictive model based on the linear tumor size and nonlinear AM. The model showed good predictive accuracy and discrimination (training set, concordance index [C-index] of 0.751; validation set, C-index of 0.756) and outperformed other conventional indices.
Conclusion: The 5-mm AM is recommended for the best IPTA candidates with single HCC (diameter ≤ 3 cm). We provided an LTP predictive model that exhibited adequate performance for individualized prediction and risk stratification.
Keywords: thermal ablation, hepatocellular carcinoma, ablative margin, local tumor progression, prediction model
Introduction
Image-guided percutaneous thermal ablation (IPTA) is a primary choice for the curative management of patients with early hepatocellular carcinoma (HCC) who are not eligible for surgical resection (SR) or liver transplantation. IPTA is as effective as SR for single HCC (diameter ≤3 cm) and has many advantages, including less trauma, fewer complications, and better cost-effectiveness.1–3 However, the therapeutic effect of IPTA is still hampered by local tumor progression (LTP) caused by untreated micrometastases beyond the boundary of target lesions.4 Increasing evidence demonstrates that micrometastases that spread along intrasegmental branches and invasive vasculature may contribute to LTP.5–7 The incidence of LTP increases as the tumor diameter increases.
Several studies have shown that the minimum ablative margin (AM) and tumor size are independent predictors of LTP in ablation-treated patients.8,9 The intrahepatic infiltration range of surrounding satellite lesions increases as the tumor size increases.10 When the ablative margin was greater than 5-mm, the LTP rates after IPTA would reduce significantly.11 However, a more extensive thermal field range may cause heat-induced injury to nearby organs and damage liver function. An optimal AM plays a vital role in local tumor control and reduces the risk of ablation-related complications. Currently, studies conducted at various medical centers recommend that a 5-to 10-mm ablative margin should be achieved during the ablation process.12 However, there is no study to explore the optimal AM match with tumor of different diameters. Ablative margin of 5 mm can be used for the larger tumors. As the ablation area increases, the damage to the liver and the patient’s response will increase. So, is the smaller AM suitable for smaller tumor? Therefore, we choose single HCC (diameter ≤3 cm) as our research object to explore an optimal AM, which is rarely involved in previous studies and is a more in-depth exploration compared with previous research.
Currently, various registration methods based on pre- and post-ablation images have been widely implemented to measure the AM (summarized in sTable 1 in the Supplement).13–18 Among them, registration of post-IPTA CT to pre-IPTA CT images is an accurate and useful technique for assessing the AM after IPTA.19,20 Compared with CT, MRI is more sensitive and frequently used in the evaluation of liver lesions and tumor treatment response. In one of our previous study, we evaluated the AM based the MRI–MRI image fusion, which was proved to be feasible and useful.21
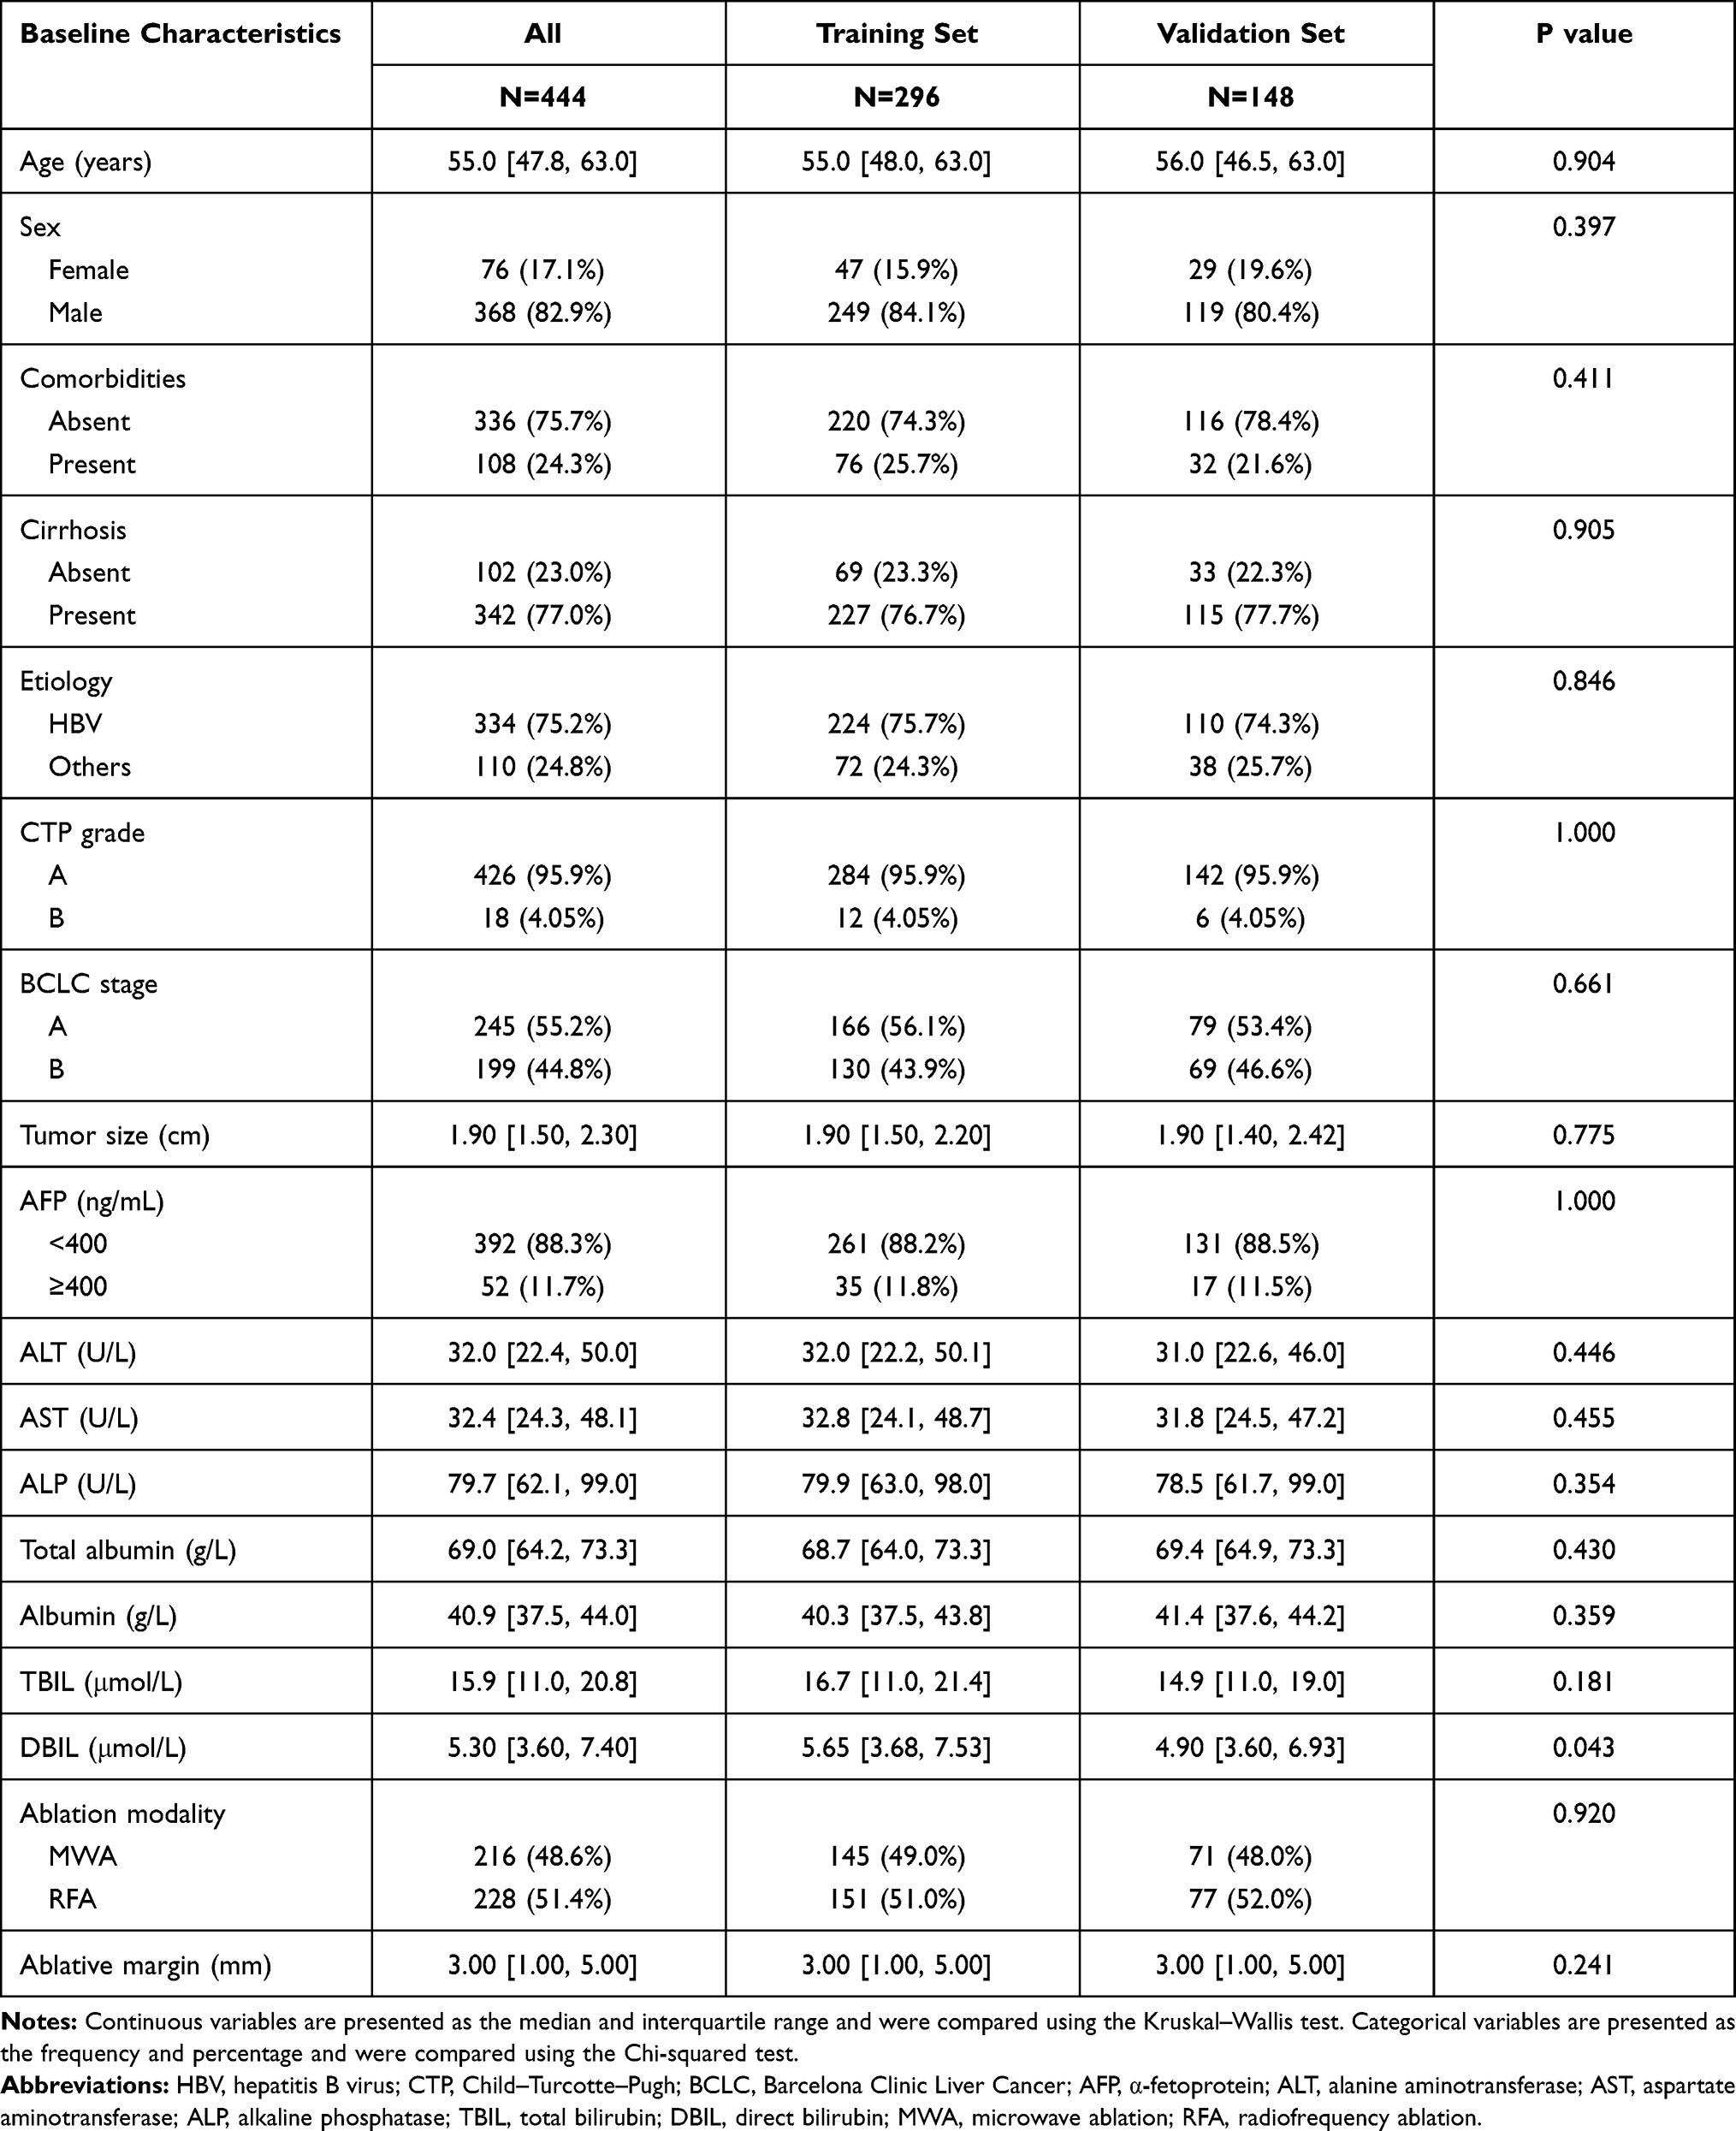 |
Table 1 Characteristics of Patients in the Training and Validation Sets |
Moreover, a robust risk stratification model for patients with HCC is necessary to improve ablative strategies and investigate the benefits of adjuvant systemic therapies after IPTA. LTP risk predictive models may be developed based on the precise execution of the modifiable ablation procedure and unmodifiable patient- and tumor-related characteristics, which could offer a reference for physicians for precise ablation.
Based on the rationale mentioned above, the current study aimed to investigate the nonlinear effects of the AM on LTP and suggest an optimal AM value for patients with single HCC (diameter ≤3 cm) treated with IPTA. Furthermore, we developed and validated an AM-based predictive model to predict the LTP risk after IPTA.
Materials and Methods
Study Population and Treatment Procedures
This retrospective multicenter study obtained institutional review board approval from all participating hospitals. The requirement for written informed consent was waived. A total of 1938 untreated patients with early-stage HCC who subsequently underwent IPTA as a first-line treatment between March 2014 and August 2019 were screened for eligibility. Follow-up was completed in April 2020. HCC was diagnosed by either imaging or histological evaluation based on the European Association of the Study of the Liver (EASL) and the American Association for the Study of Liver Disease (AASLD) guidelines.22,23 Details of patient recruitment and grouping method are outlined in Supplementary Methods 1.1. (sFigure 1) shows the patient enrollment pathway. The equipment and procedures of IPTA, including microwave ablation (MWA) and radiofrequency ablation (RFA), are described in Supplementary Methods 1.2. The ablative area covering the tumor focus was examined by comparing a real-time image (plain computed tomography [CT]) taken after the procedure with an enhanced scan image taken before treatment to confirm complete ablation. These patients underwent necessary follow-up examinations.
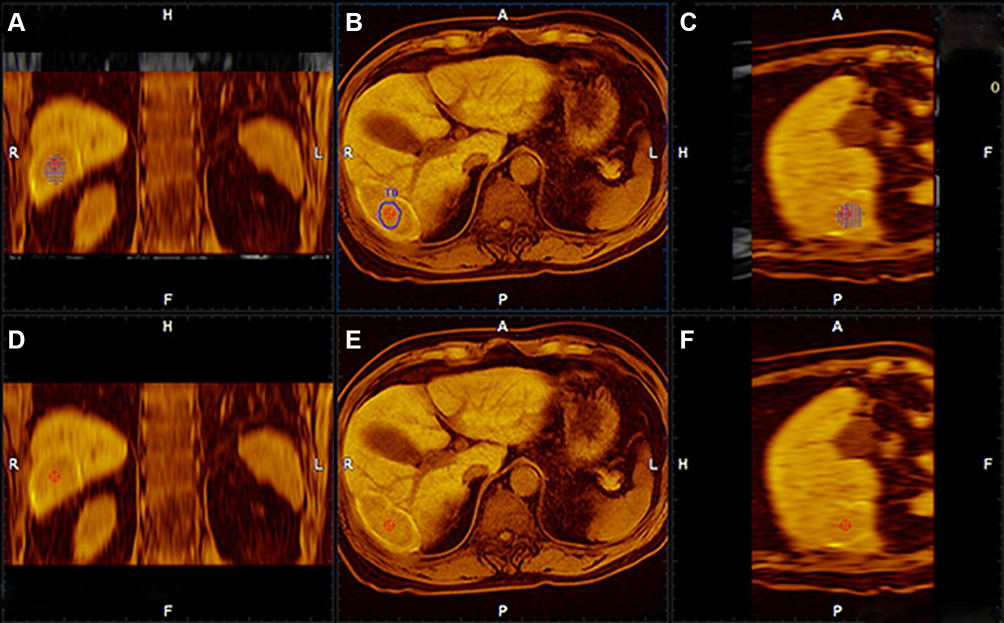 |
Figure 1 (A–C) After completing the fine adjustments, the lower row MRI images were finally overlapped to the upper row MRI images to create fusion images. In the successful and satisfactory fusion images, the relationship between the ablation zone and the tumor before IPTA in three dimensions was clearly observed. (D–F) The images after IPTA. |
Development of the AM Based on MRI Registration
All patients underwent a magnetic resonance image (MRI) scan before and after IPTA using three types of magnetic resonance (MR) equipment, two 3.0 T and one 1.5 T, which are summarized in sTable 2. All preablation MRI scans were performed within 1 month before the IPTA procedure, and all postablation MRI scans were conducted within 1 month following the IPTA procedure. Details of the MRI image acquisition parameters are described in Supplementary Methods 1.3. In this study, MRI–MRI image fusion was performed with a commercially available image fusion system (My Lab Twice, Esoate, Genoa, Italy). Firstly, all series of MRI images before IPTA were read carefully and one series of them with clearly demonstrated hepatic vessels and HCC lesions in the portal vein phase or late phase were selected, and then the images in DICOM were imported into the image fusion system. Likewise, one series of MRI images within 1 month after IPTA with clear hepatic vessel and ablative area were also imported into the image fusion system. Then, the system automatically displayed six pictures in two rows in the monitor; the transverse, coronal and vertical plane MRI images before IPTA were presented in the upper row, while the corresponding MRI images after IPTA were presented in the lower row (sFigure 2). Then, the HCC lesion in the MRI before IPTA was outlined in blue manually. Image registration was performed by aligning two overlaid MRI images with six parameters; rotation and translation were performed in three reformed planes to maximize image similarity around the HCC lesion and ablation area. Then, fine adjustments using the landmarks including hepatic vein, hepatic artery-portal complex and hepatic contour near the lesion were performed to obtain satisfactory registration by overlaying the lower row images to the upper row images Once the fine adjustments were completed, the pre- and post-IPTA MRI images were finally overlapped to create fusion images (Figure 1A–C). The standards of complete registration include that three corresponding anatomic landmarks adjacent to the tumor were fully matched, and the offset was less than 3-mm in each plane (sFigure 3A–B). Failure of registration was assigned if the above standard was not met after three attempts. In the successful fusion images, the relationship between the ablation area and the tumor before IPTA in three dimensions was clearly observed (Figure 1A–F). Then, the shortest distance from the outer margin of the ablation area to the margin of the tumor was measured plane-by-plane on the transverse, coronal and vertical fusion image (sFigure 3C), and the minimum value was recorded as AM.
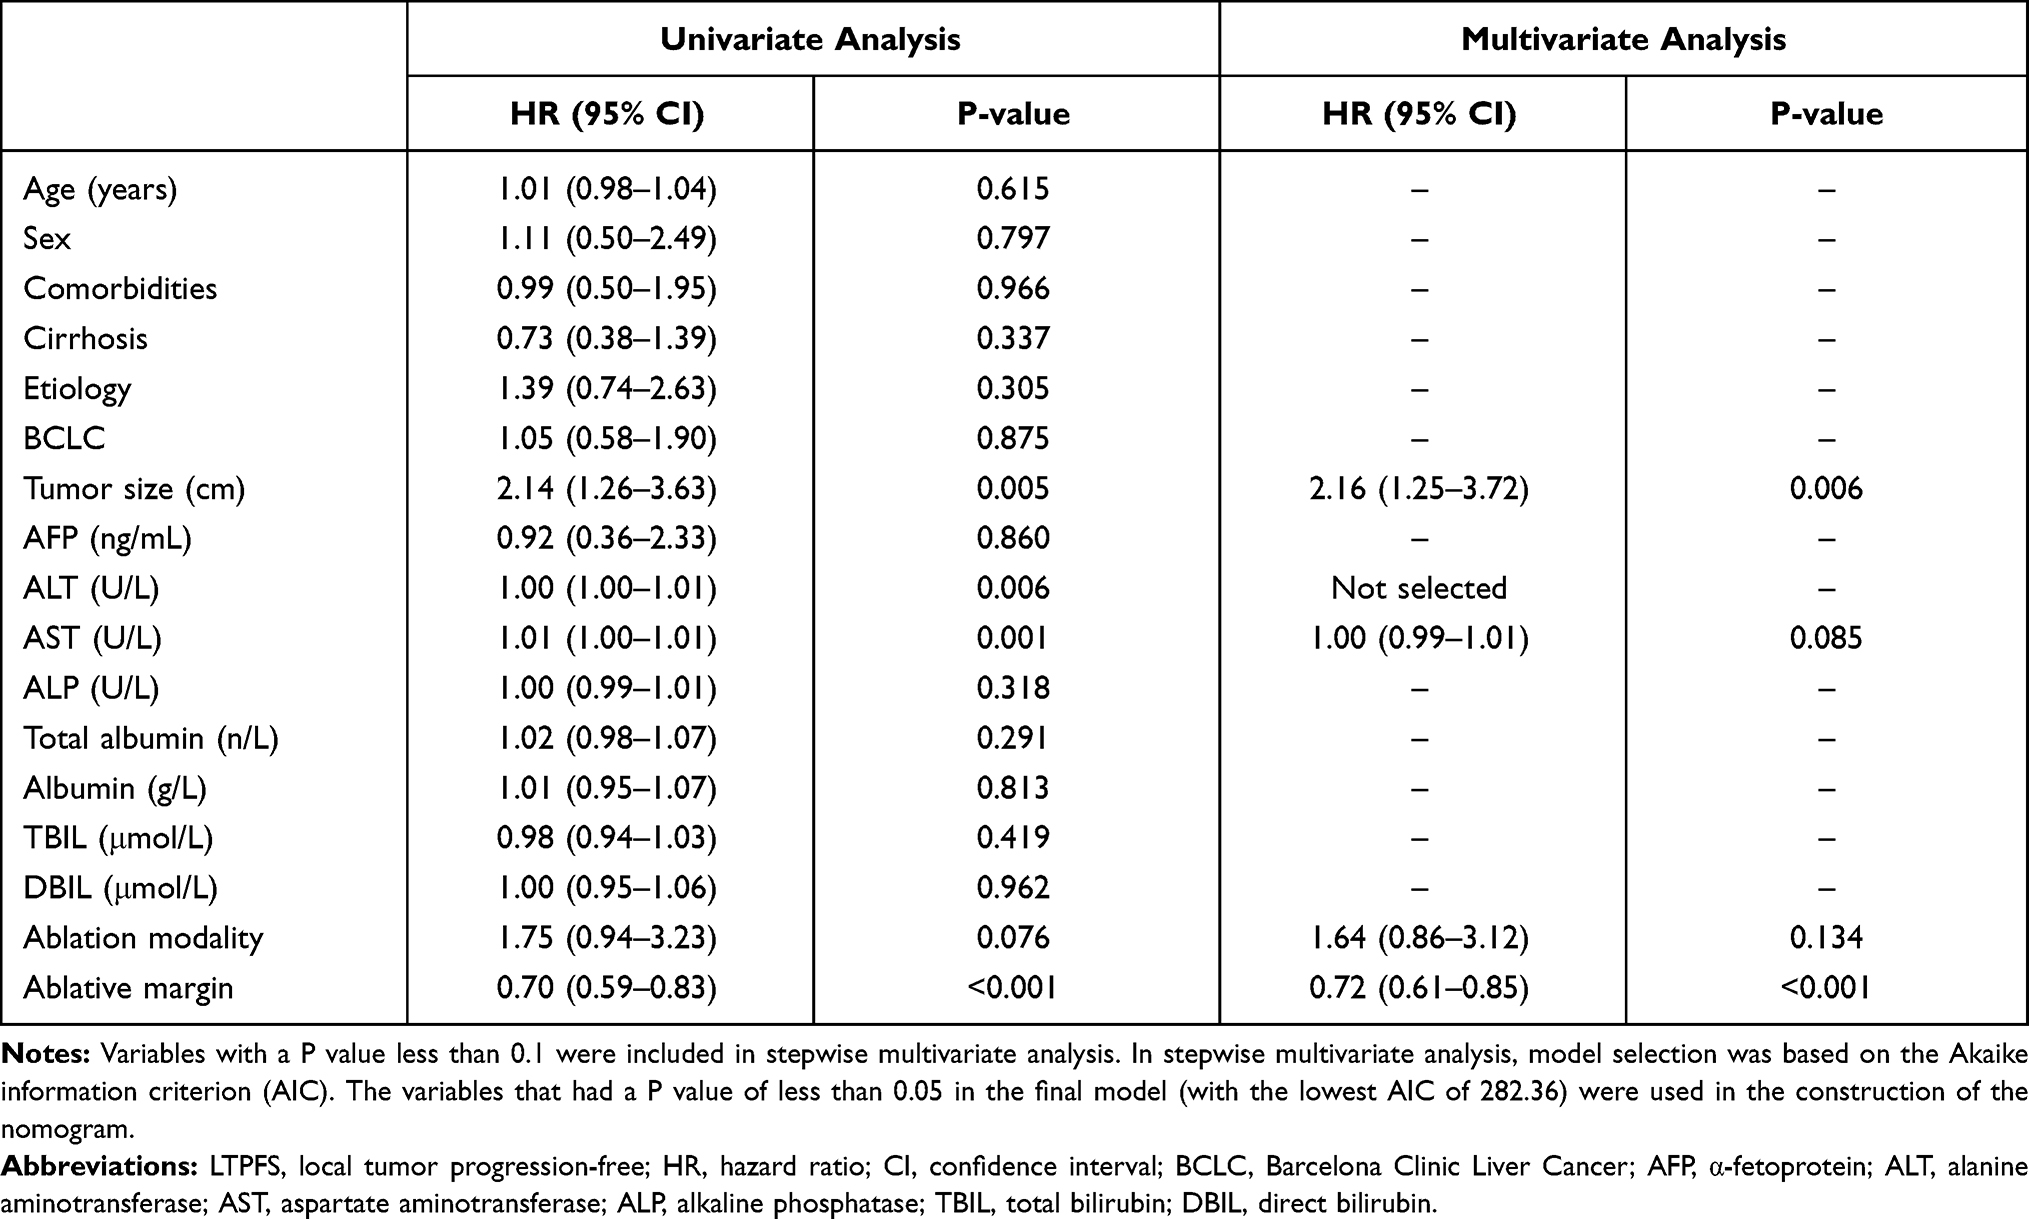 |
Table 2 The Results of Univariate and Multivariate Cox Regression Models for LTPFS |
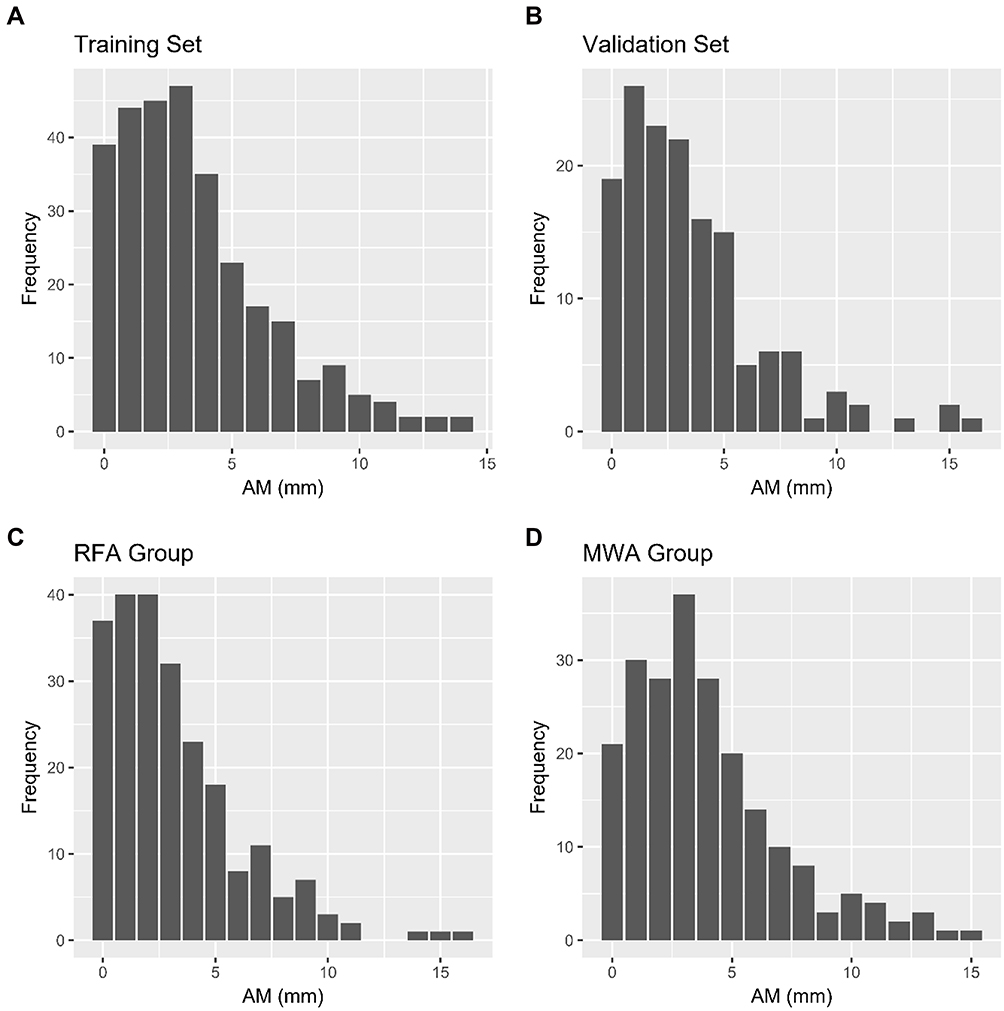 |
Figure 2 The distribution of ablative margin in the training (A) and validation (B) sets, and the microwave ablation (C) and radiofrequency ablation (D) subgroups. |
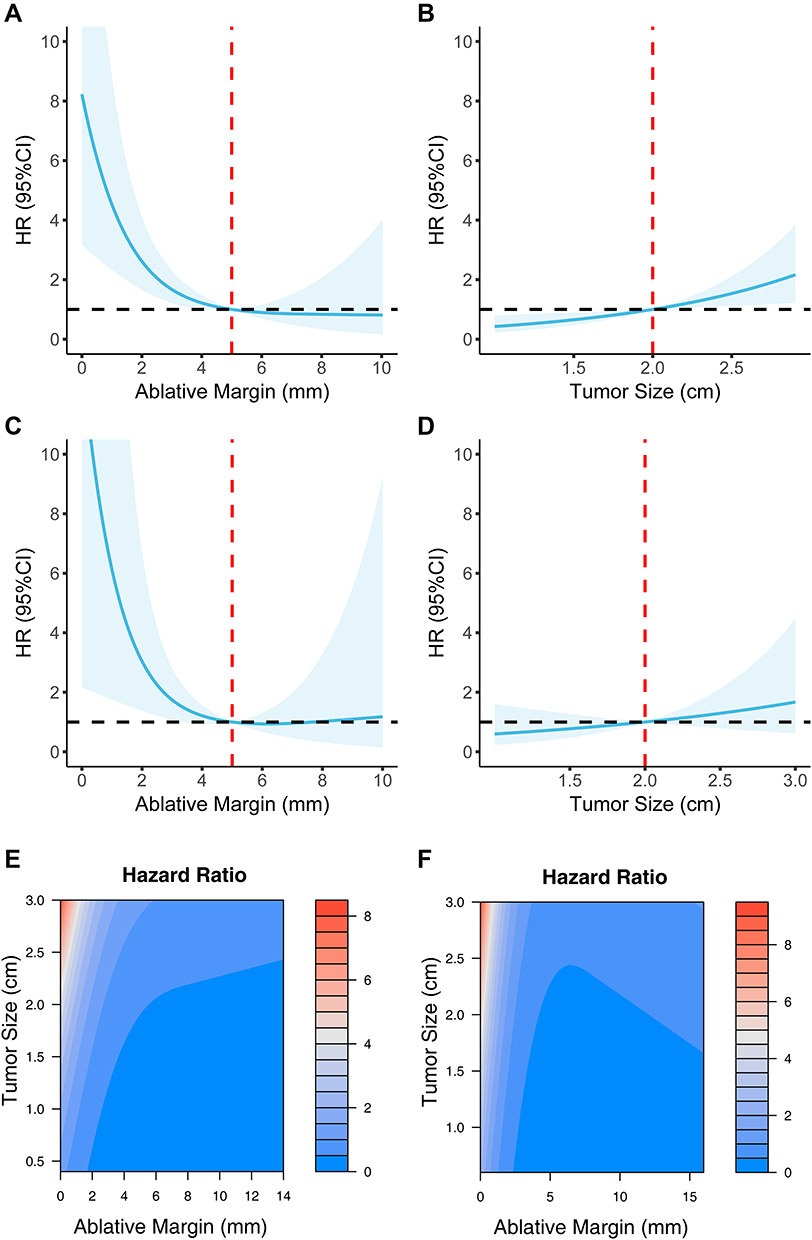 |
Figure 3 The relation between LTP and tumor size/AM based on AIC-selected RCS models. (A) AM had a pronounced nonlinear effect in the training set; (B) the tumor size presented a linear profile in the training set; (C) AM had a pronounced nonlinear effect in the validation set; (D) the tumor size presented a linear profile in the validation set; (E and F) the association among the tumor size, AM, and risk of LTP with a contour map in the training and validation sets. Abbreviations: LTP, local tumor progression; AM, ablative margin. |
Follow-Up and Outcome Observation
If asymmetrical peripheral development in a dispersed, nodular, or unusual pattern occurred, it signified inadequate ablation, and thus another ablation was required. Otherwise, if complete ablation was accomplished, then serum α-fetoprotein (AFP) was measured and contrast-enhanced CT or MRI were performed again at 1 and 3 months after IPTA and at approximately 3- to 6-month intervals. LTP lesions were diagnosed as enhancements in the arterial phase with a washout lesion in the delayed phase of a contrast-enhanced imaging examination (CEUS, CT, or MRI) inside or abutting the ablation area during follow-up (Illustrated in sFigure 4A–F). Our primary endpoint was local tumor progression-free survival (LTPFS). We calculated LTPFS as the time from the initial IPTA to the date of LTP. We censored patients who did not experience LTP at the last contact date (April 20, 2020), were lost to follow-up or died.
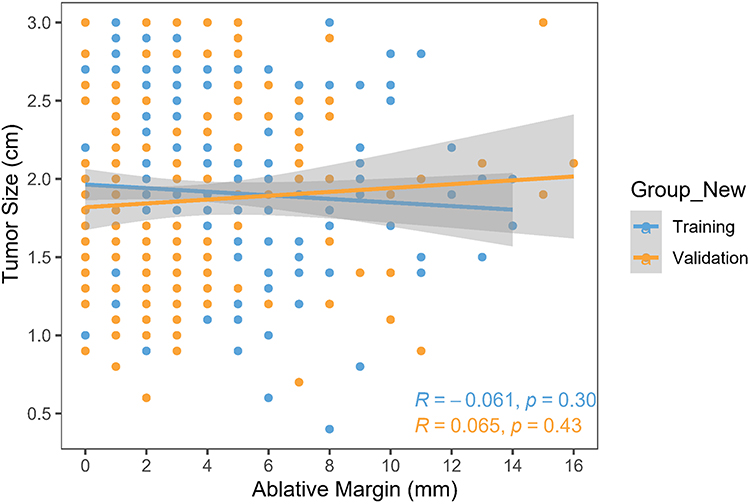 |
Figure 4 The correlation between tumor size and ablative margin in the training and validation cohorts. |
Statistical Analysis
Continuous variables are provided as the median with the interquartile range (IQR) and were compared by the Kruskal–Wallis test. Categorical variables are presented as frequencies with percentages and were compared by the Chi-squared test. Survival curves were calculated using the Kaplan–Meier method and compared with the Log rank test. Univariate and stepwise multivariate Cox regression analyses were applied to calculate hazard ratios (HRs) and corresponding 95% confidence intervals (CIs) of variables and to identify independent prognostic factors. We used restricted cubic splines (RCSs) to flexibly model and visualize the relation of the tumor size and AM with LTP. The optimal number of knots for the RCS models was selected based on the Akaike information criterion (AIC). We also tested the potential interaction effects of predictors. The discrimination, predictive accuracy, and calibration of the model were assessed by Harrell’s concordance index (C-index), the area under the time-dependent receiving operator characteristic curve (tdAUC), and calibration curve, respectively. We compared the proposed model with conventional prognostic factors, including the tumor size, AFP, Barcelona Clinic Liver Cancer (BCLC) stage, and albumin–bilirubin (ALBI) grade. The robustness of the predictive model was assessed in an independent validation set and in different ablation subgroups. Given that a quick evaluation of LTP risk levels with cut-off values might be useful in routine clinical practice, we also investigated the optimal cut-off value of the predictive score obtained from the proposed model. Based on the thresholds for the scores determined by maximally selected log-rank statistics, we stratified patients into low- or high-risk subgroups.
All statistical analyses were conducted using R version 4.0.4. A two-tailed P-value less than 0.05 was considered statistically significant.
Results
Patient Characteristics
A total of 444 patients (IQR range, 47.8, 63.0 years; median age, 55.0 years) with early HCC (single, diameter ≤3 cm) from three academic institutions were enrolled. The baseline characteristics of patients in the training set and external validation set are shown in Table 1. Patient characteristics were quite comparable between the two datasets. Among all patients who underwent IPTA, 216 (48.6%) patients received RFA, and 228 (51.4%) received MWA. In the assessment of the AM, no significant differences were observed in the training and validation sets or the RFA and MWA subgroups. The distribution of the AM is shown in Figure 2. The variables with missing values were AFP, alanine aminotransferase (ALT), aspartate aminotransferase (AST), alkaline phosphatase (ALP), total bilirubin (TBIL), and direct bilirubin (DBIL). The pattern of missing values in the primary dataset is illustrated in the Supplement (sFigure 5). We filled in missing values of these variables using the k-nearest neighbors imputation method. The distributions of the above variables before or after imputation are shown in sFigure 6. The median follow-up was 19.9 months (95% CI 18.3–21.7) for the entire cohort, 19.9 months (95% CI 18.0–21.8) for the training set, and 19.7 months (95% CI 18.1–24.2) for the validation set. There were 33 and 11 LTP events in the training and validation cohorts, respectively. Survival curves for LTPFS in the training and validation cohorts are provided in sFigure 7. The 6-, 12- and 24-month LTPFS probability was 93.3%, 89.9%, and 88.4% for patients in the training set and 97.9%, 93.3%, and 89.9% for those in the validation set, respectively. No significant survival difference was observed between the training and validation sets (P = 0.473).
Univariate and Multivariate Analysis
The results from univariate and multivariate Cox regression models for LTPFS after k-nearest neighbor imputation are summarized in Table 2. The results revealed that the tumor size (HR: 2.16; 95% CI 1.25–3.72; P = 0.003) and AM (HR: 0.72; 95% CI, 0.61–0.85; P < 0.001) were independent prognostic factors that should be considered during model development.
The Nonlinear Effects of the Tumor Size and AM
The AIC-selected RCS models suggested that the AM had a pronounced nonlinear effect (P for nonlinearity <0.05, Figure 3A) in the training set. In contrast, the tumor size presented a linear profile (Figure 3B). The model illustrates a substantial reduction in the hazard within the lower range of AM, which would reach the lowest risk at approximately 5 mm with no apparent reduction thereafter. Similar results were observed in the validation set (Figure 3C–D). The results indicated that the AM could be modeled as a continuous nonlinear variable, whereas tumor size should be modeled as a continuous linear variable. No interaction effect or correlation between the tumor size and AM was detected (Figure 4). Finally, the association among the tumor size, AM, and risk of LTP in the training and validation sets was further visualized with a contour map with a color gradient (Figure 3E–F).
Development and Validation of an AM-Based Predictive Mode
We visualized the HR for LTP according to the tumor size and AM by plotting an at-aglance contour map. The AIC was used as a stopping rule to determine the final fitted model. Based on the above analyses, a predictive model is graphically represented as a nomogram (Figure 5A) and an at-a-glance contour plot (sFigure 8). The 6-, 12-, and 24-month LTPFS probability of individual patients could be easily predicted after the IPTA procedure using the AM and tumor size. The model showed good discrimination, with a C-index of 0.751 (95% CI, 0.666–0.836) in the training set and 0.756 (95% CI, 0.616–0.896) in the validation set. The calibration plots for the 6-, 12-, and 24-month LTPFS had good predictive value in the training set (Figure 5B) and were validated in the independent series (Figure 5C). The C-indices and tdAUC of the proposed model outperformed other conventional indices, demonstrating a fair predictive accuracy and discriminative ability, which was confirmed in the validation set (Table 3 and Figure 6). The robustness of the AM-based predictive model was further explored in subgroup analysis. The local recurrence predictive model continued to show good predictive accuracy and discrimination, regardless of the ablation modality, etiology, and BCLC stage (sTable 3).
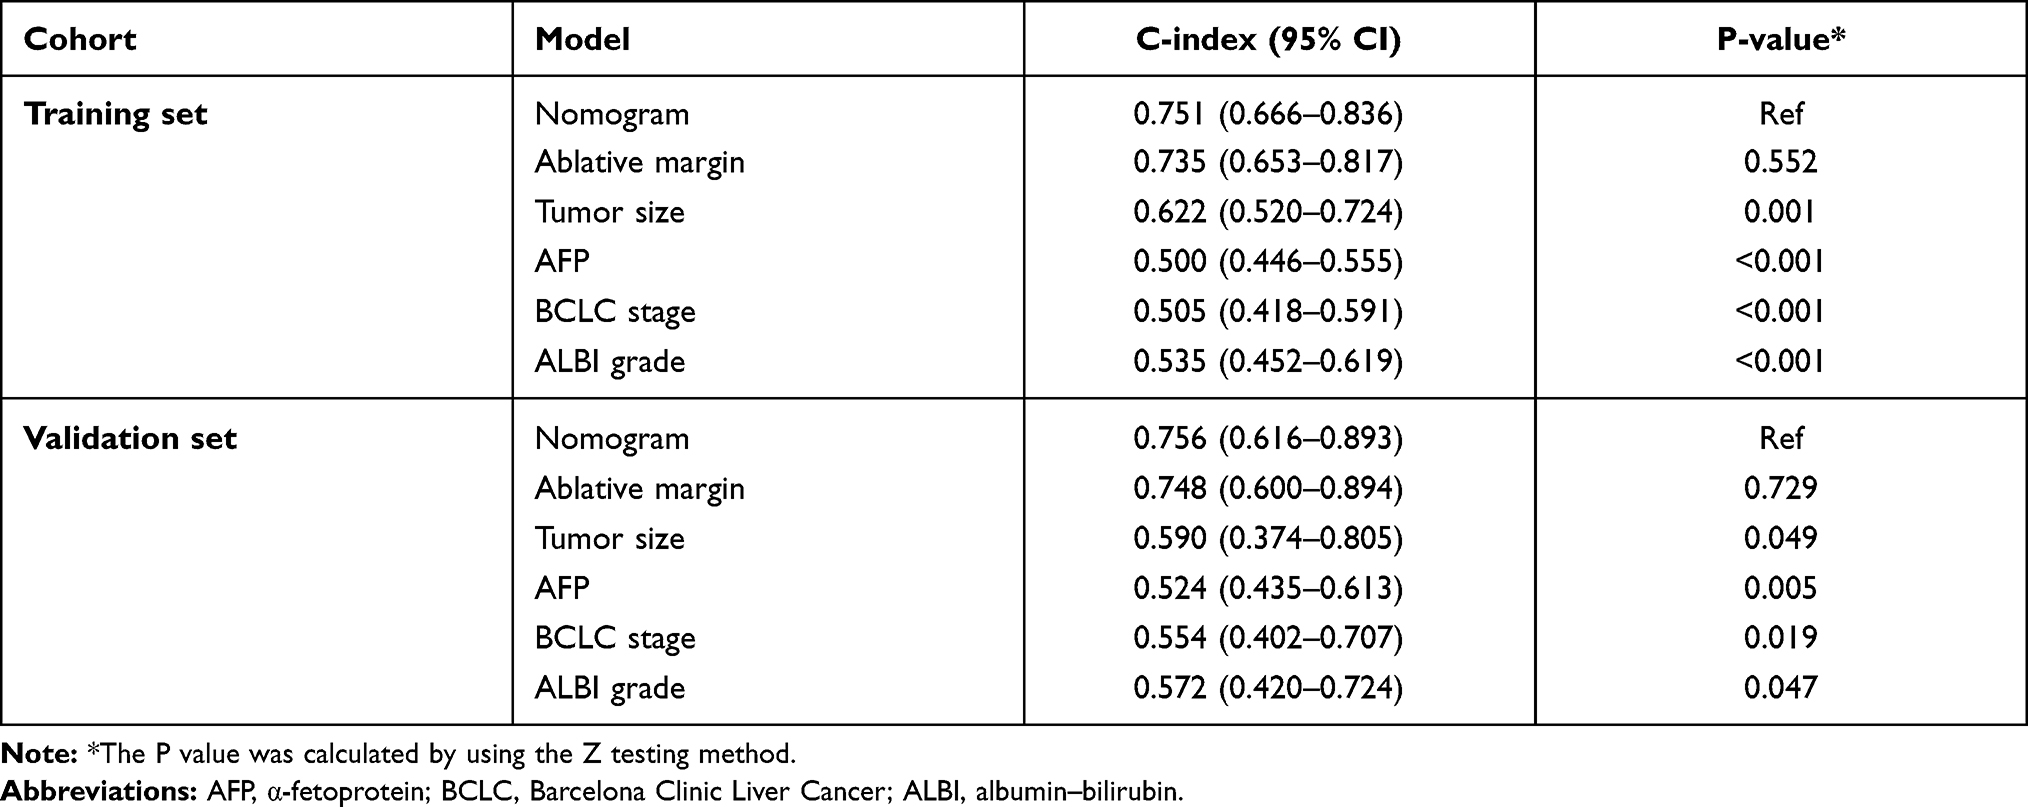 |
Table 3 Comparison of the Discrimination Between the Proposed Model and Conventional Indices |
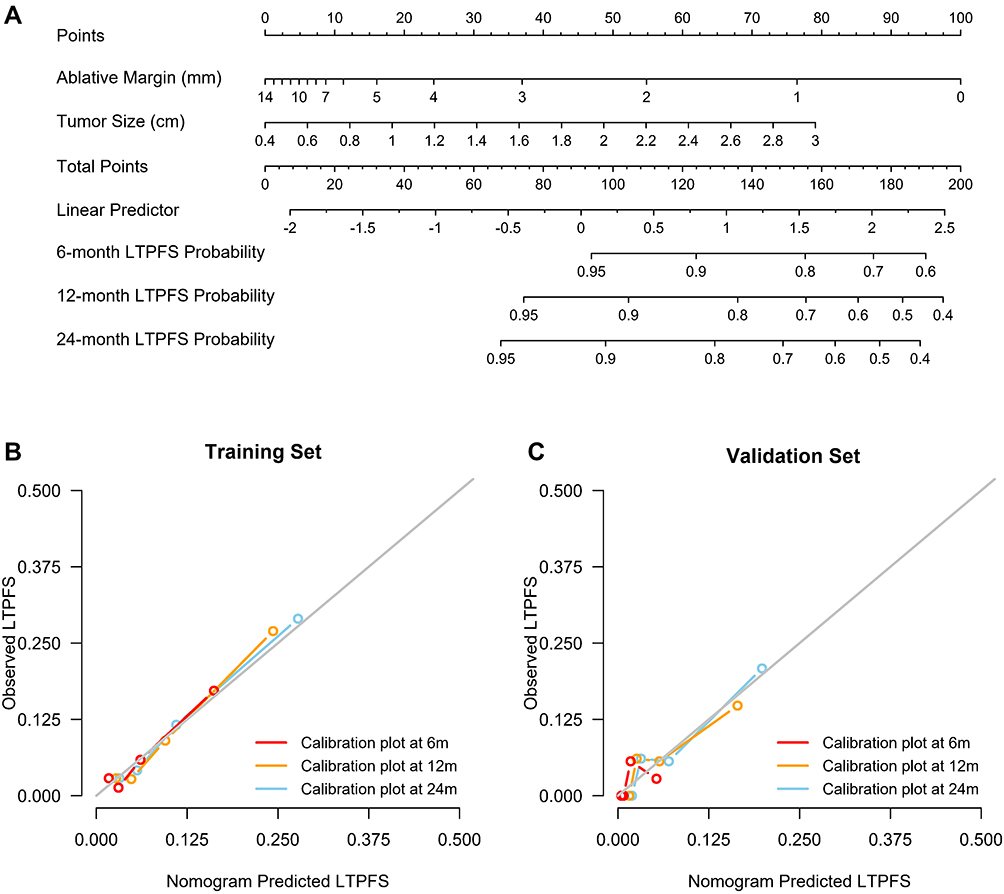 |
Figure 5 The development and validation of a predictive nomogram model. (A) the nomogram consisting of the quantitative tumor size and ablative margin were shown; (B) The calibration plots for the 6-, 12-, and 24-month LTPFS had good predictive value in the training set; (C) The calibration plots for the 6-, 12-, and 24-month LTPFS had good predictive value in the validation set. Abbreviation: LTPFS, local tumor progression-free survival. |
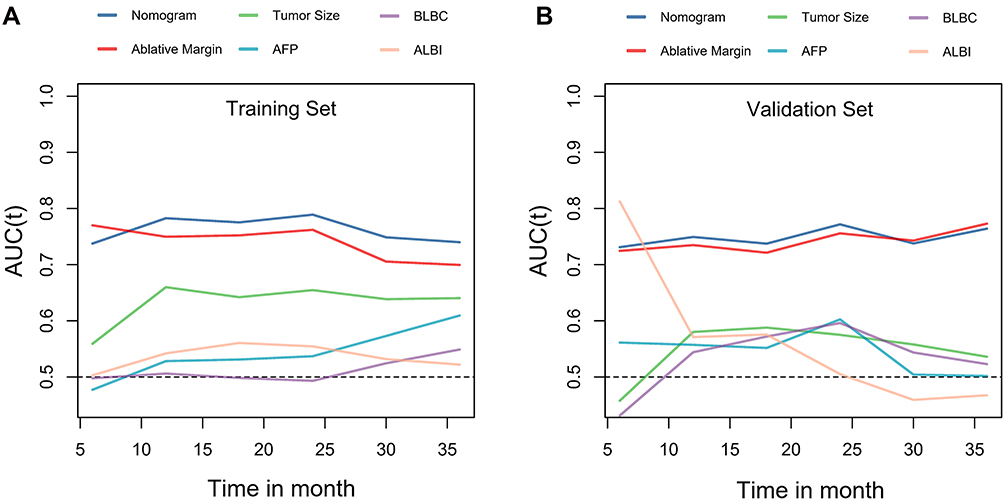 |
Figure 6 Discriminatory performance of all models in development and test cohorts. (A) Graphs show time-dependent areas under the receiver operating characteristic (ROC) curve at various time points in the training set; (B) Graphs show time-dependent areas under the ROC curve at various time points in the validation set. |
Risk Stratification
We identified an optimal cut-off value of the nomogram score (115.69, Figure 7A) based on maximally selected log-rank statistics in the training set. A similar cut-off value was found in the validation set (112.99, Figure 7B). A compromised integer of 115 was chosen as the final cut-off value to stratify patients into low-risk and high-risk groups. This risk stratification assigned 213 (72.0%) of 296 patients to the low-risk group and 83 (28.0%) to the high-risk group in the training set. The LTPFS probability was significantly lower for the high-risk group than the low-risk group (24-month LTPFS: 80.9% vs 92.6%; HR 2.58 [95% CI 1.29–5.14], P = 0.007; Figure 7C). In the validation cohort, the model categorized 105 (71.0%) of 148 patients into the low-risk group and 43 patients (29.0%) into the high-risk group, had a significantly different LTPFS (24-month LTPFS: 85.3% vs 97.9%; HR 5.08 [95% CI 1.35–19.15], P = 0.016; Figure 7D). In the subgroup analysis, the current risk stratification also had consistent performance for patients treated with different ablation modalities (Figure 7E–F).
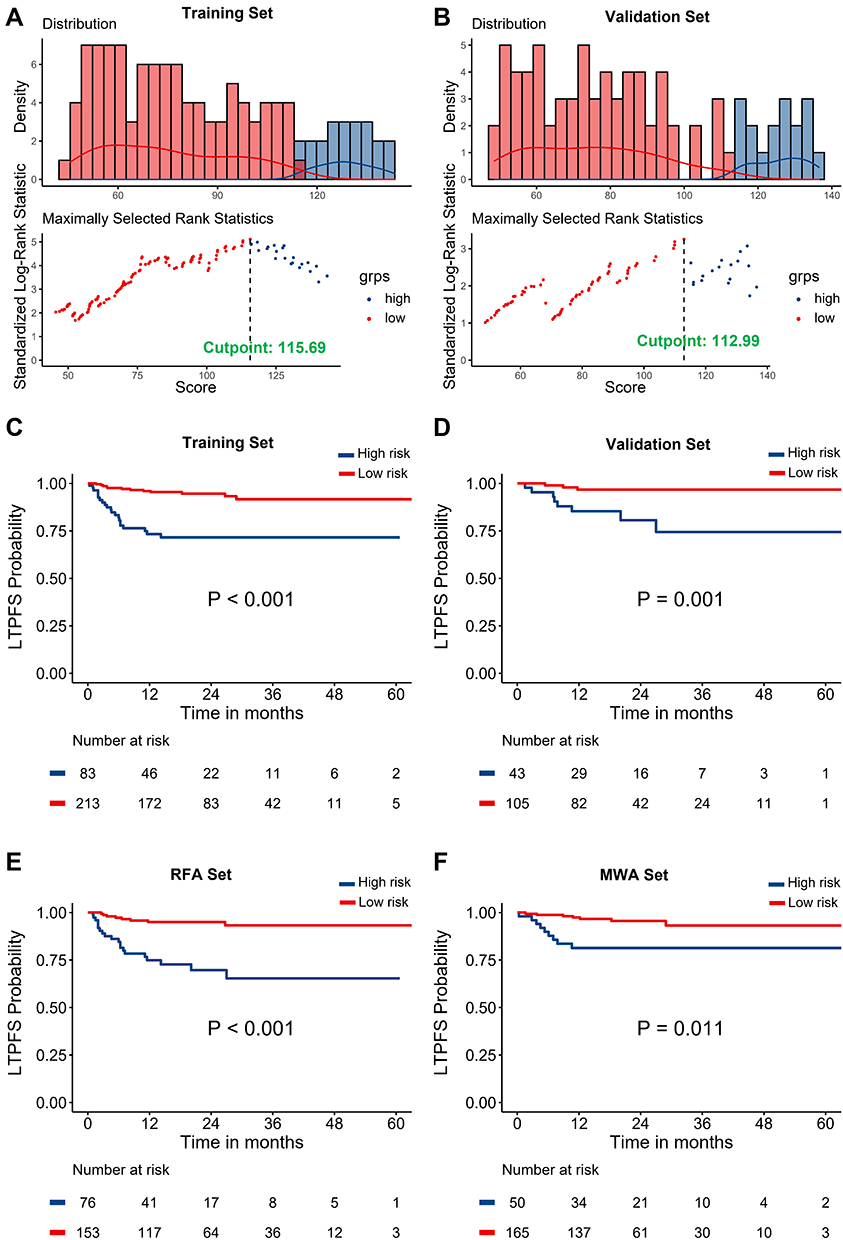 |
Figure 7 Graphs show cumulative rates of LTP according to two risk strata defined by 115.69 of cut-off of the nomogram in the development and validation cohorts. (A) the optimal cut-off value based on maximally selected log-rank statistics in the training set; (B) the optimal cut-off value based on maximally selected log-rank statistics in the validation set; (C) the cumulative LTP rate in high-risk group was higher than that in low-risk group in the training set; (D) the cumulative LTP rate in high-risk group was higher than that in low-risk group in the validation set; (E) the cumulative LTP rate in high-risk group was higher than that in low-risk group in RFA group; (F) the cumulative LTP rate in high-risk group was higher than that in low-risk group in MWA group. Abbreviations: LTP, local tumor progression; RFA, radiofrequency ablation; MWA, microwave ablation. |
Discussion
To the best of our knowledge, this is the first study investigating the optimal AM in the thermal ablation of single HCC with specific diameter (diameter ≤3 cm). In this study, there were three predominant findings: 1) for ablation treatment in early-stage HCC, a 5-mm AM not only is the optimal safety margin but also plays an essential role in local tumor control; 2) the nomogram comprising the quantitative AM and tumor size has a better predictive ability for predicting the risk of LTP than conventional indices; and 3) adopting a continuous model instead of a categorized model provides individualized and stratified LTP estimates for clinical practice and clinical trials. The strength and novelty of this study mainly included the following two aspects: on the one hand, the achievement of an optimal AM can offer precise ablation treatment in single small HCC; and on the other hand, individualized prediction has been perceived as another requisite for an optimal predictive model of LTP.
In our previous studies, the results of MRI image fusion with an MRI workstation demonstrated the feasibility of the image fusion technique in the assessment of the RFA procedure for HCC.20 In the present study, we adopted the MRI–MRI image fusion method to evaluate and measure the AM with a commercially available ultrasound workstation for the MRI–MRI image fusion before and after IPTA, which is feasible and acceptable.
With the use of MRI–MRI image fusion, a total of 444 patients with single HCC (diameter ≤3 cm) acquired a well-defined AM. In our study, we used AIC-selected RCS models to identify the optimal cut-off value of the AM with a pronounced nonlinear effect due to the constant AM with the increase in the tumor diameter. The results suggested that a 5-mm AM is the most suitable safety margin for HCC with a diameter ≤3 cm to minimize the risk of LTP, which was consistent in the RFA or MWA subgroups. The LTP occurrence rate was 10% (44/444) in three medical centers, which met the range varied from 2% to 36% in previous studies.24–27
According to the multivariate Cox regression model, tumor size and AM were only two risk factors for LTP, which is entirely consistent with previous study results. Therefore, the nomogram based on these two variables to predict the LTP risk was built, and the LTPFS risk of the two strata was identified by the cut-off value.
In this study, the tumor size and AM were both risk factors for LTP, but the two of them had essentially opposite correlations with LTP. A larger tumor size may cause an increase in the area of microinvasion around the target tumor, and a larger AM can eliminate micrometastases to the greatest extent. Intriguingly, although the predictive value of these risk factors seems obvious, the cut-off values for risk stratification have long been controversial, and most AM and tumor size cut-offs are arbitrarily or empirically adopted. Most studies consider a 5- to 10-mm AM to be a suitable safety boundary, and a few scholars have suggested that a 3-mm AM is sufficient.28–30 Moreover, the BCLC stage considers a tumor diameter of 2 cm as a cut-off that defines the very early and early stages of HCC. Thus, the nomogram comprising the quantitative AM and tumor size value was advantageous as it was explicitly developed for precise IPTA candidates and adopting evidence-based cut-off values based on a large multicenter cohort, thus providing more detailed criteria for stratification.
Target populations, including the characteristics and heterogeneity of populations, are a critical issue in the development of risk score models because they largely influence the performance of these models. HCC patients with BCLC stages 0 or A who underwent IPTA have been identified as the optimal therapeutic population in previous randomized controlled trials and various clinical guidelines.31–33 However, unlike survival prognosis models, liver function and biological features are not crucial determinants of LTP after IPTA. The AFP level, BCLC stage, and ALBI grade were not identified as independent prognostic factors according to Cox regression analysis. Moreover, these biomarkers and clinical stages do not have good predictive power according to the comparison of time-independent area under the curve (AUC) values. In contrast, the AM is the most important predictor for LTP after IPTA. These results indirectly proved that there must be some target tumor microinvasion with a particular spatial range that is difficult to distinguish based on contrast-enhanced images. Therefore, an accurate and reasonable AM for early HCC is essential to reduce the risk of LTP when HCC patients receive IPTA in this era of precise medicine.
Actually, LTP is not only associated with the tumor size and AM, other factors including technical ability, accuracy of being able to determine potential AM’s in real-time, tumor biology, etc. First, it is difficult to quantitatively analyze the personal skills of the operators with statistical methods in the retrospective analysis, and it may also be inaccurate. The outcome of ablation by different operators is directly related to AM, an experienced operator is often able to obtain an ideal AM, which means that the ablation area is sufficient and the treatment effect is better. The AM measured in our postoperative MRI within 1 month is used to evaluate the effect of ablation, which should reflect the skill of operators to a certain extent. Second, in order to get accurate images, all preablation MRI scans were performed within 1 month before the IPTA procedure, and all postablation MRI scans were conducted within 1 month following the IPTA procedure. the shape of the ablation area will change over time due to the metabolic mechanism, and the degree of change was mainly based on the characteristics and heterogeneity of the population. Although we ensured that the MR image after ablation was obtained within 1 month in this study, it is difficult to avoid this issue and keep the same between the post-ablative ablation area and the intraoperative ablation area. Future studies focusing on intraoperative ablative images are needed to confirm our findings.
Last but not least, the pathological characteristics of the tumor indeed have an impact on the prognosis of patients. In fact, when patients with typical imaging features meet the clinical diagnostic criteria, they are usually not recommended to needle biopsy for the purpose of diagnosis.34 So, not all patients have undergone needle biopsy. Therefore, pathological characteristics of the tumor were not analyzed in this study. This is also the deficiency of our experiment. We will continue to improve in the follow-up research.
Besides, there are some limitations to our study. First, the risk of selection bias is unavoidable in observational studies. However, this risk has been minimized by the inclusion of all consecutive patients and a large cohort of unresectable HCC candidates for IPTA to date. Second, the current study is limited to patients with single small hepatocellular carcinoma. In fact, as the number of lesions and tumor size increase, the situation becomes more complicated. Moreover, combination of therapies should also be considered in follow-up studies compared to ablation alone.
In conclusion, based on findings from a large multicenter cohort, the tumor size and AM were significantly associated with LTP and 5-mm was recommended as the optimal AM for IPTA treatment in HCC (diameter ≤3 cm) for the first time. Besides, with an easy-to-use model consisting of continuous tumor size and AM, the nomogram model exhibited adequate performance and individualized prediction that could stratify patients into 2 groups with a significantly different LTPFS. Therefore, the visual score model may help with decision-making for IPTA in clinical practice and thermal field range control during the ablation process.
Copyright/Ethics
This retrospective multicenter study obtained institutional review board approval from all participating hospitals. They are Medical Clinical Trial Ethics Committee of the Third Affiliated Hospital of Sun Yat-sen University, Ethics Committee of Fujian Provincial Hospital and Ethics Committee of Sun Yat-sen University Cancer Center. Because this is a retrospective study, the requirement for written informed consent was waived after obtaining the approval of each ethics committee. All participants in this study promised to maintain the confidentiality of all patient data and strictly abide by the Declaration of Helsinki.
Funding
There is no funding to report.
Disclosure
The authors declare no conflicts of interest.
References
1. Nault JC, Sutter O, Nahon P, Ganne-Carrié N, Séror O. Percutaneous treatment of hepatocellular carcinoma: state of the art and innovations. J Hepatol. 2018;68:783–797.
2. Uhlig J, Sellers CM, Stein SM, Kim HS. Radiofrequency ablation versus surgical resection of hepatocellular carcinoma: contemporary treatment trends and outcomes from the United States National Cancer Database. Eur Radiol. 2019;29:2679–2689.
3. Hermida M, Cassinotto C, Piron L, et al. Multimodal percutaneous thermal ablation of small hepatocellular carcinoma: predictive factors of recurrence and survival in western patients. Cancers. 2020;12:313.
4. Yu J, Liang P, Yu XL, et al. Local tumour progression after ultrasound-guided microwave ablation of liver malignancies: risk factors analysis of 2529 tumours. Eur Radiol. 2015;25:1119–1126.
5. Suh SW, Choi YS. Predictors of micrometastases in patients with Barcelona Clinic Liver Cancer Classification B hepatocellular carcinoma. Yonsei Med J. 2017;58:737–742.
6. Martins-Filho SN, Alves V, Wakamatsu A, et al. A phenotypical map of disseminated hepatocellular carcinoma suggests clonal constraints in metastatic sites. Histopathology. 2019;74:718–730.
7. Hidaka M, Eguchi S, Okuda K, et al. Impact of anatomical resection for hepatocellular carcinoma with microportal invasion (vp1): a multi-institutional study by the Kyushu Study Group of Liver Surgery. Ann Surg. 2020;271:339–346.
8. Kuvshinoff BW, Ota DM. Radiofrequency ablation of liver tumors: influence of technique and tumor size. Surgery. 2002;132:
9. Hirooka M, Ochi H, Koizumi Y, et al. Local recurrence of hepatocellular carcinoma in the tumor blood drainage area following radiofrequency ablation. Mol Clin Oncol. 2014;2:182–186.
10. Fujiwara N, Friedman SL, Goossens N, Hoshida Y. Risk factors and prevention of hepatocellular carcinoma in the era of precision medicine. J Hepatol. 2018;68:526–549.
11. Ahmed M, Solbiati L, Brace CL, et al. Image-guided tumor ablation: standardization of terminology and reporting criteria – a 10-year update. J Vasc Interv Radiol. 2014;25(11):1691–1705.e1694.
12. Jiang C, Liu B, Chen S, Peng Z, Xie X, Kuang M. Safety margin after radiofrequency ablation of hepatocellular carcinoma: precise assessment with a three-dimensional reconstruction technique using CT imaging. Int J Hyperthermia. 2018;34:1135–1141.
13. Laimer G, Schullian P, Jaschke N, et al. Minimal ablative margin (MAM) assessment with image fusion: an independent predictor for local tumor progression in hepatocellular carcinoma after stereotactic radiofrequency ablation. Eur Radiol. 2020;30:2463–2472.
14. Tang H, Tang Y, Hong J, Chen T, Mai C, Jiang P. A measure to assess the ablative margin using 3D-CT image fusion after radiofrequency ablation of hepatocellular carcinoma. HPB. 2015;17:318–325.
15. Teng W, Liu KW, Lin CC, et al. Insufficient ablative margin determined by early computed tomography may predict the recurrence of hepatocellular carcinoma after radiofrequency ablation. Liver Cancer. 2015;4:26–38.
16. Makino Y, Imai Y, Igura T, et al. Feasibility of extracted-overlay fusion imaging for intraoperative treatment evaluation of radiofrequency ablation for hepatocellular carcinoma. Liver Cancer. 2016;5:269–279.
17. Minami Y, Minami T, Chishina H, et al. US-US fusion imaging in radiofrequency ablation for liver metastases. Dig Dis. 2016;34:687–691.
18. Kim SM, Shin SS, Lee BC, et al. Imaging evaluation of ablative margin and index tumor immediately after radiofrequency ablation for hepatocellular carcinoma: comparison between multidetector-row CT and MR imaging. Abdom Radiol. 2017;42:2527–2537.
19. Fujioka C, Horiguchi J, Ishifuro M, et al. A feasibility study: evaluation of radiofrequency ablation therapy to hepatocellular carcinoma using image registration of preoperative and postoperative CT. Acad Radiol. 2006;13:986–994.
20. Kim KW, Lee JM, Klotz E, et al. Safety margin assessment after diofrequency ablation of the liver using registration of preprocedure and postprocedure CT images. AJR Am J Roentgenol. 2011;196:W565–W572.
21. Wang XL, Li K, Su ZZ, Huang ZP, Wang P, Zheng RQ. Assessment of radiofrequency ablation margin by MRI-MRI image fusion in hepatocellular carcinoma. World J Gastroenterol. 2015;21(17):5345–5351.
22. Heimbach JK, Kulik LM, Finn RS, et al. AASLD guidelines for the treatment of hepatocellular carcinoma. Hepatology. 2018;67:358–380.
23. Colombo M. EASL clinical practice guidelines for the management of occupational liver diseases. Liver Int. 2020;40(Suppl 1):136–141.
24. Atwell TD, Schmit GD, Boorjian SA, et al. Percutaneous ablation of renal masses measuring 3.0 cm and smaller: comparative local control and complications after radiofrequency ablation and ryoablation. AJR Am J Roentgenol. 2013;200:461–466.
25. Thamtorawat S, Rojwatcharapibarn S, Tongdee T, Siriapisith T. The outcome of radiofrequency ablation of metastatic liver tumors. J Med Assoc Thai. 2016;99:424–432.
26. Abtin F, Quirk MT, Suh RD, et al. Percutaneous cryoablation for the treatment of recurrent malignant pleural mesothelioma: safety, early-term efficacy, and predictors of local recurrence. J Vasc Interv Radiol. 2017;28:213–221.
27. Takahashi H, Kahramangil B, Berber E. Local recurrence after microwave thermosphere ablation of malignant liver tumors: results of a surgical series. Surgery. 2018;163:709–713.
28. Kim YS, Lee WJ, Rhim H, Lim HK, Choi D, Lee JY. The minimal ablative margin of radiofrequency ablation of hepatocellular carcinoma (> 2 and < 5 cm) needed to prevent local tumor progression: 3D quantitative assessment using CT image fusion. AJR Am J Roentgenol. 2010;195:758–765.
29. kang HJ, Kim YI, Kim HC, Jae HJ, Hur S, Chung JW. Does establishing a safety margin reduce local recurrence in subsegmental transarterial chemoembolization for small nodular hepatocellular carcinomas. Korean J Radiol. 2015;16:1068–1078.
30. Kotewall CN, Cheung TT, She WH, et al. The role of radiofrequency ablation to liver transection surface in patients with close tumor margin of HCC during hepatectomy-a case matched study. Transl Gastroenterol Hepatol. 2017;2:33.
31. Pompili M, Saviano A, de Matthaeis N, et al. Long-term effectiveness of resection and radiofrequency ablation for single hepatocellular carcinoma ≤3 cm. Results of a multicenter Italian survey. J Hepatol. 2013;59:89–97.
32. Mohkam K, Dumont PN, Manichon AF, et al. No-touch multibipolar radiofrequency ablation vs. surgical resection for solitary hepatocellular carcinoma ranging from 2 to 5 cm. J Hepatol. 2018;68:1172–1180.
33. Doyle A, Gorgen A, Muaddi H, et al. Outcomes of radiofrequency ablation as first-line therapy for hepatocellular carcinoma less than 3 cm in potentially transplantable patients. J Hepatol. 2019;70:866–873.
34. Roberts LR, Sirlin CB, Zaiem F, et al. Imaging for the diagnosis of hepatocellular carcinoma: a systematic review and meta-analysis. Hepatology. 2018;67:401–421.
 © 2021 The Author(s). This work is published and licensed by Dove Medical Press Limited. The
full terms of this license are available at https://www.dovepress.com/terms
and incorporate the Creative Commons Attribution
- Non Commercial (unported, 3.0) License.
By accessing the work you hereby accept the Terms. Non-commercial uses of the work are permitted
without any further permission from Dove Medical Press Limited, provided the work is properly
attributed. For permission for commercial use of this work, please see paragraphs 4.2 and 5 of our Terms.
© 2021 The Author(s). This work is published and licensed by Dove Medical Press Limited. The
full terms of this license are available at https://www.dovepress.com/terms
and incorporate the Creative Commons Attribution
- Non Commercial (unported, 3.0) License.
By accessing the work you hereby accept the Terms. Non-commercial uses of the work are permitted
without any further permission from Dove Medical Press Limited, provided the work is properly
attributed. For permission for commercial use of this work, please see paragraphs 4.2 and 5 of our Terms.