")
Back to Journals » Journal of Multidisciplinary Healthcare » Volume 16
An Observational Pilot Study of a Tailored Environmental Monitoring and Alert System for Improved Management of Chronic Respiratory Diseases
Authors Alotaibi M, Alnajjar F , Alsayed BA, Alhmiedat T , Marei AM, Bushnag A, Ali L
Received 17 August 2023
Accepted for publication 16 November 2023
Published 5 December 2023 Volume 2023:16 Pages 3799—3811
DOI https://doi.org/10.2147/JMDH.S435492
Checked for plagiarism Yes
Review by Single anonymous peer review
Peer reviewer comments 2
Editor who approved publication: Dr Scott Fraser
Mohammed Alotaibi,1 Fady Alnajjar,2 Badr A Alsayed,3 Tareq Alhmiedat,1,4 Ashraf M Marei,1,4 Anas Bushnag,1,4 Luqman Ali2
1Artificial Intelligence and Sensing Technologies (AIST) Research Center, University of Tabuk, Tabuk, Saudi Arabia; 2Department of Computer Science and Software Engineering, College of Information Technology, United Arab Emirates University (UAEU), Al Ain, United Arab Emirates; 3Department of Internal Medicine Faculty of Medicine, University of Tabuk, Tabuk, Saudi Arabia; 4Faculty of Computers & Information Technology, University of Tabuk, Tabuk, Saudi Arabia
Correspondence: Mohammed Alotaibi; Fady Alnajjar, Email [email protected]; [email protected]
Objective: Chronic lung-related diseases, with asthma being the most prominent example, characterized by diverse symptoms and triggers, present significant challenges in disease management and prediction of exacerbations across patients. This research aimed to devise a practical solution by introducing a personalized alert system tailored to individual lung function and environmental conditions, offering a holistic approach for the management of a range of chronic respiratory conditions.
Methods: In response to these challenges, we developed a personalized alert system based on individual lung function tests conducted in diverse environmental conditions, as determined by air-quality sensors. Our research was substantiated through an observational pilot study involving twelve healthy participants. These participants were exposed to varying air quality, temperature, and humidity conditions, and their lung function, as indicated by peak expiratory flow (PEF) values, was monitored.
Results: The study revealed pronounced variability in pulmonary responses across different environments. Leveraging these findings, we proposed a design of a personalized alarm system that monitors air quality in real-time and issues alerts under potentially unfavorable environmental conditions. Additionally, we investigated the use of basic machine learning techniques to predict PEF values in these varied environmental settings.
Discussion: The proposed system offers a proactive approach for individuals, particularly those with asthma, to actively manage their respiratory health. By providing real-time monitoring and personalized alerts, it aims to minimize exposure to potential asthma triggers. Ultimately, our system seeks to empower individuals with the tools for timely intervention, potentially reducing discomfort and enhancing management of asthma symptoms.
Keywords: respiratory health, real-time air-quality monitoring, lung functionality, alert system
Introduction
Asthma, a chronic pulmonary disorder, afflicts approximately 374 million people globally with annual 461,000 deaths.1 It is concerning to acknowledge that despite the highest incidence of asthma being reported in countries with high socio-demographic indices (SDIs), the maximum mortality rate due to this condition is observed in low and middle SDI countries.2 According to the most recent report from the Global Initiative for Asthma (GINA), asthma remains insufficiently diagnosed, with its prevalence being inadequately documented in numerous middle and low-income countries.3 A closer look at the United Arab Emirates (UAE) reveals that the disease prevalence among school-aged children is approximately between 9.8% and 11.9%, with some variability attributable to age.4 In neighboring Saudi Arabia, the situation is similar, if not more concerning. The number of children with asthma is much higher than adults, with rates varying from 9% to 33.7% depending on the area.5 In the broader Middle East region, asthma prevalence varies between 4.4% and 7.6%.6 Asthma is defined by periodic episodes of wheezing, shortness of breath, and coughing, caused by the inflammation and narrowing of the respiratory tract.7 This chronic condition stems from the complex interaction of genetic and environmental elements, such as air pollution. Asthma places an enormous strain on patients’ physical, social, emotional, and professional lives, with a significant impact on their quality of life and a marked burden on healthcare systems worldwide.
Asthma management is challenging due to the vast variability in individual symptoms and triggers, such as exercise, weather, cold air, certain foods, tobacco smoke, temperature changes, humidity, and strong odors.8,9 Recognizing and avoiding these triggers is essential, but identification and active avoidance are often difficult.10 The effects of these triggers vary among individuals,3 emphasizing the importance of monitoring and predicting them to prevent acute episodes. Current literature mostly focuses on bio-signal factors for asthma prediction,11 with fewer studies examining environmental factors.12 Crucially, only a handful have combined both elements in research.13
Asthma management has traditionally centered on medication use, patient education, and triggers avoidance, with recent trends shifting towards integrated care approaches aimed at improving asthma control and enhancing patients’ quality of life.14 Despite these strides, the variability of symptoms and triggers necessitates personalized management.15 Modern healthcare emphasizes strategies tailored to individual asthma phenotypes and endotypes.16 Advanced understanding of asthma’s pathophysiology has led to targeted biologic therapies and precision medicine.17 The rise of digital health interventions, like smart inhalers, offers continuous monitoring and personalized feedback.18 While these developments are promising, personalized asthma management remains nascent, requiring further research, especially in real-time monitoring and predictive analytics.19
Personalized alert systems are revolutionizing chronic disease management with real-time monitoring and response mechanisms. In diabetes, continuous glucose monitors with alert features enhance glycemic control and reduce hypoglycemic episodes.20,21 For heart disease, remote monitoring systems with personalized alerts aid in early cardiac anomaly detection, reducing hospitalizations and improving patient quality of life.22,23 In respiratory diseases like asthma or COPD, smart inhalers and spirometers provide real-time feedback and personalized medication and lung function alerts, potentially transforming management.24,25 This trend highlights a shift towards proactive, individualized chronic disease management emphasizing real-time monitoring and patient engagement.
Environmental factors, alongside biological ones, are crucial in understanding asthma triggers. Indoor allergens like dust mites, pet dander, and mold, as well as environmental elements such as humidity and temperature variations, correlate with increased asthma hospital admissions and reduced lung function.26–28 Recognizing the role of these factors is pivotal in shaping individualized asthma management strategies. This may involve alert systems warning patients of adverse air-quality or weather conditions exacerbating their symptoms. Given asthma’s variability and unpredictability, there’s a call for tailored monitoring approaches. Although standard methods work for most, they sometimes neglect those with unique symptom profiles and specific triggers.29 This underscores the need for a shift towards personalized strategies, which recognize individual symptom patterns and triggers, integrating both biological and environmental aspects, and suggesting efficient monitoring methods.
Our research is geared towards creating an affordable, practical, and personalized alert system to revolutionize chronic lung-related diseases, including asthma. Based on individual pulmonary function tests and real-time environmental data, our proposed system aims to provide timely, personalized alerts according to the individual’s respiratory health status. We propose that this tailored approach will gradually empower individuals to proactively monitor their respiratory health, foresee potential exacerbations, and initiate timely interventions, consequently avoiding asthma attacks and enhancing their overall quality of life. While our current study focuses on healthy individuals, we believe that the concept and scenario are applicable and beneficial for asthmatic patients.17
Methodology
System Overview
Our objective in designing the personalized alert system is to safeguard individuals’ respiratory wellbeing by issuing timely alerts prior to their exposure to potentially discomforting environmental conditions. This is achieved by monitoring and correlating their lung function with specific environmental data. Given the considerable variability of lung function among individuals, our goal is to create a system capable of accommodating this diversity and delivering tailored alerts that align with each individual’s unique respiratory characteristics. The alert system operates by integrating data from two primary sources: individual lung function tests and real-time environmental monitoring.
For the lung function tests, we used spirometers to capture Peak Expiratory Flow (PEF) values.30 PEF values are a reliable measure of lung function, and fluctuations in these values can indicate a potential asthma attack. For environmental monitoring, we deployed two types of portable air-quality sensors, one custom-built and the other commercially available, both adept at identifying a variety of common asthma triggers, such as particulate matter, humidity, and temperature fluctuations, Figures 1–3. The custom-built sensor in this experiment has neither direct contact nor giving prescriptive actions to the study participants. It was incorporated parallelly in this pilot study for validation purposes, and to facilitate future use. When the system predicts a potential risk, it generates an alert. The alerts are designed to be unobtrusive yet attention-grabbing, delivered through the device and the associated smartphone app. The app not only notifies the individual of a potential risk but also provides initial recommendations on how to avoid it, such as staying indoors or refreshing the room air, Figure 4).
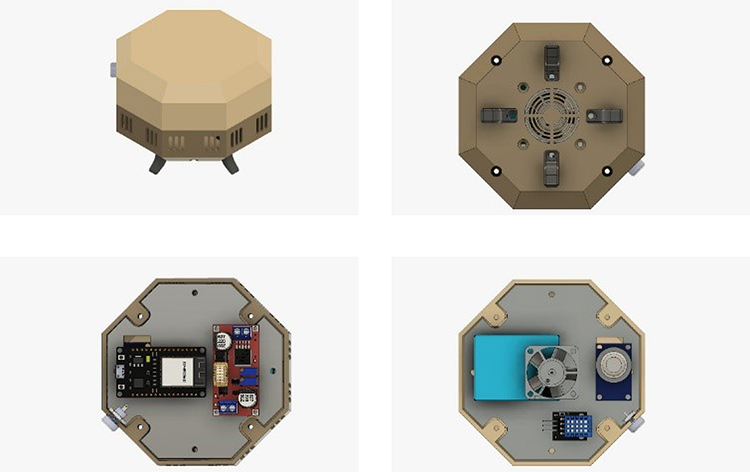 |
Figure 1 The customized Air-Quality Sensor (AQ-S). The sensor, encased in a 3D-printed cover, has been engineered for portability and scalability. The fan in the air-quality sensor is used to draw in ambient air for sampling, ensuring a continuous and representative analysis of the surrounding air-quality. Height: 2.5cm, W/L: 5cm. |
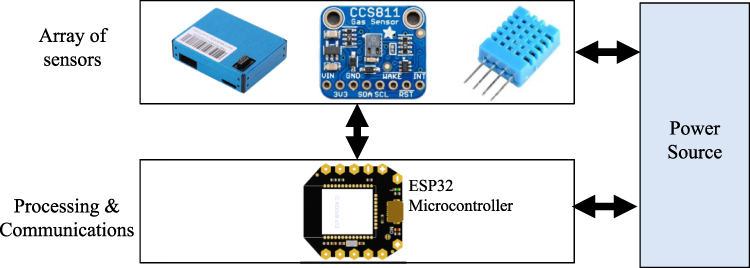 |
Figure 2 Node Architecture. Details about the used array of sensors are in Table 1. The ESP32 microcontroller is employed to facilitate the processing and communication between the sensors and the user application. |
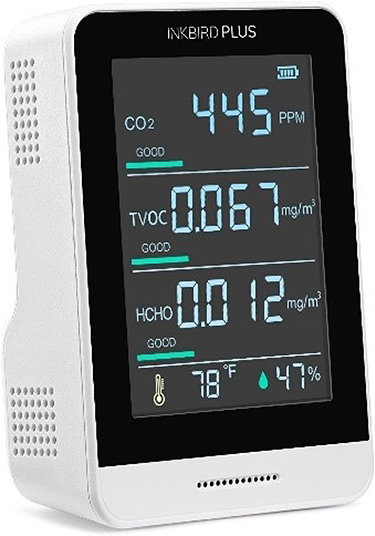 |
Figure 3 Commercialized available: InkbirdPlus Air-quality Monitor. |
 |
Figure 4 System flowchart. The variable “X” is a time-dependent measure, established through the evaluation of PEF responses to environmental alterations. As per the findings of this pilot study, the value of “X” is initially set at 0.4. However, it is anticipated that this value will be progressively adjusted to accurately reflect the lung capacity of each individual. |
 |
Table 1 Specification of the Custom-Built (Figure 2) and Commercially Available (Figure 3) Air-Quality Sensors are Provided. The Classification of Good/Normal Indoor Air Quality Adheres to the Global Air-Quality Guidelines Established by the World Health Organization (WHO).31 |
Air-Quality Sensors
In this study, we employed two types of sensors to gauge the quality of air within a room: a customized lab made sensor constructed using an ESP32 microcontroller, Figures 1 and 2, and a commercial air-quality sensor to authenticate the readings obtained from the customized device, Figure 3. We are utilizing the customized sensor to facilitate the programming of varying alarm thresholds, which were based on data derived from the PEF reader, details are in Figure 4. Such a feature is not accessible in the closed-source commercial sensors.
The both sensors were designed to monitor various elements including Humidity, Temperature, Fine particulate matter with a diameter of 2.5/10 micrometers or smaller (PM2.5)/(PM10), Total Volatile Organic Compounds (TVOC), and Carbon Dioxide (CO2). In the customized device, we employed the DHT-11 sensor module to record temperature and humidity readings, while the TVOC sensor module was utilized to assess air-quality and the Carbon Dioxide (CO2) levels. The PM2.5 sensor module was used to measure dust particles. Table 1 outlines the range of recorded values, the corresponding sensor module used, and the range of sensed data. The architecture of the sensor node in terms of the required sensor array and the employed microcontroller is illustrated in Figure 2.
Lungs Function Tester
The selection of participants for our pilot study was centered on healthy young individuals who did not have a known diagnosis of asthma or any other chronic respiratory condition. We chose healthy volunteers to control for any potential confounding effects that existing respiratory conditions might have on lung function or response to environmental conditions. A total of 12 volunteers, aged between 20 and 25 years, were recruited as participants for the study, as shown in Table 2. Prior to their involvement, all participants provided informed consent for their participation in the research. The study was approved by the Ethic Committee of the University of Tabuk, which complies with the Declaration of Helsinki.
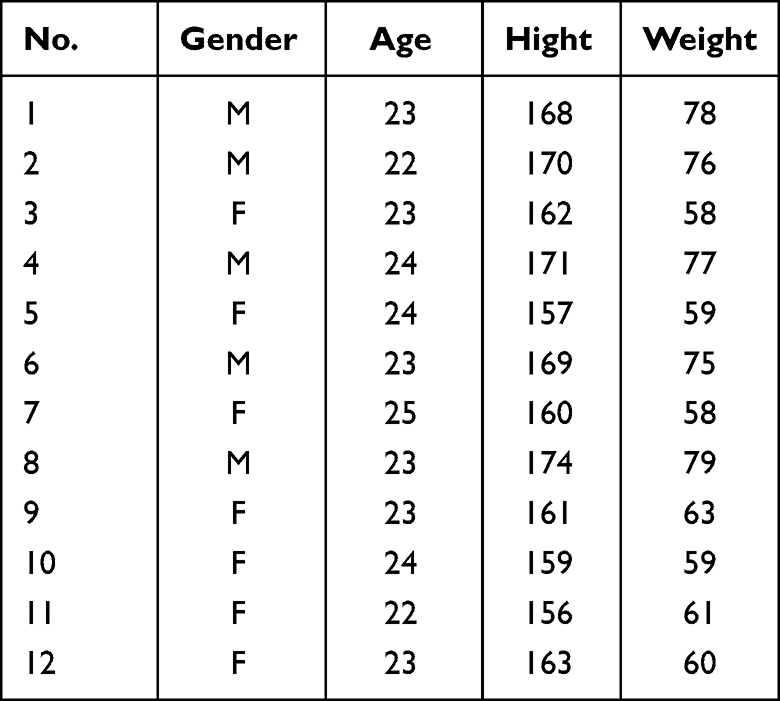 |
Table 2 Participant Demographics |
For lung function tests, we used a standard spirometer to measure Peak Expiratory Flow (PEF) values.1 These values provide a measure of the maximum speed at which participants can exhale, offering a reliable indicator of lung function. PEF is a measure of how fast a person can exhale air after taking a deep breath, and it is influenced by various factors, including environmental conditions. Participants were instructed on the proper use of the spirometer, and measurements were taken three times for each participant in each environment, after being in the environment for 20 minutes, to ensure accuracy. The best of these three values was recorded as the participant’s PEF for that specific environmental condition. Upon completion of the data collection process, participants were requested to fill out a brief survey. The survey was used to streamline data collection and minimize external factors. The survey consists of three concise questions: A) Did the participant experience breathing discomfort during the experiment? (yes/no). B) Were there any factors that may have affected the data collection? (yes/no). C) If yes, could the participant specify the factor and provide additional comments? This step was crucial to provide subjective insights that may complement the objective data collected through the PEF.
Collection of Environmental Data and PEF
In our research, we employed air-quality sensors (AQS) to measure an array of environmental parameters, encompassing levels of particulate matter, relative humidity, and ambient temperature. PEF was monitored in parallel with these air-quality metrics under four distinct environmental conditions: typical daily conditions, conditions with moderate dust/smoke enrichment, moderate temperature conditions, and moderate humidity conditions. Given the observational nature of our study, we instructed participants to measure their PEF and document the readings from the AQS in their primary living and sleeping spaces during standard conditions. An average AQS value was computed from these recorded values for analysis. Under the conditions of moderate dust/smoke enrichment, participants were instructed to record PEF and AQS measurements during their routine home incense-burning activities. For scenarios with moderate temperature, participants were asked to conduct the PEF and AQS measurements in the afternoon within a room where the air conditioning system had been turned off for the entire day. Finally, in the conditions of moderate humidity, participants recorded PEF and AQS measurements during the afternoon in a room where the air conditioner was operating in its dehumidifying, or “dry”, mode without its cooling function activated.
The collected environmental data was rigorously analyzed in tandem with the participants’ lung function data. We applied simple statistics to discern patterns and correlations between specific environmental conditions and changes in PEF values (details are in the results section). This approach allows us to establish a baseline of how each individual’s lung function, as measured by PEF, responds to different environmental conditions. This analysis formed the basis of our proposed personalized alert system, enabling us to identify potential environmental triggers for each individual and thereby tailor the alert system to each participant’s unique profile.
Results and Discussion
PEF in Standard Environment Condition
The collected data from the air-quality device, in conjunction with corresponding best of three PEF reading after a duration of 20 minutes spent within a standard indoor environmental condition, is demonstrated in Table 3. From the table we can conclude: First, we conducted a comparative analysis between our custom-built sensor and the commercially available counterpart. By comparing these air-quality measurements, we identified a high mean correlation coefficient of the recorded values of 95%. The noteworthy correlation coefficient signifies the reliability and accuracy of our custom device when compared against the commercial standard. This demonstrates the potential of our customized device as an affordable, yet precise open-sourced tool for monitoring air-quality and potential asthma triggers in real-time, and its potential integration into a personalized alert system for asthma management.
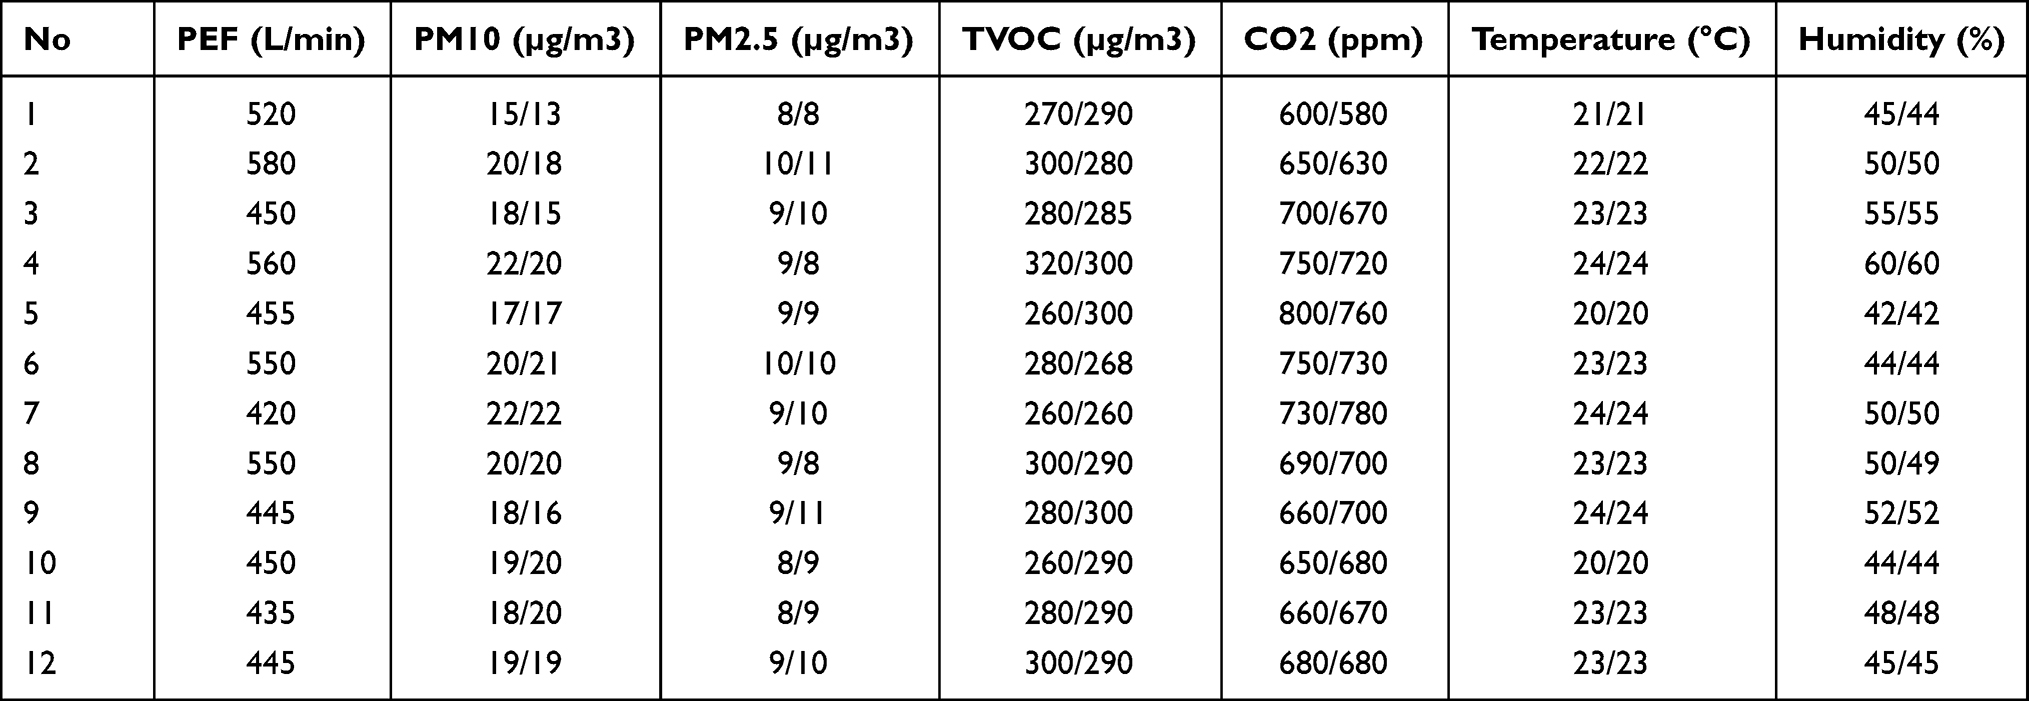 |
Table 3 PEF and Air-Quality Measurements in Indoor “Normal” Daily Environment. The Table Shows Two Air-Quality Values, the Left/Right is from the Commercialized/Customized Device |
Second, we juxtaposed the air quality values derived from these sensors with the recorded PEF values. In other words, we evaluated the Pearson correlation coefficient for each environmental variable in relation to the PEF values. Results are illustrated in Table 4. This assessment allowed us to discern which environmental factors had the greatest effect with PEF values. We found that the PM2.5 value had the strongest correlation with the PEF value. Other parameters, however, did not demonstrate a significant correlation (<0.5). These preliminary results suggest that PM2.5 levels are important to monitor, as they potentially exert a significant impact on PEF values.
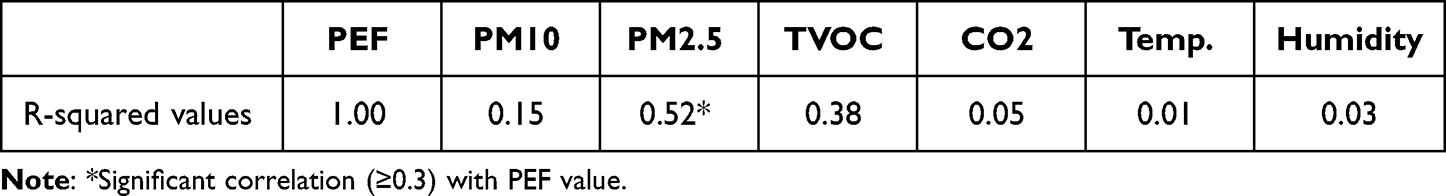 |
Table 4 Statistical Evaluation of R-Squared Values for Variables Relative to PEF |
Third, Table 3 confirms the healthy status of all study participants. Their PEF values were categorized following the criteria established by the Hankinson model.32 According to this model, PEF values exceeding 80% of the predicted optimum are classified as “normal” - a category often referred to as the “green zone”. All participants in our study fell within this “green zone”, underscoring their healthy condition.
PEF in Different Environment Conditions
Table 5 showcases the average and the standard deviation (SD) values registered from the air-quality sensor across varying environmental conditions to which the study participants were experienced. For ease of understanding, we have categorized these environmental conditions into 1) Air-quality room (Good, Medium), 2) Temperature (Normal, Slightly Hot), and 3) Humidity (Normal, Slightly-High). In the interest of safeguarding our participants, we consciously avoided subjecting them to drastic changes in environmental conditions, which could have possibly resulted in a more substantial correlation with PEF values. Despite this approach, which might be viewed as a limiting factor, our intent was to maintain the study as an initial exploration primarily aimed at understanding the overall effect of diverse environmental parameters on PEF values. The driving principle behind this decision was our objective to validate our study’s concept, while ensuring that participant safety remains paramount. The table indicates that in a room with medium air-quality, there was a noticeable rise in PM2.5 levels by 67%. Similarly, in a room with a slightly elevated temperature, there was a 45% increase in the temperature recorded. Moreover, in a room with slightly high humidity, the humidity levels saw a surge of 66%.
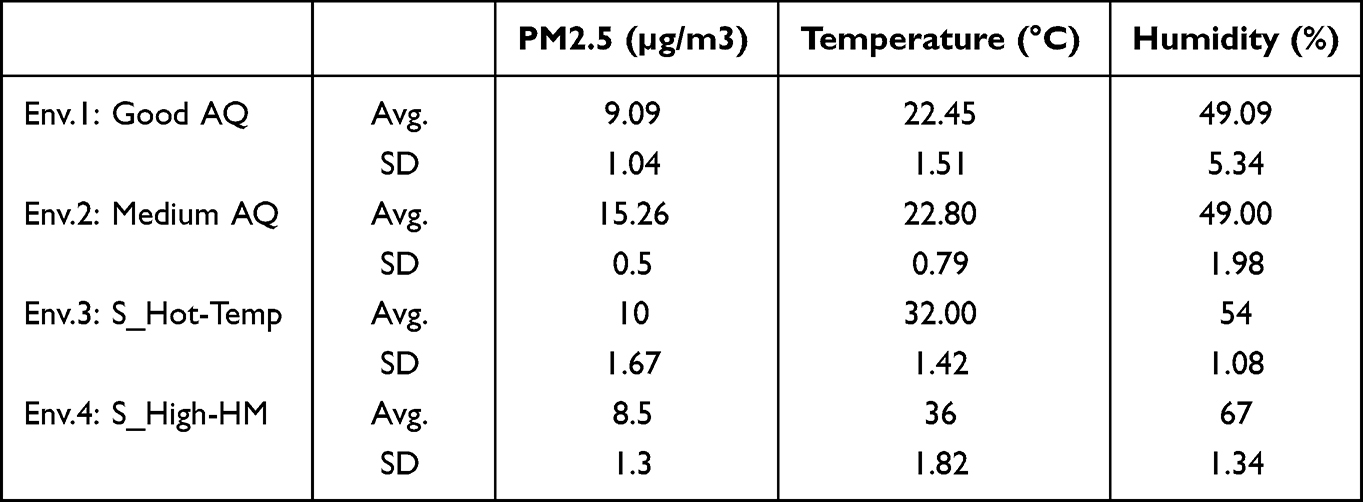 |
Table 5 Air-Quality Measurements in the Different Indoor Environments. AQ: Air-Quality, Temp: Temperature, HM: Humidity, S: Slightly |
Table 6 presents the PEF values under the different environmental conditions. This table reveals that PEF responds differently to different environmental conditions among participants. For instance, a noticeable decrease in PEF values was observed in some individuals when exposed to high levels of particulate matter PM2.5, suggestive of a potential trigger. Contrarily, variations in humidity and temperature did not evoke significant changes in PEF measurements for certain participants. Despite all participants experiencing the same environmental settings shifts, their PEF values varied, suggesting that their respiratory systems responded uniquely to these stimuli. Participants 3, and 10, for instance, demonstrated heightened sensitivity to minor changes in room air-quality in comparison to others. Consequently, it might be beneficial to establish lower thresholds for their air-quality alarms. By doing so, these individuals would receive early warnings, enabling them to vacate the room ahead of others, thereby ensuring their well-being.
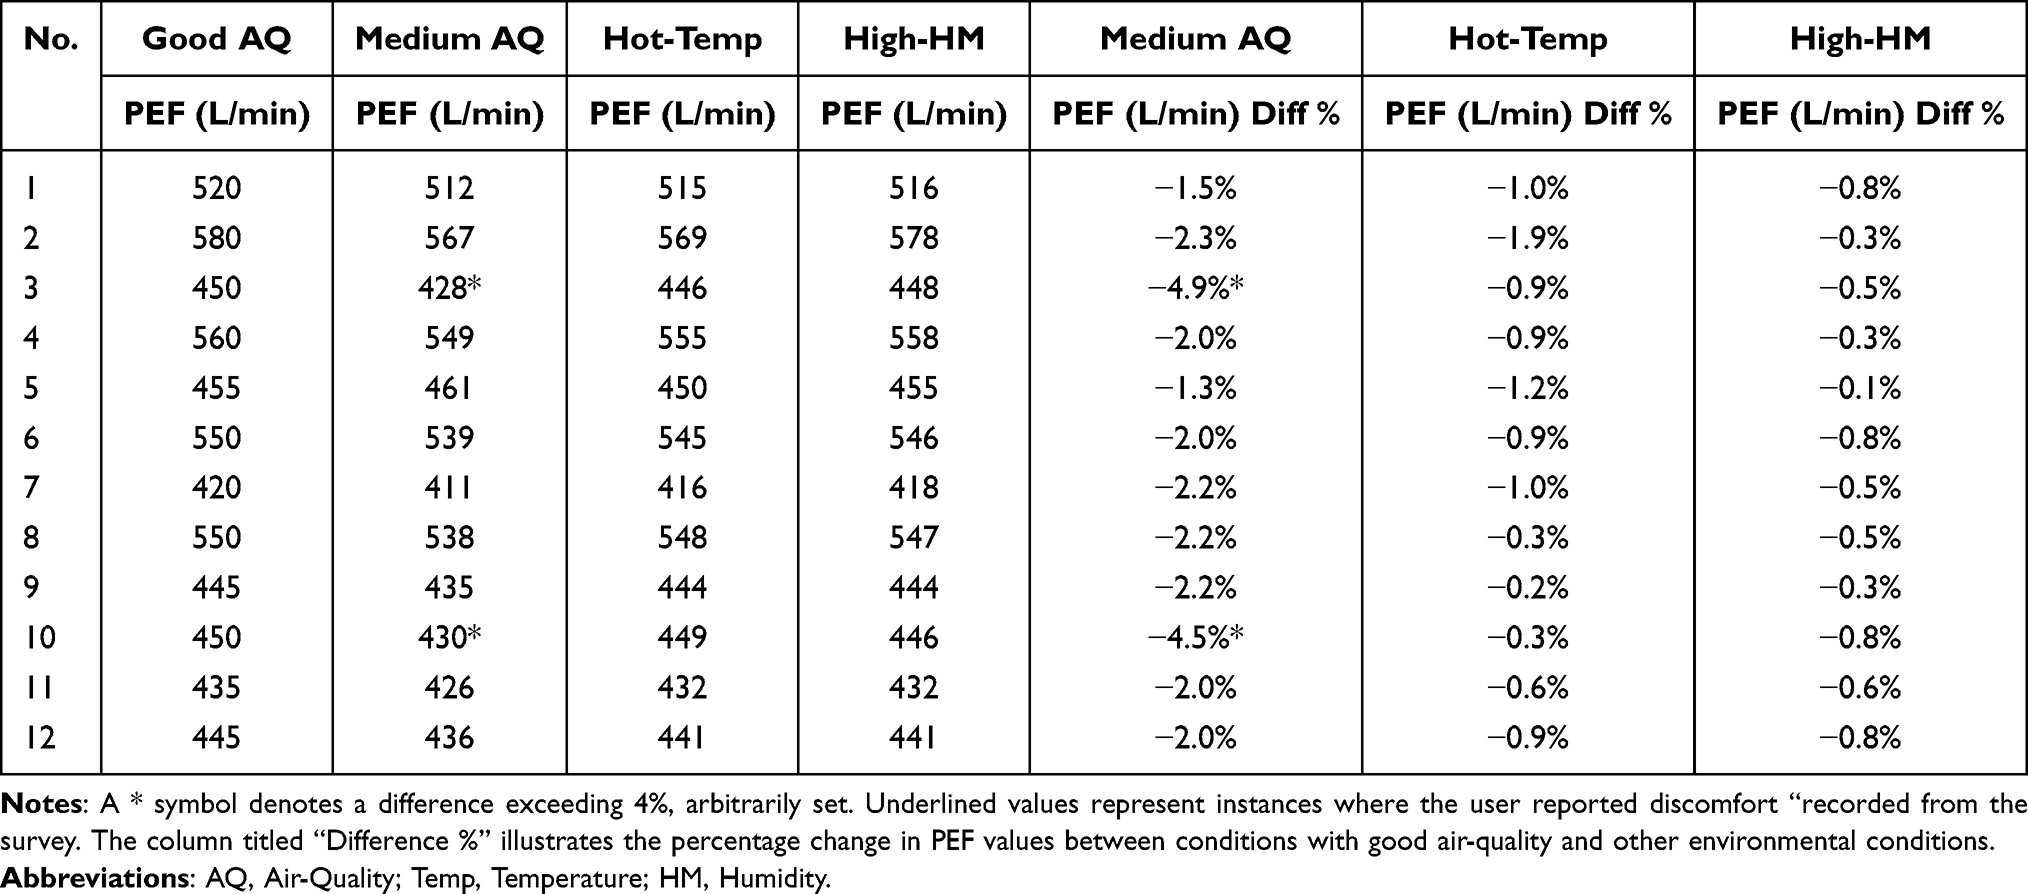 |
Table 6 PEF Values in Different Environmental Conditions |
The numbers underlined in the table represent participants who reported experiencing respiratory discomfort during the experiment, as per the first question of the administered survey. In response to the second and third questions of the survey, which probe for potential factors influencing data collection or any noteworthy comments, there were no significant points reported. These underlined values highlight some notable observations. Participant 10 reported experiencing respiratory discomfort, which corresponded with a significant drop in her PEF value (>0.4). Conversely, Participant 9 reported respiratory discomfort without a corresponding dip below the predetermined PEF threshold (<0.4). This is aligned with variability of normal human physiology and suggests that the threshold value for air quality alerts should be personalized and dynamically adjusted, considering each individual’s unique respiratory comfort level.
Personalized Threshold Identification
In order to determine potential triggers for participant(s), we evaluated the correlation between environmental conditions and changes in PEF values. The identification of personalized triggers was based on observing substantial decreases in PEF values when individuals were exposed to specific environmental conditions, Table 6. From Tables 5 and 6, we can conclude that when PM2.5 has increased to 67%, 2 out of the 12 participants could has more than 4% changes on their PEF values, and one of those 2 has felt uncomfortable. Setting an alarming system for these participants for instance can happen whenever PM2.5 increase up to 30–40% from the standard room value considering their sensitivity to PM2.5 value. Although some other participants reporting discomfort (the underlined value of participants 9), we did not observe significant changes in their PEF values. This observation was not the focus of this study and hence has been set aside. However, this highlights the potential influence of other factors beyond lung function that could be considered in future research.
While our initial expectation was to establish an individual threshold for each participant, limitations related to sample size and the slight variations in environmental conditions guided us to divide our participants into two groups. One group demonstrated higher sensitivity to air-quality changes, reflected in a PEF change of more than 4% (arbitrarily set), while the other group showed lesser sensitivity. Consequently, for the first, more sensitive group, we suggest setting the air-quality alert threshold to a 30–40% change in PM2.5. This would mean that if the PM2.5 value shifts by this percentage, an alert would be triggered, advising them to either leave the room or ventilate the space to improve air-quality.
Figure 4 illustrate the overall model of the proposed personalized alerting system, considering the insights gained from Tables 3, 5 and 6. The model consists of two stages: the initial stage and the personalized stage. In the initial stage, the system prompts the user to measure PEF in various environmental conditions. The model then calculates the changes in PEF values in relation to the changes in air-quality observed in these environments. Based on this information, the model sets the alert threshold “X” on the customized air-quality device. Once the threshold is set, the system enters the personalized stage. During this stage, the air-quality device periodically alerts the user to potential exposure to uncomfortable environmental conditions. The alerts serve as reminders for the user to take necessary precautions or adjust to ensure their comfort in response to the detected changes in air-quality. The threshold “X” is adaptable to ensure user comfort and can be fine-tuned accordingly. Additionally, the method for predicting the value of “X” will be detailed in the following section.
Predicting PEF Values in Different Environmental Conditions
In this study, we also explored the application of machine learning models to predict PEF values in different environmental conditions, good AQ (G_AQ) and medium AQ (M_AQ) conditions. The goal was to investigate the feasibility and effectiveness of using machine learning algorithms to predict PEF values in these specific environmental contexts. To achieve this, we employed feature selection methods, namely CfsSubsetEval33 and the Best_First search method, to identify the most relevant features that have an impact on PEF values in each condition. We then tested several classifiers, including linear regression, Multilayer Perceptron, and SMOreg (support vector machine for regression),34 to predict PEF values, Table 7. Although the root mean squared error (RMSE) values were relatively high, likely due to the limited size of our datasets, we observed interesting patterns: 1) Predicting PEF values in G_AQ conditions proved to be challenging using the available parameters. 2) We noted the potential in predicting PEF values for M_AQ conditions using a subset of the existing features (column 3, Table 7). These findings suggest that it is possible to predict PEF values, particularly for individuals who are sensitive to increases in PM2.5, and CO2 levels. However, we did not investigate the prediction of PEF in high temperature or high humidity conditions due to the lack of significant changes in PEF values under these conditions, Table 6. Although promising, the overall finding at this stage highlights the need for further exploration and improvement in predicting PEF values under different conditions. It’s pertinent also to note that, as we are developing our own air-quality sensors, we are considering the addition of a carbon monoxide (CO) sensor in future design. Given the known impact of CO on prevalent obstructive lung diseases such as asthma and COPD, we anticipate that this inclusion could offer significant value. Specifically, we expect a high correlation between changes in CO levels and alterations in PEF.
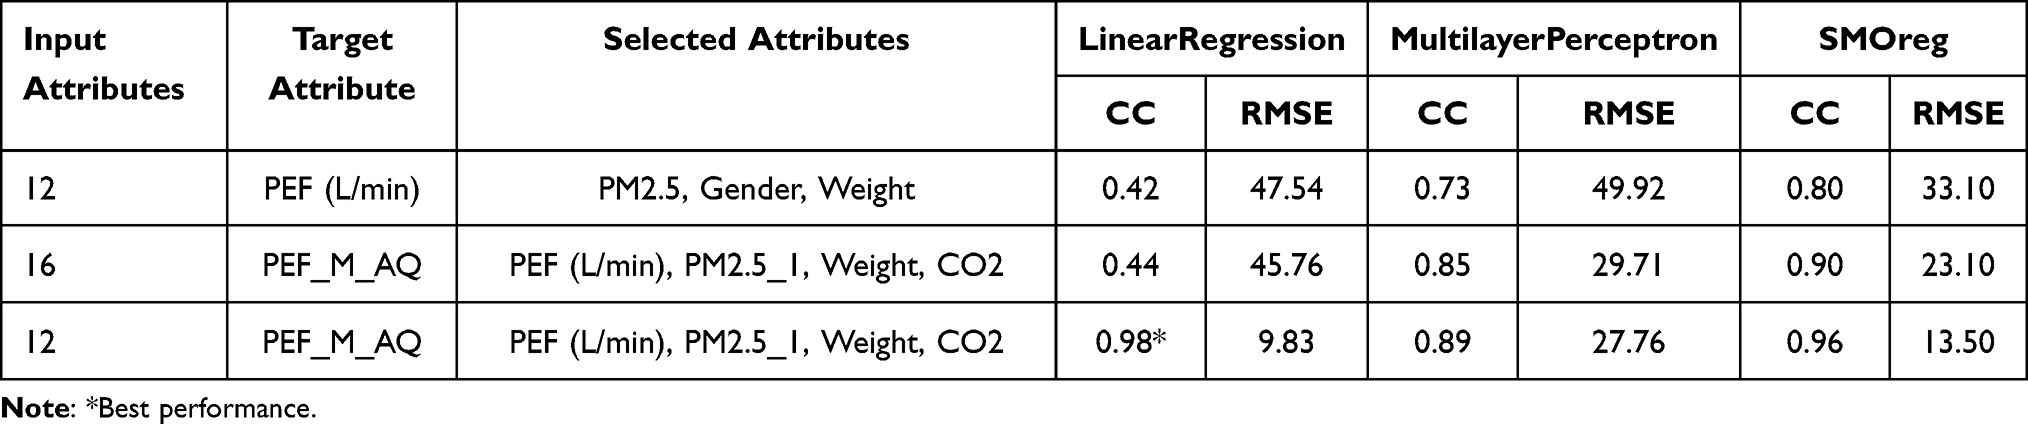 |
Table 7 Predicting PEF in Different Environmental Conditions |
Table 7 provides information on the performance of the number of the selected attributes and the tested models for predicting PEF in different conditions. The table displays the selected attributes in order of relevance, along with the correlation coefficient (CC) and Root Mean Square Error (RMSE) values obtained from linear regression, multilayer perceptron, and SMOreg model.
Insights and Limitation
From literature, we acknowledge the potential influence of factors such as air-quality, temperature, and humidity on individual PEF values, however, the main objective of this pilot study was to demonstrate the potential of developing personalized air-quality sensor alerts. These alerts are customized based on an individual’s lung function and readings obtained from different environmental conditions. By considering these factors, the proposed model aims to provide tailored alerts to individuals, enabling them to take proactive measures in response to their unique respiratory health needs. Another aspect we explored in this research was the use of machine learning. Our preliminary experiment suggests that there is potential to predict PEF values in different environmental scenarios by increasing the number of participants and environmental conditions. Although our study had limitations due to the small sample size and limited environmental variations, the results indicate promising avenues for further research and improvement. By incorporating machine learning techniques and expanding the dataset in real-world studies, we can enhance the accuracy and applicability of PEF predictions in diverse environmental conditions.
There are several limitations in this study that we acknowledge, including the limited number of participants. Furthermore, in our efforts to ensure participant safety by not exposing them to hazardous environments, we only introduced minor environmental variations. This precautionary measure, coupled with the restricted time each participant spent in each setting, may have influenced the efficacy of detecting significance PEF changes. These constraints also precluded us from conducting comprehensive statistical significance tests. While acknowledging the limitations at this stage of our study, we contend that the novelty of our research is rooted in highlighting the variability of individual PEF reactions to environmental shifts. As such, it’s clear that the prevailing “one-size-fits-all” model adopted by existing air-quality sensors in the market is not practically viable. Thus, our study highlights a methodology for creating a customized array of alert systems. These systems are specifically designed to adapt to each individual’s unique lung functions and possess the capability to evolve and learn over time.
In the next stages of this study, we aim to address the limitations of this work by expanding our participant sample size for more diverse data and conducting a longitudinal study to better understand the real-world impacts of environmental changes on lung function over time. We will also include a broader range of environmental factors, such as pollution levels and allergens, and continue to refine our personalized alerting system, which will be tuned by Machine learning models. Ultimately, we envision testing our system through clinical trials to assess its effectiveness and make necessary adjustments for real-world implementation. Our goal remains to develop a responsive and individualized alerting system for people with varying lung functions.
While our pilot study is focused on healthy individuals, this selection is pivotal to the validation of the overall concept. From an ethical perspective, it would be unseemly to expose asthmatic individuals at high risk to known respiratory irritants within the context of this study. Instead, our approach necessitates conducting an introductory examination on healthy participants, gradually modifying the system for higher risk groups within real-world contexts after the institution of all requisite safety protocols. Furthermore, demonstrating lung function variability amongst low-risk individuals strongly suggests the potential for the alert system to be adaptable and efficacious for higher risk individuals, including asthma patients. This indication is not only plausible but offers a compelling case for the adaptability of our system. We perceive this methodological approach as a strength of our study. Given that well-controlled asthma patients generally exhibit low PEF variability, akin to healthy individuals, they will be an appropriate group for further study. Conversely, poorly controlled asthmatics at high risk usually present high PEF variability, which our proposed alert system should more likely detect.14,17,35
The insights from this study could be further enhanced by including measurements of Forced Expiratory Volume in the first second (FEV1) and Forced Vital Capacity (FVC) alongside Peak Expiratory Flow (PEF). Nonetheless, adhering to the Global Initiative for Asthma (GINA) guidelines, which are authoritative for asthma monitoring outside of clinical environments, the use of either PEF or FEV1 is acceptable. For the sake of simplicity and the practicality of home monitoring, we focused solely on PEF. PEF serves as an effective measure for controlling and tracking asthma, forecasting flare-ups, and identifying potential triggers. Its ease of use, affordability, and the convenience of portability render it particularly appropriate for self-management in domestic settings. While PEF is primarily indicative of large airway patency, comprehensive spirometry tests that include the FEV1/FVC ratio are critical for diagnosing various lung disorders, including both obstructive and restrictive diseases. Acknowledging this, PEF maintains its crucial role as a fundamental element in managing asthma in day-to-day settings.
Conclusion
This pilot study highlights the potential of personalized approaches in the management of chronic lung-related diseases, including asthma. We have demonstrated the feasibility of an alert system that associates individual lung functions with changes in environmental data, providing a personalized alarming system to aid proactive asthma management. Although preliminary, this result highlights its potential as a robust tool for individuals to actively monitor their respiratory health, anticipate potential respiratory discomfort, and initiate timely interventions. While we acknowledge that our study was conducted on healthy individuals, the trends and patterns observed provide us with a firm basis for predicting how such a system might benefit those living with chronic respiratory conditions like asthma. Based on the pathophysiology of asthma disease, airways and therefore PEF are highly sensitive to environmental triggers, and we speculate that using such a personalized alarm system would be a valuable tool to augment asthma management. As we advance into an era marked by a growing emphasis on personalized healthcare and digital health technologies, it is vital to continue to explore and innovate ways to make the management of conditions like asthma more tailored, proactive, and efficient. The presented alert system structure is one step towards this vision, illustrating a compelling intersection of personalized healthcare and technology.
Institutional Review Board Statement
Ethical approval number: UT-300-141-2023.
Funding
This research was funded by Deputyship for Research & Innovation, Ministry of Education in Saudi Arabia for funding this research work through the project number (S-1442-0049).
Disclosure
The authors declare no conflicts of interest in this work.
References
1. Bateman ED, Hurd SS, Barnes PJ, et al. Global strategy for asthma management and prevention: GINA executive summary. Eur Respir J. 2008;31(1):143–178. doi:10.1183/09031936.00138707
2. Vos T, Lim SS, Abbafati C, et al. Global burden of 369 diseases and injuries in 204 countries and territories, 1990–2019: a systematic analysis for the global burden of disease study 2019. Lancet. 2020;396:1204–1222. doi:10.1016/S0140-6736(20)30925-9
3. 2022 GINA main report available online. Available from: https://ginasthma.org/gina-reports/.
4. Ibrahim NM, Almarzouqi FI, Al Melaih FA, Farouk H, Alsayed M, AlJassim FM. Prevalence of asthma and allergies among children in the united Arab emirates: a cross-sectional study. World Allergy Organ J. 2021;14(10):100588. doi:10.1016/j.waojou.2021.100588
5. Alharbi SA, Kobeisy SAN, AlKhater SA, et al. Childhood asthma awareness in Saudi Arabia: five-year follow-up study. J Asthma Allergy. 2020;13:399–407. doi:10.2147/JAA.S272850
6. Tarraf H, Aydin O, Mungan D, et al. Prevalence of asthma among the adult general population of five middle eastern countries: results of the SNAPSHOT program. BMC Pulm Med. 2018;18(1):68. doi:10.1186/s12890-018-0621-9
7. Lötvall J, Akdis CA, Bacharier LB, et al. Asthma endotypes: a new approach to classification of disease entities within the asthma syndrome. J Allergy Clin Immunol. 2011;127(2):355–360. doi:10.1016/j.jaci.2010.11.037
8. Janssens T, Ritz T. Perceived triggers of asthma: key to symptom perception and management. Clin Exp Allergy. 2013;43(9):1000–1008. doi:10.1111/cea.12138
9. Szefler SJ, Chipps B. Challenges in the treatment of asthma in children and adolescents. Ann Allergy Asthma Immunol. 2018;120(4):382–388. doi:10.1016/j.anai.2018.01.003
10. Miller LR. Trigger control to enhance asthma managements. Available from: https://www.uptodate.com/contents/trigger-control-to-enhance-asthma-management.
11. Tibble H, Tsanas A, Horne E, et al. Predicting asthma attacks in primary care: protocol for developing a machine learning-based prediction model. BMJ Open. 2019;9(7):e028375. doi:10.1136/bmjopen-2018-028375
12. Ram S, Zhang W, Williams M, Pengetnze Y. Predicting asthma-related emergency department visits using big data. IEEE J Biomed Health Inform. 2015;19(4):1216–1223. doi:10.1109/JBHI.2015.2404829
13. Lee C-H, Chen JC-Y, Tseng VS. A novel data mining mechanism considering bio-signal and environmental data with applications on asthma monitoring. Comput Methods Programs Biomed. 2011;101(1):44–61. doi:10.1016/j.cmpb.2010.04.016
14. Levy ML, Bacharier LB, Bateman E, et al. Key recommendations for primary care from the 2022 Global Initiative for Asthma (GINA) Update. NPJ Prim Care Respir Med. 2023;33(1):1–13. doi:10.1038/s41533-023-00330-1
15. Papi A, Brightling C, Pedersen SE, Reddel HK. Asthma. Lancet. 2018;391(10122):783–800. doi:10.1016/S0140-6736(17)33311-1
16. Holguin F, Cardet JC, Chung KF, et al. Management of severe asthma: a European respiratory society/American thoracic society guideline. Eur Respir J. 2020;55(1):1900588. doi:10.1183/13993003.00588-2019
17. Singh V, Meena P, Sharma BB. Asthma-like peak flow variability in various lung diseases. Lung India. 2012;29(1):15–18. doi:10.4103/0970-2113.92352
18. Merchant RK, Inamdar R, Quade RC. Effectiveness of population health management using the propeller health asthma platform: a randomized clinical trial. J Allergy Clin Immunol Pract. 2016;4(3):455–463. doi:10.1016/j.jaip.2015.11.022
19. Fleming L, Murray C, Bansal AT, et al. The burden of severe asthma in childhood and adolescence: results from the paediatric U-BIOPRED cohorts. Eur Respir J. 2015;46(5):1322–1333. doi:10.1183/13993003.00780-2015
20. Davies MJ, Aroda VR, Collins BS, et al. Management of hyperglycemia in type 2 diabetes, 2022. A Consensus Report by the American Diabetes Association (ADA) and the European Association for the Study of Diabetes (EASD). Diabetes Care. 2022;45(11):2753–2786. doi:10.2337/dci22-0034
21. Yoo JH, Kim JH. Advances in continuous glucose monitoring and integrated devices for management of diabetes with insulin-based therapy: improvement in glycemic control. Diabetes Metab J. 2023;47(1):27–41. doi:10.4093/dmj.2022.0271
22. Borrelli N, Grimaldi N, Papaccioli G, Fusco F, Palma M, Sarubbi B. Telemedicine in adult congenital heart disease: usefulness of digital health technology in the assistance of critical patients. Int J Environ Res Public Health. 2023;20(5775):5775. doi:10.3390/ijerph20105775
23. Faragli A, Abawi D, Quinn C, et al. The role of non-invasive devices for the telemonitoring of heart failure patients. Heart Fail Rev. 2021;26(5):1063–1080. doi:10.1007/s10741-020-09963-7
24. Shan R, Sarkar S, Martin SS. Digital health technology and mobile devices for the management of diabetes mellitus: state of the art. Diabetologia. 2019;62(6):877–887. doi:10.1007/s00125-019-4864-7
25. Sulaiman I, Greene G, MacHale E, et al. A randomised clinical trial of feedback on inhaler adherence and technique in patients with severe uncontrolled asthma. Eur Respir J. 2018;51(1):1701126. doi:10.1183/13993003.01126-2017
26. D’Amato G, Holgate ST, Pawankar R, et al. Meteorological conditions, climate change, new emerging factors, and asthma and related allergic disorders. a statement of the world allergy organization. World Allergy Organ J. 2015;8(1):25. doi:10.1186/s40413-015-0073-0
27. Tiesler CMT, Thiering E, Tischer C, et al. Exposure to visible mould or dampness at home and sleep problems in children: results from the lisaplus study. Environ Res. 2015;137:357–363. doi:10.1016/j.envres.2014.11.023
28. Tiotiu A, Ioan I, Wirth N, Romero-Fernandez R, González-Barcala F-J. The impact of tobacco smoking on adult asthma outcomes. Int J Environ Res Public Health. 2021;18(992):992. doi:10.3390/ijerph18030992
29. Bush A, Fleming L. Diagnosis and management of asthma in children. BMJ. 2015;350(mar05 9):h996. doi:10.1136/bmj.h996
30. PF 100 - Asthma Monitor. Available from: https://www.microlife.com/consumer-products/respiratory-care/digital-peak-flow-meter/pf-100.
31. WHO Global Air Quality Guidelines: Particulate matter (PM2.5 and PM10), ozone, nitrogen dioxide, sulfur dioxide and carbon monoxide. Available from: https://www.who.int/publications-detail-redirect/9789240034228.
32. Hankinson JL, Odencrantz JR, Fedan KB. Spirometric reference values from a sample of the general U.S. Population. Am J Respir Crit Care Med. 1999;159(1):179–187. doi:10.1164/ajrccm.159.1.9712108
33. Hall MA. Correlation-based feature subset selection for machine learning. Thesis submitted in partial fulfillment of the requirements of the degree of Doctor of Philosophy at the University of Waikato; 1998.
34. Shevade SK, Keerthi SS, Bhattacharyya C, Murthy KRK. Improvements to the SMO algorithm for SVM regression. IEEE Trans Neural Netw. 2000;11(5):1188–1193. doi:10.1109/72.870050
35. Lewis SA, Weiss ST, Britton JR. Airway responsiveness and peak flow variability in the diagnosis of asthma for epidemiological studies. Eur Respir J. 2001;18(6):921–927. doi:10.1183/09031936.01.00211801
 © 2023 The Author(s). This work is published and licensed by Dove Medical Press Limited. The full terms of this license are available at https://www.dovepress.com/terms.php and incorporate the Creative Commons Attribution - Non Commercial (unported, v3.0) License.
By accessing the work you hereby accept the Terms. Non-commercial uses of the work are permitted without any further permission from Dove Medical Press Limited, provided the work is properly attributed. For permission for commercial use of this work, please see paragraphs 4.2 and 5 of our Terms.
© 2023 The Author(s). This work is published and licensed by Dove Medical Press Limited. The full terms of this license are available at https://www.dovepress.com/terms.php and incorporate the Creative Commons Attribution - Non Commercial (unported, v3.0) License.
By accessing the work you hereby accept the Terms. Non-commercial uses of the work are permitted without any further permission from Dove Medical Press Limited, provided the work is properly attributed. For permission for commercial use of this work, please see paragraphs 4.2 and 5 of our Terms.