")
Back to Journals » International Journal of Nanomedicine » Volume 16
An Improved Synthesis of Water-Soluble Dual Fluorescence Emission Carbon Dots from Holly Leaves for Accurate Detection of Mercury Ions in Living Cells
Authors Wang P, Yan Y, Zhang Y, Gao T, Ji H, Guo S, Wang K, Xing J, Dong Y
Received 24 December 2020
Accepted for publication 23 February 2021
Published 9 March 2021 Volume 2021:16 Pages 2045—2058
DOI https://doi.org/10.2147/IJN.S298152
Checked for plagiarism Yes
Review by Single anonymous peer review
Peer reviewer comments 2
Editor who approved publication: Dr Ebrahim Mostafavi
Pengchong Wang,1,2 Yan Yan,1,2 Ying Zhang,2 Tingting Gao,2 Hongrui Ji,2 Shiyan Guo,2 Ke Wang,2 Jianfeng Xing,2 Yalin Dong1
1Department of Pharmacy, The First Affiliated Hospital of Xi’an Jiaotong University, Xi’an, 710061, People’s Republic of China; 2School of Pharmacy, Xi’an Jiaotong University, Xi’an, 710061, People’s Republic of China
Correspondence: Yalin Dong; Jianfeng Xing Email [email protected]; [email protected]
Background: Carbon dots (CDs) emitting near-infrared fluorescence were recently synthesized from green leaves. However, the Hg2+ detection of CDs was limited because of the insufficient water solubility, low fluorescence and poor stability.
Methods: Dual fluorescence emission water-soluble CD (Dual-CD) was prepared through a solvothermal method from holly leaves and low toxic PEI1.8k. PEG was further grafted onto the surface to improve the water solubility and stability.
Results: The Dual-CD solution can emit 487 nm and 676 nm fluorescence under single excitation and exhibit high quantum yield of 16.8%. The fluorescence at 678 nm decreased remarkably while the emission at 470 nm was slightly affected by the addition of Hg2+. The ratiometric Hg2+ detection had a wide linear range of 0– 100 μM and low detection limit of 14.0 nM. In A549 cells, there was a good linear relation between F487/F676 and the concentration of Hg2+ in the range of 0– 60 μM; the detection limit was 477 nM. Furthermore, Dual-CD showed visual fluorescence change under Hg2+.
Conclusion: Dual-CD has ratiometric responsiveness to Hg2+ and can be applied for quantitative Hg2+ detection in living cells.
Keywords: chlorophyll, polyethyleneimine, polyethylene glycol, ratiometric Hg2+ detection, A549 cells
Introduction
Carbon dots (CDs), a novel kind of carbon fluorescent materials with particle size less than 10 nm, have good water solubility, low toxicity, excellent biocompatibility, remarkable photostability, high fluorescence quantum yield and facile surface functionalization.1,2 They are advantageous both in their wide range of carbon sources and simple green synthesis methods, which make them receive particular attention for diverse applications such as catalysis,3,4 bioimaging, biosensors,5 drug delivery,6 diagnosis and treatment of diseases.7,8
Heavy metal ions are harmful to human health and environment, and their pollution has become a serious worldwide problem.9 Mercury is one of the most toxic heavy metals; it can cause serious human health problems even at low concentration because of the strong toxicity and bioaccumulation.10 Nevertheless, general mercury detection methods such as cold atomic absorption spectrometry and dithizone method are restricted because of the long operation time, complicacy and low sensitivity. It is high time to develop a novel mercury detection method.
As previously reported, CDs can react with mercury ions (Hg2+) to induce fluorescence quenching, which can determine the concentration of Hg2+ by measuring the fluorescence intensity changes, to form a Hg2+ sensor.11,12 Moreover, the good water solubility, high fluorescence quantum yield and low toxicity make CDs promising for Hg2+ detection in different situations. However, most CDs only have single fluorescence emission,13,14 and, when they are used as a Hg2+ sensor in the complex environment of living cells, the single fluorescence intensity may be affected by aggregation or destruction of CDs, which will greatly impact the accuracy and reliability of measurement. Therefore, it is of great significance to develop a simple and reliable sensor for Hg2+ detection in living cells.15
To improve the accuracy and reliability of Hg2+ sensor, establishing a fluorescence ratiometric assay will be a good solution.16,17 As the fluorescence ratio will not be affected by the sensitivity of the instrument, the intensity of excitation light source and the changes of external environment, this method shows prominent advantages of good selectivity, high sensitivity and wide linear range, which has attracted the interest of researchers in various fields.18,19
As reported, Sun et al synthesized dual emission CDs (carbon dots emitting two different wavelength fluorescence under single excitation) by constructing a host–guest configuration in which near-infrared dyes were encapsulated as guests in carbon cores.20 However, the different origins of “host” and “guest” may produce detection errors when dyes are released or cores destroyed. Li et al produced dual emission CDs by solvothermal treatment of o-phenylenediamine,21 as was reported: when an organic fluorescent substance is used as raw material to prepare CDs, the CDs can emit similar fluorescence.22,23 However, the poor water solubility, toxic chemical precursors and complex post-treatments greatly limit the Hg2+ detection in living cells. Recently, a green synthesis method to prepare dual emission CDs was proposed, as chlorophyll in green leaves was extracted as precursor to synthesize water-soluble CDs.24,25
The Ilex chinensis Sims (also known as holly) is a kind of evergreen tree from the holly family; it is widely used as potted plant or green belt. Its leaves are used in traditional Chinese medicine, contain a variety of chemical compounds such as triterpenoids, phenolic acids, polysaccharide, chlorophyll and flavonoids,26 and have potential anticancer and anti-inflammatory properties with diverse medicinal activities.27 We attempted to prepare water-soluble dual emission CDs from fresh holly leaves according to the literatures, while the obtained CDs were only partially soluble in water and showed poor ability to detect Hg2+ in living cells. The water solubility was not as good as expected, which may be due to the fact that holly leaf extracts have fewer hydrophilic amino groups and porphyrins of chlorophyll is hydrophobic and instable.28 As a result, CDs were not completely or only partially modified by hydrophilic groups, indicating that these methods are limited in specific green leaf extracts.
In this study, water-soluble dual fluorescence emission CDs (Dual-CD) were prepared through solvothermal method from holly leaves. The modification of PEI and PEG improved fluorescence performance and water solubility. Hg2+ sensitivity and cytotoxicity were also investigated to develop accurate Hg2+ detection in living cells.
Experimental Section
Materials and Reagents
Fresh holly leaves were purchased from a local market. Polyethyleneimine (PEI1.8k), N-hydrosuccinidyl ester-functionalized homobifunctional poly(ethylene glycol) (NHS-PEG2000-NHS) and 9,10-bis(phenylethynyl)-anthracene (BPEA) were obtained from Shanghai Aladdin Reagent Co., Ltd (China). A dialysis membrane (cutoff molecular weight ~3500) was purchased from Spectrum Laboratories, Inc., CA (USA). HgCl2, KCl, Pb(NO3)2, CaCl2, NaCl, AgNO3, BaCl2, CoCl2, MgCl2, CuCl2, FeCl2 and FeCl3 were purchased from Sinopharm Chemical Reagent Co., Ltd. (China). And 3-(4,5-dimethyl-2-thiazolyl)-2,5-diphenyl tetrazolium bromide (MTT) was obtained from Sigma-Aldrich, St. Louis, MO (USA).
Instruments
Transmission electron microscopy (TEM) and high-resolution transmission electron microscopy (HRTEM) images were captured by JEOL JEM-F200 field emission transmission electron microscope. Dynamic light scattering (DLS) method particle size measurements were analyzed by Malvern Nano Zetasizer ZS 90 at 25°C. X-ray diffraction (XRD) characterization was carried out by Bruker D8 ADVANCE with Cu Kα radiation in the range of 10° to 80°. Fourier transform infrared (FTIR) spectrum was recorded by FTIR spectrometry (Thermo Fisher Scientific Inc., USA) in the region of 1000 to 4000 cm−1. X-ray photoelectron spectroscopy (XPS) investigation was tested via Thermo Fisher ESCALAB Xi+ XPS spectrometer. UV-vis spectra were recorded by Shimadzu UV-2500 spectrophotometer. The fluorescence spectra were determined via RF5301PC Shimadzu Spectrofluorophotometer. Fluorescence images were captured by Leica SP5 II scanning confocal laser fluorescence microscope.
Preparation of Dual-CD
The holly leaves were obtained from a local market; after removing the extra branches, leaves were washed and fresh green ones were chosen for further treatment. Fresh holly leaves were cut into small pieces and soaked in an ethanol/water (4:1 volume ratio) solution for 6 h. Note that holly leaves should not be ground heavily during the extraction process. The suspension was filtered and concentrated, and the clear extract was collected. After removal of ethanol using rotary evaporating (50°C) and further drying by a lyophilizer, the precursor was obtained as green solid. Then, 0.1 g of the as-prepared precursor and 6.0 mg of PEI1.8k were dissolved in 20 mL of ethanol to form a transparent solution. The above solution was transferred into a Teflon-lined autoclave, followed by solvothermal treatment at 160°C for 6 h. After cooling to room temperature, the reaction mixture was centrifuged and the supernatant was filtered with a 0.22 μm membrane. A total of 1.0 mL of 2.0 mg/mL NHS-PEG2000-NHS/anhydrous ethanol solution was added into 4.0 mL of the filtrate and mixed thoroughly in a beaker. After standing at room temperature in dark for 48 h, 4.0 mL of 0.1 M Na2CO3 solution was added and mixed well. This mixture solution was allowed to stand at room temperature in the dark for a further 24 h. The solution was centrifuged, and the supernatant was filtered with a 0.22 μm membrane. The obtained filtrate was then dialyzed against water. The product was lyophilized to obtain a solid sample, which was stored in the refrigerator at 4°C for future use.
Characterization
XRD was conducted to determine the crystal structure of Dual-CD. XPS was applied to identify the surface elemental composition and chemical environments of Dual-CD. FTIR was used to confirm the special surface functional groups of Dual-CD. The surface morphology and lattice spacing were examined by TEM and HRTEM. The particle size and zeta potential of Dual-CD were determined via Malvern Nano Zetasizer ZS 90 at 25°C. The fluorescence spectra were determined via spectrofluorophotometer, and UV-vis absorption spectra were obtained by UV-vis spectrophotometer.
The quantum yields (QYs) of CDs were calculated by comparing with BPEA through an established relative method.29,30 In detail, BPEA in n-hexane (quantum yield is 0.97) was selected as a reference for the Dual-CD. The QYs were calculated using the following equation:
Grad is the ratio of fluorescence intensity to absorbance, and η is the refractive index of solvent. The subscript “s” refers to the standards, and “u” refers to the unknown samples.
Detection of Hg2+
A total of 200 μL of Dual-CD solution (1 mg/mL) was added to 1.6 mL of pH 7.0 PBS and followed by the addition of 200 μL of Hg2+ solution with different concentrations. The solutions were mixed and stood still for 8 min; the fluorescence intensities of 487 nm and 676 nm were measured, and the F487/F676 was obtained under an excitation wavelength of 419 nm. The calibration curve was established with F487/F676 as ordinate and Hg2+ concentration as abscissa, to form a fluorescent ratiometric Hg2+ detection method. At the same time, the fluorescent color of Dual-CD solutions with the addition of different concentrations of Hg2+ under 254 nm and 365 nm ultraviolet irradiation were recorded to establish a rapid and visual method for Hg2+ qualitative detection.
To investigate the practicality, the Hg2+ detection was carried out in tap water, ground water and lake water samples, respectively. The water samples were obtained from Xi’an Water Supply Company and Qujiang Lake (Xi’an, China). The water was filtered by a 0.22 μm membrane and then centrifuged at 12,000 g for 30 min at 4°C. The obtained water samples were spiked with different concentrations of Hg2+, 200 μL of pretreated water samples were added into 1.8 mL of Dual-CD-containing pH 7.0 PBS (100 μg/mL Dual-CD in final volume of 2 mL) and reacted at room temperature for 8 min. The F487/F676 under single excitation wavelength of 419 nm was recorded immediately after the reaction to detect Hg2+ in different water samples.
Cellular Imaging and Hg2+ Detection
Human lung cancer cell lines (A549) were offered by the First Affiliated Hospital of Xi’an Jiaotong University. Human breast cancer cell lines (MDA-MB-231 and MCF-7) were purchased from the Cell Bank of Shanghai, Institute of Biochemistry and Cell Biology, Chinese Academy of Sciences. The cell experiment protocols were performed in strict accordance with the Guidelines for Care and Use of Laboratory Cells of the First Affiliated Hospital of Xi’an Jiaotong University and were approved by the Ethics Committee of the First Affiliated Hospital of Xi’an Jiaotong University.
A549, MDA-MB-231 and MCF-7 cells were cultured in Dulbecco’s modified Eagle’s medium (DMEM) supplemented with 10% fetal bovine serum and 1% penicillin-streptomycin, and maintained under a humidified atmosphere containing 5% CO2 at 37°C. Cells were seeded into 96-well plates at 1 × 10⁴ per well and cultured overnight. The medium was removed, and 10% fetal bovine serum-containing DMEM and different concentrations of Dual-CD were added into each well. After 24 h, the medium was replaced with 200 μL of MTT containing medium solution and incubated for 5 h; 150 μL of DMSO was added, and the relative cell viabilities were measured by absorbance at 490 nm. Cell viability (%) = (ODtreated - ODblank)/(ODcontrol - ODblank) × 100%.
To investigate the ability of Dual-CD as Hg2+ biosensor in living cells, A549 cells were seeded in 12-well plates at 5 × 10⁵ per well overnight. Then, Dual-CD (final concentration of 200 μg/mL) was added into each well. After 24 h, PBS with different concentrations of Hg2+ was added into each well. Reacting for 1 h, the cells were washed with cold PBS 3 times and kept in PBS (1 mL) for confocal fluorescence cellular imaging. For cellular quantitative detection of Hg2+, A549 cells were seeded in a 35 mm culture dish and treated with Dual-CD for 24 h. After washing with PBS 3 times, cells were further incubated with different concentrations of Hg2+ for 2 h, and then cells were collected after trypsin digestion and kept in PBS. After counting, the cells were broken by ultrasonic probe and centrifuged at 12,000 g for 20 min at 4°C. Then, the supernatant was diluted by pH 7.0 PBS, and F487/F676 was measured by fluorescence spectrophotometer for Hg2+ detection.
Statistical Analysis
The data were presented as mean ± standard deviation (SD), and Student’s t-test was used to analyze the significance of difference between experimental groups. All statistical analyses were performed using SPSS 23.0, and the level of significance was set as P < 0.05.
Results and Discussion
Characterization
The dual fluorescence emission CDs were prepared with holly leaf extracts such as chlorophyll and polysaccharides as raw materials31 via a solvothermal method, and PEG was grafted onto the surface of CDs to form water-soluble Dual-CD (as shown in Scheme 1). Carbonaceous organic materials such as citric acid were commonly chosen as carbon source to prepare CDs. Only blue to green fluorescence can be emitted, which is adverse to application in living cells or bio-systems. In this study, chlorophyll and polysaccharides were extracted from fresh holly leaves as carbon source to prepare dual emission CDs. During the solvothermal reaction, extracts were carbonized to form CDs structure and emit blue-green fluorescence, while chlorophyll porphyrin structure emitted near-infrared fluorescence; the addition of PEI further improved the fluorescence performance of CDs. Due to the poor water solubility of raw materials, the prepared CDs are hardly dissolved in water. The water-soluble CDs were prepared through further modification of grafting PEG with the amino groups on its surface. After PEG modification, the water solubility of CDs was greatly improved, and the fluorescence emission of Dual-CD was also enhanced because of the better dispersibility and stability in aqueous medium, which is of benefit for the application of ion detection in living cells.
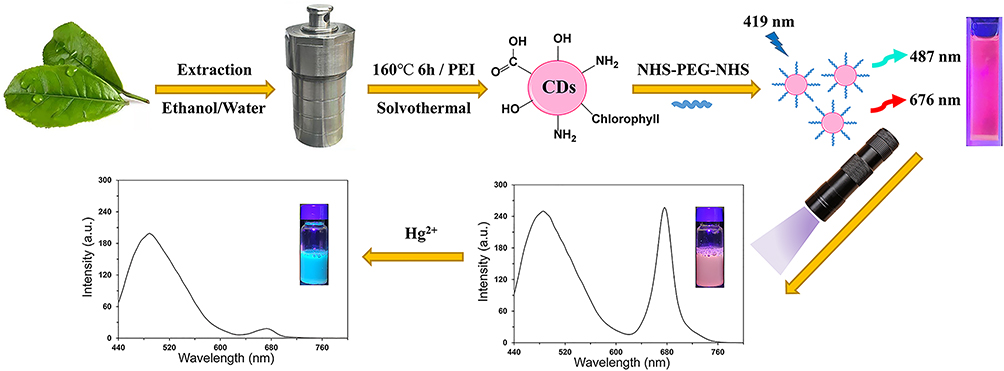 |
Scheme 1 Schematic illustration for the preparation of Dual-CD and the application of Hg2+ detection. |
As shown in Table S1, when the feed amount of PEI1.8k and NHS-PEG-NHS are 6 mg and 10 mg (every 100 mg of precursor), the obtained CDs possess good water solubility. PEI provided amino groups on the surface, and PEG bonded with PEI to enhance water solubility. Excessive PEI may increase the cytotoxicity of CDs, and 10 mg of PEG was enough to improve water solubility. After PEG modification, the zeta potential of CDs changed from +4.1 mV to −7.5 mV, indicating PEG was successfully bonded to the surface of carbon dots. Such a PEI passivation and PEG hydrophilic modification approach could be a general method for water-soluble CDs preparation from hydrophobic precursor. After the preparation, a series of characterizations was performed to study the particle size, morphology, crystal structure, elements and surface functional groups.
As previously reported, CDs solution exhibited an excitation wavelength-dependent emission; this abnormal characteristic originates from the special nanoscale structure of CDs that was always considered naturally as an intrinsic defect.32,33 The fluorescence emission peak of CDs shifts when the excitation wavelength varies, so that CDs can emit different color fluorescence under different excitation wavelengths. As shown in Figure S1, Dual-CD solution could emit blue, green and red fluorescence under different excitation wavelengths, indicating the formation of CDs.
The TEM image (shown in Figure 1A) and the corresponding particle size distribution (shown in Figure 1B) illustrated that Dual-CD has an average diameter of 4.85 ± 0.77 nm with uniform nanosphere structure. The HRTEM (Figure 1A inset) shows that the lattice space is 0.31 nm, which is similar to graphitic (002) facet.34,35 The mean size of Dual-CD measured by DLS (Figure S2) was 4.53 ± 0.73 nm, which accorded with that of TEM. The XRD pattern of Dual-CD shows two broad peaks at 2θ = 21.5° and 2θ = 25.2°, seen in Figure 1C, indicating the presence of both amorphous carbon structures and the (002) graphitic lattice.36 This phenomenon may be caused by the disordered heterogeneity and small-sized structure of Dual-CD. FTIR spectrum revealed the surface functional groups on Dual-CD37, seen in Figure 1D, and the broad strong absorption band at 3423 cm−1 was attributed to the stretching vibrations of -NH and -OH, indicating that Dual-CD contains a great number of amino and hydroxyl groups. The band at 2962 cm−1 represented the stretching vibrations of C-H bonds. The strong band at 1650 cm−1 was associated with the stretching vibrations of C=C and C=O bonds. The band at 1402 cm−1 was consistent with C-N stretching vibration, and the band at 1266 cm−1 represented the stretching vibration of C-O bonds.
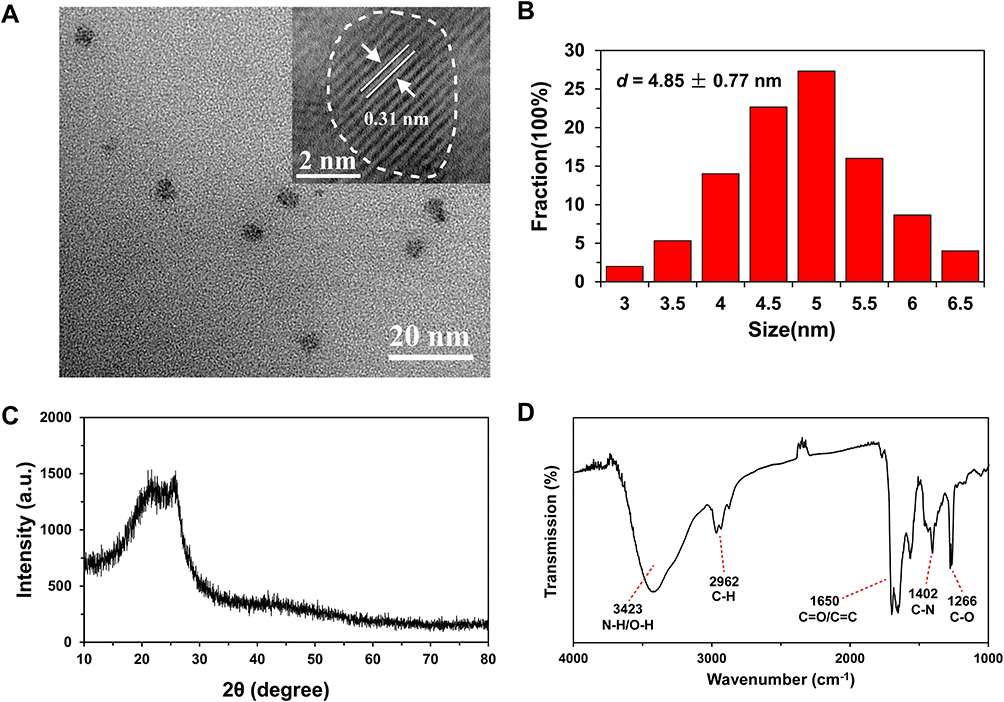 |
Figure 1 (A) TEM image of Dual-CD product (inset is high-resolution TEM image) and (B) the corresponding particle size distribution. (C) XRD pattern and (D) FTIR spectrum of Dual-CD. |
XPS analysis was carried out for the research of element compositions and surface states of Dual-CD.38 As can be seen in Figure 2A, three predominant peaks representing C 1s, N 1s and O 1s, respectively, were observed, indicating that Dual-CD mainly consisted of C, N and O; the composition of Dual-CD was C 74.51, N 4.11 and O 21.35 wt.%. The high-resolution XPS (shown in Figure 2B–D) displayed three peaks at 284.7, 285.9 and 288.3 eV, attributed to C-H/C-C/C=C, C-O and C=O; the peaks at 530.7, 531.7 and 532.6 eV were attributed to C-OH/C-O-C, C=O and C-O; and the peaks at 398.2, 399.1 and 400.2 eV were attributed to C-N-C, N-(C)3 and N-H. These results demonstrated that the surface functional groups verified by XPS spectra were consistent with FTIR, suggesting that sufficient functional groups on Dual-CD, such as hydroxyl, amino, carboxyl and amide groups, shaped the unique properties of Dual-CD.
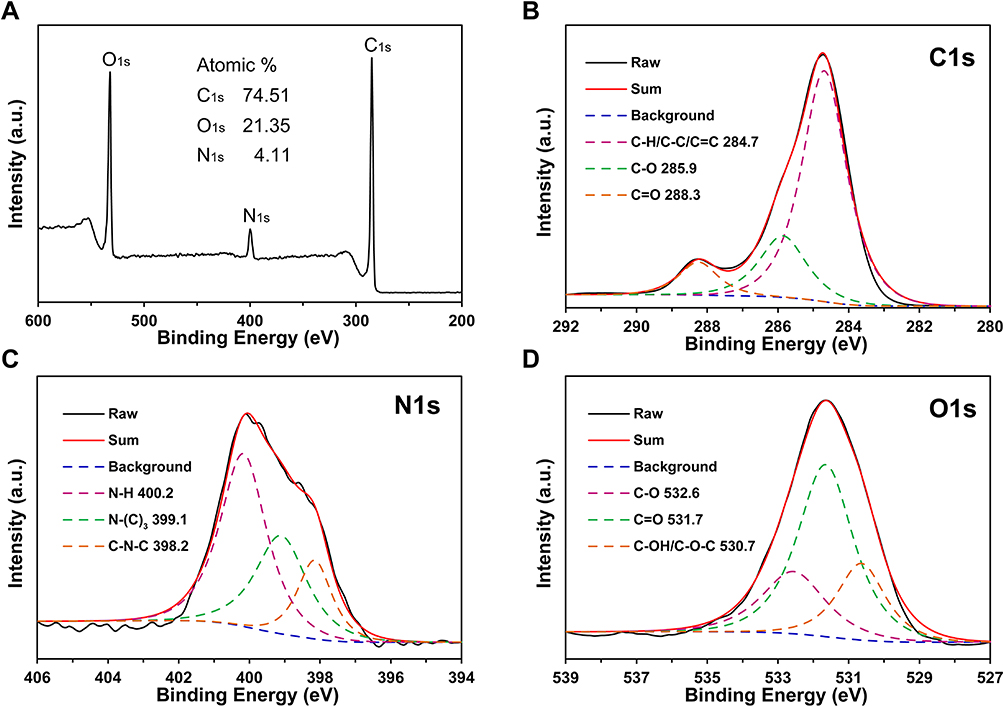 |
Figure 2 (A) XPS spectrum of Dual-CD, (B–D) are the corresponding C1s, N1s and O1s XPS spectra. |
Optical Properties of Dual-CD
During the synthesis process, reaction time and temperature are the main factors39 to influence the fluorescence emission of CDs. In a certain range, with the increase of reaction time and temperature, the particle size of Dual-CD gradually increased, blue-green fluorescence enhanced and red fluorescence slightly decreased, which may be caused by the formation of CDs structure40 and the carbonization of chlorophyll porphyrin.41,42 When the reaction time was 6 h, both blue-green and red fluorescence were strong at 160°C. As the reaction time was further extended, blue-green fluorescence remained stable, while red fluorescence decreased significantly. And the single emission CDs (Blue-CD) were obtained when reaction time was 24 h at 160°C. At the same time, with the increase of temperature, blue-green fluorescence increased gradually, while red fluorescence decreased slightly for 6 h of reaction. Both blue-green fluorescence and red fluorescence decrease rapidly when temperature exceeded 160°C. Such a phenomenon may be caused by the over-carbonization of CDs and porphyrin structure under high temperature for a long time, resulting in the aggregation of carbon particles, reducing fluorescence emission. Therefore, Dual-CD were prepared at 160°C for 6 h; the QY was calculated to be as high as 16.8%. The obtained CDs possessed excellent fluorescence performance, small particle size and dual fluorescence emission, which are conducive to the following studies.
As shown in Figure 3A, two absorption peaks at 432 nm and 666 nm were observed in the UV-vis absorption spectrum of chlorophyll, which may be related to the existence of porphyrin. Meanwhile, a strong peak at 411 nm was observed in the absorption spectrum of Dual-CD besides the two peaks, indicating that not only porphyrin structure remained, but also carbonized CDs structure had formed. However, only one broad peak appeared about 405 nm in the absorption spectrum of Blue-CD, revealing that porphyrin structure had been depleted under the drastic carbonization reaction for 24 h.
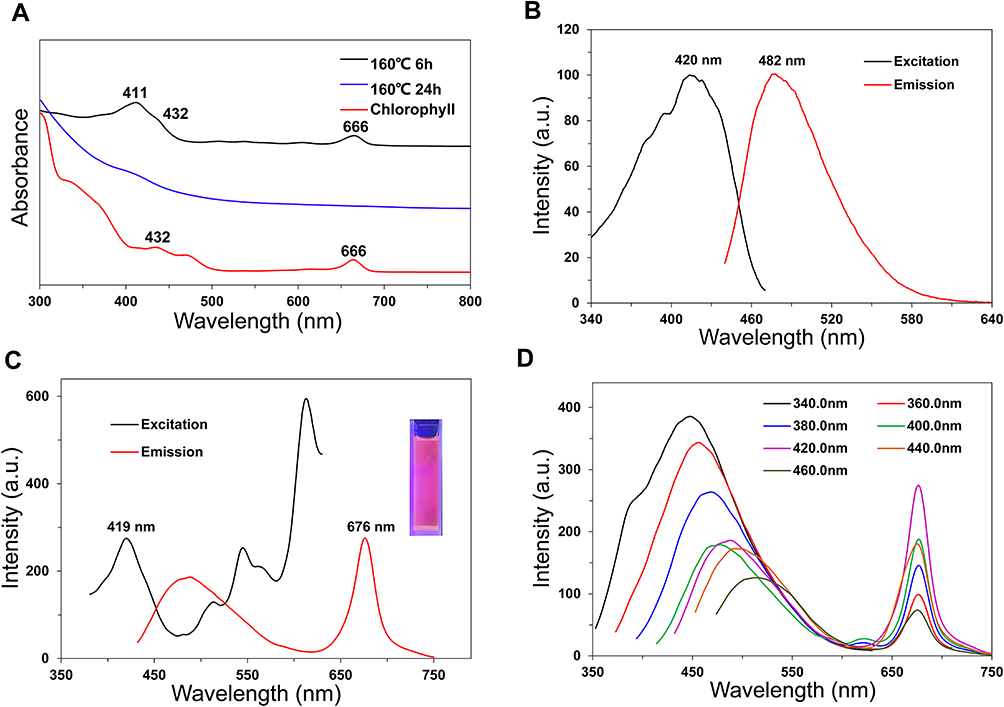 |
Figure 3 (A) UV-vis absorption spectra of the CDs and chlorophyll. Excitation and emission fluorescence spectra of (B) Blue-CD and (C) Dual-CD solution. (D) Excitation-dependent fluorescence emission spectra of Dual-CD solution. |
As shown in Figure 3B, the maximum excitation wavelength of Blue-CD is 420 nm. Only a single emission peak with a maximum emission wavelength of 482 nm relating to carbonized CDs structure was observed under 420 nm excitation, indicating the complete reaction of porphyrin. As can be seen in Figure 3C, the excitation spectrum of Dual-CD for the emission at 676 nm has three peaks of 419 nm, 545 nm and 613 nm. Only 419 nm can excite two emission peaks at 487 nm and 676 nm, therefore, 419 nm was defaulted as excitation wavelength. Meanwhile, Dual-CD retained red fluorescence emission under 419 nm excitation, indicating the existence of sufficient porphyrin structure. It was supposed that carbon source of polysaccharides and chlorophyll in holly leaf extracts was carbonized under 160°C to form CDs structure, while most of porphyrin in chlorophyll has not been pyrolyzed completely in a short time.
Figure 3D shows the characteristic wavelength-dependent emission of Dual-CD; the blue-green region emission red-shifted and the fluorescence intensities decreased when excitation wavelength varied from 340 nm to 540 nm. Interestingly, the red region fluorescence intensities varied and reached the maximum at about 420 nm, while the emission peak wavelength remained unchanged. These results further verified that most of the porphyrin structure remained intact in Dual-CD.
In order to study the photostability, Dual-CD solution was incubated under different treatments at 37°C. Figure S3 shows the emission spectra at 419 nm excitation, and the F487/F676 was calculated. The emission spectra and F487/F676 of Dual-CD almost remained unchanged in dark. The fluorescence intensities decreased slightly under daylight, while the F487/F676 showed unremarkable differences within 36 h. For the last group under the irradiation of 36 W UV lamp, the fluorescence performance remained stable in the first 10 min, and then fluorescence intensities gradually decreased within 60 min. These results reflected that Dual-CD has good photostability, and its fluorescence performance is unchanged in the dark and remains stable within 10 min under UV irradiation. The F487/F676 of Dual-CD was almost invariant, which is advantageous to the accurate ratiometric detection.
After that, pH and ion concentration of the Dual-CD solution were optimized by recording F487/F676. As shown in Figure S4A, with the increase of pH value, F487/F676 first increased then decreased, and reached the highest of 0.983 at pH 7. Therefore, the Dual-CD in neutral solution at pH 7 was applied to improve the accuracy for detection. Figure S4B shows that, within a certain range, the F487/F676 of Dual-CD in neutral solution is hardly affected by NaCl concentration, indicating that it is stable in different Na+ concentrations.
Selectivity and Sensitivity of Hg2+ Detection
It has been reported that Hg2+ can quench the fluorescence of porphyrin compounds through the interaction with electron-rich aromatic rings,43,44 which induces the decrease of fluorescence at 676 nm and may result in a specific response to mercury ions. We also studied the influence of some other metal ions on Dual-CD. In order to establish the Dual-CD ion detection method, 50 μM (final concentration) of different metal ions were added into the neutral solution of Dual-CD (final concentration of 200 μg/mL) with or without Hg2+ (final concentration of 50 μM). After fully mixing and standing for a period of time, the changes of F487/F676 were recorded.
As shown in Figure 4, F487/F676 was 0.983 in neutral solution, and rose to 5.361 after adding Hg2+, while other metal ions had little effect. The porphyrin structure in Dual-CD may react with Hg2+ to form stable complexes, which significantly affected the red fluorescence emission, but had little influence on the blue-green fluorescence, resulting in the increase of F487/F676. In the presence of Hg2+, the addition of other metal ions had no remarkable effect on F487/F676, which indicated that no destructive effects on the complexes occurred after the addition of metal ions, suggesting Dual-CD has good selectivity to Hg2+. Overall, Dual-CD had specific response to Hg2+ and showed application potential in Hg2+ detection.
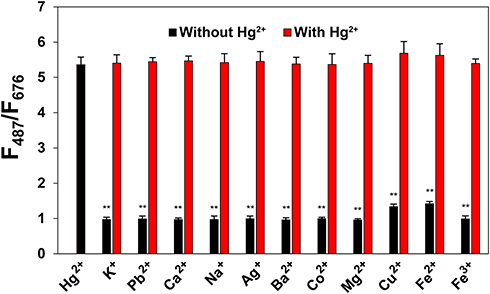 |
Figure 4 Comparison of different metal ions influencing on F487/F676 of Dual-CD solution without or with Hg2+ presence. The values are the mean ± SD (n = 3 per group). **P < 0.01 relative to the Hg2+ group. |
For the study of fluorescence change response time, Hg2+ with a final concentration of 10 μM was added into 200 μg/mL Dual-CD neutral solution, and F487/F676 was recorded at different time points. As shown in Figure S5, over time F487/F676 increased after adding Hg2+, reaching 1.731 at 6 min, and then the increase slowed down. After 8 min, F487/F676 became 1.749 and almost no longer increased. Therefore, it can be considered that the reaction between Dual-CD and Hg2+ is complete in 8 min, so that 8 min was selected for Hg2+ detection.
According to the previous experiments, Hg2+ concentration in the range of 0–100 μM was detected by Dual-CD and Blue-CD neutral solution. As can be seen in Figure 5A, with the increase of [Hg2+] (concentration of Hg2+), the fluorescence intensity of Dual-CD significantly decreased at 676 nm, and slightly decreased at 487 nm. The inset shows the fluorescent color change of Dual-CD solution after adding Hg2+. The red fluorescence significantly reduced and the blue-green fluorescence basically maintained, so that the fluorescence changed from purplish red to blue-green, revealing the application potential of Dual-CD for rapid and visual detection of Hg2+. Figure 5B shows a good linear relationship between F487/F676 and the concentration of Hg2+ in the range of 0–100 μM, with a linear regression equation of F487/F676 = 0.1017C + 0.7718 and a correlation coefficient of 0.9937 (C is the concentration of Hg2+, μM). Using the 3σ rule (σ = S0/S, S0 is the standard deviation of the blank solution after repeated measurements, and S is the gradient of the standard curve), the detection limit was 14.0 nM, indicating the high sensitivity of Dual-CD.
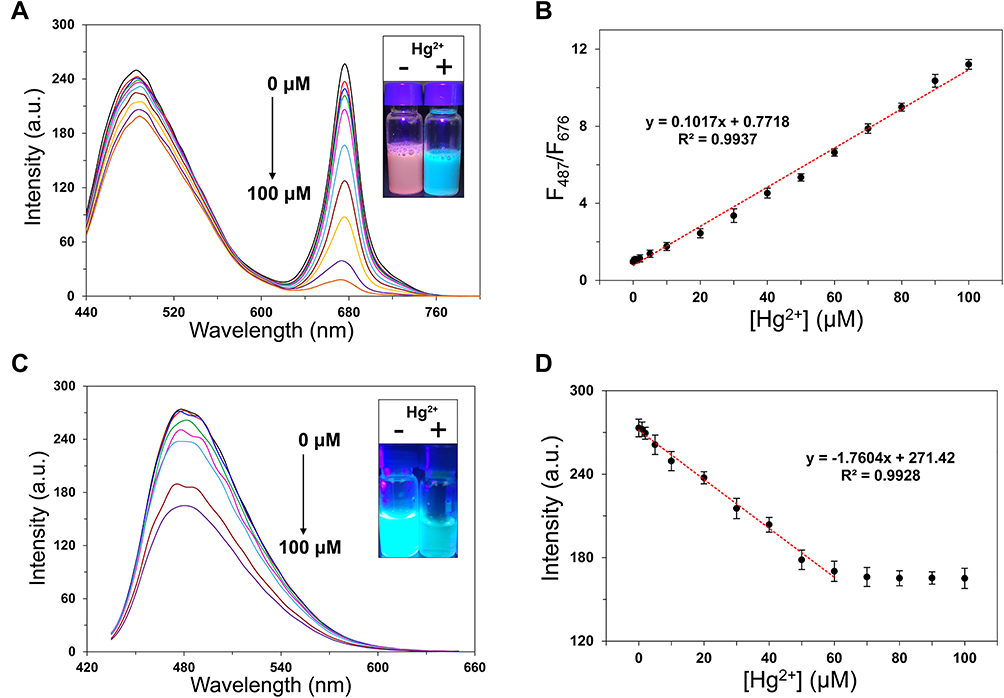 |
Figure 5 (A) Fluorescence spectra of Dual-CD with different concentrations of Hg2+ in neutral solution and (B) the corresponding linearity of response curve. (C) Fluorescence spectra of Blue-CD with different concentrations of Hg2+ in neutral solution and (D) the corresponding linearity of response curve. The values are the mean ± SD (n = 3 per group). |
Under the same conditions, Hg2+ detection of Blue-CD was also researched. As shown in Figure 5C, the addition of Hg2+ caused the decrease of fluorescence intensity at 482 nm (F482), and addition of 100 μM Hg2+ only reduced F482 from 273.3 to 165.1. The inset shows fluorescence change of Blue-CD solution after adding Hg2+. Due to the decrease of F482, the bright blue fluorescence weakened; such an indistinct difference is difficult to identify via visual inspection in an outdoor environment. Figure 5D shows a good linear relationship between F482 and Hg2+ concentration in the range of 0–60 μM, and the detection limit was 335 nM, which is much lower than that of Dual-CD. In addition, compared with Dual-CD, Blue-CD showed poor selectivity for Hg2+. Ions such as Fe3+ and Cu2+ can also reduce the fluorescence intensity significantly.
To further study the accuracy of Dual-CD, the recovery of the method was evaluated at three concentration levels of spiked samples. Results are shown in Table 1, and the accuracy (expressed as percentage of recovery) was in the range of 93.0–101.8%. The results proved that Dual-CD had good accuracy and is applicable for the quantitative detection of Hg2+.
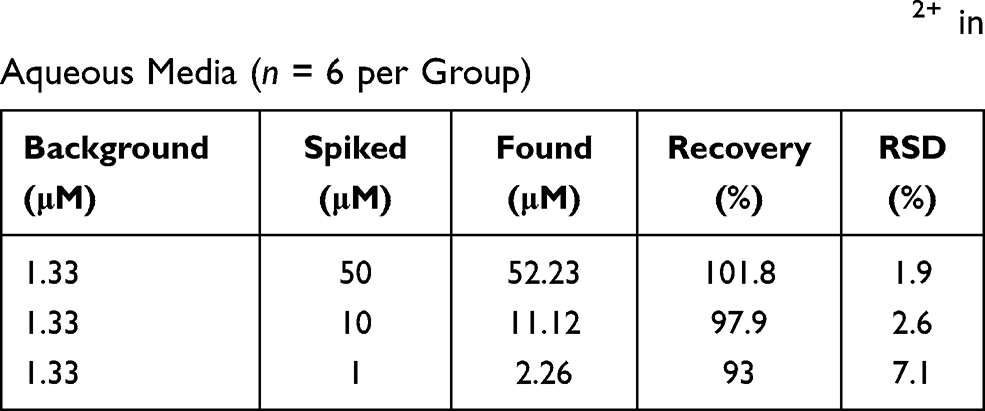 |
Table 1 The Recovery and Precision of Dual-CD for Hg2+ in Aqueous Media (n = 6 per Group) |
In order to study the reliability of Dual-CD, Hg2+ detection of the two CDs was carried out after different treatments. As shown in Table S2, after incubation in dark or at 37°C, results of the two methods were close to the actual concentration, indicating good reliability. The solutions were exposed under daylight or placed in an uncovered container (evaporating dish) for a certain time, and results of Dual-CD were close to the actual concentration, while Blue-CD results errors were relatively high. These errors may originate from the fluorescence quenching of CDs under illumination, and the fluorescence decrease affected the results of Blue-CD. Plenty of solvent volatilized from the solution placed in the evaporating dish, increasing the concentration and fluorescence intensity of CDs, which will affect the results of Blue-CD. Meanwhile, the Dual-CD ratiometric detection method was barely influenced; the intensity ratio remained stable when fluorescence intensity changed, therefore Dual-CD possessed better reliability.
In short, Dual-CD ratiometric Hg2+ detection had high sensitivity, wide linear range, good selectivity and showed favorable reliability under different treatments, with the fluorescent color tremendously changed after Hg2+ addition. Compared with single-emission CDs, Dual-CD demonstrated extraordinary superiorities.
Rapid and Visual Detection of Hg2+
In order to examine the applicability of the proposed method for rapid and visual Hg2+ detection, 200 μL of Hg2+ solutions with different concentrations were added into 1.8 mL of Dual-CD neutral solution. After mixing and standing for 8 min, fluorescence photographs were captured under daylight, 254 nm and 365 nm ultraviolet irradiation, respectively. The photoluminescence changing with Hg2+ concentration variation reflected the application potential in visual Hg2+ analysis.
As can be seen in Figure 6, all of the Dual-CD solutions were pale gold under daylight. However, under 254 nm and 365 nm UV irradiation, the purplish red fluorescence of Dual-CD solutions gradually varied with the increase of Hg2+ concentration. The fluorescent color turned to lavender at 10 μM, blue-green at 100 μM and the intensity further decreased slightly at 500 μM due to the high concentration. Owing to the lower penetration of 254 nm ultraviolet, the fluorescence mainly concentrated on the irradiation interface, while the 365 nm ultraviolet possesses stronger penetration, so that the whole solution could emit strong fluorescence. These results demonstrated that after adding Hg2+ into Dual-CD solution the fluorescence color variance can be clearly distinguished under 254 nm or 365 nm (commonest wavelengths of ultraviolet lamp) irradiation. Dual-CD solutions emit purplish red fluorescence at low Hg2+ concentrations, lavender fluorescence at about 10 μM Hg2+ and blue-green fluorescence at high Hg2+ concentrations. The modification of PEI and PEG greatly improved the water solubility and fluorescence performance, so that a rapid and visual qualitative analysis method can be developed for Hg2+ detection through visualizing characteristics of fluorescent color and brightness. In future the fluorescence quantum yield and detection sensitivity of Dual-CD should be further improved by optimizing the preparation process for practical applications.
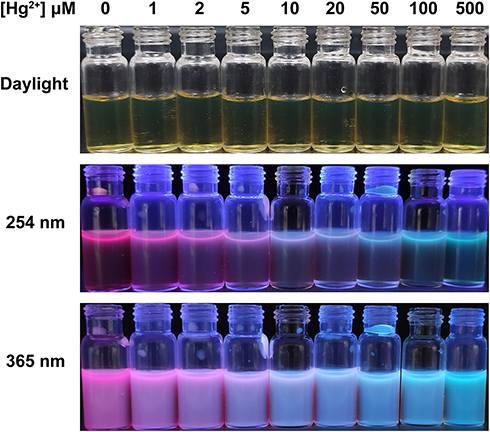 |
Figure 6 Fluorescence photographs of Dual-CD under 254 nm or 365 nm ultraviolet light with increasing Hg2+ concentration in neutral solution. |
Hg2+ Detection in Different Water Samples
To investigate the applicability of the proposed method in actual sample analysis, three kinds of water samples were selected for Hg2+ detection. The standard curves between Hg2+ concentration and F487/F676 were established according to previously described method. The recovery results are shown in Table S3; the recoveries in tap water, ground water and lake water samples were 98.6%, 97.5% and 96.7%, respectively. This indicated that the Dual-CD ratiometric method has good accuracy and is available for quantitative detection of Hg2+ in different water samples.
Cytotoxicity and Hg2+ Detection in A549 Cell
Cellular imaging ability, cytotoxicity and Hg2+ detection of Dual-CD in living cells were investigated. A549 cells were selected for cell experiments because a heavy metal such as mercury vapor and mercury ions can be absorbed through the lungs and enter the human body, endangering human heath severely.45,46 A simple method for Hg2+ detection in living cells will be conducive to monitor ion concentration information and take corresponding treatments in time to avoid high concentration of mercury ion in the body. By improving Hg2+ detection in A549 cells, Dual-CD may be further developed as a simple Hg2+ detection method in vivo.
To study the cellular imaging of Dual-CD, A549 cells were incubated with 200 μg/mL Dual-CD for 24 h, then different concentrations of Hg2+ PBS solutions were added. After 1 h, CLSM fluorescence images were achieved with distinct laser excitation. As shown in Figure 7, A549 cells emitted bright green fluorescence without Hg2+ addition, and the fluorescence was mainly concentrated in the cytoplasm. Bright red fluorescence also appeared in A549 cells, and co-localized with the green fluorescence in cytoplasm, which was evidenced by overlapped fluorescence signals, indicating that both fluorescences originated from the same substance. The green fluorescence weakened slightly with the addition of Hg2+, though distinct fluorescence can still be observed in cytoplasm at a Hg2+ concentration as high as 100 μM. In contrast, the red fluorescence was obviously attenuated under Hg2+, and scarcely any red fluorescence remained at 20 μM Hg2+. The merged images revealed that the fluorescence color can be varied efficiently from red to green in a Hg2+ controlled manner. Red fluorescence was observed at ~1 μM, yellow fluorescence at ~5 μM and green fluorescence at ~20 μM in merged images. The results proved that, with the PEI passivation and PEG hydrophilic modification made, Dual-CD performed better fluorescence and dispersion in living cells, and will not influence the reaction with Hg2+. Dual-CD could not only be applied as a dual emission cellular imaging agent, but also respond to Hg2+ in living cells.
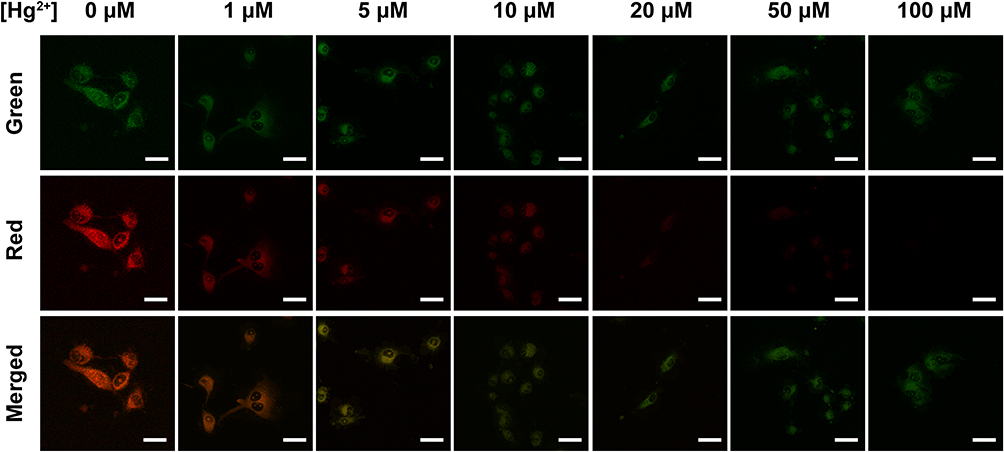 |
Figure 7 CLSM fluorescence images of A549 cells incubated with 200 μg/mL of Dual-CD for 12 h and different concentrations of Hg2+ for 30 min. Scale bars for all images are 50 μm. |
Figure 8A shows the cytotoxicity test results of Dual-CD. The cell viabilities of A549, MDA-MB-231 and MCF-7 cells incubated with Dual-CD at a concentration of 200 μg/mL were all above 85%. At a concentration as high as 1000 μg/mL, the cell viabilities were still higher than 60%, indicating the low toxicity of the green process synthesized Dual-CD. Such a low cytotoxicity was due to the nontoxic precursors of plant origin and the modification of PEG.
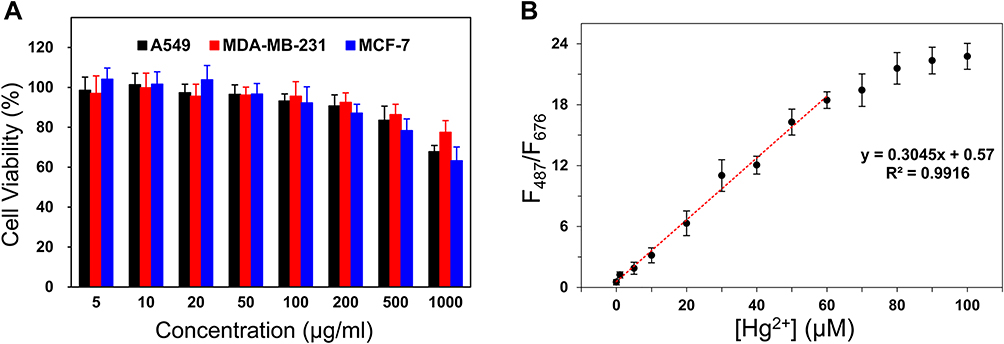 |
Figure 8 (A) Cell viability of A549 cells incubated with different concentrations of Dual-CD for 24 h. (B) The linear calibration curve for Hg2+ detection in supernatant of broken A549 cell. The values are the mean ± SD (n = 3 per group). |
In order to study the feasibility of Dual-CD as Hg2+ biosensor in living cells, A549 cells were incubated with Dual-CD for 24 hours, then different concentrations of Hg2+ were added. After 2 h, the cells were broken by ultrasonic probe and centrifuged at 4°C, and the supernatant was detected by fluorescence spectrophotometer. Results were as shown in Figure 8B, with a good linear relationship between F487/F676 and Hg2+ concentration, in the range of 0–60 μM. The linear regression equation was F487/F676 = 0.3045C + 0.57 (C is the concentration of Hg2+, μM), the correlation coefficient was 0.9916 and the detection limit was 477 nM. However, the linear range of Dual-CD in living cells was not as wide as in aqueous solution, and the detection limit was much higher. Such a phenomenon was caused by the overexpression of glutathione in cancer cells, as the intracellular glutathione can complex with Hg2+ through the formation of Hg-S bonds.16 The Dual-CD has to compete with glutathione to bind mercury ions, which will affect the sensitivity of Hg2+ detection in living cells to a certain extent. Nevertheless, due to the good water solubility, low toxicity, high fluorescence performance, excellent dispersion and stability, the capability of Dual-CD for Hg2+ detection in living cells is still considerable compared with some reported strategies (refer to Table 2). The sensitivity and linear range in this work are better than many other previous approaches, indicating the great potential for Hg2+ detection in living cells.
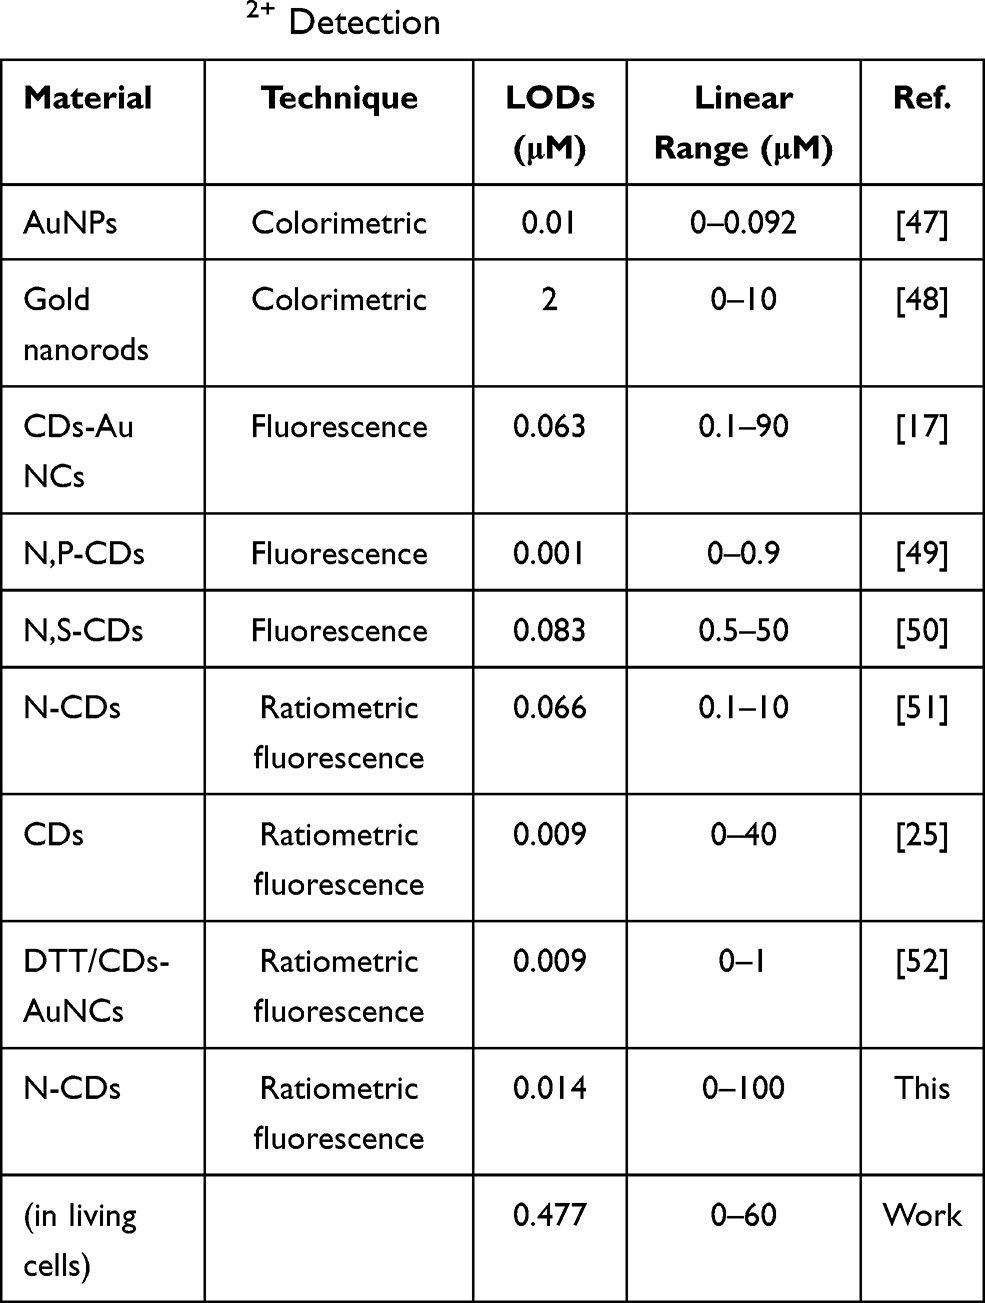 |
Table 2 The Analytical Performance Comparison of Various Methods for Hg2+ Detection |
Conclusion
In this study, an improved green synthesis of water-soluble Dual-CD was proposed for Hg2+ detection in A549 cells. The modification of PEG and PEI improved the water solubility and fluorescence performance. Dual-CD had low cytotoxicity and sensitive Hg2+ response in A549 cells. Based on the good linear relationship between F487/F676 and Hg2+ concentration, the ratiometric method possessed good accuracy and wide linear range for Hg2+ quantitative detection in living cells. These results may facilitate the development of Dual-CD as a potential Hg2+ biosensor.
Acknowledgments
This work was supported financially by the National Natural Science Foundation of China (No. 81773663 and 81973253). We also thank the Instrument Analysis Center of Xi’an Jiaotong University for the help of measurement.
Disclosure
The authors report no conflicts of interest for this work.
References
1. Wang Y, Hu A. Carbon quantum dots: synthesis, properties and applications. J Mater Chem C. 2014;2(34):6921–6939. doi:10.1039/C4TC00988F
2. Yuan FL, Li SH, Fan ZT, et al. Shining carbon dots: synthesis and biomedical and optoelectronic applications. Nano Today. 2016;11(5):565–586. doi:10.1016/j.nantod.2016.08.006
3. Song HQ, Li YH, Shang L, et al. Designed controllable nitrogen-doped carbon-dots-loaded MoP nanoparticles for boosting hydrogen evolution reaction in alkaline medium. Nano Energy. 2020;72:8. doi:10.1016/j.nanoen.2020.104730
4. Wu H, Wu M, Wang BY, et al. Interface electron collaborative migration of Co-Co3O4/carbon dots: boosting the hydrolytic dehydrogenation of ammonia borane. J Energy Chem. 2020;48:43–53. doi:10.1016/j.jechem.2019.12.023
5. Sun SJ, Guan QW, Liu Y, et al. Highly luminescence manganese doped carbon dots. Chin Chem Lett. 2019;30(5):1051–1054. doi:10.1016/j.cclet.2019.01.014
6. Zhao P, Xu Q, Tao J, et al. Near infrared quantum dots in biomedical applications: current status and future perspective. Wires Nanomed Nanobi. 2018;10(3):16. doi:10.1002/wnan.1483
7. Yang YY, Wang XF, Liao GC, et al. iRGD-decorated red shift emissive carbon nanodots for tumor targeting fluorescence imaging. J Colloid Interface Sci. 2018;509:515–521. doi:10.1016/j.jcis.2017.09.007
8. Luo LJ, Liu C, He T, et al. Engineered fluorescent carbon dots as promising immune adjuvants to efficiently enhance cancer immunotherapy. Nanoscale. 2018;10(46):22035–22043. doi:10.1039/C8NR07252C
9. El-Kady AA, Abdel-Wahhab MA. Occurrence of trace metals in foodstuffs and their health impact. Trends Food Sci Technol. 2018;75:36–45. doi:10.1016/j.tifs.2018.03.001
10. Budnik LT, Casteleyn L. Mercury pollution in modern times and its socio-medical consequences. Sci Total Environ. 2019;654:720–734. doi:10.1016/j.scitotenv.2018.10.408
11. Huang H, Weng Y, Zheng L, et al. Nitrogen-doped carbon quantum dots as fluorescent probe for “off-on” detection of mercury ions, l -cysteine and iodide ions. J. Colloid Interface Sci. 2017;506:373–378. doi:10.1016/j.jcis.2017.07.076
12. Huang H, Weng YH, Zheng LH, et al. Nitrogen-doped carbon quantum dots as fluorescent probe for “off-on” detection of mercury ions, L-cysteine and iodide ions. J. Colloid Interface Sci. 2017;506:373–378.
13. Lim SY, Shen W, Gao Z. Carbon quantum dots and their applications. Chem Soc Rev. 2015;44(1):362–381.
14. Hou XF, Hu Y, Wang P, et al. Modified facile synthesis for quantitatively fluorescent carbon dots. Carbon. 2017;122:389–394. doi:10.1016/j.carbon.2017.06.093
15. Sarma GK, Sen Gupta S, Bhattacharyya KG. Nanomaterials as versatile adsorbents for heavy metal ions in water: a review. Environ Sci Pollut R. 2019;26(7):6245–6278. doi:10.1007/s11356-018-04093-y
16. Lu SM, Wu D, Li GL, et al. Carbon dots-based ratiometric nanosensor for highly sensitive and selective detection of mercury(II) ions and glutathione. RSC Adv. 2016;6(105):103169–103177. doi:10.1039/C6RA21309J
17. Liu JH, Xue HY, Liu YN, et al. Visual and fluorescent detection of mercury ions using a dual-emission ratiometric fluorescence nanomixture of carbon dots cooperating with gold nanoclusters. Spectrochim Acta A. 2019;223:7. doi:10.1016/j.saa.2019.117364
18. Zhang X, Tan HQ, Yan YC, et al. Targetable N-annulated perylene-based colorimetric and ratiometric near-infrared fluorescent probes for the selective detection of hydrogen sulfide in mitochondria, lysosomes, and serum. J Mater Chem B. 2017;5(11):2172–2180. doi:10.1039/C7TB00210F
19. Zhao XE, Lei CH, Gao Y, et al. A ratiometric fluorescent nanosensor for the detection of silver ions using graphene quantum dots. Sensor Actuat B-Chem. 2017;253:239–246. doi:10.1016/j.snb.2017.06.086
20. Sun YP, Wang P, Lu Z, et al. Host-guest carbon dots for enhanced optical properties and beyond. Sci. Rep. 2015;5(1):12354. doi:10.1038/srep12354
21. Li B, Ma H, Zhang B, et al. Dually emitting carbon dots as fluorescent probes for ratiometric fluorescent sensing of pH values, mercury(II), chloride and Cr(VI) via different mechanisms. Microchim Acta. 2019;186(6):10.
22. Shangguan J, He D, He X. Label-free carbon-dots-based ratiometric Fluorescence pH Nanoprobes for Intracellular pH Sensing. Anal Chem. 2016;88(15):7837.
23. Zheng M, Li Y, Liu S, et al. One-pot to synthesize multifunctional carbon dots for near infrared fluorescence imaging and photothermal cancer therapy. ACS Appl Mater Inter. 2016;8(36):23533. doi:10.1021/acsami.6b07453
24. Li LP, Zhang RP, Lu CX, et al. In situ synthesis of NIR-light emitting carbon dots derived from spinach for bio-imaging applications. J Mater Chem B. 2017;5(35):7328–7334. doi:10.1039/C7TB00634A
25. Zhao J, Huang M, Zhan L, et al. Unique approach to develop carbon dot-based nanohybrid near-infrared ratiometric fluorescent sensor for the detection of mercury ions. Anal Chem. 2017;89(15):8044.
26. Li G, Row KH. Selective extraction of 3,4-dihydroxybenzoic acid in Ilex chinensis Sims by meticulous mini-solid-phase microextraction using ternary deep eutectic solvent-based molecularly imprinted polymers. Anal Bioanal Chem. 2018;410(30):7849.
27. Musa M, Ibrahim WAW, Marsin FM, et al. Graphene-magnetite as adsorbent for magnetic solid phase extraction of 4-hydroxybenzoic acid and 3,4-dihydroxybenzoic acid in stingless bee honey. Food Chem. 2018;265(NOV.1):165–172. doi:10.1016/j.foodchem.2018.04.020
28. Wijesekera TP, Dolphin D. Some preparations and properties of porphyrins. Adv Exp Med Biol. 1985;193:229–266.
29. Pan DY, Zhang JC, Li Z, et al. Observation of pH-, solvent-, spin-, and excitation-dependent blue photoluminescence from carbon nanoparticles. Chem Commun. 2010;46(21):3681–3683. doi:10.1039/c000114g
30. Zheng HZ, Wang QL, Long YJ, et al. Enhancing the luminescence of carbon dots with a reduction pathway. Chem Commun. 2011;47(38):10650–10652. doi:10.1039/c1cc14741b
31. Kregiel D, Pawlikowska E, Antolak H. Urtica spp.: ordinary plants with extraordinary properties. Molecules. 2018;23(7):21. doi:10.3390/molecules23071664
32. Atchudan R, Edison TNJI, Perumal S, et al. Green synthesized multiple fluorescent nitrogen-doped carbon quantum dots as an efficient label-free optical nanoprobe for in vivo live-cell imaging. J Photoch Photobio A. 2019;372:99–107. doi:10.1016/j.jphotochem.2018.12.011
33. Mintz KJ, Zhou Y, Leblanc RM. Recent development of carbon quantum dots regarding their optical properties, photoluminescence mechanism, and core structure. Nanoscale. 2019;11(11):4634–4652. doi:10.1039/C8NR10059D
34. Tang L, Ji R, Cao X, et al. Deep ultraviolet photoluminescence of water-soluble self-passivated graphene quantum dots. ACS Nano. 2012;6(6):5102–5110. doi:10.1021/nn300760g
35. Atchudan R, Edison TNJI, Aseer KR, et al. Highly fluorescent nitrogen-doped carbon dots derived from Phyllanthus acidus utilized as a fluorescent probe for label-free selective detection of Fe3+ ions, live cell imaging and fluorescent ink. Biosens Bioelectron. 2018;99:303–311. doi:10.1016/j.bios.2017.07.076
36. Girgis BS, Temerk YM, Gadelrab MM, et al. X-ray diffraction patterns of activated carbons prepared under various conditions. Carbon Lett. 2007;8(2):95–100. doi:10.5714/CL.2007.8.2.095
37. Niu N, Ma Z, He F, et al. Preparation of carbon dots for cellular imaging by the molecular aggregation of cellulolytic enzyme lignin. Langmuir. 2017;33(23):5786–5795. doi:10.1021/acs.langmuir.7b00617
38. Gong X, Zhang Q, Gao Y, et al. Phosphorus and nitrogen dual-doped hollow carbon dot as a nanocarrier for doxorubicin delivery and biological imaging. ACS Appl Mater Inter. 2016;8(18):11288–11297. doi:10.1021/acsami.6b01577
39. Meiling TT, Schurmann R, Vogel S, et al. Photophysics and chemistry of nitrogen-doped carbon nanodots with high photoluminescence quantum yield. J Phys Chem C. 2018;122(18):10217–10230. doi:10.1021/acs.jpcc.8b00748
40. Xu Y, Wu M, Liu Y, et al. Nitrogen-doped carbon dots: a facile and general preparation method, photoluminescence Investigation, and imaging applications. Chem-Eur J. 2013;19(7):2276–2283. doi:10.1002/chem.201203641
41. Cui Y, Liu RJ, Ye FG, et al. Single-excitation, dual-emission biomass quantum dots: preparation and application for ratiometric fluorescence imaging of coenzyme A in living cells. Nanoscale. 2019;11(19):9270–9275. doi:10.1039/C9NR01809C
42. Liu XQ, Zhou ZP, Wang T, et al. Visual monitoring of trace water in organic solvents based on ecofriendly b/r-CDs ratiometric fluorescence test paper. Talanta. 2020;216:7. doi:10.1016/j.talanta.2020.120958
43. Yang Y, Jiang J, Shen G, et al. An optical sensor for mercury ion based on the fluorescence quenching of tetra(p-dimethylaminophenyl)porphyrin. Anal Chim Acta. 2009;636(1):83–88. doi:10.1016/j.aca.2009.01.038
44. Zhu XJ, Fu ST, Wong WK, et al. A near-infrared-fluorescent chemodosimeter for mercuric ion based on an expanded porphyrin. Angew Chem Int Edit. 2006;118(19):3222.
45. Reinhardt JW. Side-effects: mercury contribution to body burden from dental amalgam. Adv Dental Res. 1992;6:110–113. doi:10.1177/08959374920060010201
46. Osinka A, Pasternak K. Mercury in medicine and health service. J Elementol. 2014;19(1):289–297.
47. Xie YH. Colorimetric determination of Hg(II) via the gold amalgam induced deaggregation of gold nanoparticles. Microchim Acta. 2018;185(7):6. doi:10.1007/s00604-018-2900-9
48. Huang Y, Li F, Ma GC, et al. Aggregation induced photoacoustic detection of mercury (II) ions using quaternary ammonium group-capped gold nanorods. Talanta. 2018;187:65–72. doi:10.1016/j.talanta.2018.05.002
49. Xu Q, Zheng X, Street J, et al. Synthesis, mechanical investigation, and application of nitrogen and phosphorus co-doped carbon dots with a high photoluminescent quantum yield. Nano Res. 2018;11(7):3691–3701. doi:10.1007/s12274-017-1937-0
50. Wu HF, Tong CL. Nitrogen- and sulfur-codoped carbon dots for highly selective and sensitive fluorescent detection of hg2+ ions and sulfide in environmental water samples. J Agric Food Chem. 2019;67(10):2794–2800. doi:10.1021/acs.jafc.8b07176
51. Zhang WJ, Liu SG, Zhang XY, et al. Ratiometric assay of mercury ion based on nitrogen-doped carbon dots with two different optical signals: second-order scattering and fluorescence. Anal Bioanal Chem. 2020;412(18):4375–4382. doi:10.1007/s00216-020-02676-8
52. Liu W, Wang XY, Wang YQ, et al. Ratiometric fluorescence sensor based on dithiothreitol modified carbon dots-gold nanoclusters for the sensitive detection of mercury ions in water samples. Sensor Actuat B-Chem. 2018;262:810–817. doi:10.1016/j.snb.2018.01.222
 © 2021 The Author(s). This work is published and licensed by Dove Medical Press Limited. The full terms of this license are available at https://www.dovepress.com/terms.php and incorporate the Creative Commons Attribution - Non Commercial (unported, v3.0) License.
By accessing the work you hereby accept the Terms. Non-commercial uses of the work are permitted without any further permission from Dove Medical Press Limited, provided the work is properly attributed. For permission for commercial use of this work, please see paragraphs 4.2 and 5 of our Terms.
© 2021 The Author(s). This work is published and licensed by Dove Medical Press Limited. The full terms of this license are available at https://www.dovepress.com/terms.php and incorporate the Creative Commons Attribution - Non Commercial (unported, v3.0) License.
By accessing the work you hereby accept the Terms. Non-commercial uses of the work are permitted without any further permission from Dove Medical Press Limited, provided the work is properly attributed. For permission for commercial use of this work, please see paragraphs 4.2 and 5 of our Terms.