")
Back to Journals » Journal of Inflammation Research » Volume 16
An Important Role in Novel Immune Mechanism and Diagnostic Model of Ankylosing Spondylitis: The CeRNA-ADRB2 Network
Received 6 September 2023
Accepted for publication 7 November 2023
Published 6 December 2023 Volume 2023:16 Pages 5915—5936
DOI https://doi.org/10.2147/JIR.S431603
Checked for plagiarism Yes
Review by Single anonymous peer review
Peer reviewer comments 2
Editor who approved publication: Dr Tara Strutt
Feihong Huang,1,2,* Zhiping Su,3,* Chaojie Yu1
1Department of Bone and Soft Tissue Surgery, Guangxi Medical University Cancer Hospital, Nanning, People’s Republic of China; 2Spine and Osteopathy Ward, The First Affiliated Hospital of Guangxi Medical University, Nanning, People’s Republic of China; 3Department of Radiation Oncology, Guangxi Medical University Cancer Hospital, Nanning, People’s Republic of China
*These authors contributed equally to this work
Correspondence: Chaojie Yu, Guangxi Medical University Cancer Hospital, Department of Bone and Soft Tissue Surgery, Guangxi Medical University Cancer Hospital, Nanning, Guangxi Zhuang Autonomous Region, 530021, People’s Republic of China, Email [email protected]
Objective: The mechanism of ankylosing spondylitis (AS) remains unclear, and clinical diagnosis still pose challenges. This study aims to explore potential regulatory mechanisms underlying AS and develop a novel diagnostic model.
Methods: Interspinous ligament (ISL) tissues were collected from control samples and ankylosing spondylitis with kyphotic deformity (AS-KD) samples during surgery, followed by high-throughput sequencing. By integrating gene expression profiles from publicly available AS peripheral blood (PB) samples, differentially expressed immune genes (DEIRGs) were identified. Through gene set enrichment analysis(GSEA), gene ontology (GO) and Kyoto Encyclopedia of Genes and Genomes (KEGG) analyses, the regulatory mechanisms of the immune gene family in AS were explored. A diagnostic model for AS were constructed and validated it externally. Additionally, a competing endogenous RNA(ceRNA)-protein regulatory network was built for key immune genes.
Results: Adrenergic receptor beta 2 (ADRB2) was downregulated in both ISL and PB samples. It was enriched in common pathways, including natural killer cell-mediated cytotoxicity, B cell receptor signaling pathway, Th1 and Th2 cell differentiation. Using the LASSO algorithm, 12 DEIRGs were identified, including the downregulated ADRB2. Based on the DEIRGs family, a novel diagnostic model was constructed with an AUC of 0.87 for the validation set and 0.7 for the test set. The AUC for ADRB2 alone was 0.75. Subgrouping AS based on these immune genes revealed a close association with neutrophils. GSEA and KEGG analysis of ISL, PB, and subgrouping of AS showed that ADRB2 may be involved in regulating the T cell receptor signaling pathway. Immune infiltration analysis indicated a decrease in CD8+ T cell infiltration, which was positively correlated with ADRB2. ADRB2 in AS-KD was regulated by multiple ceRNA-protein (lncRNA-[hsa-miR-513a-5p]-mRNA-protein).
Conclusion: The immune gene family, especially ADRB2, participates in the mechanism and contributes to the diagnosis of AS.
Keywords: ankylosing spondylitis, immune genes, adrenergic receptor beta-2, ADRB2, diagnostic model, competing endogenous RNA network, ceRNA network
Introduction
Ankylosing spondylitis (AS) is an immune-mediated inflammatory disease.1 It is the second most common disease in the spondyloarthritis group and is mainly characterized by inflammation of the spine and sacroiliac joints, leading to abnormal bone remodeling and ankylosis.2 The pathogenesis of AS is not fully understood and may be associated with genetic susceptibility, autoimmunity, and inflammation, with an estimated heritability of over 90% and the highest genetic correlation with HLA-B27.3 The average prevalence of AS per 10,000 people was 31.9 in North America, 23.8 in Europe, 16.7 in Asia, 10.2 in Latin America, and 7.4 in Africa.4 AS is characterized by inflammatory back pain that may lead to structural and functional impairment, including kyphotic deformity.5 As a disease that may not be completely cured, AS brings continuous pain and suffering to patients, and the cost of its treatment imposes a huge financial burden on families and society. A more in-depth study of the mechanisms of AS is necessary to develop more effective treatment strategies and to perform early diagnosis of the disease. The correlation between AS and genetics has become a hot issue of research since the first confirmation of a genetic factor for AS in 1961.6 Studies have shown that 90% ~95% of AS patients are HLA-B27 positive and 1% ~ 2% of HLA-B27 positive people are AS, and this number increases to 15% ~ 20% for those with first-degree relatives who are infected.7,8 However, even the most highly regarded HLA-B27 did not contribute more than 20% to the overall genetic contribution,9 suggesting that other factors also play a key role in the pathogenesis of AS.
The intricate pathogenesis of AS involves the dynamic interplay between cellular immunity and humoral immunity. Within the realm of AS, activated T lymphocytes, particularly the CD4+ subset, orchestrate the chronic inflammatory features of the ailment.10 These T cells are postulated to infiltrate the affected tissues, such as the spine, hip joints, and sacroiliac joints, thereby releasing inflammatory cytokines like IL-17 and TNF, perpetuating the cascade of inflammatory reactions.11 Conversely, the humoral immune response, epitomized by B cells and their associated antibodies, may also play a role in the autoimmune facets of AS.12 In the context of AS, aberrations in humoral immunity give rise to the production of autoantibodies which may assail the body’s own joint tissues.2 Recent studies have suggested that the metabolic microenvironment may play an important role in the arthritic progression of AS.13–15 As a part of the metabolic microenvironment, the emergence of autoantibodies and the continued proliferation of T cells support the idea that AS is an autoimmune disease.2 Studies on human genetics combined with animal models have shown that CD8+ T cells and CD4+ T cell subsets, mediated by the IL-23/IL-17 pathway and TNF-α, participate in important stages of the pathogenesis of AS,16,17 which may lead to kyphotic deformity. These studies suggest that immune factors may play central roles in the development of AS, which still needs to be explored.
Tremendous progress has been made in exploring immune-related genes(IRGs) of AS, thanks to advances in high-throughput sequencing technology. These discoveries include genes encoding cytokine receptors, transcription factors, signaling molecules, and transporters, which provide insights into the pathogenesis of AS.18 However, the reliability of biomarkers may be weakened by insufficient sample size or being limited to a single level of sample histological types.19 Complex genetic bases underlie the molecular mechanisms of human diseases, requiring sophisticated sequencing techniques and advanced analytical methods. Interdisciplinary approaches, such as bioinformatics, contribute to a comprehensive understanding of disease mechanisms.20
In this study, we aimed to identify DEIRGs in AS by using high-throughput sequencing of both ISL and PB. To gain insights into the roles played by DEIRGs in disease progression and immune cell infiltration, bioinformatics analysis was conducted, including immune infiltration analysis and functional enrichment. Moreover, we have developed a predictive model for AS and utilized immune biomarkers to subtype AS, which helps us to further understand the regulatory role of key genes on AS. Overall, our study contributes to a comprehensive understanding of AS and provides potential therapeutic targets.
Materials and Methods
Source of ISL Samples
Between September 2018 and December 2020, lumbar posterior entry surgery was performed on two groups of patients at the Department of Spinal Orthopedics, Affiliated Hospital of Guangxi Medical University: those diagnosed with ankylosing spondylitis and spinal kyphotic deformity (AS-KD group) based on the 1984 New York Revised Diagnostic Criteria for AS, and those with lumbar disc herniation (non-AS group) confirmed by MRI and Pfirrmann grade 3–4. Patients with other rheumatic diseases or autoimmune conditions such as lupus erythematosus were excluded from both groups. ISL samples were collected from both groups using a randomization principle. The collected ISL was cut into 0.5 cm pieces and washed quickly with saline to remove residual blood components. RNA Keeper was then added in a 5:1 ratio to the tissue within 10 minutes of collection and left overnight at 4°C for adequate penetration of the solution into the tissue. The tissue samples were stored at −80°C until analysis.
Gene Sequencing
The mRNA, lncRNA, and miRNA of the ISL samples were obtained by competing endogenous RNA sequencing (ceRNA sequencing). The total RNA was amplified and labeled using the Agilent Expression Profiling Kit, Low Input Quick Amp Labeling Kit and One-Color (Cat. # 5190–2305, Agilent Technologies, Santa Clara, CA, USA). The labeling process was divided into three steps: single label spike-in preparation, reverse transcription, fluorescent labeling, and purification of the labeled RNA using the RNeasy Mini Kit (Cat.# 74106, QIAGEN, GmbH, Germany). The Gene Expression Hybridization Kit (Cat.# 5188–5242, Agilent Technologies, Santa Clara, CA, USA) was used in a rolling hybridization oven (Cat.# G2545A, Agilent Technologies, Santa Clara, CA, USA) at 65°C, 10 rpm for 17 hours. Hybridized RNA was sampled at 1.65 μg, and washed in staining dishes (Cat. # 121, Thermo Shandon, Waltham, MA, USA) using the Gene Expression Wash Buffer Kit (Cat.# 5188–5327, Agilent Technologies, Santa Clara, CA, USA). The completed microarrays were scanned using an Agilent Microarray Scanner (Cat.# G2565CA, Agilent Technologies, Santa Clara, CA, USA) with the software setting Dye channel: Green, Scan resolution=3μm. Data were read using Feature Extraction software 10.7 (Agilent Technologies, Santa Clara, CA, USA).
Gene Expression Microarrays for PB of AS
To investigate gene expression patterns associated with AS, the GEO database of NCBI was searched by using keywords: Ankylosing Spondylitis, Spondyloarthropathy and Axial Spondyloarthritis. Two datasets GSE73754 and GSE25101 were identified for further analysis. To merge the datasets and eliminate any batch effects, the R package “inSilicoMerging”21 and the approach described by Johnson et al22 were used, respectively. After applying these methods, we obtained a gene expression matrix that was normalized and free of batch effects, enabling us to perform downstream analyses.
Screening of DE mRNAs
The R package “limma” was utilized, which is a differential expression screening method based on a generalized linear model,23 to identify DE mRNAs between AS-KD and control groups. To account for potential differences in protein concentrations across tissue sources, a more stringent threshold for DE mRNAs was set in the ISL samples, using a difference multiplier of 2.0 and p-value < 0.05, compared to a threshold of a difference multiplier of 1.2 and p-value < 0.05 for PB samples. T-tests were used to validate the statistical significance of the DE mRNA differences. Moreover, a list of 1902 immune-related genes (Supplementary Material 1) was obtained from the immProt database (https://www.immport.org/shared/). DEIRGs were identified by using a Venn diagram.
Genes that show differential expression across different tissues may have important biological significance. Therefore, we intersected the DEGs between ISL and PB to obtain the key genes.
Functional Enrichment Analysis
The Kyoto Encyclopedia of Genes and Genomes (KEGG) is a widely used database for storing genome, biological pathways, disease, and drug information.24 From the KEGG REST API, the latest gene annotation for KEGG Pathway was obtained. In addition, gene ontology (GO) analysis was carried out by using the GO annotation of the genes obtained from the R package org.Hs.eg.db (version 3.1.0). The R package clusterProfiler (version 3.14.3) was used for enrichment analysis.
To evaluate the relevant pathways and molecular mechanisms, gene set enrichment analysis (GSEA) was used. GSEA can be used to study the synergistic changes of genes on phenotype.3 The GSEA software (version 3.0) was obtained from the GSEA website and downloaded a subset of c2.cp.kegg.v7.4.symbols.gmt from the Molecular Signatures Database.
Immune Infiltration Analysis
IOBR25 is a computational tool for immuno-tumor biology research. Based on gene expression spectrum, we used R package IOBR and selected CIBERSORT26 method to calculate 22 immune infiltration cell scores per sample. The correlation between immune cells and genes was analyzed by correlation heat map.
LASSO Algorithm for Screening Biomarker
In this study, we aimed to identify biomarkers for AS by analyzing gene expression data of 26 DEIRGs in 104 human PB samples. The R package “glmnet” was utilized for regression analysis using the lasso-cox method, integrating disease status and gene expression data. A 5-fold cross-validation was employed to obtain the optimal model and set the lambda value to 0.0285, resulting in the identification of 12 biomarkers.
To evaluate the predictive significance of these biomarkers, the R package SURVIVAL was used to integrate disease status and expression data of the 12 biomarkers. We then applied the Cox method and performed receiver operating characteristic curve (ROC) analysis using the R package “pROC”, yielding the area under the curve (AUC).
Finally, a nomogram model was developed based on the selected biomarkers to predict the prevalence of AS. To screen for biomarkers with the most diagnostic value for the disease, a multivariable stepwise regression analysis was used.
Collection of External Validation Set for Diagnostic Models
A new search in the NCBI GEO database was conducted using the keywords ankylosing spondylitis, inflammatory disease, autoimmune disease, and peripheral blood. As a result, the datasets GSE11886 and GSE134290 were obtained, which were used as validation sets for the diagnostic model. It is worth noting that we excluded samples treated with IFN in GSE11886 to eliminate confounding factors.
Protein-Protein Interaction (PPI) Network
The STRING database is widely used to search for relationships between known proteins and predicted proteins. Using the STRING database, a PPI network for DE mRNAs, DEIRGs, and 12 biomarkers were constructed. Cytoscape (v3.7.2) software was used to display the PPI network models.
Consistency Clustering Analysis
ConsensusClusterPlus27 is an unsupervised clustering method that utilizes resampling to draw multiple subsamples from the input dataset, specifies the number of clusters (k), and evaluates cluster quality across different values of k. The optimal number of clusters is determined by an empirical cumulative distribution function plot. In our study, we employed ConsensusClusterPlus and used the expression matrix of 12 biomarkers to cluster 68 AS patients into two distinct immune patterns: Cluster1 and Cluster2.
Construct a ceRNA Network for ADRB2
The R package “limma” was used to obtain DE miRNAs and DE lncRNAs. Subsequently, we aimed to construct a ceRNA network which regulates the down-regulated biomarker ADRB2 and involves lncRNA-miRNA-mRNA interactions. The miRNAs that target ADRB2 were predicted by utilizing the TargetScan database.28 Then, we compared these predictions with the DE miRNAs in ISL and identified their intersection. This allowed us to obtain a list of DE miRNAs that were likely to target ADRB2. Furthermore, the ENCORI database29 was employed for predicting the lncRNAs involved in the ceRNA network.
Immunohistochemistry (IHC)
The experimental group consisted of ISL samples from AS-KD, and the control group consisted of ISL samples from patients with lumbar disc herniation without AS. IHC was performed to compare the differences in ADRB2 expression between the experimental and control groups. Immunohistochemical sections with complete staining were obtained from paraffin sections after experimental procedures such as roasting, dewaxing, hydration, and antigen repair. The images were observed under the microscope. The criteria were scored as follows: (1) by degree of staining (0 points: negative staining, 1 point: light yellow, 2 points: light brown, 3 points: dark brown), and (2) positive area (1 point: 0–25%, 2 points: 26–50%, 3 points: 51–75%, 4 points: 76–100%). The final two scores were summed (0–3 points: negative expression, 4–7 points: positive expression). ImageJ software was used to assess the positivity rate of all IHC images, and IBM SPSS Statistics 22.0 was used to perform a t-test for ADRB2 positivity in the experimental and control groups.
Results
Collection and Processing of Samples
The study flow is shown in Figure 1. The ISL samples were obtained from three lumbar disc herniation patients (Figure 2A) and three AS-KD patients (Figure 2B), with detailed information provided in clinical data of patients (Supplementary Material 2). Through ceRNA sequencing, we obtained mRNAs, miRNAs, and lncRNAs of the ISL samples, To meet the analytical requirements for gene expression data, we performed normalization and log transformation on the data (Figure 2C and D). The mRNA expression matrix of PB samples from AS patients was obtained from the GEO database (Supplementary Material 3), and the batch effect was removed between GSE73754 and GSE25101 (Figure 2E and F).
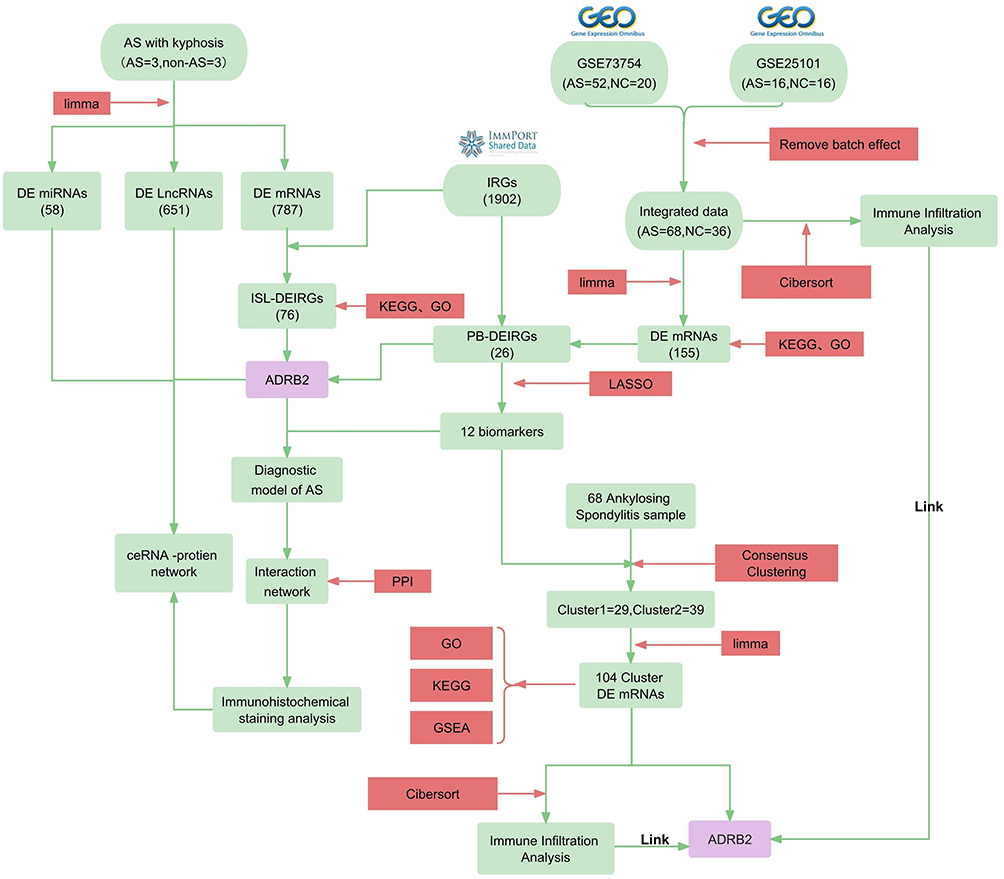 |
Figure 1 Flow chart. Bioinformatics methods used: KEGG (Kyoto Encyclopedia of Genes and Genomes), GO (Gene Ontology), GSEA (Gene Set Enrichment Analysis), LASSO (Least Absolute Shrinkage and Selection Operator), Cibersort (Cell-type Identification By Estimating Relative Subsets Of RNA Transcripts), and PPI (Protein-Protein Interaction). Abbreviations: AS (Ankylosing Spondylitis), AS-KD (Ankylosing Spondylitis with Kyphotic Deformity), DE mRNAs (Differentially Expressed messenger RNAs), IRGs (Immune-Related Genes), DEIRGs (Differentially Expressed Immune-Related Genes), PB (Peripheral blood), and ISL (Interspinous ligaments), ADRB2 (beta-2 adrenergic receptor). |
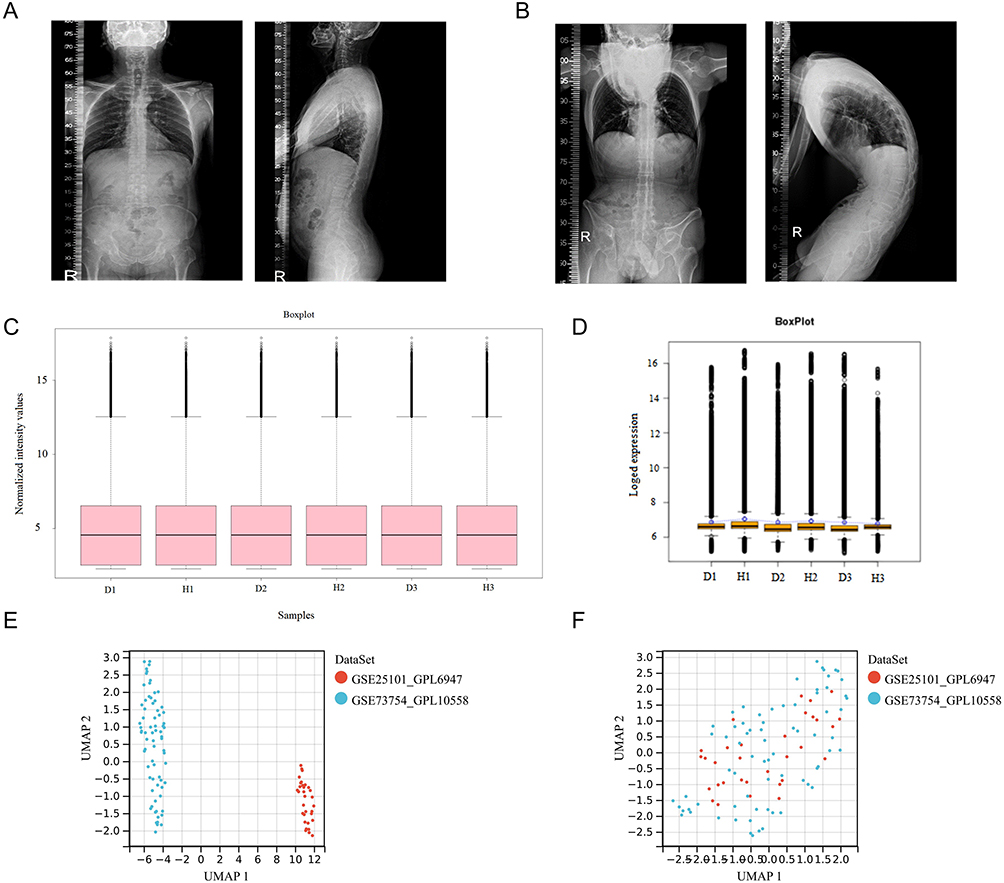 |
Figure 2 Sample collection and processing: (A) Full spine lateral radiograph of the control group. (B) Full spine lateral radiograph of a patient with AS-KD. (C and D) Normalization and log transformation were applied to the ceRNA sequencing data of ISL samples from AS-KD patients (D: disease group; H: healthy group). (E) Gene expression data from PB samples of AS patients before batch correction. (F) Gene expression data from PB samples of AS patients after batch correction. |
Identification of DEIRGs
The differential analysis of ISL samples revealed 787 DE mRNAs (Supplementary Material 4), with 264 upregulated and 523 downregulated (Figure 3A). A heat map depicting the differential expression was presented (Figure 3B). By intersecting the DE mRNAs with 1902 IRGs (Supplementary Material 1), a total of 76 DEIRGs were identified (Figure 3C).
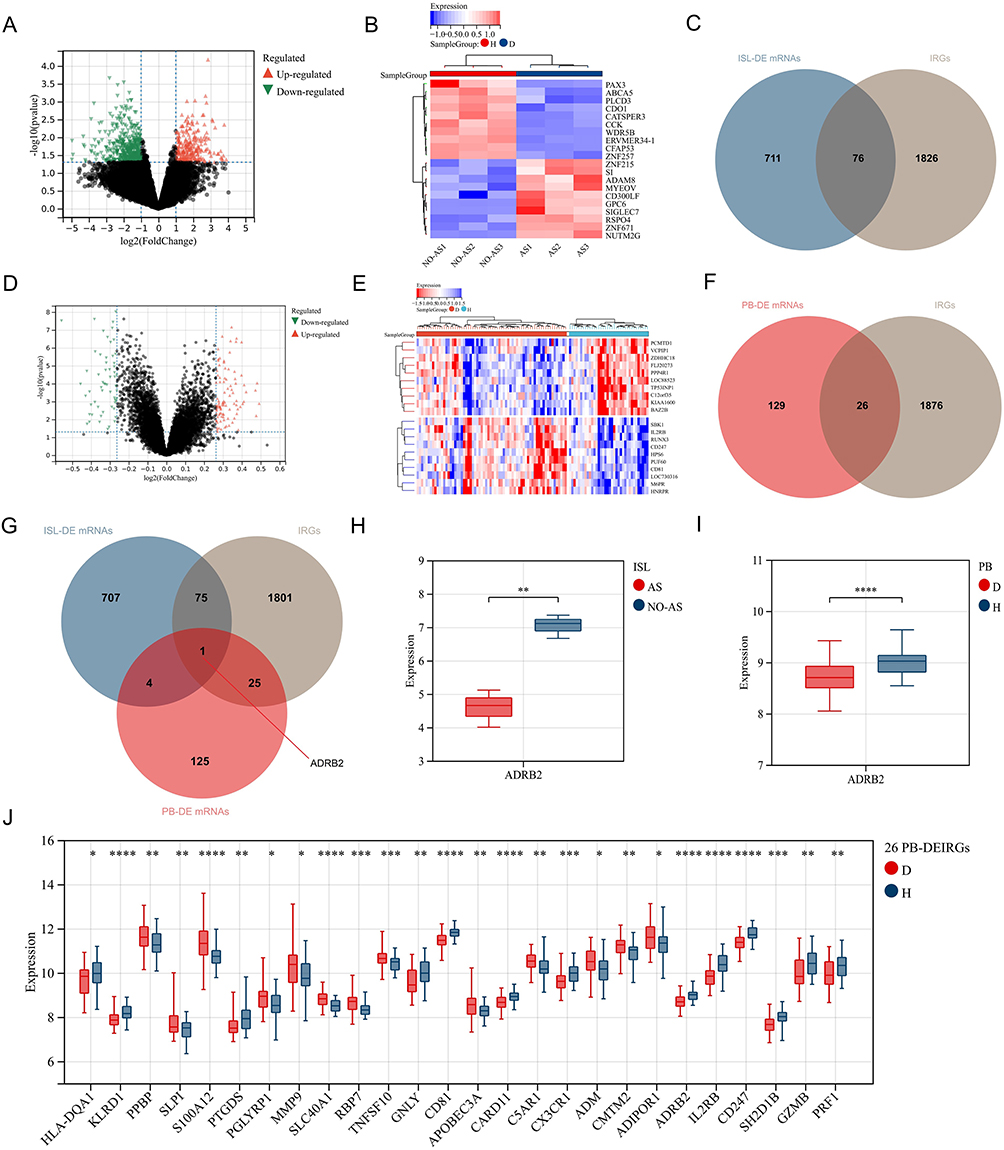 |
Figure 3 Screening of DEIRGs: (A) Volcano plot of gene expression differences in ISL samples from AS-KD patients. (B) Heatmap of gene expression differences in ISL samples from AS-KD patients. (D: Disease group, H: Control group). (C) Intersection of ISL-DE mRNAs and IRGs. (D) Volcano plot of gene expression differences in PB samples from AS patients. (E) Heatmap of gene expression differences in PB samples from AS patients. (F) Intersection of PB-DE mRNAs and IRGs. (G) Intersection of ISL-DE mRNAs, PB-DE mRNAs, and IRGs. (H) Expression levels of ADRB2 in ISL. (AS: AS-KD group, NO-AS: Control group). (I) Expression levels of ADRB2 in PB. (J) Expression levels of 26 PB-DEIRGs obtained by intersecting PB-DE mRNAs and IRGs. “*” represents p < 0.05, “**” represents p < 0.01, “***” represents p < 0.001, “****” represents p < 0.0001. |
Similarly, the differential analysis of PB samples identified 155 DE mRNAs (Supplementary Material 5), consisting of 97 upregulated and 58 downregulated transcripts (Figure 3D). The corresponding heat map was shown in Figure 3E. Intersection of the DE mRNAs with 1902 IRGs led to the identification of 26 DEIRGs (Figure 3F) with 13 upregulated and 13 downregulated genes (Figure 3J).
Moreover, after intersecting the ISL-DE mRNAs, PB-DE mRNAs, and 1902 IRGs, gene ADRB2 was identified (Figure 3G). Notably, the expression of ADRB2 was significantly downregulated in both ISL and PB samples from AS patients (Figure 3H and I).
Functional Enrichment Analysis of DEIRGs
The KEGG analysis for ISL-DEIRGs revealed 29 pathways with p < 0.05, including key pathways such as cytokine-cytokine receptor interaction, chemokine signaling pathway, and neuroactive ligand-receptor interaction (Figure 4A). Similarly, PB-DEIRGs showed significant involvement in 17 pathways with p < 0.05, such as natural killer cell-mediated cytotoxicity, B cell receptor signaling pathway, and complement and coagulation cascades, among others (Figure 4B).
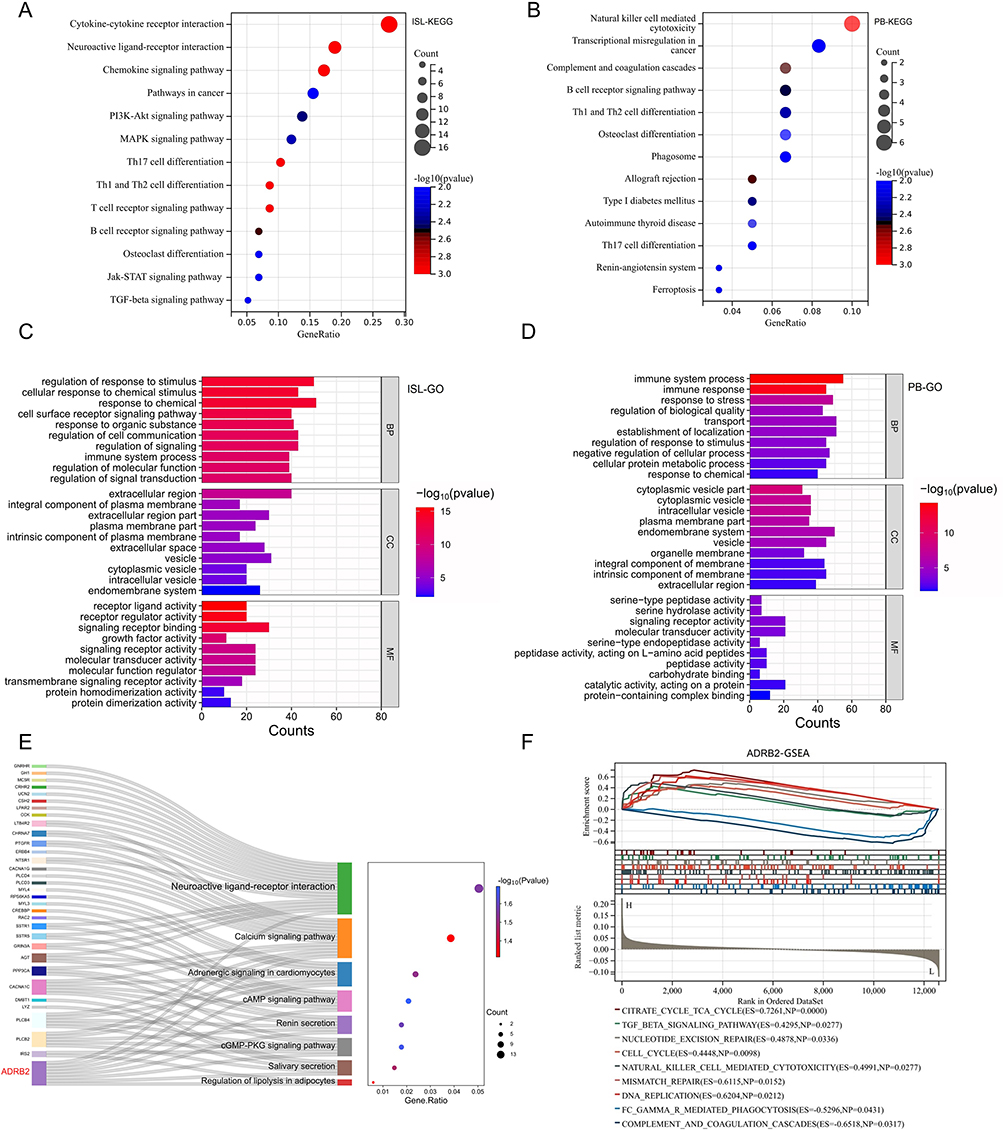 |
Figure 4 Functional enrichment analysis of DEIRGs and ADRB2: (A) The KEGG analysis results of ISL-DEIRGs. (B) The KEGG analysis results of PB-DEIRGs. (C) The GO analysis results of ISL-DEIRGs. (D) The GO analysis results of PB-DEIRGs. (E) The KEGG pathways enriched by ADRB2. (F) After re-grouping peripheral blood samples based on the expression level of ADRB2, GSEA analysis was performed (L: ADRB2 low-expression group; H: ADRB2 high-expression group; ES: Enrichment Score). |
The GO analysis revealed that ISL-DEIRGs were predominantly involved in regulating biological processes (GObp) related to immune system function, cell surface receptor signaling pathway, and regulation of cell communication, among others. These genes also played a crucial role in regulating cellular components (GOcc) such as extracellular region, extracellular space, and extracellular matrix, among others. Furthermore, the molecular functions (GOmf) of these genes included key signaling receptor binding, growth factor activity, and receptor ligand activity, among others (Figure 4C). The GObp associated with PB-DEIRGs were primarily focused on immune system process, immune response, and response to stress, while the GOcc involved endomembrane system, vesicle, and intrinsic component of the membrane, and GOmf were mainly focused on serine-type peptidase activity, signaling receptor activity, and molecular transducer activity (Figure 4D).
In particular, ADRB2 was actively involved in regulating several KEGG pathways such as neuroactive ligand-receptor interactions, cAMP signaling pathway, cGMP-PKG signaling pathway, and calcium signaling pathway, among others (Figure 4E). Additionally, the GSEA analysis results for ADRB2 showed significant involvement in complement and coagulation cascades, TGF-β signaling pathway, and natural killer cell-mediated cytotoxicity, among others (Figure 4F).
Common KEGG and GO Terms in Both ISL and PB
The analysis of enriched DEIRGs in both ISL and PB revealed 7 common KEGG pathways that are mainly involved in the regulation of cells such as B cells, T cells, NK cells, and osteoclasts (Figure 5A).
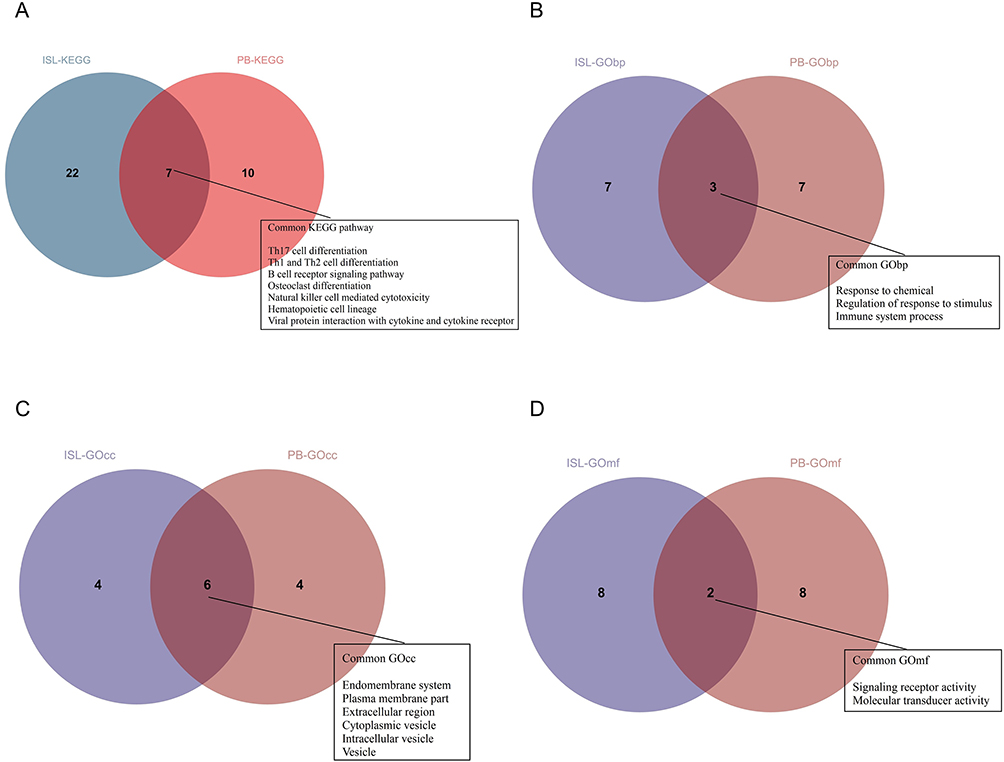 |
Figure 5 The common pathways of KEGG and GO analysis for DEIRGs in PB and ISL samples: (A) The common intersection of KEGG analysis. (B) The common intersection of GO biological process (GObp) analysis. (C) The common intersection of GO cellular component (GOcc) analysis. (D) The common intersection of GO molecular function (GOmf) analysis. |
In addition, the DEIRGs of ISL and PB were found to be enriched in 3 common GObp terms, including response to chemical, regulation of response to stimulus, and immune system process (Figure 5B). Furthermore, the functional enrichment analysis of DEIRGs of ISL and PB also identified 6 common GOcc terms, such as extracellular region, vesicle, and endomembrane system, among others (Figure 5C). Finally, the DEIRGs of ISL and PB were enriched in 2 common GOmf terms, including signaling receptor activity and molecular transducer activity (Figure 5D).
Identification of Biomarkers and Construction of Disease Diagnosis Models
The LASSO algorithm was applied to identify 12 biomarkers that were most significantly associated with the development of AS (Figure 6A) and the optimal diagnostic model was obtained through 5-fold cross-validation (Figure 6B). Notably, ADRB2 was included among the identified set of biomarkers. Subsequently, multivariable survival analysis demonstrated that ADRB2, IL2RB and PRF1 was important disease prediction indicators (Figure 6C). The diagnostic model yielded a high AUC value of 0.89, indicating excellent performance in diagnosing AS (Figure 6D).
 |
Figure 6 Diagnostic model of AS: (A) Screening of diagnostic biomarkers from 26 PB-DEIRGs using the LASSO algorithm. (B) 5-fold cross-validation was performed to obtain the optimal diagnostic model. (C) Forest plot of multivariate survival analysis in AS patients. (Hazard Ratio=1: no harm, Hazard Ratio<1: reduced harm, Hazard Ratio>1: increased harm). (D) ROC curves for risk scores in AS diagnosis. (E) ROC curves of 12 diagnostic biomarkers. |
Interestingly, when we analyzed the predictive ability of the 12 biomarkers independently, half of the genes exhibited an AUC value of ≥0.7, while ADRB2, CD81, and IL2RB had an AUC value of ≥0.75 (Figure 6E), further supporting their potential as diagnostic biomarkers.
To predict the prevalence of AS, a nomogram model was constructed based on the expression of the 12 identified biomarkers (Figure 7A). The calibration curves indicated that the predictions of the nomogram model were similar to those of the ideal model (Figure 7B), and the risk scores calculated by decision curve analysis were superior to those of the random model (Figure 7C).
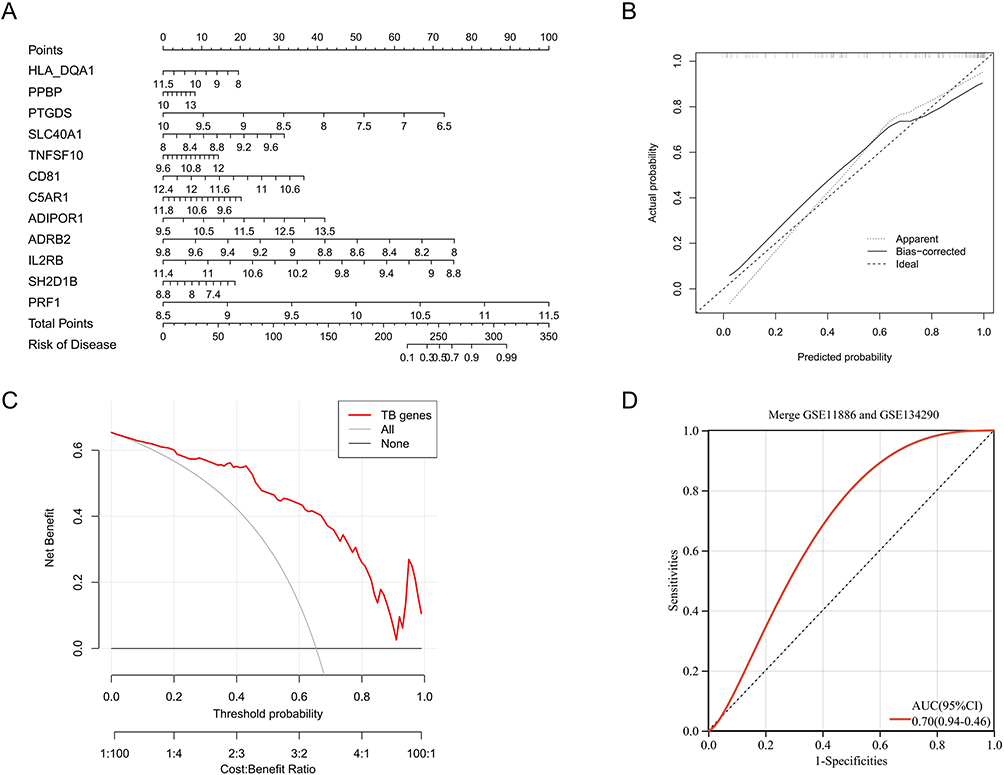 |
Figure 7 Optimization and evaluation of diagnostic models: (A) Construct a nomogram for the diagnosis of AS using 12 diagnostic biomarkers. (B) The calibration curve of the nomogram. (C) The decision analysis curve of the nomogram (“All”: Predictive analysis using all factors related to the disease; “TB genes”: Predictive analysis using 12 diagnostic biomarkers; “None”: Predictive analysis using only non-genetic factors). (D) Diagnosing model with external validation. |
The constructed model equation is: RiskScore = Correspondence coefficient * gene expression (−0.0096HLA-DQA1 + 0.0183PPBP - 0.2341PTGDS + 0.1133SLC40A1 + 0.0309TNFSF10 - 0.2980CD81 + 0.0107C5AR1 + 0.0676ADIPOR1 - 0.3161ADRB2 - 0.3119IL2RB - 0.0443SH2D1B + 0.1393PRF1). (Only the first four decimal places are shown.)
External Validation of Diagnostic Models
We utilized the gene expression matrix of the validation set and combined it with the diagnostic model formula to calculate the risk score for each sample. Finally, the ROC curve of the validation set was obtained, and the results showed an AUC value of 0.70 (Figure 7D).
Correlation Analysis and Interaction Among DEIRGs
In PB samples, ADRB2 was significantly positively correlated with PRF1, IL2RB, CD81, SH2D1B, and PTGDS. Additionally, ADRB2 was significantly negatively correlated with C5AR1, TNFSF10, and SLC40A1, with the highest correlation coefficient found with CD81 (Figure 8A). In AS samples of PB, ADRB2 was significantly positively correlated with PRF1, IL2RB, and CD81, with the highest correlation coefficient found with CD81 (Figure 8B). In control samples of PB, ADRB2 was significantly positively correlated with PRF1, IL2RB, CD81, SH2D1B, and PTGDS. A significant negative correlation was found with TNFSF10, and the highest correlation coefficient was identified with CD81 (Figure 8C).
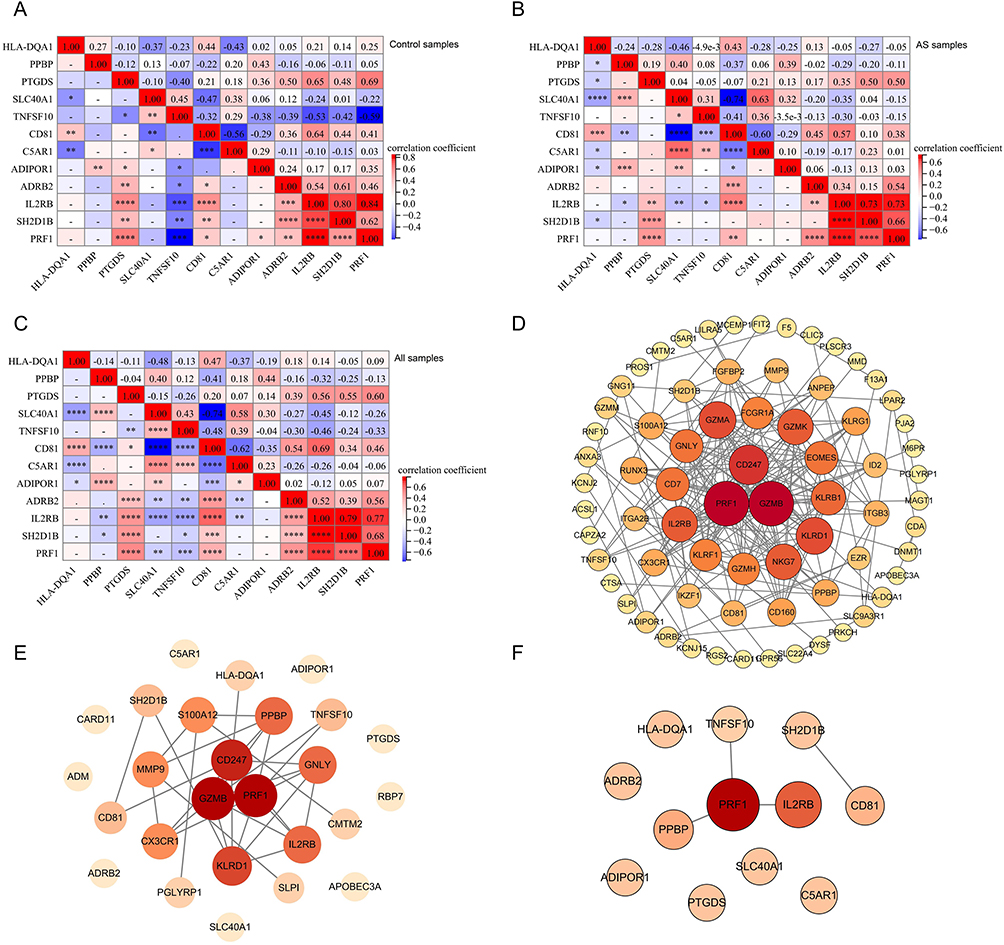 |
Figure 8 Correlation analysis and interaction among DEIRGs: (A) Correlation analysis of 12 diagnostic biomarkers in PB of all samples (“*” represents p < 0.05, “**” represents p < 0.01, “***” represents p < 0.001, “****” represents p < 0.0001; numbers indicate correlation coefficients). (B) Correlation analysis of 12 diagnostic biomarkers in PB of AS samples. (C) Correlation analysis of 12 diagnostic biomarkers in PB of control samples. (D) PPI network of DE mRNA in PB samples. (E) PPI network of DEIRGs in PB samples. (F) PPI network of diagnostic biomarkers in PB samples. (Node: gene; Link: interaction between genes; Node size: the larger the size, the more genes with interaction.). |
The PPI network of DE mRNAs from PB samples included 80 genes. Among them, PRF1 interacted with 22 genes, IL2RB interacted with 15 genes, and PPBP interacted with 8 genes (Figure 8D). The PPI network of DEIRGs in PB samples included 17 genes, with PRF1 interacting with 8 genes, IL2RB interacting with 5 genes, and PPBP interacting with 5 genes (Figure 8E). Among the 12 biomarkers, PRF1 interacted with IL2RB, PPBP, and TNFSF10, while CD81 interacted with SH2D1B (Figure 8F).
Identifying Immune Patterns of AS and Functional Enrichment Analysis of DEGs Among Immune Patterns
Consistent clustering yielded two immunisation patterns of 68 AS patients. Cluster1 (C1) contained 29 samples and cluster2 (C2) contained 39 samples. The PCA plot demonstrated successful stratification of AS patients into two groups (Figure 9A and B). Differential analysis between C1 and C2 showed 104 Cluster-DEGs, of which 79 were up-regulated and 25 down-regulated (Figure 9C).
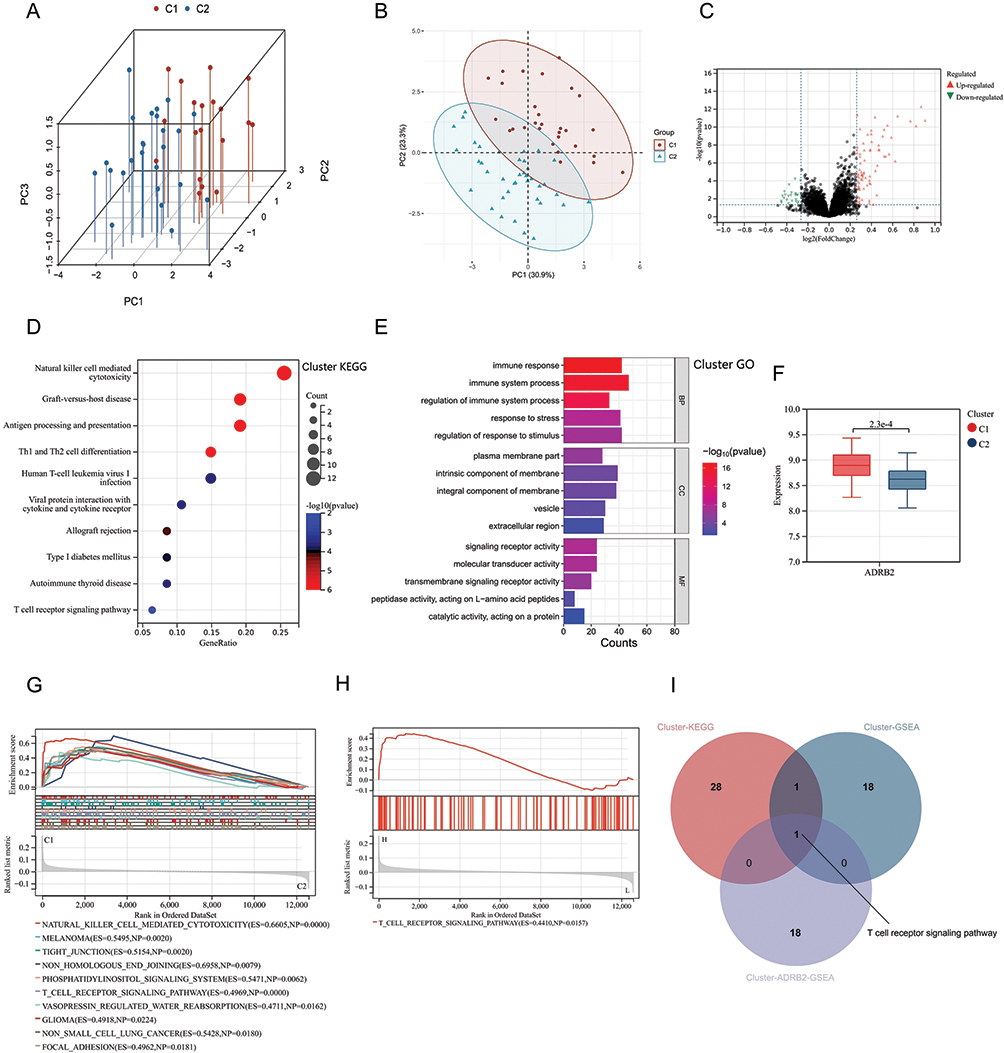 |
Figure 9 Cluster analysis results of AS patients: (A and B) Cluster analysis divided AS patients into Cluster1 (C1) and Cluster2 (C2). (C) Volcano plot of differential gene expression analysis between C1 and C2. (D) KEGG analysis of DEGs between C1 and C2 (Cluster-DEGs). (E) GO analysis of Cluster-DEGs. (F) Expression levels of ADRB2 in C1 and C2. (G) GSEA analysis of the Cluster. (H) GSEA analysis of ADRB2 in the Cluster (Cluster-ADRB2-GSEA). (I) Intersection of Cluster-KEGG, Cluster-GSEA, and Cluster-ADRB2-GSEA. |
KEGG analysis of Cluster-DEGs showed enrichment in pathways such as T cell receptor signaling pathway, natural killer cell-mediated cytotoxicity, and Th1 and Th2 cell differentiation (Figure 9D). The GObp terms regulated by Cluster-DEGs included immune system process, immune response, and regulation of immune system process (Figure 9E). The GOcc terms regulated by Cluster-DEGs included intrinsic component of membrane, integral component of membrane, and plasma membrane part (Figure 9E). The Cluster-DEGs were also found to regulate GOcc terms such as signaling receptor activity, molecular transducer activity, and transmembrane signaling receptor activity (Figure 9E).
The expression levels of ADRB2 were observed to be significantly higher in the C1 group (Figure 9F). Further analysis by overlapping the results from Cluster GSEA (Figure 9G), ADRB2 GSEA (Figure 9H), and Cluster KEGG analysis identified a common pathway, T-cell receptor signaling pathway (Figure 9I). The gene set associated with this pathway was found to be significantly enriched in the group with high expression of ADRB2, strongly suggesting that high levels of ADRB2 expression may activate this pathway (Figure 9H).
The Differences in Immune Infiltration Among Immune Patterns of AS
The stacked immune cell graph demonstrated that neutrophils and CD8+ T cells were the primary components (Figure 10A). In the AS group, low infiltration was observed for CD8+ T cells, activated NK cells, and M2 macrophages, while naive CD4+ T cells and M0 macrophages showed high infiltration (Figure 10B). A significant positive correlation was found between ADRB2 and CD8+ T cells and activated NK cells in AS patients, whereas a significant negative correlation was observed between ADRB2 and naive CD4+ T cells and M0 macrophages (Figure 10C).
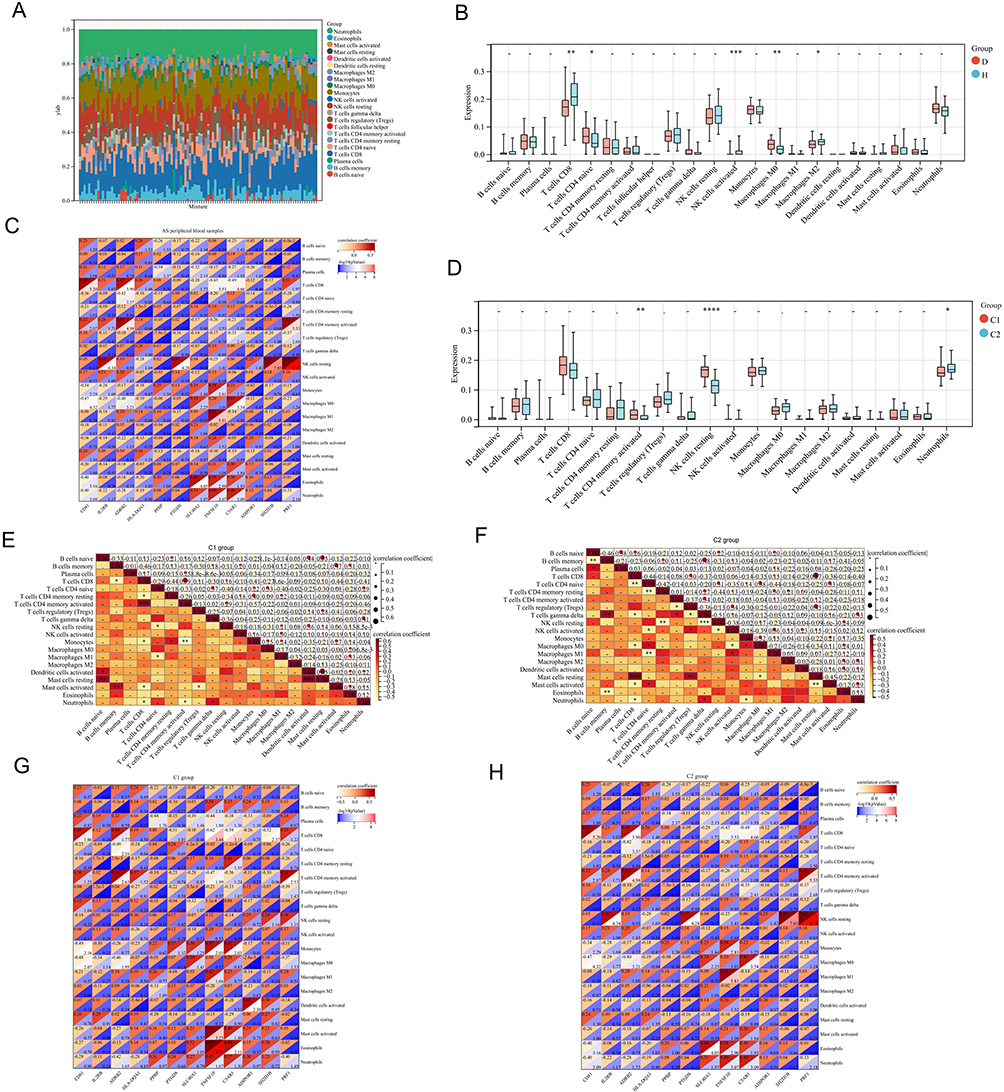 |
Figure 10 Immune infiltration analysis of different clusters in PB of AS patients: (A) Stacked plot of immune cells in 68 AS patients. (X-axis: sample ID; different colors: immune cells). (B) Infiltration levels of immune cells in PB. (D: disease group, H: control group). (C) Correlation analysis between diagnostic biomarkers and immune cells in PB of AS patients. (X-axis: diagnostic biomarkers; Y-axis: immune cells; upper left of the square: correlation coefficient; lower right of the square: -log10(p value)). (D) Infiltration levels of immune cells in different AS clusters (“*” represents p < 0.05, “**” represents p < 0.01, “***” represents p < 0.001, “****” represents p < 0.0001). (E) Correlation analysis between immune cells in C1. (F) Correlation analysis between immune cells in C2. (G) Correlation analysis between diagnostic biomarkers and immune cells in C1. (H) Correlation analysis between diagnostic biomarkers and immune cells in C2. |
In the C1 group, neutrophils exhibited low infiltration, and activated CD4+ memory T cells and resting NK cells showed high infiltration (Figure 10D). Furthermore, a significant positive correlation was found between neutrophils and gamma delta T cells in the C1 group (Figure 10E). In the C2 group, a significant positive correlation was also observed between neutrophils and gamma delta T cells, but a significant negative correlation was noted between neutrophils and CD8+ T cells and Monocytes (Figure 10F).
Additionally, a significant negative correlation between neutrophils and ADRB2 was observed in the C1 group (Figure 10G), whereas in the C2 group, a significant positive correlation was found between neutrophils and ADRB2 (Figure 10H).
Constructing the ceRNA Network of ADRB2
The analysis of miRNAs in ISL showed that among the 58 DE miRNAs (Supplementary Material 6), 18 were up-regulated and 40 were down-regulated (Figure 11A), which was further confirmed by the heat map (Figure 11B). In addition, differential analysis of lncRNA microarrays in ISL revealed 651 DE lncRNAs (Supplementary Material 7), of which 322 were up-regulated and 329 were down-regulated (Figure 11C), and this was also supported by the heat map (Figure 11D). By taking the intersection, we identified hsa-miR-513a-5p and its target lncRNAs (DLX6-AS1, AL008721.2, RBM26-AS1, AC006504.5, ATP1A1-AS1, MAGI2-AS3, FLNB-AS1, AC007342.4) (Figure 11E and F). Finally, the ceRNA network of ADRB2 was constructed using hsa-miR-513a-5p and its target lncRNAs (Figure 11G). Furthermore, the PPI network (Figure 11H and I) illustrated the proteins in ISL that interacted with ADRB2.
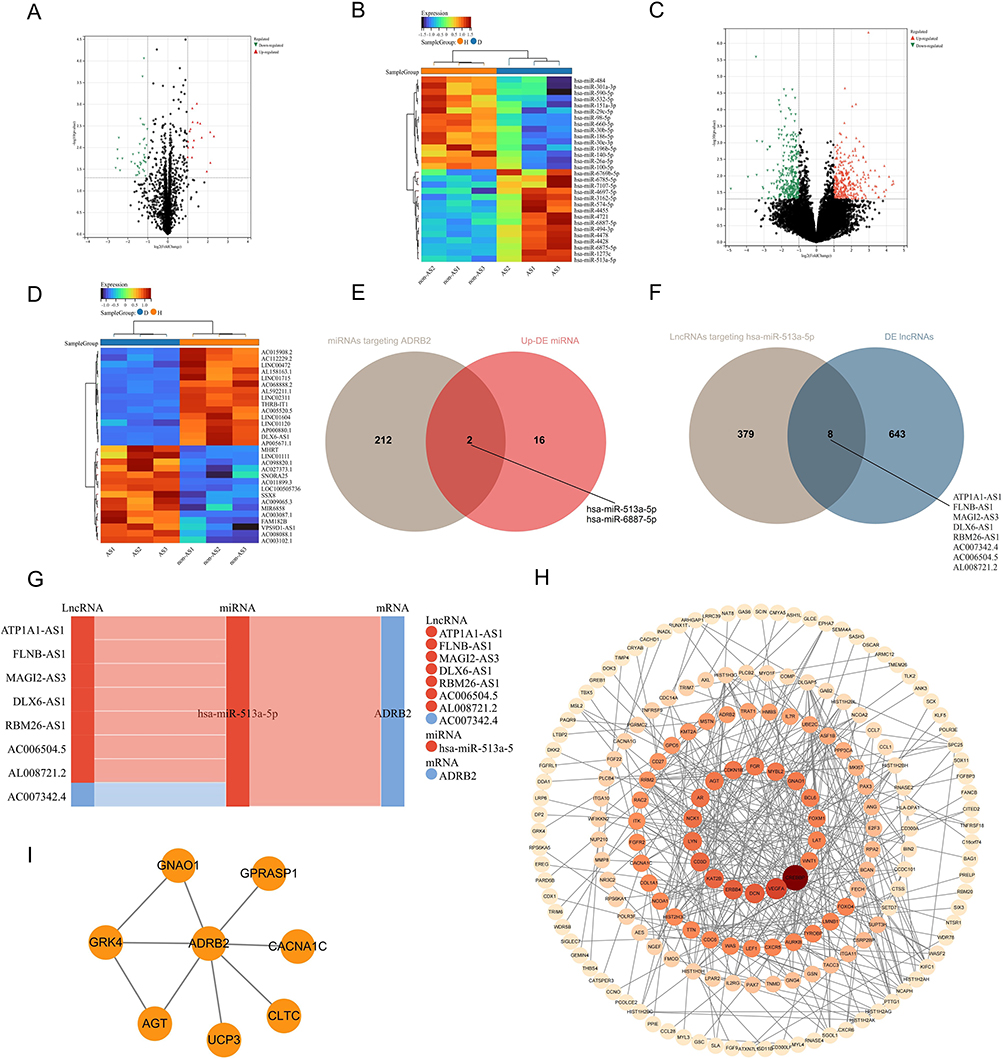 |
Figure 11 The ceRNA network of ADRB2: (A and B) Volcano plot and heatmap of DE miRNAs in ISL samples of AS-KD patients. (C and D) Volcano plot and heatmap of DE lncRNAs in ISL samples of AS-KD patients. (E) Venn diagram of upregulated DE miRNAs with miRNAs targeting ADRB2. (F) Venn diagram of DE lncRNA with lncRNAs targeting hsa-miR-513a-5p. (G) The ceRNA interaction network of ADRB2 (red: upregulated in AS-KD; blue: downregulated in AS-KD). (H) PPI network of ADRB2 in ISL. (I) PPI network of DE mRNAs in ISL. |
Immunohistochemistry (IHC) of ADRB2
To verify the protein expression level of ADRB2 in ISL, immunohistochemistry (IHC) experiments were conducted. The results showed that the specific expression of ADRB2 was significantly lower in the AS-KD group compared to the control group (Figure 12A and B). The positive expression rate of ADRB2 was found to be 11.37% in the AS-KD group and 35.09% in the control group, with a p-value less than 0.001 (Figure 12C). These findings confirm the accuracy of our analysis in identifying the differential expression of ADRB2 between the AS-KD and control groups.
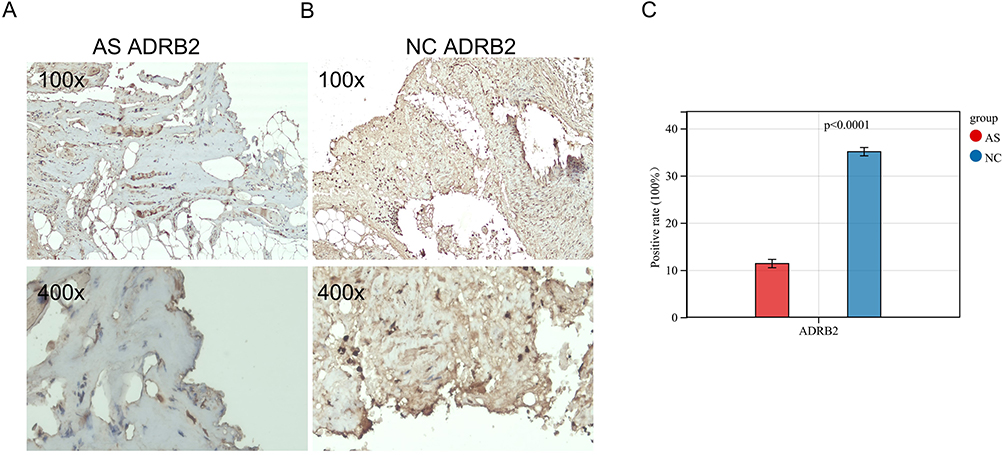 |
Figure 12 Immunohistochemistry of ADRB2 in ISL: (A and B) The expression of ADRB2 in ISL. (C) The data visualization of ADRB2 positivity rate results (AS: AS-KD group, NC: control group). |
Discussion
Recent advances in immunological techniques have greatly improved our understanding of the role played by different cell populations, as well as the innate and acquired immune systems, in the development of diseases.30 In the specific case of AS, abnormal immune cells and cytokines have been found in patients, which strongly suggests that immune factors play a major role in its pathogenesis.31 Therefore, in this study, we aimed to investigate the pathogenesis of AS from both the perspectives of the ISL and PB samples, identifying common components between them, and analyzing the immune microenvironment in order to identify new targets for AS.
In our study, we screened ISL samples for 76 DEIRGs, and KEGG analysis revealed their involvement in pathways related to osteoclast differentiation, TGF-β signaling, and chemokine signaling. On the other hand, PB samples were screened for 26 DEIRGs, and KEGG analysis showed their involvement in pathways related to osteoclast differentiation, natural killer cell-mediated cytotoxicity, and Th17 cell differentiation. In both ISL and PB samples, most of the KEGG-enriched pathways were associated with inflammation and immunity, which is consistent with previous studies on AS.32 Previous research has shown that chondrocyte differentiation occurs in the ligaments of early AS patients, with calcification occurring after cartilage formation. Furthermore, a large number of giant osteoclasts have been found in the inflammatory environment of ligaments and on the bone surface of calcified cartilage. The activity of these osteoclasts produces higher levels of TGF-β, which in turn induces new bone formation in the ligament.33 Interestingly, our findings suggest that some DEIRGs in the ISL of AS-KD patients may significantly regulate osteoclast production, leading to increased levels of TGF-β and subsequent cartilage calcification, spinal fusion, and deformity.
In this study, 1902 IRGs, 787 DE mRNAs from ISL and 155 DE mRNAs from PB were analyzed to identify immune-related key genes: ADRB2. ADRB2, which encodes a beta-2 adrenergic receptor that mediates catecholamine-induced activation of adenylate cyclase via G proteins, was found to be significantly downregulated in the ISL and PB of AS patients. Previous studies have suggested that ADRB2 may be associated with bronchial asthma,34 osteoarthritis,35 rheumatoid arthritis,36 and cancer,37 but its effect on AS remains unclear. Our results showed that ADRB2 was involved in multiple KEGG pathways, including cAMP signaling, cGMP-PKG signaling and calcium signaling. Cyclic adenosine monophosphate (cAMP) was discovered in 1958 as the first identified second messenger for intracellular or extracellular ligand action.38 In the immune system, cAMP plays a crucial role in regulating both pro-inflammatory and anti-inflammatory activities. Drugs that increase intracellular cAMP levels have been shown to decrease pro-inflammatory mediators while increasing anti-inflammatory factors.39 The downregulation of ADRB2 may lead to decreased activation of the cAMP signaling pathway, ultimately leading to a decrease in intracellular cAMP levels. This decrease in cAMP levels could contribute to an increase in pro-inflammatory substances released from immune cells and may ultimately exacerbate the progression of inflammation in patients with AS. Inflammatory stimulation induces activation of the NO/cGMP/PKG-I signaling pathway in the spinal cord, which promotes the phosphorylation of mitogenic proteins and contributes to inflammatory pain.40 Prior studies have shown that activation of the peripheral or local NO/cGMP/PKG-I signaling pathway can help alleviate inflammatory pain.41 Our findings suggested that the cGMP-PKG pathway may serve as a potential therapeutic mechanism for treating AS-associated inflammatory pain. Calcium signaling is essential for the development and function of all T-cell lineage cells, and calcium-regulating neurophosphatase inhibitors, such as cyclosporine and tacrolimus, are currently used to treat autoimmune diseases.41–44 ADRB2 may regulate T-cell activity through this pathway and potentially affect AS. Overall, our study provides new insights into the potential mechanisms underlying the development and progression of AS, and highlights the importance of ADRB2 in modulating several critical signaling pathways involved in AS pathology, which may represent a novel therapeutic target for AS.
Another important genetic factor in the pathogenesis of AS is the non-major histocompatibility complex (non-MHC), which plays a regulatory role in the activation and differentiation of CD4+ or CD8+ T cells.45,46 Our analysis of immune infiltration levels in PB samples revealed that activated naive CD4+ T cells and M0 macrophages were significantly more abundant in AS patients, and their levels were negatively correlated with ADRB2 expression. Conversely, the infiltration levels of CD8+ T cells and NK cells were significantly reduced, and their levels were positively correlated with ADRB2 expression. These results suggested that ADRB2 may plays a key role in regulating immune cells in AS. Immune cells express adrenergic receptors, which allow the sympathetic nervous system (SNS) to directly regulate immune function.47 It has been reported that ADRB2 signaling in immune cells can attenuate the severity of autoimmune diseases,48–50 indicating that low expression of ADRB2 in AS patients may contribute to disease exacerbation. In an experimental autoimmune encephalomyelitis (EAE) model of multiple sclerosis (MS), cAMP early blockers (ICER) were induced to inhibit IL-2, IFN-gamma and GM-CSF production via the ADRB2 pathway, thereby limiting T-cell autoimmune responses in EAE. Deficiency of ADRB2 signalling in immune cells leads to an increase in pathogenic T cells and the progression of EAE.49 These studies further suggest that ADRB2 deficiency may influence the infiltration levels of CD4+ T cells and CD8+ T cells. Saligrama et al reported in Nature that clonally expanded CD8+ T cells can suppress specific CD4+ T cells,51 which may help explain why CD8+ T cells exhibit a low infiltration level and CD4+ T cells exhibit a high infiltration level in our study. Moreover, interleukins produced by immune cells, such as interleukin-4 (IL-4) and interleukin-10 (IL-10), play different roles in AS. IL-4 is pro-inflammatory,52 whereas IL-10 has potent immunosuppressive and anti-inflammatory functions.53 Previous studies have found a higher proportion of IL4+CD8+ T cells and a lower proportion of IL10+CD8+ T cells in peripheral blood mononuclear cells of AS patients.54,55 Further studies have shown that norepinephrine can induce immune cells to secrete IL-10 by acting on ADRB2 receptors located on immune cells.47 Thus, the low expression of ADRB2 in AS patients may lead to reduced IL-10 secretion by immune cells. This suggests that the poorly infiltrating type of CD8+ T cells in AS patients are mainly IL-10+CD8+ T cells.
Contactin-1 (Cntn1), a neuronal cell surface adhesion/recognition molecule, has been linked to reduced intestinal ADRB2 levels. The loss of ADRB2 can directly impair intestinal function and disrupt the balance of immunity.56 Previous studies have suggested that impaired bowel function may be a mechanism of AS.2 These findings suggest a potential connection between ADRB2 and AS, and indicate that the gut might be a future focus of research for further exploring this link.
Hsa-miR-513a-5p may be involved in various biological processes by binding to the 3’ untranslated region (UTR) of ADRB2.57 In AS-KD patients, the upregulation of hsa-miR-513a-5p in the ISL may lead to the silencing of ADRB2. The DE lncRNAs (DLX6-AS1, AL008721.2, RBM26-AS1, AC006504.5, ATP1A1-AS1, MAGI2-AS3, FLNB-AS1, AC007342.4) identified in this study may act as “sponges”, competing with hsa-miR-513a-5p for binding sites, degrading the miRNA, and releasing ADRB2 from miRNA-mediated inhibition.58 Recent studies have shown that miR-15a-5p directly targets ADRB2 and inhibits IL-3-induced inflammatory responses in the nasal epithelium.59 The ceRNA network of ADRB2 may help discover more comprehensive regulatory mechanisms and refine new therapeutic strategies. The PPI network results showed that ADRB2 interacts with angiotensinogen (AGT) and uncoupling protein 3 (UCP3). AGT promotes IL-6-induced inflammatory responses in osteoarthritis through the JAK2/STAT3 pathway,60 suggesting its possible association with inflammation in AS-KD. UCP3 regulates the differentiation of immune cells and is a potential therapeutic target for the treatment of Th17 cell-mediated autoimmune diseases.61 These interacting proteins further reveal ADRB2’s role in the development of AS-KD.
We constructed predictive models for AS, and our findings suggested that ADRB2, IL2RB, and CD81 have good predictive ability with ROC values of 0.75 or more. The reappearance of ADRB2 further highlights its importance in the development of AS. Interestingly, all three genes had a risk score of less than 1 and were downregulated in AS, indicating their potential role as protective factors. IL2RB has been previously identified as one of the key genes involved in AS,62 and our study supports this finding. We also observed a significant positive association between IL2RB and resting NK cells,63 providing further evidence of its relevance to AS. Cluster of differentiation 81 (CD81), a widely expressed cell surface protein, has been shown to affect the proliferation and differentiation of B and T cells.64
In neoplastic diseases, clustering algorithms are often used to identify different molecular subtypes that help explain the heterogeneity of the disease.65 Not all AS patients progress to kyphotic deformity, to further investigate the pathogenesis of AS-KD, we utilized unsupervised clustering to identify two AS immune patterns labeled as C1 and C2. Our analyses revealed the T-cell receptor signaling pathway to be involved in both the C1 and ADRB2 high-expression groups, as determined by GSEA and KEGG analyses as well as ADRB2 GSEA analysis. The gene set related to this pathway had ES values of 0.4969 and 0.4410 in the C1 and ADRB2 high-expression groups, respectively, indicating that ADRB2 may have an impact on key genes within this pathway, resulting in its activation in both groups. The T cell receptor (TCR) complexes play a crucial role in mediating the activation of T cells, which is essential for maintaining normal T cell homeostasis and immune response. The strength of TCR signaling determines the differentiation of T cells into various effector cell lines.66 Previous studies have demonstrated that the T cell receptor signaling pathway is critical in the development of AS.67 Abnormal activation of neutrophils at the site of disease predilection has been shown to be associated with AS.56 Our findings revealed an intriguing observation that the C1 group displayed a markedly decreased level of neutrophil infiltration compared to the C2 group. Furthermore, the C1 group showed a high expression of various protective genes, including ADRB2 and CD81. These results indicate that protective genes may play a crucial role in regulating neutrophils and potentially reducing the severity of AS.
To sum up, our study revealed that the ADRB2 gene might be implicated in the pathogenesis of AS-KD through the regulation of immune cells. However, there are some limitations to our research that need to be addressed. Firstly, further experiments are required to validate some of the findings. Secondly, the molecular mechanisms underlying the interactions between key IRGs need to be further elucidated in both in vitro and in vivo models. Moreover, we plan to conduct additional investigations in the future to address these limitations and expand our understanding of the role of IRGs in the development of AS-KD.
Conclusion
This study employed high-throughput sequencing and bioinformatics methodologies to unravel the intricate pathogenesis of AS-KD at various levels, delving into the role of DEIRGs through functional enrichment and immune infiltration analyses. The application of the LASSO algorithm led to the identification of 12 promising biomarkers, enabling the construction of a robust disease diagnostic model for AS and two immune models. Furthermore, the exploration of the ADRB2-AS-KD relationship through a constructed ceRNA network expanded our understanding. The collective insights garnered from this study could pave the way for potential future treatments for AS-KD, offering a comprehensive perspective on the disease’s underlying mechanisms.
Data Sharing Statement
All data that support the findings of this study are included in this manuscript and its Supplementary Information Files. Further enquiries can be directed to the corresponding author.
Institutional Review Board Statement
The study was carried out in accordance with the Declaration of Helsinki statement. The present study was approved by the Ethics Committee of Guangxi Medical University Cancer Hospital. The need for written informed consent was waived by Guangxi Medical University Cancer Hospital Ethical Review Committee due to the retrospective nature of the study. Written informed consent was not obtained from the individual(s) for the publication of any potentially identifiable images or data included in this article.
Acknowledgments
We thank all the patients who participated in this study. We thank all reviewers for their time and thoughtful critiques to refine our manuscript. Additionally, we would like to extend our appreciation to the research teams who have made the gene sets readily available in the NCBI GEO database (https://www.ncbi.nlm.nih.gov/geo/).
Author Contributions
All authors made a significant contribution to the work reported, whether that is in the conception, study design, execution, acquisition of data, analysis and interpretation, or in all these areas; took part in drafting, revising or critically reviewing the article; gave final approval of the version to be published; have agreed on the journal to which the article has been submitted; and agree to be accountable for all aspects of the work.
Funding
This research was supported by Guangxi Natural Science Foundation (No. 2023GXNSFBA026238), Guangxi Postdoctoral Special Foundation Project and Guangxi Zhuang Autonomous Region Health Commission Self-funded Research Project (No. Z-A20230715).
Disclosure
All authors declare that the research was conducted in the absence of any commercial or financial relationships that could be construed as a potential conflict of interest.
References
1. Raychaudhuri SP, Deodhar A. The classification and diagnostic criteria of ankylosing spondylitis. J Autoimmun. 2014;48–49:128–133. doi:10.1016/j.jaut.2014.01.015
2. Mauro D, Thomas R, Guggino G, Lories R, Brown MA, Ciccia F. Ankylosing spondylitis: an autoimmune or autoinflammatory disease? Nat Rev Rheumatol. 2021;17(7):387–404. doi:10.1038/s41584-021-00625-y
3. Sieper J, Poddubnyy D. Axial spondyloarthritis. Lancet. 2017;390(10089):73–84. doi:10.1016/S0140-6736(16)31591-4
4. Dean LE, Jones GT, MacDonald AG, Downham C, Sturrock RD, Macfarlane GJ. Global prevalence of ankylosing spondylitis. Rheumatology. 2014;53(4):650–657. doi:10.1093/rheumatology/ket387
5. Braun J, Sieper J. Ankylosing spondylitis. Lancet. 2007;369(9570):1379–1390. doi:10.1016/S0140-6736(07)60635-7
6. de Blecourt J, Polman A, de Blecourt-Meindersma T, et al. Hereditary factors in rheumatoid arthritis and ankylosing spondylitis. Ann Rheum Dis. 1961;20(3):215–220. doi:10.1136/ard.20.3.215
7. Reveille JD. The genetic basis of spondyloarthritis. Ann Rheum Dis. 2011;70(Suppl 1):i44–i50. doi:10.1136/ard.2010.140574
8. Brown MA. Genetics of ankylosing spondylitis. Curr Opin Rheumatol. 2010;22(2):126–132. doi:10.1097/BOR.0b013e3283364483
9. Breban M, Said-Nahal R, Hugot JP, Miceli-Richard C. Familial and genetic aspects of spondyloarthropathy. Rheum Dis Clin North Am. 2003;29(3):575–594. doi:10.1016/s0889-857x(03)00029-2
10. Wendling D, Cedoz JP, Racadot E, Dumoulin G. Serum IL-17, BMP-7, and bone turnover markers in patients with ankylosing spondylitis. Joint Bone Spine. 2007;74(3):304–305. doi:10.1016/j.jbspin.2006.11.005
11. Mei Y, Pan F, Gao J, et al. Increased serum IL-17 and IL-23 in the patient with ankylosing spondylitis. Clin Rheumatol. 2011;30(2):269–273. doi:10.1007/s10067-010-1647-4
12. Quaden DH, De Winter LM, Somers V. Detection of novel diagnostic antibodies in ankylosing spondylitis: an overview. Autoimmun Rev. 2016;15(8):820–832. doi:10.1016/j.autrev.2016.06.001
13. Watad A, Bridgewood C, Russell T, Marzo-Ortega H, Cuthbert R, McGonagle D. The early phases of ankylosing spondylitis: emerging insights from clinical and basic science. Front Immunol. 2018;9:2668. doi:10.3389/fimmu.2018.02668
14. Gravallese EM, Schett G. Effects of the IL-23-IL-17 pathway on bone in spondyloarthritis. Nat Rev Rheumatol. 2018;14(11):631–640. doi:10.1038/s41584-018-0091-8
15. Xie Z, Yu W, Zheng G, et al. TNF-α-mediated m6A modification of ELMO1 triggers directional migration of mesenchymal stem cell in ankylosing spondylitis. Nat Commun. 2021;12(1):5373. doi:10.1038/s41467-021-25710-4
16. Smith JA. Update on ankylosing spondylitis: current concepts in pathogenesis. Curr Allergy Asthma Rep. 2015;15(1):489. doi:10.1007/s11882-014-0489-6
17. Voruganti A, Bowness P. New developments in our understanding of ankylosing spondylitis pathogenesis. Immunology. 2020;161(2):94–102. doi:10.1111/imm.13242
18. Ranganathan V, Gracey E, Brown MA, Inman RD, Haroon N. Pathogenesis of ankylosing spondylitis - recent advances and future directions. Nat Rev Rheumatol. 2017;13(6):359–367. doi:10.1038/nrrheum.2017.56
19. Maksymowych WP. Biomarkers for diagnosis of axial spondyloarthritis, disease activity, prognosis, and prediction of response to therapy. Front Immunol. 2019;10:305. doi:10.3389/fimmu.2019.00305
20. Orlov YL, Anashkina AA, Klimontov VV, Baranova AV. Medical genetics, genomics and bioinformatics aid in understanding molecular mechanisms of human diseases. Int J Mol Sci. 2021;22(18):9962. doi:10.3390/ijms22189962
21. Taminau J, Meganck S, Lazar C, et al. Unlocking the potential of publicly available microarray data using inSilicoDb and inSilicoMerging R/bioconductor packages. BMC Bioinform. 2012;13:335. doi:10.1186/1471-2105-13-3358
22. Johnson WE, Li C, Rabinovic A. Adjusting batch effects in microarray expression data using empirical Bayes methods. Biostatistics. 2007;8(1):118–127. doi:10.1093/biostatistics/kxj037
23. Ritchie ME, Phipson B, Wu D, et al. limma powers differential expression analyses for RNA-sequencing and microarray studies. Nucleic Acids Res. 2015;43(7):e47. doi:10.1093/nar/gkv007
24. Kanehisa M, Goto S. KEGG: Kyoto Encyclopedia of Genes and Genomes. Nucleic Acids Res. 2000;28(1):27–30. doi:10.1093/nar/28.1.27
25. Zeng D, Ye Z, Shen R, et al. IOBR: multi-omics immuno-oncology biological research to decode tumor microenvironment and signatures. Front Immunol. 2021;12:687975. doi:10.3389/fimmu.2021.687975
26. Newman AM, Liu CL, Green MR, et al. Robust enumeration of cell subsets from tissue expression profiles. Nat Methods. 2015;12(5):453–457. doi:10.1038/nmeth.33377
27. Wilkerson MD, Hayes DN. ConsensusClusterPlus: a class discovery tool with confidence assessments and item tracking. Bioinformatics. 2010;26(12):1572–1573. doi:10.1093/bioinformatics/btq170
28. Agarwal V, Bell GW, Nam JW, Bartel DP. Predicting effective microRNA target sites in mammalian mRNAs. Elife. 2015;4:e05005. doi:10.7554/eLife.05005
29. Li JH, Liu S, Zhou H, Qu LH, Yang JH. starBase v2.0: decoding miRNA-ceRNA, miRNA-ncRNA and protein-RNA interaction networks from large-scale CLIP-Seq data. Nucleic Acids Res. 2014;42(Database issue):D92–D97. doi:10.1093/nar/gkt1248
30. Lories RJ. Advances in understanding the pathophysiology of spondyloarthritis. Best Pract Res Clin Rheumatol. 2018;32(3):331–341. doi:10.1016/j.berh.2018.12.001
31. Zhu W, He X, Cheng K, et al. Ankylosing spondylitis: etiology, pathogenesis, and treatments. Bone Res. 2019;7:22. doi:10.1038/s41413-019-0057-8
32. Pedersen SJ, Maksymowych WP. The pathogenesis of ankylosing spondylitis: an update. Curr Rheumatol Rep. 2019;21(10):58. doi:10.1007/s11926-019-0856-3
33. Yu T, Zhang J, Zhu W, et al. Chondrogenesis mediates progression of ankylosing spondylitis through heterotopic ossification. Bone Res. 2021;9(1):19. doi:10.1038/s41413-021-00140-6
34. Ortega VE, Hawkins GA, Moore WC, et al. Effect of rare variants in ADRB2 on risk of severe exacerbations and symptom control during longacting β agonist treatment in a multiethnic asthma population: a genetic study. Lancet Respir Med. 2014;2(3):204–213. doi:10.1016/S2213-2600(13)70289-3
35. Rösch G, Muschter D, Taheri S, et al. β2-adrenoceptor deficiency results in increased calcified cartilage thickness and subchondral bone remodeling in murine experimental osteoarthritis. Front Immunol. 2022;12:801505. doi:10.3389/fimmu.2021.801505
36. Bellinger DL, Wood C, Wergedal JE, Lorton D. Driving β2- while suppressing α-adrenergic receptor activity suppresses joint pathology in inflammatory arthritis. Front Immunol. 2021;12:628065. doi:10.3389/fimmu.2021.628065
37. Ji L, Xu F, Zhang J, et al. ADRB2 expression predicts the clinical outcomes and is associated with immune cells infiltration in lung adenocarcinoma. Sci Rep. 2022;12(1):15994. doi:10.1038/s41598-022-19991-y
38. Sutherland EW, Rall TW. Fractionation and characterization of a cyclic adenine ribonucleotide formed by tissue particles. J Biol Chem. 1958;232(2):1077–1091. doi:10.1016/S0021-9258(19)77423-7
39. Raker VK, Becker C, Steinbrink K. The cAMP pathway as therapeutic target in autoimmune and inflammatory diseases. Front Immunol. 2016;7:123. doi:10.3389/fimmu.2016.00123
40. Wang F, Ma SB, Tian ZC, et al. Nociceptor-localized cGMP-dependent protein kinase I is a critical generator for central sensitization and neuropathic pain. Pain. 2021;162(1):135–151. doi:10.1097/j.pain.0000000000002013
41. Negrete R, Hervera A, Leánez S, Martín-Campos JM, Pol O, Calixto JB. The antinociceptive effects of JWH-015 in chronic inflammatory pain are produced by nitric oxide-cGMP-PKG-KATP pathway activation mediated by opioids. PLoS One. 2011;6(10):e26688. doi:10.1371/journal.pone.0026688
42. Park YJ, Yoo SA, Kim M, Kim WU. The role of calcium-calcineurin-NFAT signaling pathway in health and autoimmune diseases. Front Immunol. 2020;11:195. doi:10.3389/fimmu.2020.00195
43. Feske S. Calcium signalling in lymphocyte activation and disease. Nat Rev Immunol. 2007;7(9):690–702. doi:10.1038/nri2152
44. Oh-hora M. Calcium signaling in the development and function of T-lineage cells. Immunol Rev. 2009;231(1):210–224. doi:10.1111/j.1600-065X.2009.00819.x
45. Cortes A, Hadler J; International Genetics of Ankylosing Spondylitis Consortium (IGAS). Identification of multiple risk variants for ankylosing spondylitis through high-density genotyping of immune-related loci. Nat Genet. 2013;45(7):730–738. doi:10.1038/ng.2667
46. Reveille JD, Sims AM; Australo-Anglo-American Spondyloarthritis Consortium (TASC). Genome-wide association study of ankylosing spondylitis identifies non-MHC susceptibility loci. Nat Genet. 2010;42(2):123–127. doi:10.1038/ng.513
47. Ağaç D, Estrada LD, Maples R, Hooper LV, Farrar JD. The β2-adrenergic receptor controls inflammation by driving rapid IL-10 secretion. Brain Behav Immun. 2018;74:176–185. doi:10.1016/j.bbi.2018.09.004
48. Slota C, Shi A, Chen G, Bevans M, Weng NP. Norepinephrine preferentially modulates memory CD8 T cell function inducing inflammatory cytokine production and reducing proliferation in response to activation. Brain Behav Immun. 2015;46:168–179. doi:10.1016/j.bbi.2015.01.015
49. Mohammadpour H, MacDonald CR, Qiao G, et al. β2 adrenergic receptor-mediated signaling regulates the immunosuppressive potential of myeloid-derived suppressor cells. J Clin Invest. 2019;129(12):5537–5552. doi:10.1172/JCI129502
50. Araujo LP, Maricato JT, Guereschi MG, et al. The sympathetic nervous system mitigates CNS autoimmunity via β2-adrenergic receptor signaling in immune cells. Cell Rep. 2019;28(12):3120–3130.e5. doi:10.1016/j.celrep.2019.08.042
51. Saligrama N, Zhao F, Sikora MJ, et al. Opposing T cell responses in experimental autoimmune encephalomyelitis. Nature. 2019;572(7770):481–487. doi:10.1038/s41586-019-1467-x
52. Junttila IS. Tuning the cytokine responses: an update on Interleukin (IL)-4 and IL-13 receptor complexes. Front Immunol. 2018;9:888. doi:10.3389/fimmu.2018.00888
53. Wang X, Wong K, Ouyang W, Rutz S. Targeting IL-10 family cytokines for the treatment of human diseases. Cold Spring Harb Perspect Biol. 2019;11(2):a028548. doi:10.1101/cshperspect.a028548
54. Zhang L, Jarvis LB, Baek HJ, Gaston JS. Regulatory IL4+CD8+ T cells in patients with ankylosing spondylitis and healthy controls. Ann Rheum Dis. 2009;68(8):1345–1351. doi:10.1136/ard.2008.088120
55. Poddubnyy DA, Märker-Hermann E, Kaluza-Schilling W, et al. Relation of HLA-B27, tumor necrosis factor-α promoter gene polymorphisms, and T cell cytokine production in ankylosing spondylitis – a comprehensive genotype-phenotype analysis from an observational cohort. J Rheumatol. 2011;38(11):2436–2441. doi:10.3899/jrheum.110130
56. Veny M, Grases D, Kucharova K, et al. Contactin-1 is required for peripheral innervation and immune homeostasis within the intestinal mucosa. Front Immunol. 2020;11:1268. doi:10.3389/fimmu.2020.01268
57. Tay Y, Rinn J, Pandolfi PP. The multilayered complexity of ceRNA crosstalk and competition. Nature. 2014;505(7483):344–352. doi:10.1038/nature12986
58. Salmena L, Poliseno L, Tay Y, Kats L, Pandolfi PP. A ceRNA hypothesis: the Rosetta stone of a hidden RNA language? Cell. 2011;146(3):353–358. doi:10.1016/j.cell.2011.07.014
59. Wang L, Lv Q, Song X, Jiang K, Zhang J. ADRB2 suppresses IL-13-induced allergic rhinitis inflammatory cytokine regulated by miR-15a-5p. Hum Cell. 2019;32(3):306–315. doi:10.1007/s13577-019-00259-z
60. Wang W, Han X, Zhao T, Zhang X, Qu P, Zhao H. AGT, targeted by miR-149-5p, promotes IL-6-induced inflammatory responses of chondrocytes in osteoarthritis via activating JAK2/STAT3 pathway. Clin Exp Rheumatol. 2020;38(6):1088–1095.
61. O’Connor EB, Muñoz-Wolf N, Leon G, et al. UCP3 reciprocally controls CD4+ Th17 and Treg cell differentiation. PLoS One. 2020;15(11):e0239713. doi:10.1371/journal.pone.0239713
62. Zheng Y, Cai B, Ren C, et al. Identification of immune related cells and crucial genes in the peripheral blood of ankylosing spondylitis by integrated bioinformatics analysis. PeerJ. 2021;9:e12125. doi:10.7717/peerj.12125
63. Wen J, Wan L, Dong X. Novel peripheral blood diagnostic biomarkers screened by machine learning algorithms in ankylosing spondylitis. Front Genet. 2022;13:1032010. doi:10.3389/fgene.2022.1032010
64. Levy S, Todd SC, Maecker HT. CD81 (TAPA-1): a molecule involved in signal transduction and cell adhesion in the immune system. Annu Rev Immunol. 1998;16(1):89–109. doi:10.1146/annurev.immunol.16.1.89
65. Hu X, Wang Z, Wang Q, et al. Molecular classification reveals the diverse genetic and prognostic features of gastric cancer: a multi-omics consensus ensemble clustering. Biomed Pharmacother. 2021;144:112222. doi:10.1016/j.biopha.2021.112222
66. Hwang JR, Byeon Y, Kim D, Park SG. Recent insights of T cell receptor-mediated signaling pathways for T cell activation and development. Exp Mol Med. 2020;52(5):750–761. doi:10.1038/s12276-020-0435-8
67. Wu F, Yang H, Xu X, et al. CD96 downregulation promotes the immune response of CD4 T cells and associates with ankylosing spondylitis. Biomed Res Int. 2022;2022:3946754. doi:10.1155/2022/3946754
 © 2023 The Author(s). This work is published and licensed by Dove Medical Press Limited. The full terms of this license are available at https://www.dovepress.com/terms.php and incorporate the Creative Commons Attribution - Non Commercial (unported, v3.0) License.
By accessing the work you hereby accept the Terms. Non-commercial uses of the work are permitted without any further permission from Dove Medical Press Limited, provided the work is properly attributed. For permission for commercial use of this work, please see paragraphs 4.2 and 5 of our Terms.
© 2023 The Author(s). This work is published and licensed by Dove Medical Press Limited. The full terms of this license are available at https://www.dovepress.com/terms.php and incorporate the Creative Commons Attribution - Non Commercial (unported, v3.0) License.
By accessing the work you hereby accept the Terms. Non-commercial uses of the work are permitted without any further permission from Dove Medical Press Limited, provided the work is properly attributed. For permission for commercial use of this work, please see paragraphs 4.2 and 5 of our Terms.