Back to Journals » Journal of Hepatocellular Carcinoma » Volume 8
An Exploratory Study for the Association of Gut Microbiome with Efficacy of Immune Checkpoint Inhibitor in Patients with Hepatocellular Carcinoma
Authors Shen YC, Lee PC ![]() , Kuo YL, Wu WK
, Kuo YL, Wu WK ![]() , Chen CC, Lei CH, Yeh CP, Hsu C, Hsu CH, Lin ZZ, Shao YY
, Chen CC, Lei CH, Yeh CP, Hsu C, Hsu CH, Lin ZZ, Shao YY ![]() , Lu LC
, Lu LC ![]() , Liu TH
, Liu TH ![]() , Chen CH, Wu MS, Huang YH, Cheng AL
, Chen CH, Wu MS, Huang YH, Cheng AL
Received 20 April 2021
Accepted for publication 2 June 2021
Published 24 July 2021 Volume 2021:8 Pages 809—822
DOI https://doi.org/10.2147/JHC.S315696
Checked for plagiarism Yes
Review by Single anonymous peer review
Peer reviewer comments 2
Editor who approved publication: Dr Ahmed Kaseb
Ying-Chun Shen,1,2,* Pei-Chang Lee,3,4,* Yu-Lun Kuo,5 Wei-Kai Wu,6 Chieh-Chang Chen,7 Chengh-Hau Lei,7 Ching-Ping Yeh,8 Chiun Hsu,1,2 Chih-Hung Hsu,2,8 Zhong-Zhe Lin,1,8 Yu-Yun Shao,2,8 Li-Chun Lu,2,8 Tsung-Hao Liu,2,8 Chien-Hung Chen,7,9 Ming-Shiang Wu,7,10 Yi-Hsiang Huang,4,11,* Ann-Lii Cheng1,10,*
1Department of Medical Oncology, National Taiwan University Cancer Center, Taipei, Taiwan; 2Graduate Institute of Oncology, College of Medicine, National Taiwan University, Taipei, Taiwan; 3Institute of Pharmacology, National Yang-Ming University School of Medicine, Taipei, Taiwan; 4Division of Gastroenterology and Hepatology, Department of Medicine, Taipei Veterans General Hospital, Taipei, Taiwan; 5Biotools Co., Ltd, New Taipei City, Taiwan; 6Department of Medical Research, National Taiwan University Hospital, Taipei, Taiwan; 7Department of Internal Medicine, National Taiwan University Hospital, Taipei, Taiwan; 8Department of Oncology, National Taiwan University Hospital, Taipei, Taiwan; 9Department of Internal Medicine, National Taiwan University Hospital Yunlin Branch, Taipei, Taiwan; 10Department of Internal Medicine, College of Medicine, National Taiwan University, Taipei, Taiwan; 11Institute of Clinical Medicine, National Yang-Ming University School of Medicine, Taipei, Taiwan
*These authors contributed equally to this work
Correspondence: Ann-Lii Cheng
National Taiwan University Cancer Center, No. 57, Ln. 155, Sec. 3, Keelung Road, Da-an Dist., Taipei City, 106, Taiwan
Email [email protected]
Yi-Hsiang Huang
Department of Internal Medicine, Taipei Veterans General Hospital, Taipei, Taiwan
Email [email protected]
Background: Gut microbiome has been associated with the efficacy of immune checkpoint inhibitors (ICI) in patients with various types of cancers but not yet in hepatocellular carcinoma (HCC).
Aims: To investigate the association between gut microbiome and efficacy of ICI in patients with HCC.
Methods: Patients with HCC who were scheduled to receive ICI were prospectively enrolled. Fecal samples were collected within 7 days before initiation of ICI (baseline) and 8 weeks later. Gut microbiome was assessed using 16S rRNA sequencing and shotgun whole-genome sequencing and correlated with objective response (complete or partial response), disease control (objective response or stable disease for ≥ 16 weeks), and overall survival.
Results: Thirty-six patients with HCC were enrolled, and 20 of them provided both baseline and 8-week feces. Alpha diversity, richness, and compositions of baseline gut microbiome indicated no difference between responders and nonresponders or between disease control and nondisease control groups. For the 20 paired feces, immunotherapy did not change any of the major microbiome features. No specific taxa were enriched in patients with objective response. Three taxa—Bifidobacterium, Coprococcus, and Acidaminococcus—were enriched in patients with disease control. However, the baseline abundance of these three taxa did not predict overall survival benefit.
Conclusions: In this exploratory study, we failed to disclose any overt association of gut microbiome with the efficacy of ICI in patients with HCC. A larger prospective study is warranted for definite conclusion.
Keywords: gut microbiome, biomarkers, immune checkpoint inhibitor, hepatocellular carcinoma
Introduction
Immune checkpoint inhibitors (ICIs) are being widely used in the treatment of advanced hepatocellular carcinoma (HCC). The US Food and Drug Administration has approved ICI monotherapy,1,2 ICI combination therapy,3 and ICI plus an anti–vascular endothelial growth factor antibody4–6 for HCC. Although some biomarkers, such as programmed cell death (PD) ligand-1 (PD-L1) expression, tumor mutation burden, and microenvironmental immune cells, have been linked to the efficacy of ICI in HCC,2,7 a decisive biomarker that can help in clinical decision-making remains elusive.
Differential baseline gut microbiome profiles between responders and nonresponders have been reported in patients with melanoma, non–small-cell lung cancer, and renal cell carcinoma receiving ICIs.8–17 Fecal microbiota transplantation (FMT) with human responders’ feces augmented the antitumor activity of ICI in tumor-bearing germ-free mice, whereas FMT with nonresponders’ feces attenuated it.8–10 Thus, baseline gut microbiota may modulate response to ICI and serve as a predictor for efficacy of ICI in cancer patients.
The current study explored the association between gut microbiome defined through both 16S rRNA and shotgun whole-genome sequencing and efficacy of ICI in patients with advanced HCC.
Materials and Methods
Patients
Patients with advanced HCC scheduled to receive either anti-PD-1 or anti-PD-L1 monotherapy or in combination with an immunomodulatory agent who agreed to undergo stool collection were prospectively enrolled from National Taiwan University Hospital and Taipei Veterans General Hospital. All patients provided written informed consent. They must have Child–Pugh class A or B, Eastern Cooperative Oncology Group (ECOG) performance status 0–2, and adequate organ reserves. Feces were collected within 7 days before (baseline) and at 8 weeks (8W) after immunotherapy initiation. Radiological assessments were performed every 6–9 weeks, depending on the regimens, until a progressive disease was confirmed. The efficacy of immunotherapy in this study was evaluated as the best response throughout the treatment course per Response Evaluation Criteria in Solid Tumors (RECIST) v.1.1. “Objective response” was defined as complete or partial response, whereas “disease control” was defined as objective response or stable disease lasting ≥16 weeks. Overall survival was calculated from the date of initiation of immunotherapy to the date of death or last follow-up. This study was approved by the Research Ethics Committee of each participating hospital (National Taiwan University Hospital: 201712134RINC; Taipei Veterans General Hospital: 2017-09-007CC, 2019-07-007AC, and 2019-08-006B) and was conducted in compliance with the Declaration of Helsinki and other ethical guidelines.
Fecal Sample Storage and Processing
Fresh fecal samples were collected using HMP stool collection kits and were kept at approximately 4 °C before and during delivery to the laboratories of each participating hospital. Fecal samples were sent to the laboratories within 24–48 h after collection. On arrival at the laboratory, fecal samples were homogenized and then stored at −80 °C until analysis. DNA was extracted using PowerFecal DNA isolation kits (QIAGEN, Hilden, Germany), according to the manufacturer’s instruction.
16S v3-v4 Sequencing Library Preparation
The 16S metagenomic sequencing libraries were generated according to the manufacturer’s instruction provided by Illumina (#15044223 Rev. B). In brief, 12.5 ng of DNA was used for PCR amplification of the v3 and v4 regions of 16S rRNA gene. The PCR primers contained overhang adapter sequences, and the full-length primer sequences are as follows: 5′-TCGTCGGCAGCGTCAGATGTGTATAAGAGACAGCCTACGGGNGGCWGCAG-3′ (forward primer) and 5′-GTCTCGTGGGCTCGGAGATGTGTATAAGAGACAGGACTACHVGGGTATCTAATCC-3′ (reverse primer). PCR products with the length of approximately 550 base pairs (bp) were purified with AMPure XP beads (Beckman Coulter, USA) and subjected to a secondary PCR reaction with primers from the Nextera XT Index kit (Illumina, USA), which attached the dual indices and Illumina sequencing adapters onto the v3 and v4 regions. After PCR, the final libraries (approximately 630 bp) were purified with AMPure XP beads and subjected to next-generation sequencing.
MiSeq-Based High-Throughput Sequencing and Data Analysis
The concentrations of 16S v3-v4 sequencing libraries were determined by real-time quantitative PCR with Illumina adapter-specific primers provided by KAPA library quantification kit (KAPA Biosystems, Pleasanton, CA, USA).
Libraries were denatured and sequenced by Illumina MiSeq platform with reagent v3 for pair-end sequencing (2*300 bp).
Shotgun Whole-Genome Sequencing Library Construction
Baseline fecal samples from National Taiwan University Hospital were used for shotgun whole-genome sequencing for taxa identification at the species level. One μg of DNA per sample was used for DNA sample preparation. Sequencing libraries were generated using NEBNext Ultra DNA Library Prep Kits for Illumina (Ipswich, MA, USA), according to manufacturer’s instructions, and index codes were added to attribute sequences to each sample. In brief, the DNA sample was fragmented by sonication to a size of 350 bp; next, the DNA fragments were end-polished, A-tailed, and ligated with the full-length adaptor for Illumina sequencing with further PCR amplification. PCR products were purified (AMPure XP system), and libraries were analyzed for size distribution by Agilent 2100 Bioanalyzer (Santa Clara, CA, USA) and quantified using real-time PCR. After on-board cluster generation, the libraries were sequenced on an Illumina NovaSeq platform, and paired-end reads were generated.
Bioinformatics
16S rRNA Sequencing Data
Amplicon sequencing was performed by using 300-bp paired-end raw reads, and the entire paired-end reads were assembled using FLASH v.1.2.7.18 Demultiplexing was conducted based on barcode identification. Low-quality reads (Q < 20) were discarded in the QIIME v.1.9.1 pipeline.19 If three consecutive bases were Q < 20, the read was truncated, and the resulting read retained in the data set only if it was at least 75% of the original length using split_libraries_fastq.py script in QIIME.20 Sequences were chimera-checked using UCHIME to obtain the effective tags21,22 and filtered from the data set before operational taxonomic unit (OTU) clustering at 97% sequence identity using the UPARSE23 function in the USEARCH v.7 pipeline.24 For each representative sequence, the RDP classifier v.2.2 algorithm25 was used to annotate taxonomy classification based on the information retrieved from the SILVA Database v.13226,27 which was performed with an 80% minimum confidence threshold to record an assignment. Sequences with one-time occurrence (singletons) or present in only one sample were filtered out. To analyze the sequence similarities among different OTUs, multiple sequence alignment was conducted by using the software program PyNAST v.1.228 against the core-set dataset in the SILVA database. A phylogenetic tree was constructed with a set of sequences representative of the OTUs using the FastTree.29,30
OTU abundance information was rarefied to the minimum sequence depth using the QIIME script (single_rarefaction.py) to normalize the variations in sequence depth across samples. Subsequent analysis of alpha and beta diversities was performed using the normalized data. Alpha diversity, indicating the species complexity within individual samples, was evaluated using Shannon index (addressing abundance and evenness) and Chao1 index (addressing community richness) from the QIIME pipeline.31 Beta diversity, indicating intersample differences in species complexity, was evaluated using the weighted UniFrac,32,33 which was calculated by using the QIIME pipeline. Principal coordinate analysis (PCoA) was performed using the distance matrix method to acquire principal coordinates for the visualization of sophisticated and multidimensional data.34 A distance matrix of weighted UniFrac and Bray–Curtis dissimilarity among samples was transformed into a new set of orthogonal axes, by which the most influential variable was represented by the first principal coordinate, and the second most influential one by the second principal coordinate, and so on. PCoA was performed using the WGCNA, stat, and ggplot2 packages in R.
Shotgun Whole-Genome Sequencing Data
The original data obtained from high-throughput sequencing were transformed into raw sequenced reads by CASAVA base calling and stored in FASTQ format. The obtained raw paired-end reads were filtered by Trimmomatic v.0.3835 to discard low-quality reads, trim adaptor sequences, and eliminate poor-quality bases with the following parameters: LEADING:3 TRAILING:3 SLIDINGWINDOW:4:20 MINLEN:100 AVGQUAL:20. Resulting high-quality data (clean reads) were used for subsequent analysis. Bowtie2 v.2.3.5.136 was used to remove contaminating host sequences, with the human reference genome GRCh38 as the database. The filtered reads were de novo assembled for each sample using MEGAHIT v.1.1.3.37
Prodigal v.2.6.338 was used to predict the open reading frames from the assembled contigs with a ≥500-bp length. A nonredundant gene catalog was constructed using CD-HIT v.4.7 with 95% identity,39,40 Clean reads from each sample were mapped to the initial gene catalog using BWA v.0.7.17-r1188.41 SAMtools v.1.8 was used to create BAM files,42 and the jgi_summarize_bam_contig_depths script from the MetaBAT pipeline43 was run on all BAM files for each assembly to calculate coverage. MetaBAT2 v.2.12.1 was used to perform metagenomic binning with minimum contig length threshold of 500 bp. The genome percentage completeness and contamination of all bins were assessed using CheckM v.1.0.11.44
The obtained unigenes were used to blast the sequences for the bacterial, fungi, archaea, and viruses, which were extracted from the NCBI Refseq45 using the software program DIAMOND v.0.9.22.46 The taxonomical level of each gene was determined by using the lowest common ancestor algorithm. The abundances of each taxonomic group were calculated by adding the abundances of genes annotated to a feature.
Statistical Analyses
For analyses of 16S rRNA sequencing data, significance of all species between groups at various taxonomic levels was detected using differential abundance analysis with a zero-inflated Gaussian log-normal model as implemented in the “fitFeatureModel” function of the Bioconductor metagenomeSeq package,47 and Welch’s t test performed using the software program STAMP v.2.1.3.48
For both 16S rRNA sequencing and shotgun whole-genome sequencing data, statistically significant biomarkers between groups were identified using the Linear discriminant analysis (LDA) Effect Size (LEfSe) analysis.49 In brief, LEfSe is based on an algorithm that performs the nonparametric Kruskal–Wallis test and Wilcoxon rank-sum test to identify bacterial taxa whose relative abundance are significantly different between two groups. LEfSe applies LDA to the taxa identified as significantly different and assesses the effect size of each differentially abundant taxon. In this study, taxa with LDA score (log 10) > 3 were considered significantly different in abundance between two groups for the analysis of 16S rRNA sequencing data, and taxa with LDA score > 2.0 for the analysis of shotgun whole-genome sequencing data.
Overall, two-tailed Wilcoxon test was applied to compare alpha diversity between groups. The Mann–Whitney test was used to compare binary outcome variables, and the Spearman rank correlation test was used to compare continuous variables. Fisher’s exact test was used when proportions were compared between binary variables. The Log rank test was used to compare overall survival. The prognostic values of the baseline abundance of each taxon and other essential clinical factors were examined using a Cox regression model. All analyses were conducted in R, GraphPad Prism (GraphPad Software, La Jolla, CA, USA), and SAS (v.9.4; SAS, Cary, NC, USA).
Results
Clinical Characteristics of Patients
Thirty-six patients (31 males and 5 females) were enrolled in this study. Their baseline clinical characteristics (baseline 16S rRNA sequencing cohort) are presented in Table 1. Most of them had underlying chronic hepatitis B (69.4%) and Child–Pugh class A liver function (86.1%). Thirty-two patients (88.9%) had already received locoregional therapy, and 15 (41.7%) had received sorafenib for advanced HCC. Twenty-seven (75%) of them received anti-PD-1 or anti-PD-L1 monotherapy, and the remaining received anti-PD-1 or anti-PD-L1 in combination with antiangiogenic therapy (bevacizumab in 7 and sorafenib in 2). Ten (27.8%) and 19 (52.8%) patients achieved objective response and disease control, respectively. The baseline clinical characteristics between responders and nonresponders did not differ significantly; however, a higher percentage of patients with disease control than those without disease control had favorable baseline characteristics, such as ICI-based combination, lower alfa-fetoprotein level, and no antibiotic use within 4 weeks before immunotherapy initiation.
 |
Table 1 Patient Characteristics |
Of the 36 patients, 20 provided both baseline and 8W fecal samples for evaluation of longitudinal changes in gut microbiome during ICI (paired 16S rRNA sequencing cohort). Baseline fecal samples of a subset of 18 patients were used for shotgun whole-genome sequencing (baseline shotgun sequencing cohort). The baseline clinical characteristics of patients in the three cohorts did not differ significantly; however, more disease control cases were enriched in the shotgun sequencing cohort (Table S1).
Alpha Diversity and Richness of Gut Microbiome Were Not Associated with Objective Response or Disease Control
Both alpha diversity and richness of baseline gut microbiome were similar regardless of objective response or disease control (Figure 1A and B). Neither alpha diversity nor richness of gut microbiome significantly increased at 8 weeks after initiation of immunotherapy in patients with objective response or disease control (Figure 1C and D).
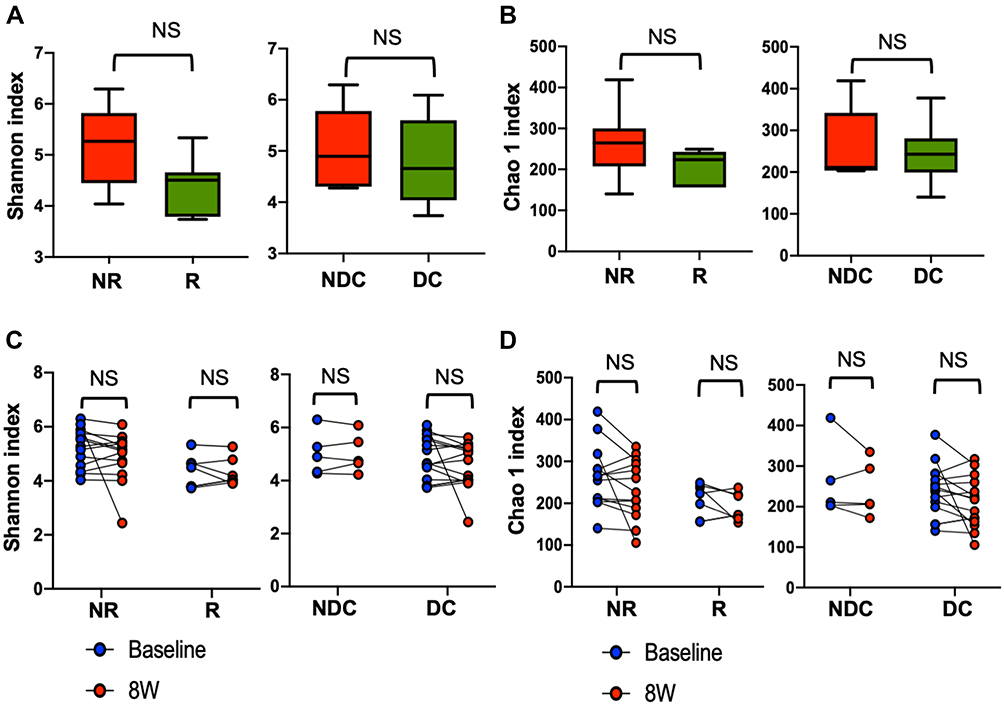 |
Figure 1 Associations between alpha diversity and richness of gut microbiome and efficacy of ICI. Alpha diversity, measured as Shannon index (A), and richness, measured as Chao 1 index (B) of baseline gut microbiome in the baseline 16S rRNA sequencing cohort (N=36) are shown in box plots by efficacy. Box plots demonstrated minimum, first quartile, median, third quartile, and maximum. Changes in alpha diversity (C) and richness (D) of gut microbiome after ICI in the paired 16S rRNA sequencing cohort (N=20) are shown by efficacy. Abbreviations: NR, nonresponders; R, responders; NDC, nondisease control; DC, disease control; 8W, 8 weeks after ICI initiation; NS, nonsignificant. |
Gut Microbiome Compositions Were Not Associated with Efficacy
Baseline gut microbiome compositions were not different between responders and nonresponders or between patients with and those without disease control (Figure 2A). In addition, gut microbiome compositions were not significantly changed by ICI in any outcome group (Figure 2B). Intrapatient longitudinal compositional changes measured using weighted UniFrac distance of each outcome group were much smaller than their interpatient compositional changes (Figure 2C). Taken together, these data suggest that gut microbiome compositions were relatively stable during the first 8 weeks after ICI initiation.
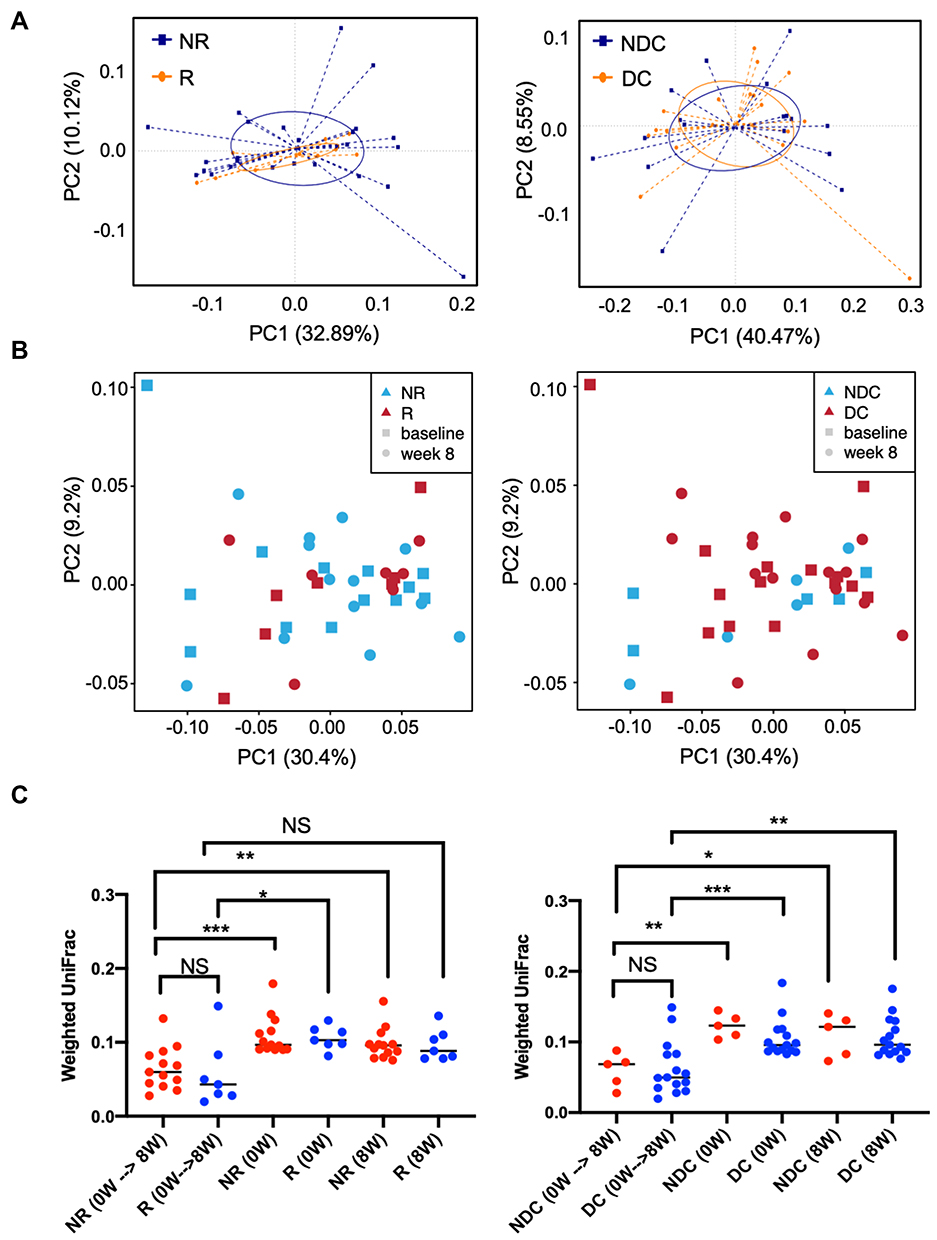 |
Figure 2 Associations between beta diversity of gut microbiome and efficacy of ICI. Beta diversity was used to evaluate similarity of gut microbiome between two groups. The results are visualized through PCoA based on weighted UniFrac distance and Bray–Curtis dissimilarity. (A) Beta diversity of baseline gut microbiome by response (left panel) or disease control (right panel) in the baseline 16S rRNA sequencing cohort (N=36); (B) beta diversity of both baseline and week 8 gut microbiome by response (left panel) or disease control (right panel) in the paired 16S rRNA sequencing cohort (N=20). (C) Intrapatient longitudinal changes and interpatient changes in beta diversity measured as weighted UniFrac distance are plotted.*p < 0.05; **p < 0.01; ***p < 0.001. Abbreviations: NR, nonresponders; R, responders; NDC, nondisease control; DC, disease control; 0W, baseline; 8W, 8 weeks after ICI initiation; NS, nonsignificant. |
Gut Microbiota Was Associated with Disease Control Rather Than Objective Response
The relative abundance of the selected genera is shown in Figure S1. In the baseline 16S rRNA sequencing cohort, the genera Succinivibrio and Tyzzerella subgroup 4 were enriched in the gut microbiota of responders, whereas the genus Akkermansia was enriched in the gut microbiota of nonresponders (Figure 3A, left; Figure S2). However, such associations were not confirmed in the shotgun whole-genome sequencing subset (Figure 3A, right; Figure S2).
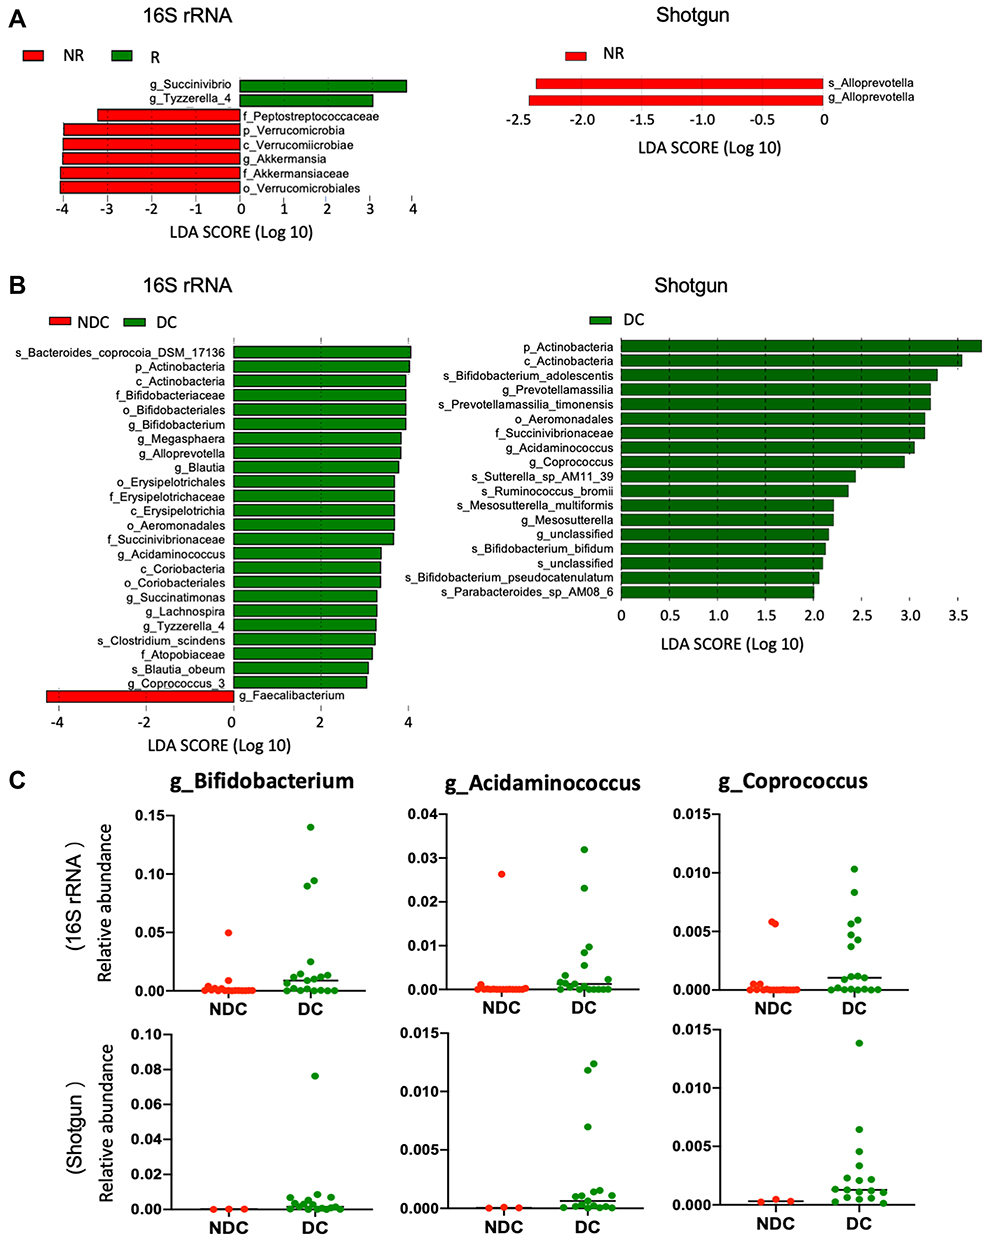 |
Figure 3 Compositional differences in baseline gut microbiome. The differentially abundant taxa in the baseline gut microbiome were analyzed with linear discriminate analysis coupled with effect size measurements (LEfSe) projected with a histogram. The length indicates the effect size associated with a taxon. LDA > 3 in the baseline 16S rRNA sequencing cohort and LDA >2 in the baseline shotgun whole-genome sequencing subset were considered statistically different. (A) R (responders; green) vs NR (nonresponders; red); (B) DC (disease control; green) vs NDC (nondisease control; red). (C) Relative abundance of Bifidobacterium, Acidaminococcus, and Coprococcus between DC and NDC in baseline 16S rRNA sequencing cohort (upper) and shotgun whole-genome sequencing subset (lower). |
Bifidobacterium, Alloprevotella, Blautia, Megasphaera, Succinatimonas, Lachnospira, Acidaminococcus, Tyzzerella subgroup 4, and Coprococcus subgroup 3 (listed in order of statistical significance) were enriched in the gut microbiota of patients with disease control in the 16S rRNA sequencing cohort (Figure 3B, left; Figure 3C, upper). The association of Bifidobacterium, Acidaminococcus, and Coprococcus with disease control was also confirmed in the shotgun whole-genome sequencing subset (Figure 3B, right; Figure 3C, lower; Figures S3 and S4). Moreover, analysis of the shotgun sequencing data specified Bifidobacterium adolescentis, B. bifidum, and B. pseudocatenulatum (listed in order of statistical significance) as species of Bifidobacterium enriched in the gut microbiota of patients with disease control (Figure 3B, right).
Associations Between Gut Microbiota and Disease Control Were Lost 8 Weeks After ICI Initiation
We evaluated whether the differential abundance of selected taxa at baseline between patients with and those without disease control persisted after immunotherapy. However, such differences in abundance of Bifidobacterium, Acidaminococcus, or Coprococcus were no longer observed 8 weeks after ICI initiation (Figure 4A).
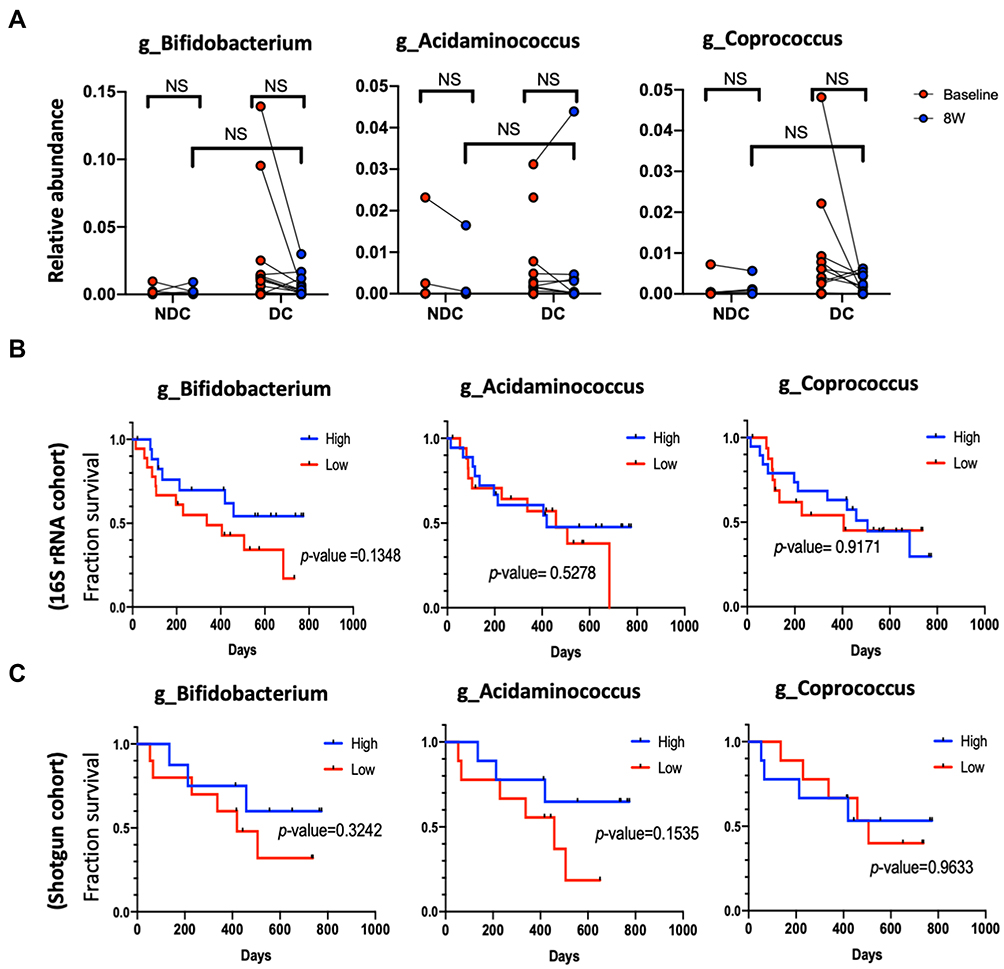 |
Figure 4 Persistence and overall survival correlation of Bifidobacterium, Acidaminococcus, and Coprococcus. (A) Changes in relative abundance by efficacy. Patients in the baseline 16S rRNA sequencing cohort (B) and patients in the baseline shotgun whole-genome sequencing cohort (C) were individually divided into two groups (high vs low abundance) according to the mean baseline abundance level of interest taxon. The effect of abundance of each taxon on overall survival were examined by Log rank test and plotted by Kaplan–Meier method. Abbreviations: 8W, 8 weeks after ICI initiation; NR, nonresponders; R, responders; NDC, nondisease control; DC, disease control; NS, nonsignificant. |
High Abundance of Disease Control-Associated Taxa Did Not Correlate with Prolonged Overall Survival
We examined whether the baseline abundance of each disease control-associated taxon would influence the overall survival of patients with HCC receiving ICI. The patient characteristics by baseline abundance level (high vs low) of each taxon are shown in Table S2. High baseline abundance of Bifidobacterium was not associated with any patient characteristics. High baseline abundance of Acidaminococcus and Coprococcus was associated with favorable characteristics, such as no prior antibiotics within 4 weeks before immunotherapy and no systemic therapy. Child–Pugh class B and prior systemic therapy correlated with shorter overall survival as expected (Table 2). Nevertheless, high abundance of Bifidobacterium, Acidaminococcus, or Coprococcus in the baseline gut microbiota did not significantly correlate with prolonged overall survival (Table 2 and Figure 4B and C).
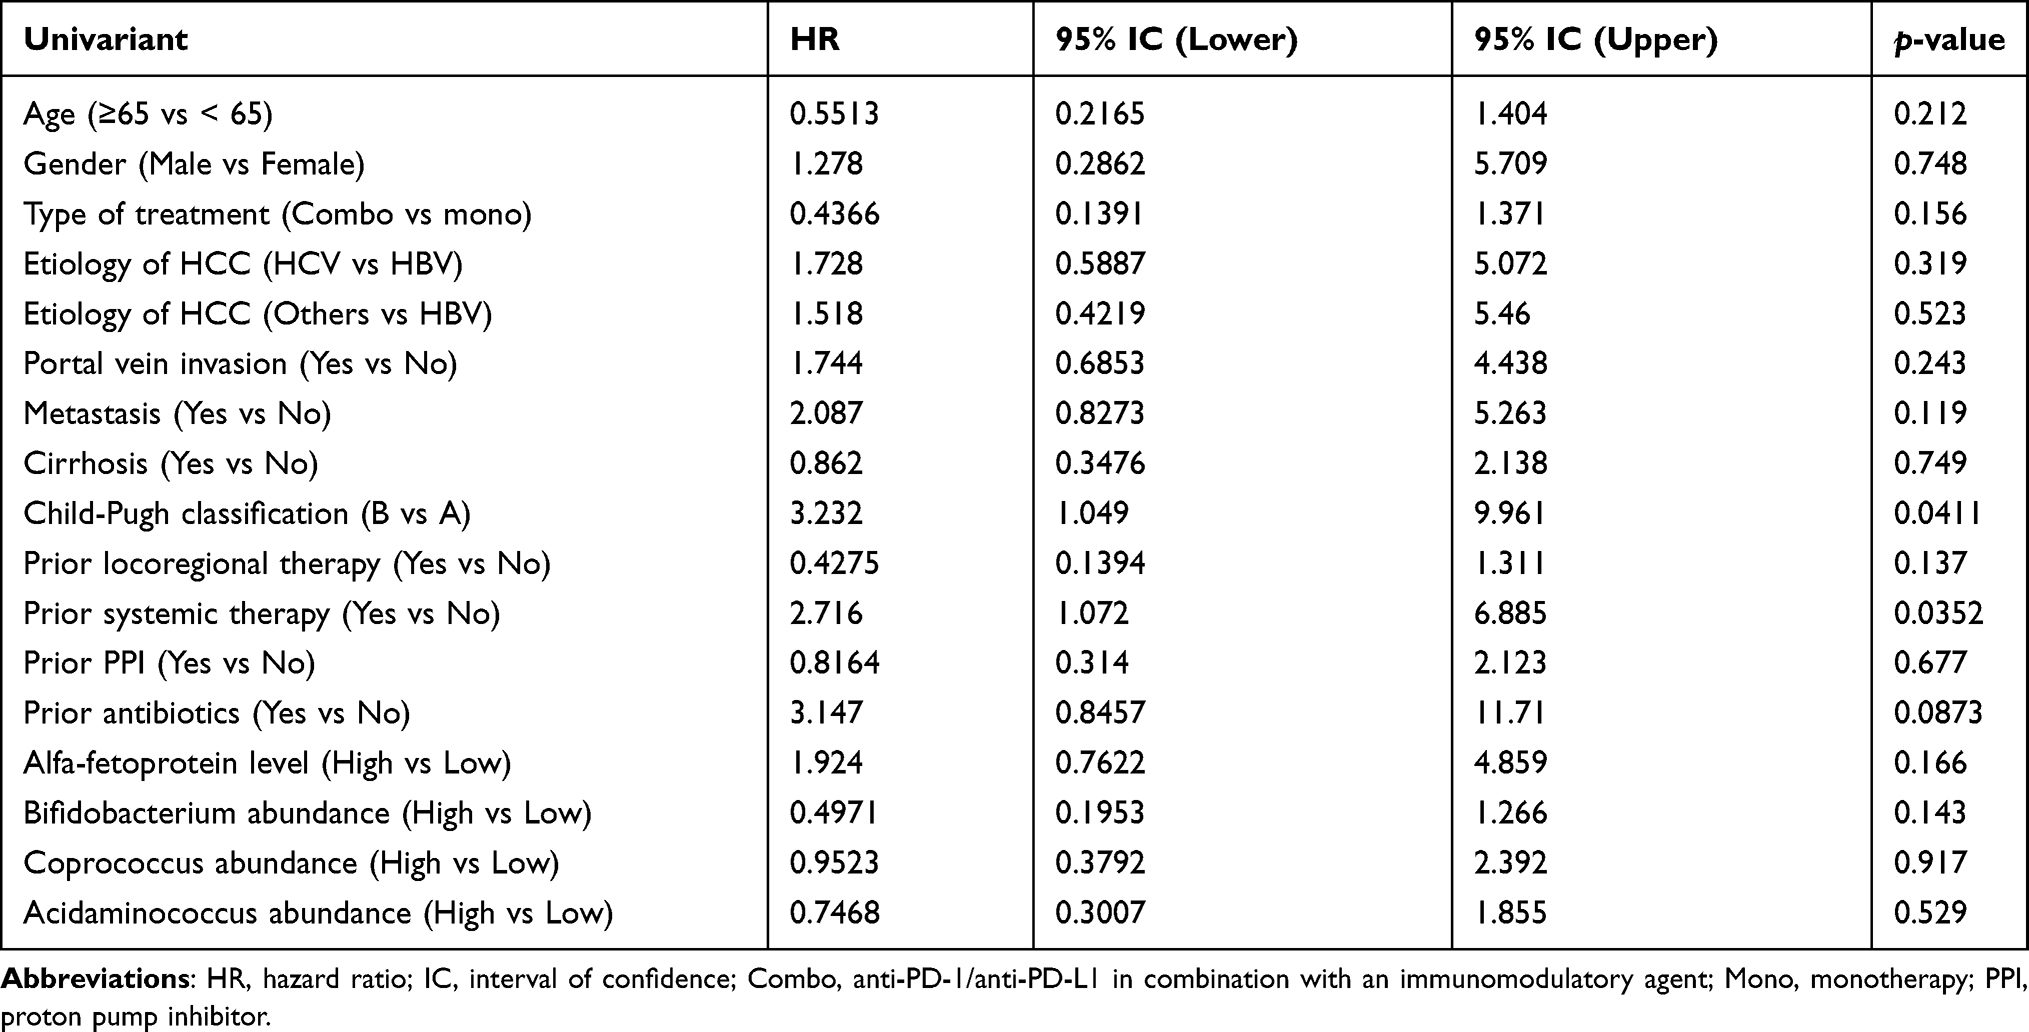 |
Table 2 Prognostic Values of Patient and Microbiome Characteristics |
Discussion
The role of gut microbiota in predicting the efficacy of ICI in patients with HCC has not been elucidated thus far. The current study correlated not only baseline but also posttreatment gut microbiome features defined by both 16S rRNA and shotgun whole-genome sequencing profiles with objective response, disease control, and overall survival of patients with HCC receiving ICI. However, our study failed to reveal any clinically significant associations between gut microbiota and ICI efficacy in patients with HCC. Any confirmatory studies with larger sample size are warranted.
Several major differences in study design may aid in explaining the contradicting results between the current study and previous studies on other cancer types showing positive associations between gut microbiota and cancer immunotherapy response. First, most studies have defined “response” to ICI as complete response, partial response, or stable disease for a certain duration, which is the same as the idea of “disease control.” However, disease control is not a robust efficacy indicator, particularly in a setting without untreated or placebo control, and may be confounded by host or tumor characteristics. Instead, we explored associations of gut microbiome with both “objective response” and “disease control” and found that no taxa were associated with objective response. Second, no study investigated whether the differential abundance of identified beneficial taxa persisted after immunotherapy. By contrast, we found the differential abundance of disease control-associated taxa were no longer noted 8 weeks after ICI initiation (Figure 4A), implying that these taxa are less likely to modulate antitumor immune responses of ICI and affect patient outcomes. Third, most studies did not correlate the abundance or clustering of taxa with time-to-event data, such as progression-free survival, time-to-treatment failure, and overall survival.9–12,15–17 By contrast, our study correlated the aforementioned gut microbiome features with overall survival. Relevant future studies should include time-to-event endpoints as well.
Zheng et al recently published the first study thus far on the association of gut microbiome with anti-PD-1 monotherapy in patients with HCC who have disease progression during sorafenib use.17 Eight patients were enrolled; of them, three were responders (defined as patients who achieved complete response, partial response, or stable disease lasting >6 months) and five were nonresponders. Fecal samples were collected before and every 3 weeks after initiation of anti-PD-1 monotherapy, but only data from baseline and 1, 3, and 6 weeks after ICI were reported. Responders were associated with higher richness of gut microbiota throughout the course, whereas nonresponders were associated with a progressive increase in beta diversity, which was most evident 6 weeks after initiation of anti-PD-1 monotherapy. However, neither baseline richness nor posttreatment changes in beta diversity at 8 weeks were associated with outcome in our larger patient cohort (Figures 1, 2, and S5). Furthermore, none of those 20 responder-enriched species described by Zheng et al were identified in our study. These discrepancies may reflect a growing concern that poor reproducibility has become the norm rather than the exception in seeking associations between gut microbiome and clinical outcomes. In addition to host factors affecting gut microbiota, such as diet, medication, and underlying disease, lack of standardization in fecal sample collection and processing, bacterial lysis, DNA purification, sequencing technique, reference database, and bioinformatic analysis contribute to poor reproducibility.50,51
Higher alpha diversity8,11 or richness16 of baseline gut microbiome has been correlated with the efficacy of ICI in patients with melanoma or non–small cell lung cancer. However, neither of the aforementioned factors is correlated with efficacy in our study. This might partly be attributed to a high prevalence of preexisting dysbiosis in our patients with HCC and various degrees of underlying liver cirrhosis. Decreased Bacteroidetes population was a common feature of dysbiosis in patients with a wide range of chronic liver diseases.52–54 Similarly, the relative abundance of the Bacteroidetes phylum in the gut microbiota of our patients was significantly lower (average, 0.5; range, 0.11–0.79), regardless of the efficacy, in comparison with that of healthy people (average, 0.8) (Figure S6).51,52 Our results suggest that preexisting cirrhosis-related dysbiosis may blur the potential association of gut microbiome with efficacy of immunotherapy in HCC patients.
Our study had several limitations. First, the sample size was small, but comparable to that in most published studies on various cancer types with a median sample size of 35 (range: 8–78). Increased sample size may increase the opportunities to identify key taxa with immunomodulatory activities. Second, shotgun whole-genome sequencing was only applied to baseline fecal samples from a single participating hospital in a nonselected basis. Thus, the patient numbers of “disease control” and “nondisease control” groups happened to be biased (13 and 3, respectively). Third, the patients enrolled in our study were relatively heterogeneous in immunotherapy regimens. Twenty-five % of our patients received antiangiogenic therapy in addition to anti-PD-1 or anti-PD-L1. Possible interactions between gut microbiota and antiangiogenic therapy remain unclear. As ICI-based combination immunotherapy has shown superiority over ICI monotherapy in HCC, evaluation of associations between gut microbiota and efficacy of ICI monotherapy is becoming challenging.
Our study failed to disclose any clinically meaningful association between gut microbiota and efficacy of ICI in HCC patients. Although this may stand in contrast to several previous reports8–10 that showed a positive correlation, we would like to cautiously point out that none of those positive reports has ever yet been validated by subsequent independent studies. This represents an overt pitfall of this important field and highlights the growing concern on the reproducibility and repeatability of the contemporary methodology for microbiome research. Significant variabilities may emerge on the experimental workflow, starting from stool sampling and preservation to DNA extraction, PCR amplification, and to bioinformatic analyses.55,56 In the future, standardized procedures throughout the experimental workflow are crucial to make reliable and meaningful scientific conclusions possible.
Conclusion
We demonstrated that baseline or posttreatment gut microbiome features were not associated with the outcome of patients with HCC receiving ICI. A larger prospective study is warranted for definite conclusion.
Acknowledgments
We would like to thank Ms Mo-Jung Chang (National Taiwan University Hospital) and Ms Chieh-Ju Lee (Taipei Veterans General Hospital) for study coordination, Dr Chia-Lang Hsu (the Second Core Laboratory, Department of Medical Research, National Taiwan University Hospital) for consultation service, the Medical Microbiota Center of the First Core Laboratory, National Taiwan University College of Medicine, Taiwan, the Biotools Co., Ltd., Taiwan, for NGS service, and Wallace Academic Editing for English editing service.
The interim findings (data of the first 12 patients from Taipei Veterans General Hospital) of this study were presented at The International Liver Congress TM 2019 as a poster presentation. The poster’s abstract was published in the Journal of Hepatology 2019;70(1):Supplement, e89 (Abstract No.: PS-140).
Author Contributions
All authors made a significant contribution to the work reported, whether that is in the conception, study design, execution, acquisition of data, analysis and interpretation, or in all these areas; took part in drafting, revising or critically reviewing the article; gave final approval of the version to be published; have agreed on the journal to which the article has been submitted; and agree to be accountable for all aspects of the work.
Funding
MOST 108-2314-B-002-024, MOST 109-2634-F-002-043 and MOST 110-2634-F-002-044 from the Ministry of Science and Technology, Taiwan. NTU-109L901403 and NTU-110L901404 from Center of Precision Medicine from The Featured Areas Research Center Program within the framework of the Higher Education Sprout Project by the Ministry of Education, Taiwan.
Disclosure
Dr Chih-Hung Hsu reports personal fees from Merck Sharp & Dohme, personal fees from Bristol-Myers Squibb, personal fees from Ono Pharmaceutical, grants, personal fees from Roche, grants, personal fees from AstraZeneca, personal fees from Eisai, grants, personal fees from Bayer, grants from Eli Lilly, outside the submitted work. The authors report no other conflicts of interest in this work.
References
1. El-Khoueiry AB, Sangro B, Yau T, et al. Nivolumab in patients with advanced hepatocellular carcinoma (CheckMate 040): an open-label, non-comparative, Phase 1/2 dose escalation and expansion trial. Lancet. 2017;389(10088):2492–2502. doi:10.1016/S0140-6736(17)31046-2
2. Zhu AX, Finn RS, Edeline J, et al. Pembrolizumab in patients with advanced hepatocellular carcinoma previously treated with sorafenib (KEYNOTE-224): a non-randomised, open-label Phase 2 trial. Lancet Oncol. 2018;19:940–952.
3. Yau T, Kang YK, Kim TY, et al. Efficacy and safety of nivolumab plus ipilimumab in patients with advanced hepatocellular carcinoma previously treated with sorafenib: the CheckMate 040 randomized clinical trial. JAMA Oncol. 2020;6:e204564.
4. Finn RS, Qin S, Ikeda M, et al. Atezolizumab plus bevacizumab in unresectable hepatocellular carcinoma. N Engl J Med. 2020;382:1894–1905.
5. Rizzo A, Ricci AD, Brandi G. Immune-based combinations for advanced hepatocellular carcinoma: shaping the direction of first-line therapy. Future Oncol. 2021;17:755–757.
6. Rizzo A, Ricci AD, Brandi G. Atezolizumab in advanced hepatocellular carcinoma: good things come to those who wait. Immunotherapy. 2021;13:637–644.
7. Sangro B, Melero I, Wadhawan S, et al. Assessment of inflammation biomarkers and clinical outcomes in nivolumab-treated patients with advanced hepatocellular carcinoma in CheckMate 040. J Hepatol. 2020;73:1460–1469.
8. Gopalakrishnan V, Spencer CN, Nezi L, et al. Gut microbiome modulates response to anti-PD-1 immunotherapy in melanoma patients. Science. 2018;359:97–103.
9. Routy B, Le Chatelier E, Derosa L, et al. Gut microbiome influences efficacy of PD-1-based immunotherapy against epithelial tumors. Science. 2018;359:91–97.
10. Matson V, Fessler J, Bao R, et al. The commensal microbiome is associated with anti–PD-1 efficacy in metastatic melanoma patients. Science. 2018;359(6371):104–108. doi:10.1126/science.aao3290
11. Jin Y, Dong H, Xia L, et al. The diversity of gut microbiome is associated with favorable responses to anti-programmed death 1 immunotherapy in Chinese patients with NSCLC. J Thorac Oncol. 2019;14:1378–1389.
12. Frankel AE, Coughlin LA, Kim J, et al. Metagenomic shotgun sequencing and unbiased metabolomic profiling identify specific human gut microbiota and metabolites associated with immune checkpoint therapy efficacy in melanoma patients. Neoplasia. 2017;19:848–855.
13. Katayama Y, Yamada T, Shimamoto T, et al. The role of the gut microbiome on the efficacy of immune checkpoint inhibitors in Japanese responder patients with advanced non-small cell lung cancer. Transl Lung Cancer Res. 2019;8:847–853.
14. Chaput N, Lepage P, Coutzac C, et al. Baseline gut microbiota predicts clinical response and colitis in metastatic melanoma patients treated with ipilimumab. Ann Oncol. 2019;30:2012.
15. Vétizou M, Pitt JM, Daillère R, et al. Anticancer immunotherapy by CTLA-4 blockade relies on the gut microbiota. Science. 2015;350:1079–1084.
16. Peters BA, Wilson M, Moran U, et al. Relating the gut metagenome and metatranscriptome to immunotherapy responses in melanoma patients. Genome Med. 2019;11:61.
17. Zheng Y, Wang T, Tu X, et al. Gut microbiome affects the response to anti-PD-1 immunotherapy in patients with hepatocellular carcinoma. J Immunother Cancer. 2019;7:193.
18. Magoc T, Salzberg SL. FLASH: fast length adjustment of short reads to improve genome assemblies. Bioinformatics. 2011;27:2957–2963.
19. Caporaso JG, Kuczynski J, Stombaugh J, et al. QIIME allows analysis of high-throughput community sequencing data. Nat Methods. 2010;7:335–336.
20. Bokulich NA, Subramanian S, Faith JJ, et al. Quality-filtering vastly improves diversity estimates from Illumina amplicon sequencing. Nat Methods. 2013;10:57–59.
21. Haas BJ, Gevers D, Earl AM, et al. Chimeric 16S rRNA sequence formation and detection in Sanger and 454-pyrosequenced PCR amplicons. Genome Res. 2011;21:494–504.
22. Edgar RC, Haas BJ, Clemente JC, et al. UCHIME improves sensitivity and speed of chimera detection. Bioinformatics. 2011;27:2194–2200.
23. Edgar RC. UPARSE: highly accurate OTU sequences from microbial amplicon reads. Nat Methods. 2013;10:996–998.
24. Edgar RC. Search and clustering orders of magnitude faster than BLAST. Bioinformatics. 2010;26:2460–2461.
25. Wang Q, Garrity GM, Tiedje JM, et al. Naive Bayesian classifier for rapid assignment of rRNA sequences into the new bacterial taxonomy. Appl Environ Microbiol. 2007;73:5261–5267.
26. Quast C, Pruesse E, Yilmaz P, et al. The SILVA ribosomal RNA gene database project: improved data processing and web-based tools. Nucleic Acids Res. 2013;41:D590–596.
27. Yilmaz P, Parfrey LW, Yarza P, et al. The SILVA and “All-species Living Tree Project (LTP)” taxonomic frameworks. Nucleic Acids Res. 2014;42:D643–648.
28. Caporaso JG, Bittinger K, Bushman FD, et al. PyNAST: a flexible tool for aligning sequences to a template alignment. Bioinformatics. 2010;26:266–267.
29. Price MN, Dehal PS, Arkin AP. FastTree 2–approximately maximum-likelihood trees for large alignments. PLoS One. 2010;5:e9490.
30. Price MN, Dehal PS, Arkin AP. FastTree: computing large minimum evolution trees with profiles instead of a distance matrix. Mol Biol Evol. 2009;26:1641–1650.
31. Whittaker RH. Evolution and measurement of species diversity. Taxon. 1972;21:213–251.
32. Lozupone C, Knight R. UniFrac: a new phylogenetic method for comparing microbial communities. Appl Environ Microbiol. 2005;71:8228–8235.
33. Lozupone C, Lladser ME, Knights D, et al. UniFrac: an effective distance metric for microbial community comparison. ISME J. 2011;5:169–172.
34. Jiang XT, Peng X, Deng GH, et al. Illumina sequencing of 16S rRNA tag revealed spatial variations of bacterial communities in a mangrove wetland. Microb Ecol. 2013;66:96–104.
35. Bolger AM, Lohse M, Usadel B. Trimmomatic: a flexible trimmer for Illumina sequence data. Bioinformatics. 2014;30:2114–2120.
36. Langmead B, Salzberg SL. Fast gapped-read alignment with Bowtie 2. Nat Methods. 2012;9:357–359.
37. Li D, Liu CM, Luo R, et al. MEGAHIT: an ultra-fast single-node solution for large and complex metagenomics assembly via succinct de Bruijn graph. Bioinformatics. 2015;31:1674–1676.
38. Hyatt D, Chen GL, Locascio PF, et al. Prodigal: prokaryotic gene recognition and translation initiation site identification. BMC Bioinform. 2010;11:119.
39. Fu L, Niu B, Zhu Z, et al. CD-HIT: accelerated for clustering the next-generation sequencing data. Bioinformatics. 2012;28:3150–3152.
40. Li W, Fu L, Niu B, et al. Ultrafast clustering algorithms for metagenomic sequence analysis. Brief Bioinform. 2012;13:656–668.
41. Li H, Durbin R. Fast and accurate short read alignment with Burrows-Wheeler transform. Bioinformatics. 2009;25:1754–1760.
42. Li H, Handsaker B, Wysoker A, et al. The sequence Alignment/Map format and SAMtools. Bioinformatics. 2009;25:2078–2079.
43. Kang DD, Froula J, Egan R, et al. MetaBAT, an efficient tool for accurately reconstructing single genomes from complex microbial communities. Peer J. 2015;3:e1165.
44. Parks DH, Imelfort M, Skennerton CT, et al. CheckM: assessing the quality of microbial genomes recovered from isolates, single cells, and metagenomes. Genome Res. 2015;25:1043–1055.
45. Pruitt KD, Tatusova T, Maglott DR. NCBI reference sequences (RefSeq): a curated non-redundant sequence database of genomes, transcripts and proteins. Nucleic Acids Res. 2007;35:D61–65.
46. Buchfink B, Xie C, Huson DH. Fast and sensitive protein alignment using DIAMOND. Nat Methods. 2015;12:59–60.
47. Paulson JN, Stine OC, Bravo HC, et al. Differential abundance analysis for microbial marker-gene surveys. Nat Methods. 2013;10:1200–1202.
48. Parks DH, Tyson GW, Hugenholtz P, et al. STAMP: statistical analysis of taxonomic and functional profiles. Bioinformatics. 2014;30:3123–3124.
49. Segata N, Izard J, Waldron L, et al. Metagenomic biomarker discovery and explanation. Genome Biol. 2011;12:R60.
50. Elinav E, Garrett WS, Trinchieri G, et al. The cancer microbiome. Nat Rev Cancer. 2019;19:371–376.
51. Human Microbiome Project Consortium. Structure, function and diversity of the healthy human microbiome. Nature. 2012;486:207–214.
52. Qin N, Yang F, Li A, et al. Alterations of the human gut microbiome in liver cirrhosis. Nature. 2014;513:59–64.
53. Wei X, Yan X, Zou D, et al. Abnormal fecal microbiota community and functions in patients with hepatitis B liver cirrhosis as revealed by a metagenomic approach. BMC Gastroenterol. 2013;13:175.
54. Ponziani FR, Bhoori S, Castelli C, et al. Hepatocellular carcinoma is associated with gut microbiota profile and inflammation in nonalcoholic fatty liver disease. Hepatology. 2019;69:107–120.
55. Knight R, Vrbanac A, Taylor BC, et al. Best practices for analysing microbiomes. Nat Rev Microbiol. 2018;16:410–422.
56. Poussin C, Sierro N, Boue S, et al. Interrogating the microbiome: experimental 56 and computational considerations in support of study reproducibility. Drug Discov Today. 2018;23:1644–1657.
 © 2021 The Author(s). This work is published and licensed by Dove Medical Press Limited. The
full terms of this license are available at https://www.dovepress.com/terms
and incorporate the Creative Commons Attribution
- Non Commercial (unported, 3.0) License.
By accessing the work you hereby accept the Terms. Non-commercial uses of the work are permitted
without any further permission from Dove Medical Press Limited, provided the work is properly
attributed. For permission for commercial use of this work, please see paragraphs 4.2 and 5 of our Terms.
© 2021 The Author(s). This work is published and licensed by Dove Medical Press Limited. The
full terms of this license are available at https://www.dovepress.com/terms
and incorporate the Creative Commons Attribution
- Non Commercial (unported, 3.0) License.
By accessing the work you hereby accept the Terms. Non-commercial uses of the work are permitted
without any further permission from Dove Medical Press Limited, provided the work is properly
attributed. For permission for commercial use of this work, please see paragraphs 4.2 and 5 of our Terms.