Back to Journals » Diabetes, Metabolic Syndrome and Obesity » Volume 16
Amplitude of Low-Frequency Fluctuation to Determine Disturbed Spontaneous Brain-Activity Pattern in Patients with Diabetic Optic Neuropathy
Authors Wang XY ![]() , Xu SH
, Xu SH ![]() , Wei H, Kang M, Zou J, Ling Q, Huang H, Chen X, Wang YX, Shao Y
, Wei H, Kang M, Zou J, Ling Q, Huang H, Chen X, Wang YX, Shao Y ![]() , Yu Y
, Yu Y
Received 16 June 2023
Accepted for publication 7 September 2023
Published 20 September 2023 Volume 2023:16 Pages 2899—2909
DOI https://doi.org/10.2147/DMSO.S423111
Checked for plagiarism Yes
Review by Single anonymous peer review
Peer reviewer comments 2
Editor who approved publication: Professor Gian Paolo Fadini
Xiao-Yu Wang,1– 3,* San-Hua Xu,3,* Hong Wei,3,* Min Kang,3 Jie Zou,3 Qian Ling,3 Hui Huang,3 Xu Chen,4 Yi-Xin Wang,5 Yi Shao,3 Yao Yu1
1Department of Endocrinology and Metabolism, The First Affiliated Hospital of Nanchang University, Jiangxi Clinical Research Center for Endocrine and Metabolic Disease, Jiangxi Branch of National Clinical Research Center for Metabolic Disease, Nanchang, Jiangxi, 330006, People’s Republic of China; 2The First Clinical Medical College, Nanchang University, Nanchang, Jiangxi, 330006, People’s Republic of China; 3Department of Ophthalmology, The First Affiliated Hospital of Nanchang University, Jiangxi Branch of National Clinical Research Center for Ocular Disease, Nanchang, Jiangxi, 330006, People’s Republic of China; 4Department of Ophthalmology and Visual Sciences, Maastricht University, Maastricht, Limburg Province, 6200MA, Netherlands; 5School of Optometry and Vision Sciences, Cardiff University, Cardiff, CF244HQ, UK
*These authors contributed equally to this work
Correspondence: Yi Shao, Department of Ophthalmology, The First Affiliated Hospital of Nanchang University, Nanchang, Jiangxi, 330006, People’s Republic of China, Email [email protected] Yao Yu, Department of Endocrinology and Metabolism, The First Affiliated Hospital of Nanchang University, Nanchang, Jiangxi, 330006, People’s Republic of China, Email [email protected]
Purpose: This study aimed to explore the spontaneous brain activity in patients with diabetic optic neuropathy (DON) by using the amplitude of low-frequency fluctuation (ALFF) technique.
Methods: Sixteen DON patients and 16 age- and sex-matched healthy controls (HCs) were recruited. ALFF along with functional MRI method was used to detect the intrinsic brain activity alterations. The mean values of ALFF in DON patients and HCs were analyzed by receiver operating characteristic (ROC) curves. Pearson’s correlation analysis was used to determine the correlation between Hospital Anxiety and Depression Scale (HADS) and ALFF values of DONs.
Results: The DON group showed significantly increased ALFF values in the fusiform gyrus, and decreased ALFF values in the medial frontal gyrus/left frontal superior orbit/right frontal medial orbit, and left frontal inferior triangle. ROC curve analysis indicated that the accuracy of AUC was good. The anxiety scale and depression scale of the DON group were negatively correlated with the ALFF values of the medial frontal gyrus.
Conclusion: DON is a neurodegenerative disease involving multiple brain regions. The abnormal activity of neurons in these brain regions helps to reveal the underlying neural mechanisms of brain activity related to DON.
Keywords: ALFF, fMRI, diabetic optic neuropathy, spontaneous brain activity
Introduction
In recent years, the prevalence of diabetes has increased with changing lifestyles of people.1–3 Diabetic patients are known to develop a variety of systemic and ocular complications, and the most common ophthalmological complications are diabetic retinopathy (DR) and diabetic macular edema.4 Nevertheless, diabetic optic neuropathy (DON) can also progress with different forms and potentially threaten patients’ vision.5 DON refers to the occurrence of monocular or binocular optic disc edema in diabetic patients. It is one of the fundus complications of diabetes and is more common in insulin-dependent diabetes.6 Although DON is not rare in clinical practice, it can be easily neglected without representative specificity, and the prevalence of DON is usually underrated in clinical practice. The major clinical characteristics include optic disc neovascularization, fundus alterations and ischemic optic neuropathy.7 Therefore, it is important to investigate the latent pathogenesis of DON to aid early diagnosis and ensure better treatment and prevention.
Resting-state fMRI (rs-fMRI) is a brain functional imaging method. It is adopted to observe cerebral activities when an object is at rest and not performing tasks,8 and can be employed to study the cerebral functional organization as well as examine alterations during diseases. Amplitude of low-frequency fluctuation (ALFF) is one of the most important rs-fMRI analysis techniques that can reveal the alterations of regional spontaneous brain activity at rest by detecting spontaneous fluctuation in blood oxygen level-dependent signal. The advantage of the ALFF method is that the analysis is simple and there are no basic assumptions. It shows extremely high time stability and long-term retest reliability. This method ensures reliability between subjects and has sufficient specificity to examine individual differences.9 ALFF has been employed in many ophthalmological diseases such as glaucoma,10–12 high myopia,13 strabismus,14,15 optic neuritis,16 ocular trauma,17 blindness,18 acute eye pain,19 retinal detachment20 and diabetic retinal diseases.21,22
Optic neuropathy may prevent the transmission of optical information and subsequently lead to abnormal cerebral activities; however, few studies have looked into the changes of spontaneous brain activities in DON patients. Therefore, in this study, we utilized ALFF to detect the spontaneous brain activity in DON patients to understand whether DON is associated with aberrant functional cerebral activity.
Materials and Methods
Subjects
Sixteen DON patients were recruited from the Department of Ophthalmology, First Affiliated Hospital of Nanchang University between February 2021 to March 2022. The fundus was examined using fundus fluorescein angiography (FFA) and ophthalmic fundus photography (Figure 1). The inclusion criteria for DON were: (1) diagnosed with diabetes; (2) diagnosed with optic disc edema (non-specific congestive edema); (3) early lesions on the optic nerve (painless, persistent loss of vision) with obscure, leaky and low fluorescence as seen on FFA; and (4) absence of any other optic disc edema disease. Exclusion criteria: (1) a history of serious craniocerebral injury; (2) severe mental dysfunctions; (3) excessive drinking history; (4) a history of drug abuse; (5) pregnancy; and (6) subjects with excessive motion.
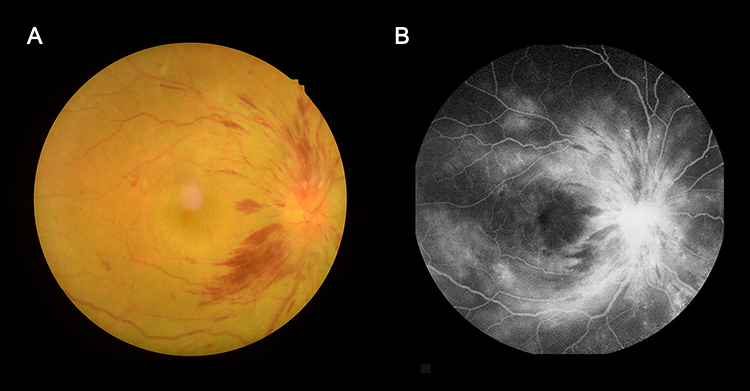 |
Figure 1 Eye examination data of DON patients. Abbreviation: DON, diabetic optic neuropathy. Notes: Fundus photography (A); Fundus fluorescein angiography (B). Microaneurysms and dilation of the prediscal capillary network were observed. No venous dilatation or capillary closure area were observed. |
Additionally, 16 healthy controls (HCs) were recruited. The inclusion criteria for HCs were: (1) no ophthalmological disease history; (2) no neurological or mental diseases; and (3) no other diseases that cause brain lesions. Exclusion criteria: subjects with excessive motion. Subjects were asked to carefully finish the Hospital Anxiety and Depression Scale. The study was ratified by the Human Research Ethics Committee of First Affiliated Hospital of Nanchang University (approval number 2021 (039), February 23, 2021). All participants signed informed consent after understanding the details of the study. All investigations comply with the principles set out in the Declaration of Helsinki.
Study Design
DON was diagnosed according to clinical manifestations, visual field defect, VEP, and FFA. All the enrolled patients were admitted to our hospital. HCs were enrolled according to the inclusion criteria above.
All subjects received MRI scanning. We extracted the measurement data and uploaded them to a computer using the Statistical parameter mapping software and the MRIcro software for data analysis. The procedure of scanning are as follows.
MRI Parameters
The MRI scan was performed using Siemens Trio 3.0 T MRI scanner with 8-channel phased array head coil. During the scanning, the participants were asked to keep their eyes closed and focused on the center, and avoid thinking or falling asleep. A 3D metamorphic gradient echo pulse sequence was used to collect the functional data. The scanning parameters were as follows: the repeat time was 2000 ms; the flip angle was 90°; the echo time was 40 ms; the slice thickness/gap was 4.0/1 mm; the field of view was 240 mm×240 mm; and the plane resolution was 64×64. The scanning lasted for 8 min, and there were 30 axial slices in total that spanned the entire brain. A total of 240 functional images were collected eventually.23
fMRI Data Processing
The preprocessing of the fMRI images were made by Statistical parameter mapping software, and the MRIcro software was used to analyze data. For each object, the first 10 volumes were eliminated for magnetization balance. The residual 230 volumes were managed by slicing time-related procedures and then realigned to the first volume to correct the head movement. All rearranged data were homogenized into standard Montreal Institute of Neurology EPI templates and resampled into 2×2×2 mm³cubes.24
Best-Corrected Visual Acuity
Best-corrected visual acuity was assessed using the Early Treatment Diabetic Retinopathy Study(ETDRS) chart following a standardized refraction protocol. Each row of the ETDRS chart consists of five Sloan letters of the same size and reading difficulty, a total of 14 rows; the size of each line of letters is 0.7943 times the size of the uplink letters; the size of each three-line letter is reduced by half (0.79433 = 0.5); the interval between the peer letters is the size of the peer letters, and the interval between the adjacent two rows of visual objects is the size of the lower row letters. The measurement results were expressed as the logarithm of the minimum angle of resolution (LogMAR) or ETDRS score. Subjects were asked to read from the first word in the order of from left to right, from top to bottom until at least 3 letters could not be read in a certain line. Take the previous correctly read letter as the visual acuity record value.25
Visual Evoked Potential
Visual evoked potential (VEP) is the electrical response of the occipital lobe of the cerebral cortex to visual stimulation. It is a potential change caused by the retina receiving stimulation and transmitting to the occipital cortex through the visual pathway. VEP can diagnose the lesions in the visual pathway and evaluate the type and degree of visual dysfunction objectively, quantitatively and locally. VEP is the most sensitive objective examination method for optic neuropathy, which can further confirm the clinical diagnosis.26
Statistical Analysis
Collected functional MRI data were analyzed by the REST software and a two-sided t-test. According to the Gaussian random field theory, the voxel level statistical threshold of multiple comprehensive comparisons was set to p < 0.005. Alpha sim was corrected at a cluster size >60 voxels and set to p<0.005.
SPSS 20.0 was used to perform an independent sample t-test on demographic and behavioral data. P < 0.05 was considered to be statistically significant. Receiver operating characteristic (ROC) curve was used to assess whether ALFF value was a diagnostic marker for corresponding brain regions. The diagnostic accuracy was expressed as the area under the curve (AUC), and the values of 0.5–0.7, 0.7–0.9, and > 0.9 were low, medium, and high, respectively.27 Pearson correlation analysis was used to analyze the correlation between clinical features and ALFF values in specific regions.
Results
Demographics and Behavioral results
The difference of best corrected visual acuity, the bilateral visual evoked potential latency and amplitude between the DON and the HC groups was statistically significant (all P < 0.05). The average duration of DON was 54.64 ± 5.23 days. The detailed data of clinical features are shown in Table 1.
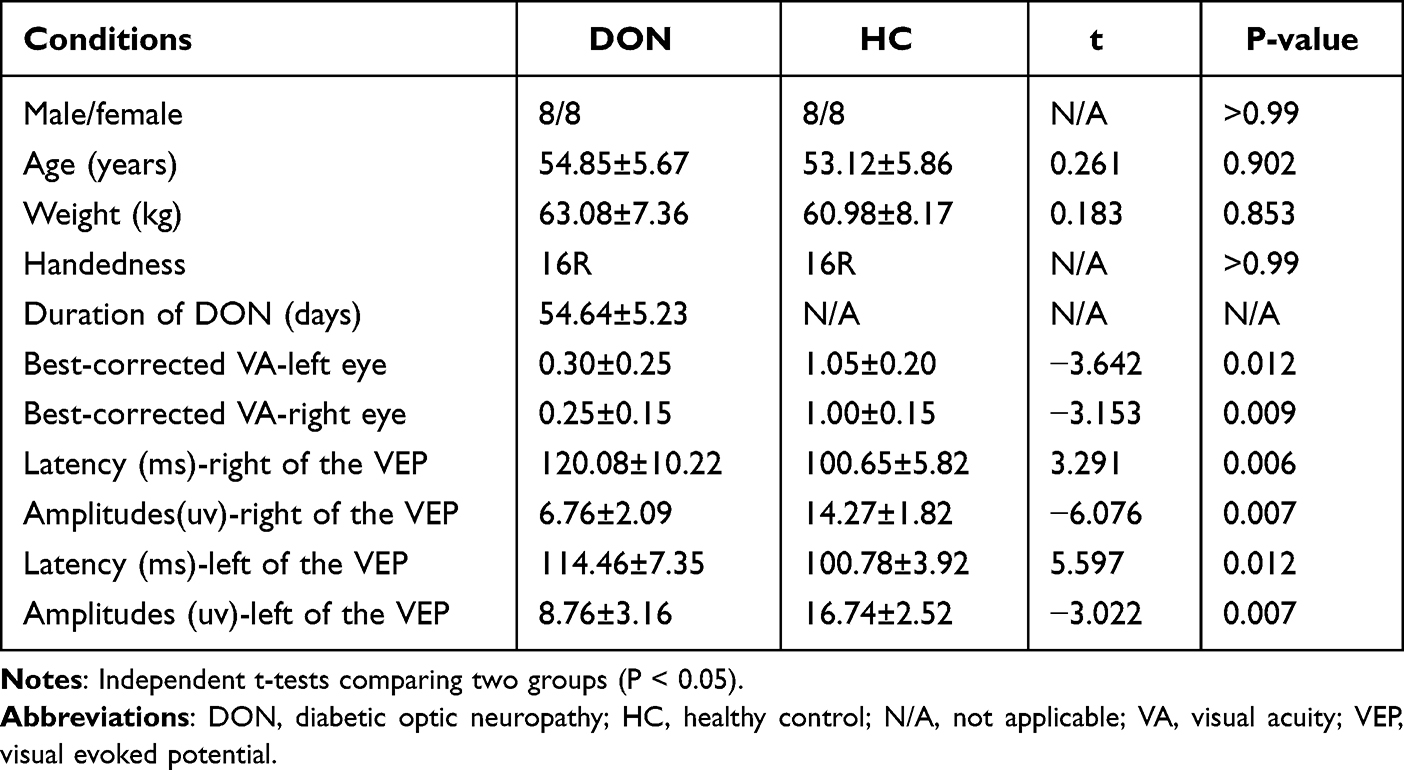 |
Table 1 Basic Information of Participants in the Study |
ALFF Differences
The DON group showed statistically higher ALFF value in the fusiform gyrus than the HC group; whereas, the ALFF values in the medial frontal gyrus/left frontal superior orbit/right frontal medial orbit, and left frontal inferior triangle decreased significantly in DON patients (Figure 2 and Table 2).
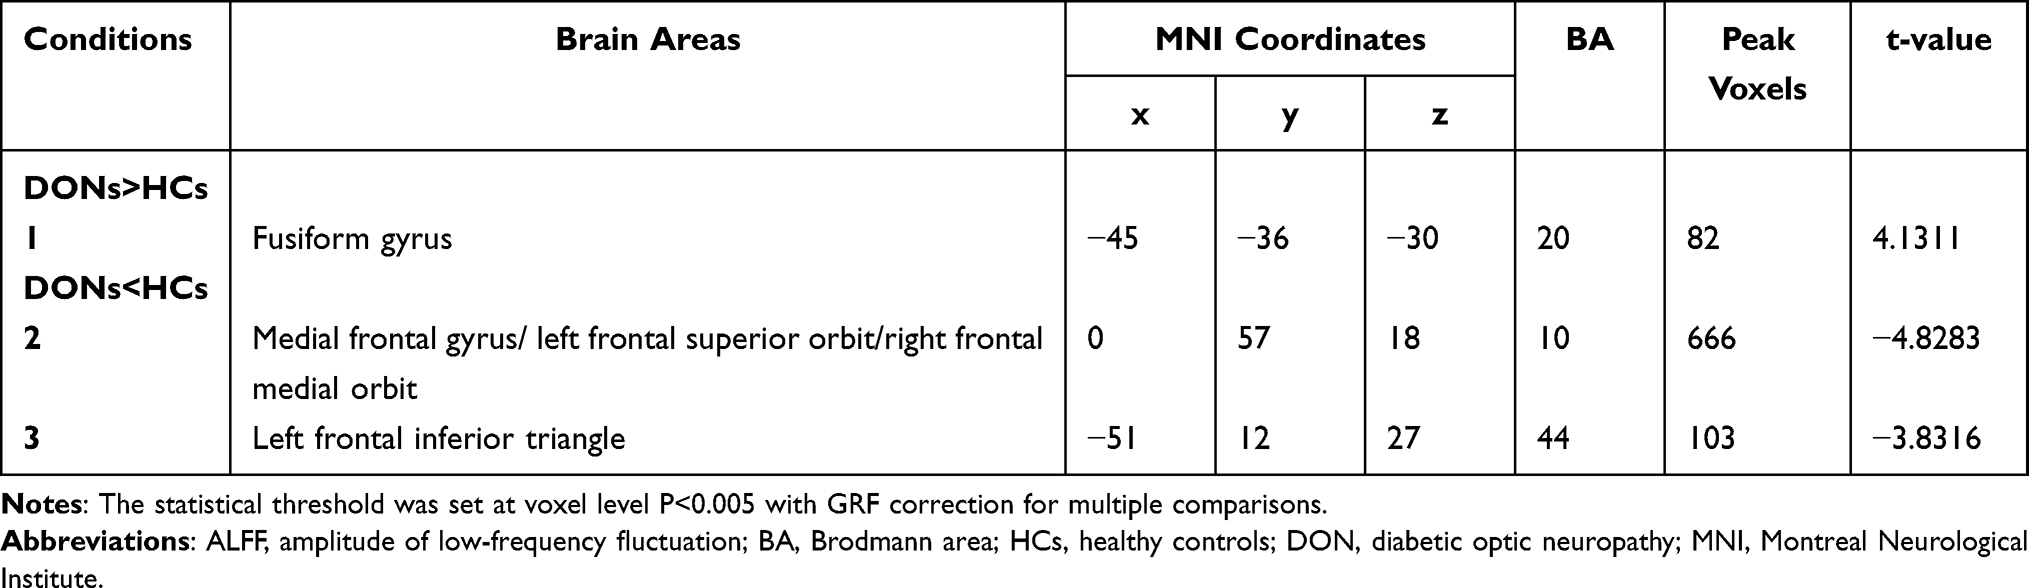 |
Table 2 Brain Areas with Significantly Different ALFF Values Between Groups |
 |
Figure 2 Significant differences of ALFF values between DON and HC groups. Abbreviations: DON, diabetic optic neuropathy; HCs, healthy controls; ALFF, amplitude of low‑frequency fluctuation; Frontal_Sup_Orb_L, left frontal superior orbit; Frontal_Med_Orb_R, right frontal medial orbit; Frontal_Inf_Tri_L, left frontal inferior triangle. Notes: (A) Differences in ALFF were found in fusiform gyrus, medial frontal gyrus/left frontal superior orbit/right frontal medial orbit, and left frontal inferior triangle. (B) The stereoscopic form of the cerebrum. The red area indicates an increase in ALFF value; the blue indicates a decrease in ALFF value. (C) The Mean ALFF value between DONs and control group. |
ROC Curve Analysis
The mean ALFF values of DON group and HC group were assessed by ROC curve. The AUCs were as follows: fusiform gyrus, 0.978, (p<0.001) (Figure 3A, DONs>HCs); medial frontal gyrus/left frontal superior orbit/right frontal medial orbit, 1 (p<0.001), left frontal inferior triangle, 0.951 (p<0.001; 95% CI: 0.876–1.000) (Figure 3B, DONs<HCs).
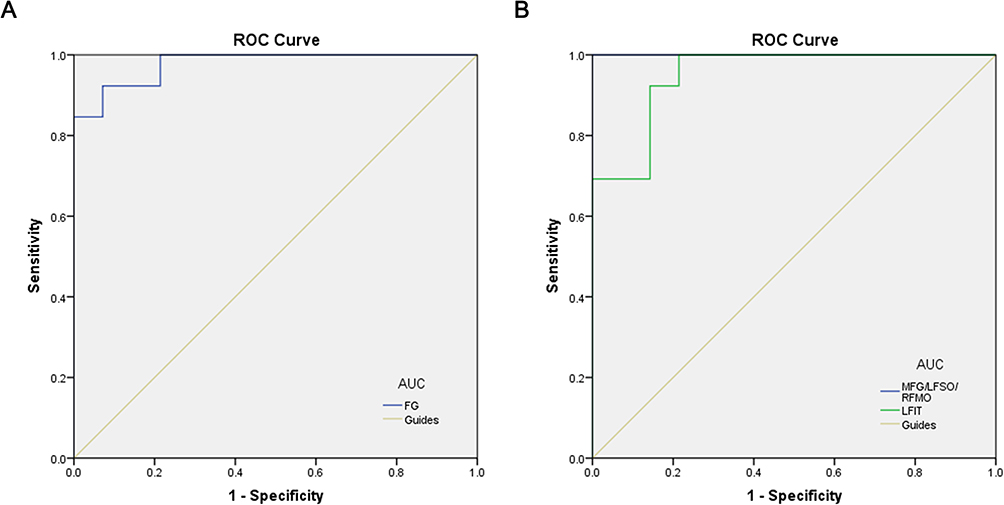 |
Figure 3 ROC curve analysis of the mean ALFF values for altered brain regions. Abbreviations: ALFF, amplitude of low-frequency fluctuation; ROC, receiver operating characteristic; FG, fusiform gyrus; MFG, medial frontal gyrus; LFSO, left frontal superior orbit; RFMO, right frontal medial orbit; LFIT, left frontal inferior triangle. Notes: (A) The area under the ROC curve were 0.978, (p<0.001; 95% CI: 0.934–1.000) for FG. (B) The area under the ROC curve were 1 (p<0.001; 95% CI: 1.000–1.000) for MFG/LFSO/RFMO; LFIT 0.951 (p<0.001; 95% CI: 0.876–1.000). |
Correlation Analysis
The ALFF value of the DON group in the medial frontal gyrus was negatively correlated with the depression scale (r=−0.951, P<0.001, Figure 4A) and the anxiety scale (r=−0.924, P<0.001, Figure 4B).
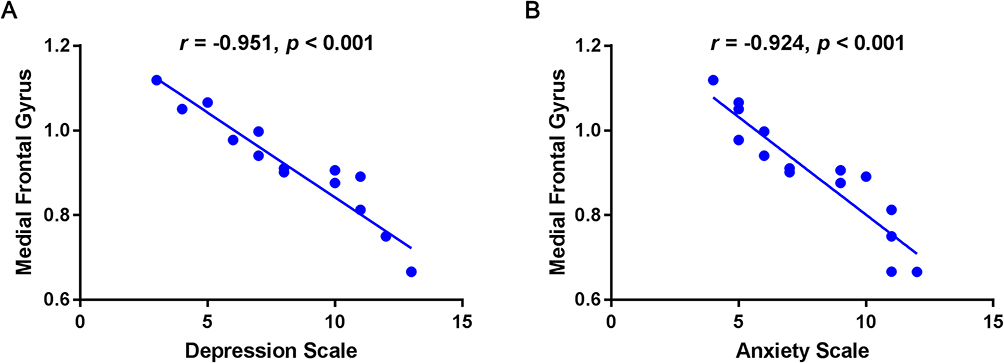 |
Figure 4 The correlation between the mean ALFF value of medial frontal gyrus and the Hads in DON group. Abbreviations: ALFF, amplitude of low-frequency fluctuation; HADS, Hospital Anxiety and Depression Scale; DON, diabetic optic neuropathy. Notes: (A) The depression scale showed a negative correlation with the ALFF value in the medial frontal gyrus (r=−0.951, P<0.001). (B) The anxiety scale showed a negative correlation with the ALFF value in the medial frontal gyrus (r=−0.924, P<0.001). |
Discussion
Diabetes can affect various organs in the human body and induce several macrovascular and microvascular complications including DR and neuropathy.28 Besides, huge variation in glucose levels and long-term duration may also lead to notable degradation in brain structure and function, ultimately resulting in dysfunction related to changes in neural connectivity,29 such as axonal demyelination and degeneration. Optic nerve ischemia can lead to retinopathy, thereby impairing the integrity.30 Studies have shown that the main reasons of optic neuropathology in diabetic rats were the decrease of the blood flow in optic nerve and the increase of optic nerve vascular permeability.31
Resting-state functional ALFF is a vital and helpful approach to investigate functional alterations in brain areas and unveil concealed pathological mechanism. This technique has been utilized in several research studies regarding ocular diseases, and represents an important aspect of rs-fMRI. It provides a further approach to understand the functional links between ophthalmic diseases and local spontaneous brain activity and can help us uncover the latent relationship between functional cerebral alteration and DON. In our study, ALFF values increased in the fusiform gyrus, which means the brain region is more active than the normal, indicating that there might be a compensatory process for some impaired function in other brain regions. ALFF values decreased in the medial frontal gyrus and left frontal inferior triangle when compared with the HC group (Figure 5), indicating that these regions might be dysfunctional in subjects with DON.
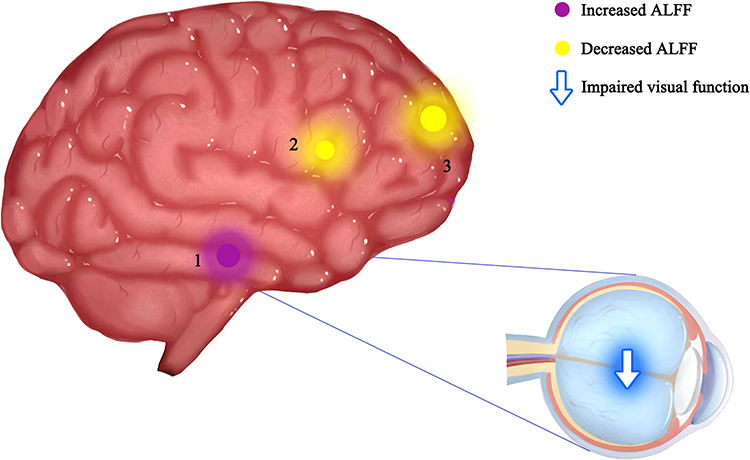 |
Figure 5 The ALFF results of brain activity in the DON group. Abbreviations: ALFF, amplitude of low-frequency fluctuation; DON, diabetic optic neuropathy; HCs, healthy controls. Notes: Compared with the HCs, the ALFF of the following regions were increased to various extents: 1-fusiform gyrus (t =4.1311), and decreased ALFF values in the 2-left frontal inferior triangle (t =−3.8316), 3-medial frontal gyrus (t = −4.8283). The sizes of the spots denote the degree of quantitative changes. |
The individual functions of each cerebral ROI are shown in Table 3, which is strongly associated with emotional processing and visual formation centers. The fusiform gyrus spans part of the temporal lobe and occipital lobe, it is also known as the lateral occipital temporal gyrus.32 This region of the brain has been implicated in high-level visual information processing, including recognition of face, object, color and words.33 Gao et al have proved that ALFF values of the fusiform gyrus significantly increased in retinal vein occlusion patients,34 while Huang et al discovered similar higher fusiform gyrus ALFF values in patients with optic neuritis.16 In addition, other fMRI researches of ophthalmological patients using other analysis methods also detected functional cerebral activation in the fusiform gyrus.35–37 In this study, DON patients showed significantly higher ALFF in the fusiform gyrus, which is consistent with previous results. The frontal inferior triangle is a triangular region of the inferior frontal gyrus and contributes to language comprehension. Lesions in this region may lead to characteristic findings of Broca’s aphasia.38,39 It has been proven that optic neuritis would show decreased ALFF values in the frontal inferior gyrus,16 as well as diabetic patients with vitreous hemorrhage.22 Moreover, lower activation in inferior frontal gyrus were also observed in patients after Lasik surgery40 and neuromyelitis optica.41 Our findings are in accordance with all the above ophthalmology-related diseases. However, our results are partially disparate from several articles on the same topic,24,42 mainly because the sample sizes in theses three articles were both relatively small, and the technologies used were different, which may cause the difference. The medial frontal gyrus and orbital gyri both belong to the prefrontal cortex, which covers the anterior part of the frontal lobe and participates in various critical cognitive and emotional processing tasks.43–46 Previous reports have shown that ALFF values significantly decreased in the medial frontal gyrus in several retinal diseases such as retinal detachment,19 retinal vein occlusion patients,23 and optic neuritis.16 Our results of decreased medial frontal gyrus further confirmed these findings. Besides, we also detected that the ALFF value in the medial frontal gyrus was negatively related to the depression scale and anxiety scale in the DON group. We presumed that visual impairment of DON would impact the normal daily life and then easily lead to emotional alterations such as anxiety and depression. Previous studies have shown that eye symptoms are related to depression and anxiety.47,48 Thus, aberrant neural activities might appear in cerebral areas related to emotional processing (Figure 6).
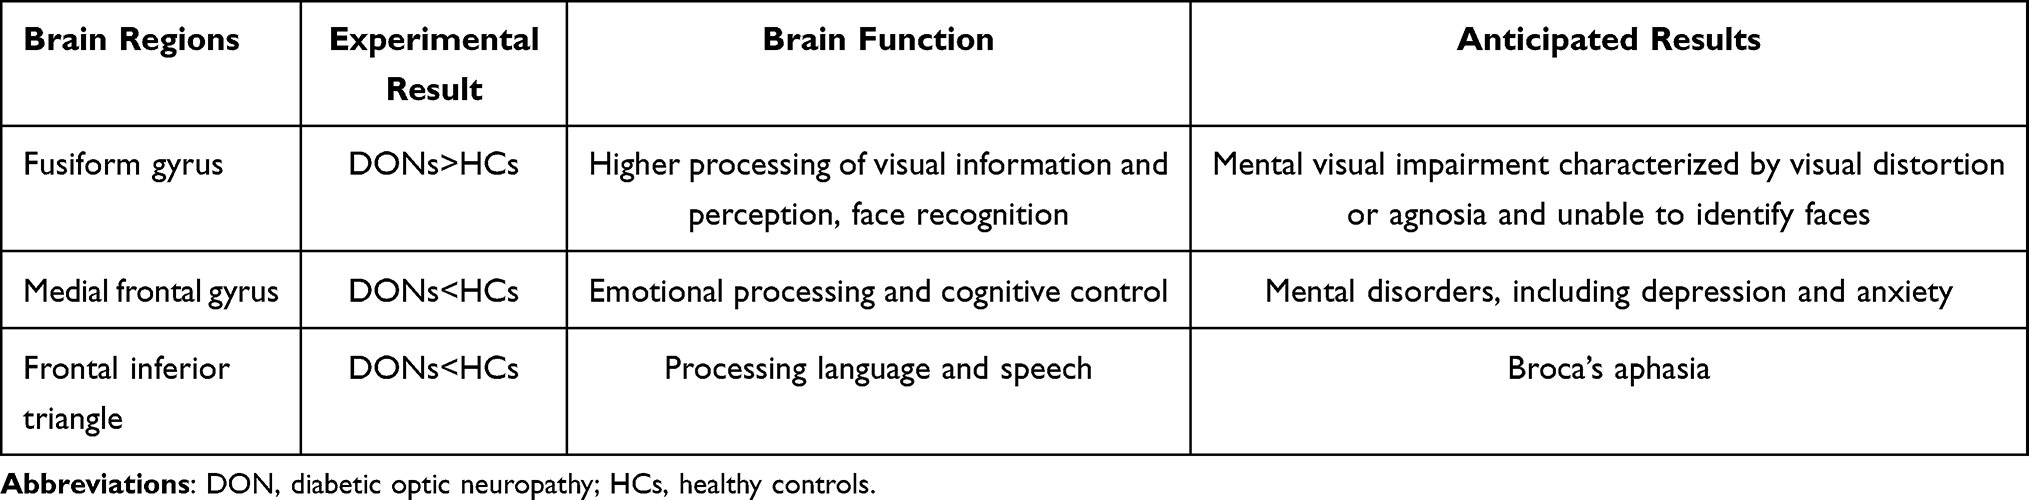 |
Table 3 Brain Regions Alternation and Its Potential Impact |
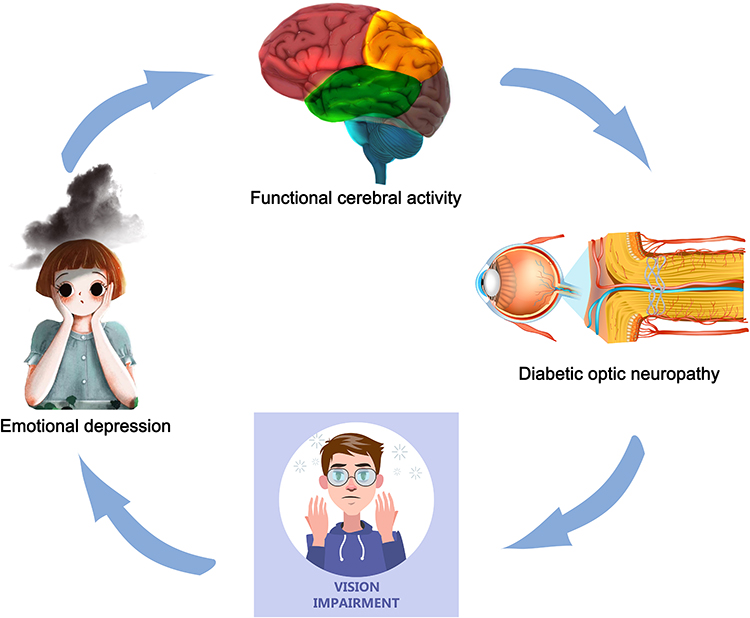 |
Figure 6 The relationship between ALFF values of the medial frontal gyrus and emotional status. Abbreviations: ALFF, amplitude of low-frequency fluctuation; DON, diabetic optic neuropathy; HCs, healthy controls. Notes: Compared with HCs, the ALFF values of the medial frontal gyrus were decreased and DON patients are more likely to have anxiety and depression. (Anxiety and depression are not critical symptoms of DON.). |
However, our study has some deficiencies. Firstly, the sample size is relatively small, which may lead to low repeatability of the results and excessive effect size. Secondly, the control of blood glucose was inevitably variable among individuals. Thirdly, these findings cannot interpret the specific pathogenesis of DON. Finally, whether the relation between ALFF and DON could be direct or mediated by anxiety and depression has not been fully addressed, we will compare DON patients and depression-matched controls in the future. Despite the above-mentioned limitations, this study showed that DON was relevant to the impairment observed in specific brain regions. Further research about the mechanism of nerve injury following alterations in brain activities should be conducted. We will conduct research including patients from different stages of DON and test the correlation between ALFF value in different brain regions and best-corrected vision in the future.
Conclusion
DON is a neurodegenerative disease involving multiple brain regions. In this study, we discovered abnormal activities of neurons in several specific brain regions, which would help to reveal the underlying neural mechanisms of brain activity related to DON and be valuable to early prediction, prevention and early diagnosis of DON.
Abbreviations
DON, diabetic optic neuropathy; HC, healthy control; N/A, not applicable; VA, visual acuity; VEP, visual evoked potential; DR, diabetic retinopathy; FFA, fundus fluorescein angiography; AUC, area under the curve; ALFF, amplitude of low-frequency fluctuation; BA, Brodmann area; MNI, Montreal Neurological Institute; Frontal_Sup_Orb_L, left frontal superior orbit; Frontal_Med_Orb_R, right frontal medial orbit; Frontal_Inf_Tri_L, left frontal inferior triangle; ROC, receiver operating characteristic; FG, fusiform gyrus; MFG, medial frontal gyrus; LFSO, left frontal superior orbit; RFMO, right frontal medial orbit; LFIT, left frontal inferior triangle; HADS, Hospital Anxiety and Depression Scale.
Ethical Approval and Consent to Participate
The study methods and protocols were approved by the Medical Ethics Committee of the First Affiliated Hospital of Nanchang University (Nanchang, China) and followed the principles of the Declaration of Helsinki. All subjects were notified of the objectives and content of the study and latent risks, and then provided written informed consent to participate.
Author Contributions
All authors made a significant contribution to the work reported, whether that is in the conception, study design, execution, acquisition of data, analysis and interpretation, or in all these areas; took part in drafting, revising or critically reviewing the article; gave final approval of the version to be published; have agreed on the journal to which the article has been submitted; and agree to be accountable for all aspects of the work.
Funding
National Natural Science Foundation (No: 82160195); Central Government Guides Local Science and Technology Development Foundation (No: 20211ZDG02003); Key Research Foundation of Jiangxi Province (No: 20181BBG70004, 20203BBG73059); Excellent Talents Development Project of Jiangxi Province (No: 20192BCBL23020); Natural Science Foundation of Jiangxi Province (No: 20181BAB205034).
Disclosure
The authors have no competing interests to declare regarding this study.
References
1. Hosseini Z, Whiting SJ, Vatanparast H. Type 2 diabetes prevalence among Canadian adults - dietary habits and sociodemographic risk factors. Appl Physiol Nutr Metab. 2019;44(10):1099–1104. doi:10.1139/apnm-2018-0567
2. Shin JY. Trends in the prevalence and management of diabetes in Korea: 2007–2017. Epidemiol Health. 2019;41:e2019029. doi:10.4178/epih.e2019029
3. Pradeepa R, Mohan V. Prevalence of type 2 diabetes and its complications in India and economic costs to the nation. Eur J Clin Nutr. 2017;71(7):816–824. doi:10.1038/ejcn.2017.40
4. Giuliari GP, Sadaka A, Y. Chang P, et al. Diabetic papillopathy: current and new treatment options. Curr Diabetes Rev. 2011;7(3):171–175. doi:10.2174/157339911795843122
5. Hua R, Qu L, Ma B, et al. Diabetic optic neuropathy and its risk factors in Chinese patients with diabetic retinopathy. Invest Ophthalmol Vis Sci. 2019;60(10):3514–3519. doi:10.1167/iovs.19-26825
6. BELL LG. Diabetic optic neuropathy. Trans Ophthalmol Soc N Z. 1956–1957;9:25–30. PMID: 13496160.
7. Moro F, Doro D. Diabetic optic neuropathies: clinical features. Metab Pediatr Syst Ophthalmol. 1986;9(2–4):65–70.
8. Biswal BB. Resting state fMRI: a personal history. Neuroimage. 2012;62(2):938–944. doi:10.1016/j.neuroimage.2012.01.090
9. Lv H, Wang Z, Tong E, et al. Resting-state functional MRI: everything that nonexperts have always wanted to know. AJNR Am J Neuroradiol. 2018;39(8):1390–1399. PMID: 29348136; PMCID: PMC6051935. doi:10.3174/ajnr.A5527
10. Li T, Liu Z, Li J, et al. Altered amplitude of low-frequency fluctuation in primary open-angle glaucoma: a resting-state FMRI study. Invest Ophthalmol Vis Sci. 2014;56(1):322–329. doi:10.1167/iovs.14-14974
11. Huang X, Zhong Y-L, Zeng X-J, et al. Disturbed spontaneous brain activity pattern in patients with primary angle-closure glaucoma using amplitude of low-frequency fluctuation: a fMRI study. Neuropsychiatr Dis Treat. 2015;11:1877–1883. doi:10.2147/NDT.S87596
12. Peng ZY, Liu Y-X, Li B, et al. Altered spontaneous brain activity patterns in patients with neovascular glaucoma using amplitude of low-frequency fluctuations: a functional magnetic resonance imaging study. Brain Behav. 2021;11(3):e02018. doi:10.1002/brb3.2018
13. Huang X, Zhou F-Q, Hu Y-X, et al. Altered spontaneous brain activity pattern in patients with high myopia using amplitude of low-frequency fluctuation: a resting-state fMRI study. Neuropsychiatr Dis Treat. 2016;12:2949–2956. doi:10.2147/NDT.S118326
14. Min YL, Su T, Shu Y-Q, et al. Altered spontaneous brain activity patterns in strabismus with amblyopia patients using amplitude of low-frequency fluctuation: a resting-state fMRI study. Neuropsychiatr Dis Treat. 2018;14:2351–2359. doi:10.2147/NDT.S171462
15. Tan G, Huang X, Zhang Y, et al. A functional MRI study of altered spontaneous brain activity pattern in patients with congenital comitant strabismus using amplitude of low-frequency fluctuation. Neuropsychiatr Dis Treat. 2016;12:1243–1250. doi:10.2147/NDT.S104756
16. Huang X, Cai F-Q, Hu P-H, et al. Disturbed spontaneous brain-activity pattern in patients with optic neuritis using amplitude of low-frequency fluctuation: a functional magnetic resonance imaging study. Neuropsychiatr Dis Treat. 2015;11:3075–3083. doi:10.2147/NDT.S92497
17. Tan G, Tan G, Huang X, et al. Altered spontaneous brain activity patterns in patients with unilateral acute open globe injury using amplitude of low-frequency fluctuation: a functional magnetic resonance imaging study. Neuropsychiatr Dis Treat. 2016;12:2015–2020. doi:10.2147/NDT.S110539
18. Li Q, Huang X, Ye L, et al. Altered spontaneous brain activity pattern in patients with late monocular blindness in middle-age using amplitude of low-frequency fluctuation: a resting-state functional MRI study. Clin Interv Aging. 2016;11:1773–1780. doi:10.2147/CIA.S117292
19. Pan ZM, Li H-J, Bao J, et al. Altered intrinsic brain activities in patients with acute eye pain using amplitude of low-frequency fluctuation: a resting-state fMRI study. Neuropsychiatr Dis Treat. 2018;14:251–257. doi:10.2147/NDT.S150051
20. Kang HH, Shu Y-Q, Yang L, et al. Measuring abnormal intrinsic brain activities in patients with retinal detachment using amplitude of low-frequency fluctuation: a resting-state fMRI study. Int J Neurosci. 2019;129(7):681–686. doi:10.1080/00207454.2018.1554657
21. Qi CX, Huang X, Shen Y. Altered intrinsic brain activities in patients with diabetic retinopathy using amplitude of low-frequency fluctuation: a resting-state fMRI study. Diabetes Metab Syndr Obes. 2020;13:2833–2842. doi:10.2147/DMSO.S259476
22. Shi WQ, Tang L, Lin Q, et al. Altered spontaneous brain activity patterns in diabetic patients with vitreous hemorrhage using amplitude of low‑frequency fluctuation: a resting‑state fMRI study. Mol Med Rep. 2020;22(3):2291–2299. doi:10.3892/mmr.2020.11294
23. Wu YY, Yuan Q, Li B, et al. Altered spontaneous brain activity patterns in patients with retinal vein occlusion indicated by the amplitude of low-frequency fluctuation: a functional magnetic resonance imaging study. Exp Ther Med. 2019;18(3):2063–2071. PMID: 31410162; PMCID: PMC6676080. doi:10.3892/etm.2019.7770
24. Jiang YP, Liu WF, Pan YC, et al. The abnormal fractional amplitude of low-frequency fluctuation changes in patients with diabetic optic neuropathy: a steady-state fMRI study. J Integr Neurosci. 2021;20(4):885–893. PMID: 34997712. doi:10.31083/j.jin2004090
25. Kuo HK, Kuo MT, Tiong IS, Wu PC, Chen YJ, Chen CH. Visual acuity as measured with Landolt C chart and Early Treatment of Diabetic Retinopathy Study (ETDRS) chart. Graefes Arch Clin Exp Ophthalmol. 2011;249(4):601–605. PMID: 20658145. doi:10.1007/s00417-010-1461-3
26. Firan AM, Istrate S, Iancu R, Tudosescu R, Ciuluvică R, Voinea L. Visual evoked potential in the early diagnosis of glaucoma. Literature review. Rom J Ophthalmol. 2020;64(1):15–20. PMID: 32292852; PMCID: PMC7141918. doi:10.22336/rjo.2020.4
27. Park SH, Goo JM, Jo CH. Receiver operating characteristic (ROC) curve: practical review for radiologists. Korean J Radiol. 2004;5(1):11–18. PMID: 15064554; PMCID: PMC2698108. doi:10.3348/kjr.2004.5.1.11
28. Cole JB, Florez JC. Genetics of diabetes mellitus and diabetes complications. Nat Rev Nephrol. 2020;16(7):377–390. doi:10.1038/s41581-020-0278-5
29. van Duinkerken E, Schoonheim MM, Sanz-Arigita EJ, et al. Resting-state brain networks in type 1 diabetic patients with and without microangiopathy and their relation to cognitive functions and disease variables. Diabetes. 2012;61(7):1814–1821. doi:10.2337/db11-1358
30. Zhang C, Guo Y, Slater BJ, et al. Axonal degeneration, regeneration and ganglion cell death in a rodent model of anterior ischemic optic neuropathy (rAION). Exp Eye Res. 2010;91(2):286–292. doi:10.1016/j.exer.2010.05.021
31. Xu QH, Li Q-Y, Yu K, et al. Altered brain network centrality in patients with diabetic optic neuropathy: a resting-state fMRI study. Endocr Pract. 2020;26(12):1399–1405. doi:10.4158/EP-2020-0045
32. Sebastian R, Gomez Y, Leigh R, et al. The roles of occipitotemporal cortex in reading, spelling, and naming. Cogn Neuropsychol. 2014;31(5–6):511–528. doi:10.1080/02643294.2014.884060
33. Weiner KS, Zilles K. The anatomical and functional specialization of the fusiform gyrus. Neuropsychologia. 2016;83:48–62. doi:10.1016/j.neuropsychologia.2015.06.033
34. Gao Q, Peng B, Huang X, et al. Assessment of cerebral low-frequency oscillations in patients with retinal vein occlusion: a preliminary functional MRI study. Acta Radiol. 2020;61(6):813–820. doi:10.1177/0284185119879683
35. Shao Y, Cai F, Zhong Y, et al. Altered intrinsic regional spontaneous brain activity in patients with optic neuritis: a resting-state functional magnetic resonance imaging study. Neuropsychiatr Dis Treat. 2015;11:3065–3073. doi:10.2147/NDT.S92968
36. Li J, Zhang W, Wang X, et al. Functional magnetic resonance imaging reveals differences in brain activation in response to thermal stimuli in diabetic patients with and without diabetic peripheral neuropathy. PLoS One. 2018;13(1):e0190699. doi:10.1371/journal.pone.0190699
37. Wang ZL, Zou L, Lu Z-W, et al. Abnormal spontaneous brain activity in type 2 diabetic retinopathy revealed by amplitude of low-frequency fluctuations: a resting-state fMRI study. Clin Radiol. 2017;72(4):
38. Friederici AD. The brain basis of language processing: from structure to function. Physiol Rev. 2011;91(4):1357–1392. doi:10.1152/physrev.00006.2011
39. Du J, Rolls ET, Cheng W, et al. Functional connectivity of the orbitofrontal cortex, anterior cingulate cortex, and inferior frontal gyrus in humans. Cortex. 2020;123:185–199. doi:10.1016/j.cortex.2019.10.012
40. Yu YJ, Liang R-B, Yang Q-C, et al. Altered spontaneous brain activity patterns in patients after lasik surgery using amplitude of low-frequency fluctuation: a resting-state functional MRI study. Neuropsychiatr Dis Treat. 2020;16:1907–1917. doi:10.2147/NDT.S252850
41. Wang F, Liu Y, Li J, et al. Abnormal brain function in neuromyelitis optica: a fMRI investigation of mPASAT. Eur J Radiol. 2017;95:197–201. doi:10.1016/j.ejrad.2017.08.012
42. Yang L, Xiao A, Li QY, et al. Hyperintensities of middle frontal gyrus in patients with diabetic optic neuropathy: a dynamic amplitude of low-frequency fluctuation study. Aging. 2022;14(3):1336–1350. doi:10.18632/aging.203877
43. Teffer K, Semendeferi K. Human prefrontal cortex: evolution, development, and pathology. Prog Brain Res. 2012;195:191–218.
44. Dixon ML, Thiruchselvam R, Todd R, et al. Emotion and the prefrontal cortex: an integrative review. Psychol Bull. 2017;143(10):1033–1081. doi:10.1037/bul0000096
45. Ridderinkhof KR, Ullsperger M, Crone EA, et al. The role of the medial frontal cortex in cognitive control. Science. 2004;306(5695):443–447. doi:10.1126/science.1100301
46. Amodio DM, Frith CD. Meeting of minds: the medial frontal cortex and social cognition. Nat Rev Neurosci. 2006;7(4):268–277. doi:10.1038/nrn1884
47. Wang Y, Shao Y, Shi WQ, et al. The predictive potential of altered spontaneous brain activity patterns in diabetic retinopathy and nephropathy. EPMA J. 2019;10(3):249–259. doi:10.1007/s13167-019-00171-4
48. Wan KH, Chen LJ, Young AL. Depression and anxiety in dry eye disease: a systematic review and meta-analysis. Eye. 2016;30(12):1558–1567. PMID: 27518547; PMCID: PMC5177754. doi:10.1038/eye.2016.186
 © 2023 The Author(s). This work is published and licensed by Dove Medical Press Limited. The
full terms of this license are available at https://www.dovepress.com/terms
and incorporate the Creative Commons Attribution
- Non Commercial (unported, 3.0) License.
By accessing the work you hereby accept the Terms. Non-commercial uses of the work are permitted
without any further permission from Dove Medical Press Limited, provided the work is properly
attributed. For permission for commercial use of this work, please see paragraphs 4.2 and 5 of our Terms.
© 2023 The Author(s). This work is published and licensed by Dove Medical Press Limited. The
full terms of this license are available at https://www.dovepress.com/terms
and incorporate the Creative Commons Attribution
- Non Commercial (unported, 3.0) License.
By accessing the work you hereby accept the Terms. Non-commercial uses of the work are permitted
without any further permission from Dove Medical Press Limited, provided the work is properly
attributed. For permission for commercial use of this work, please see paragraphs 4.2 and 5 of our Terms.