Back to Journals » Neuropsychiatric Disease and Treatment » Volume 12
Altered lower leg muscle activation patterns in patients with cerebral palsy during cycling on an ergometer
Authors Alves-Pinto A, Blumenstein T, Turova V ![]() , Lampe R
, Lampe R
Received 14 October 2015
Accepted for publication 11 March 2016
Published 17 June 2016 Volume 2016:12 Pages 1445—1456
DOI https://doi.org/10.2147/NDT.S98260
Checked for plagiarism Yes
Review by Single anonymous peer review
Peer reviewer comments 3
Editor who approved publication: Dr Roger Pinder
Ana Alves-Pinto,1,* Tobias Blumenstein,1,* Varvara Turova,1 Renée Lampe1,2
1Research Unit of the Buhl-Strohmaier Foundation for Cerebral Palsy and Paediatric Neuroorthopaedics, Orthopaedic Department, Klinikum rechts der Isar, 2Markus Würth Professorship, Technical University of Munich, Munich, Germany
*These authors contributed equally to this work
Objective: Cycling on a recumbent ergometer constitutes one of the most popular rehabilitation exercises in cerebral palsy (CP). However, no control is performed on how muscles are being used during training. Given that patients with CP present altered muscular activity patterns during cycling or walking, it is possible that an incorrect pattern of muscle activation is being promoted during rehabilitation cycling. This study investigated patterns of muscular activation during cycling on a recumbent ergometer in patients with CP and whether those patterns are determined by the degree of spasticity and of mobility.
Methods: Electromyographic (EMG) recordings of lower leg muscle activation during cycling on a recumbent ergometer were performed in 14 adult patients diagnosed with CP and five adult healthy participants. EMG recordings were done with an eight-channel EMG system built in the laboratory. The activity of the following muscles was recorded: Musculus rectus femoris, Musculus biceps femoris, Musculus tibialis anterior, and Musculus gastrocnemius. The degree of muscle spasticity and mobility was assessed using the Modified Ashworth Scale and the Gross Motor Function Classification System, respectively. Muscle activation patterns were described in terms of onset and duration of activation as well as duration of cocontractions.
Results: Muscle activation in CP was characterized by earlier onsets, longer periods of activation, a higher occurrence of agonist–antagonist cocontractions, and a more variable cycling tempo in comparison to healthy participants. The degree of altered muscle activation pattern correlated significantly with the degree of spasticity.
Conclusion: This study confirmed the occurrence of altered lower leg muscle activation patterns in patients with CP during cycling on a recumbent ergometer. There is a need to develop feedback systems that can inform patients and therapists of an incorrect muscle activation during cycling and support the training of a more physiological activation pattern.
Keywords: electromyography, rehabilitation, cocontraction, spasticity, mobility
Introduction
Cerebral palsy (CP) comprehends a complex group of orthopedic and neurologic symptoms resulting from damage to the brain during development – before, during, or after birth.1,2 Motor impairments constitute the main symptom of this condition, often with occurrence of joint malposition and contraction, muscle spasticity, and muscle cocontractions. However, depending on the degree of damage and areas affected, motor disorders can be accompanied by learning difficulties,3 epilepsy,4 and perception deficits.5–7
Motor difficulties in patients with CP lead often to reduced physical activity, reduced muscular mass, and stronger degree of joint contraction. These signs are typically tackled in rehabilitation programs by physical exercising in an exercise trainer.8,9 Exercising is especially important for patients who cannot stand nor move autonomously and who use lower leg muscles seldom. Several models of ergometers make it possible for patients to exercise without leaving their wheelchair. However, despite cycling trainers being commonly used to strengthen muscular tone in patients with CP, there is no control of the way that the movement is being performed and whether the correct muscular activity is being trained or if instead an incorrect dynamic pattern of muscular activation is being promoted. In effect, previous electromyography (EMG) studies of lower leg muscular activity during cycling have shown altered activation patterns in patients with CP in relation to healthy subjects.10 Muscular activation was observed to typically start earlier and stay for longer than in healthy controls.11–13 In addition, cocontractions were more often detected in patients with CP, and the tempo of the cycling movement was altered, with patients requiring more time to perform the parts of the cycling movement where there is a change of direction of movement, from front to back and vice versa.11 Similar deviations in the timing of muscle activity detected with EMG measurements during cycling have been also obtained during walking.14,15
Some of the previous EMG studies were conducted in a standard bicycle, where the participant’s seating position requires a different weight balance and muscle use than when the patient cycles on an ergometer, in a recumbent position. The latter is the most common position during physical rehabilitation exercises, especially in the most severe cases of CP.
This study aimed therefore at investigating muscle dynamic activation patterns during cycling on a recumbent ergometer in patients with CP. EMG measurements were performed by an EMG system developed in the laboratory, so as to have a better control of the recording process of muscular activity and of signal analysis than with a commercial system.
Given the high occurrence of spasticity in CP, the extent to which different features of altered muscular activity are determined by the degree of spasticity, as measured clinically through the Modified Ashworth Spasticity (MAS) scale,16 was evaluated. Also, the influence of the mobility level, Gross Motor Function Classification System (GMFCS) on altered muscular activity was analyzed. This study was aimed also as a starting point for the future development of a feedback system for training correct muscular use.
Methods
Design
Leg muscle activity during cycling on an ergometer was measured in two groups of participants: 1) a test group of 14 adults with CP and 2) a reference group of five healthy patients. The latter group provided reference measures of muscular activation patterns during cycling on an ergometer. Outcome measures derived from the EMG recordings were correlated with the GMFCS level, expressing patients’ mobility, and the MAS, measuring the degree of leg spasticity.
All experimental procedures were approved by the ethics committee of the Faculty of Medicine of the Technical University of Munich before starting data collection. Participation in the study was voluntary, and all subjects, or in some cases their legal protectors, gave their written informed consent before performing the tests.
Recruitment
Patients were recruited from a day care center for persons with disabilities in Munich. Healthy adult participants were recruited among the personnel working at the laboratory and at the hospital.
Participants
Participants in the test group were aged between 23 years and 60 years, with the group’s average age being 42.6 years (Table 1). Healthy adults were aged between 25 years and 40 years.
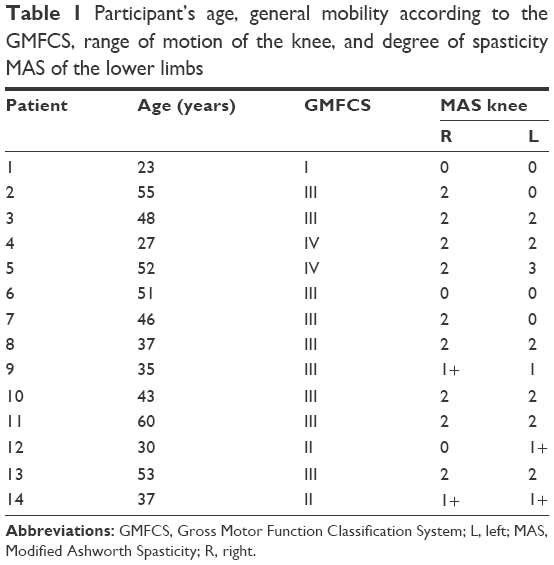 | Table 1 Participant’s age, general mobility according to the GMFCS, range of motion of the knee, and degree of spasticity MAS of the lower limbs |
Outcome measures
The degree of mobility was classified according to the GMFCS.1 This varies from a GMFCS of I when the patient can walk freely without the need of a walking aid to a GMFCS of V when patients have substantial motor limitations and seat permanently in a wheelchair that they cannot move by themselves. GMFCS levels in the test group varied from GMFCS of I to GMFCS of IV.
The degree of muscle spasticity was assessed according to the Modified Ashworth Spasticity Scale.16 This test measures the velocity-dependent resistance of the muscle against passive movement. The scale ranges from 0 to 4, with level 4 corresponding to the highest degree of spasticity.
Muscle activity during cycling was measured for each muscle with an eight-channel EMG system built in the laboratory. Analysis was based on the following variables derived from the recorded EMG activity as described in more detail below: 1) the onset of muscular activation, 2) the duration of muscle activation period, 3) the B factor, a measure of the difference between the test and reference groups in terms of temporal properties of muscular activation (“Data analysis” section), and 4) the cocontraction factor K, a ratio value reflecting the temporal duration of cocontractions (“Data analysis” section).
Experimental setup
Muscle activity was measured during cycling on the ergometer Movanimo© developed by the company Paravan (Aichelau, Germany). This trainer allows patients with severe motor deficits to cycle while seating in a chair or even in their own wheelchair. The foot was strapped to the bicycle foot support, but the latter was not fixed and could move freely. A distance sensor mounted in the trainer registered the height of four reflectors mounted on the trainer-wheel at different heights. With this reflector + sensor system, the position of the foot during cycling could be determined and synchronized with the EMG recording. A schematic illustration of the definition of foot position and of the participants’ position during recording is shown in Figure 1. The circular path traveled by a foot during cycling allows the definition of foot position as the angle relative to the position where the right foot reaches maximum height. This latter point defined the 0° angle (Figure 1, left panel). The distance of the participant to the ergometer was adjusted such that when the foot was at 90°, the leg stretched to make an “upper leg-to-lower leg” angle of 170° (Figure 1, right panel).
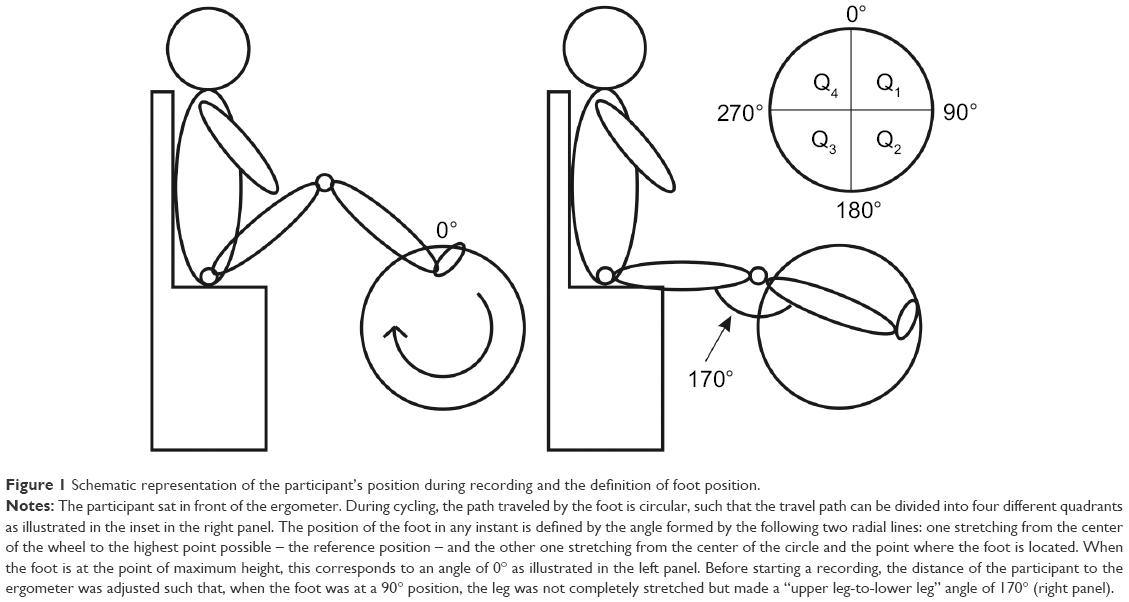 | Figure 1 Schematic representation of the participant’s position during recording and the definition of foot position. |
The level of resistance in the ergometer was set such that the participant could cycle and move the wheel on his own, without external help. During recordings, participants were asked to cycle as regularly as possible. The cycling speed was displayed in the monitor of the ergometer.
Before placing the EMG electrodes, the skin was scrubbed with an alcohol-containing cleansing liquid. A contact gel was used between the electrode and the skin to improve electrical conductance. EMG recordings were done in the following four muscles in each leg (ie, eight muscles in total): 1) the Musculus tibialis anterior, 2) the Musculus gastrocnemius, 3) the Musculus rectus femoris, and 4) Musculus biceps femoris. Electrode placement followed the SENIAM European Recommendations for Surface Electromyography.17 Electrodes were placed as much as possible in the central, bulgy part of the muscle making sure that they were 30 mm apart from each other. The reference electrodes were placed in the patella.
Data analysis
The electrical potential generated by muscle cells was hardware preprocessed directly in the EMG system before saving the data. The signal was first amplified, half-wave rectified, and then smoothed using an active low-pass filter with a cutoff frequency of ~2 Hz. The signal was again amplified before being digitized with a 77 Hz sample rate. The envelope of the signal (and not the raw signal) was saved for offline analysis in LabVIEW®.
The continuously recorded muscle activity signal was divided into full-revolution periods (360° epochs). If on visual inspection the recordings showed large irregularities throughout the cycle, they were excluded from further analysis. Analyzed signals were obtained by averaging over at least 15 complete and valid revolutions. The direct current (DC) offset was removed from the mean signal. Recordings for which the mean voltage in a full revolution did not exceed 0.02 V were considered invalid and excluded from the analysis. These represented, however, a small proportion of the recordings. Of the total 144 recorded revolutions, 103 (72%) fulfilled the criteria and were analyzed further. The mean EMG signal obtained for each muscle was furthermore normalized to the peak amplitude registered for each muscle. Although this normalization procedure invalidates the direct comparison of muscle activity levels (ie, EMG amplitude values) between participants, comparison of temporal properties of muscular activation remained possible.18 Example recorded and averaged EMG signals are represented in Figure 2.
 | Figure 2 EMG signal amplitude recorded in each turning cycle from the left Musculus rectus (blue lines) and the average muscle activity (red line) computed over all valid full revolutions recorded. |
Reference EMG measures, obtained from recordings with healthy participants, were determined by averaging, for each given muscle, valid recorded signals across epochs and across legs.
The onset and offset points of muscle activation period during cycling were defined for each muscle from the average EMG signal as the points defining the full width at half maximum (FWMH), as illustrated in Figure 3. This measure of muscle activation does not depend on absolute values of signal amplitude but is defined relative to a participant’s own EMG signal.
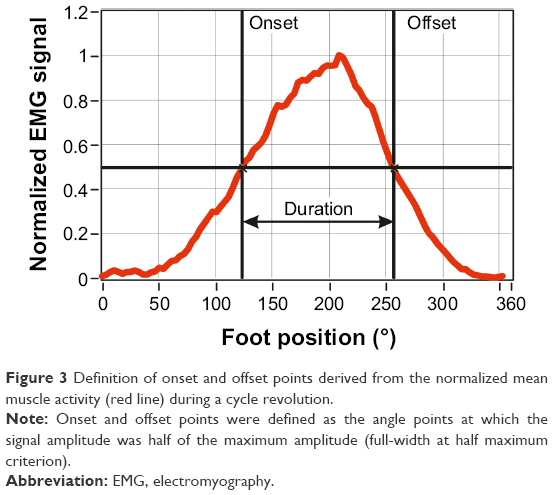 | Figure 3 Definition of onset and offset points derived from the normalized mean muscle activity (red line) during a cycle revolution. |
The onset, offset, and duration of muscle activation were determined according to the full width at half maximum criterion mentioned earlier for each muscle for each participant. Also determined was the position of the leg/foot, relative to the 0° position (Figure 1), at the onset and offset points, and during the period the muscle was active.
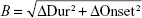
In order to explore a potential correlation between the degree of altered range of muscular activation with the degree of motor impairment GMFCS and of muscle spasticity MAS, a variable B was defined for each patient, from the difference in the onset of activation ΔOnset and in the duration of activation ΔDur, calculated between a patient and the average from the group of healthy participants. B was defined as an Euclidean distance as follows:
|
|
The extent of cocontractions is described here by a factor K that is the ratio between the length of simultaneous activation of agonist and antagonist muscles ΔL (angle units) and the summed periods of activation (angle units) computed from both muscles L1 and L2
|
|

The K factor ranges from K =0, when there is no simultaneous activation between the agonist and antagonist muscles (ΔL =0), and K =1, when both muscles are simultaneously active during the same period of time (ΔL = L1 + L2).
The effect of MAS on the values of B was analyzed with nonparametric statistical tests (Kruskal–Wallis test) and multivariate linear regression.
Results
The periods of muscular activation during cycling are illustrated in Figure 4, for each of the eight muscles of the lower legs (one panel – one muscle; left and right columns corresponding to the left and right legs, respectively) and for each participant (one circumference – one participant). Average EMG activity in healthy participants is represented in blue, and average EMG activity in patients is represented in red/orange. Gray circle segments indicate parts of the cycle path where muscle activation was identified in healthy subjects. The percentage of the revolution cycle during which a muscle was active, averaged across participants in each group, is summarized in Table 2.
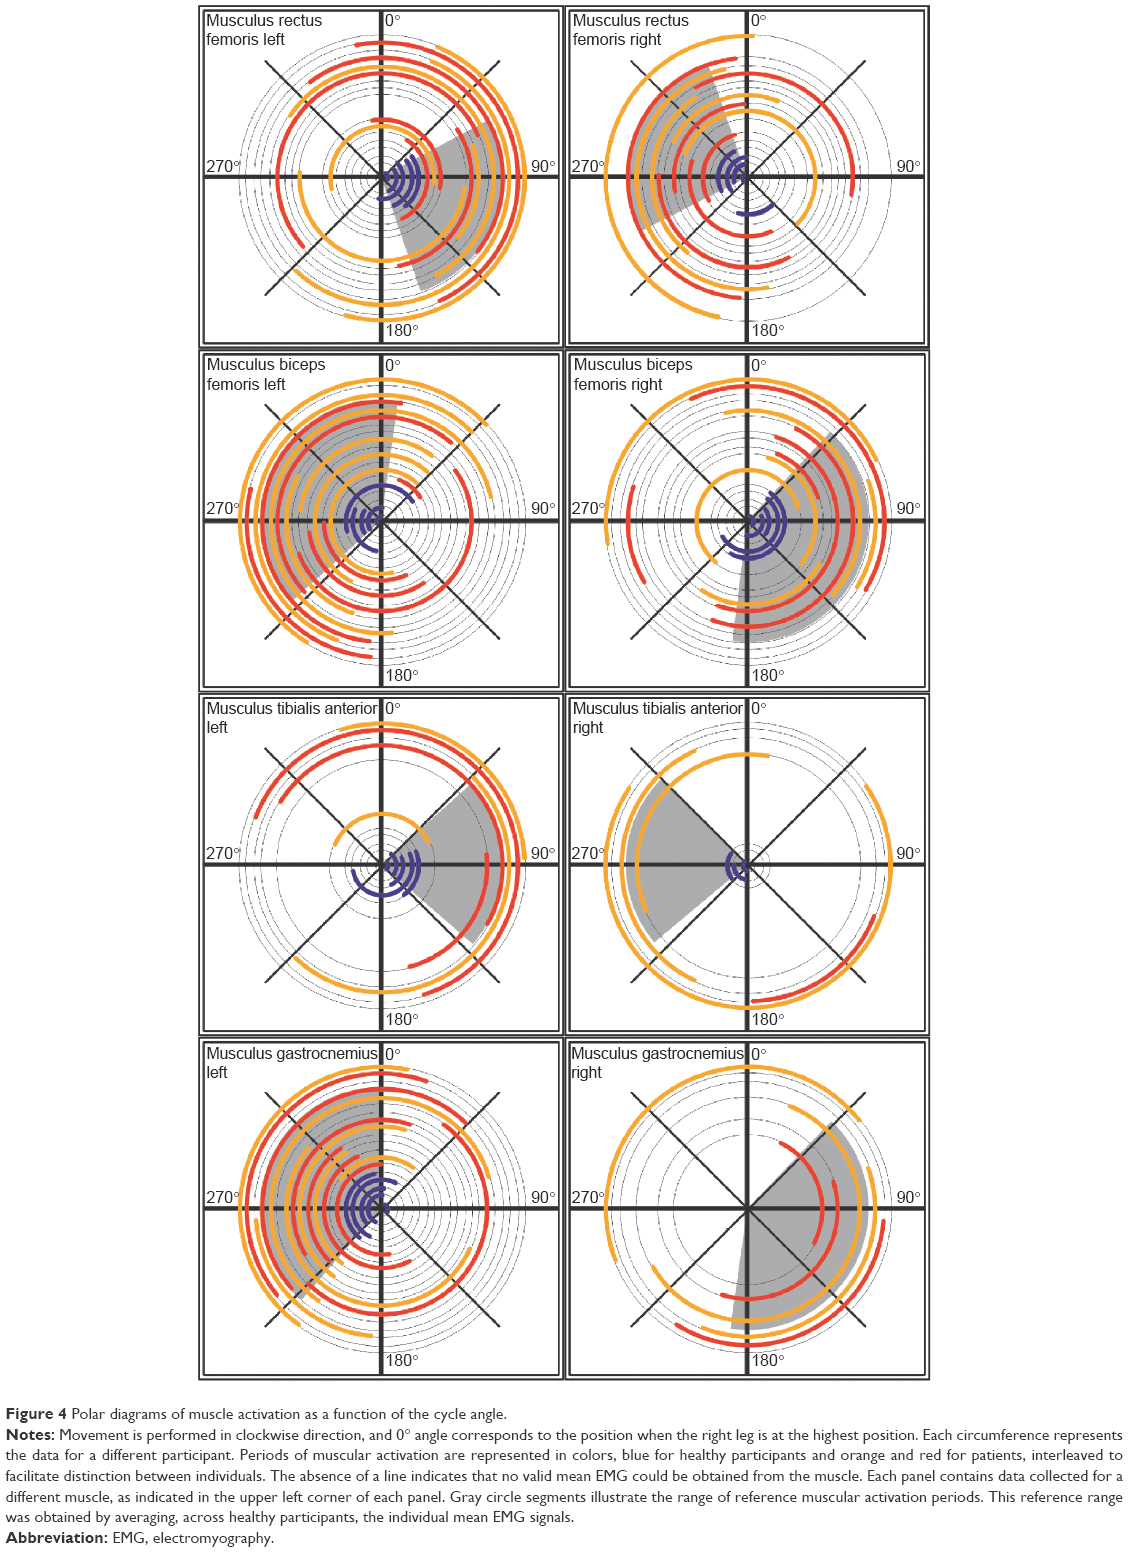 | Figure 4 Polar diagrams of muscle activation as a function of the cycle angle. |
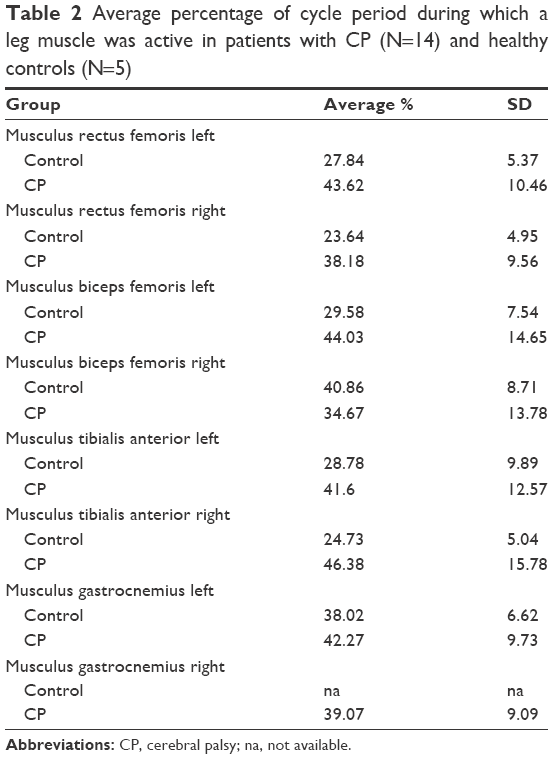 | Table 2 Average percentage of cycle period during which a leg muscle was active in patients with CP (N=14) and healthy controls (N=5) |
Muscle activity patterns recorded in healthy participants
In healthy participants, the Musculus rectus femoris of the right leg was active in the range of ~250°−340°, while the antagonist muscle, the right Musculus biceps femoris is active in the range of ~38°−185° (Figure 4). As expected, the two muscles are active in different parts of the cycling revolution, and hence, there are no cocontractions. Similarly, the left Musculus tibialis anterior and the left Musculus gastrocnemius are active in nonoverlapping parts of the cycle period.
Also, as expected, comparison of activation periods of equivalent muscles between the right and left sides shows that the activation period in one side is ~180° displaced relative to the opposite side.
Patients with CP show earlier onsets and longer periods of muscle activation in comparison to healthy participants
Longer muscular activation was observed for six of the eight recorded muscles in patients with CP, as compared to healthy controls (Table 2). As illustrated in Figure 4 and in the SD values in Table 2, the range of muscle activation period is more variable among patients with CP. For most patients, muscles of the upper part of the leg – Musculus rectus femoris and Musculus biceps femoris – showed earlier onsets and longer duration of activation than in healthy participants (Figure 4). Furthermore, muscles tended to be active in very different parts of the cycle period in comparison to the reference group. For the muscles of the lower part of the leg – Musculus gastrocnemius and Musculus tibialis anterior – valid records of muscle activation were more difficult to obtain, as reflected in the absence of data for many of the subjects, including healthy participants (eg, data for Musculus gastrocnemius right in Table 2).
The longer muscular activation as well as the earlier initiation of activation for the test group can also be observed in Figure 5, where the difference in the onset of activation (in angle units) is plotted as a function of duration of activation for each participant (green and red dots illustrate results for patients and healthy participants, respectively). Green dots are more scattered than red dots, and they are mostly located in the lower right quadrant of the plot, indicating an earlier onset and longer duration of muscle activation among participants in the test group.
 | Figure 5 Difference in angle of onset of activation of the left Musculus rectus femoris relative to the reference onset angle, as a function of the duration of muscle activation. |
Altered muscle activity is generally associated to higher GMFCS and MAS
Alterations in the onset of activation and in the duration of activation were explored also by computing the factor B, according to Equation 1 for each person and each muscle. The value of factor B is plotted in Figure 6 as a function of each participant’s MAS level (for healthy subjects, MAS =0). The blue line is a regression line across all B values as a function of MAS levels. Although the variability in B factor is visible for patients with CP, for most muscles, values of B tended to increase with MAS, indicating a more deviant activity, relative to healthy subjects, for patients with a higher spasticity level. A nonparametric Kruskal–Wallis statistical test computed over all muscles for all participants yielded a significant effect of MAS on the value of B (H(3)=33.2, P<0.01).
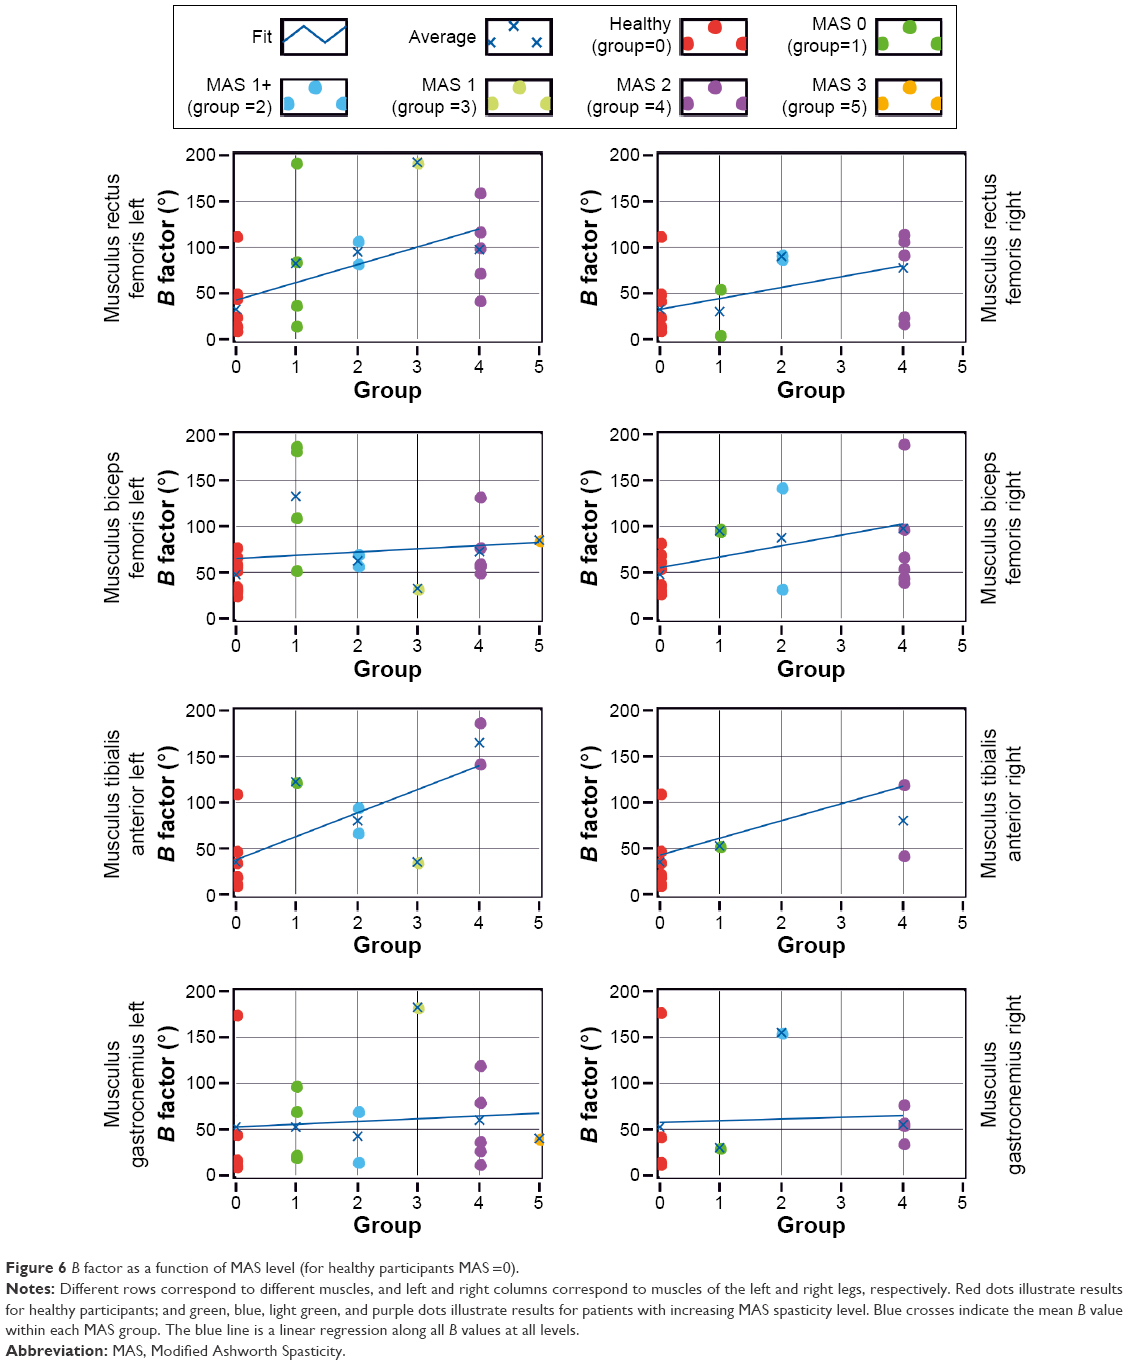 | Figure 6 B factor as a function of MAS level (for healthy participants MAS =0). |
Patients present more cocontractions than healthy participants
Cocontractions were sought by looking for the periods when the agonist and antagonist muscles in a leg were simultaneously active, that is, when the Musculus rectus femoris and Musculus biceps femoris in the upper part of the leg were simultaneously active and similarly for the Musculus gastrocnemius and Musculus tibialis anterior on the lower part of the leg. Figure 7 describes in a polar diagram the parts of the travel path during which cocontractions were recorded for a given pair of agonist–antagonist muscles. Different panels illustrate results for different pairs of muscles, with inner/red lines showing results obtained for patients and outer/blue lines illustrating results for healthy individuals. Cocontractions occurred more often for patients with CP (red lines) than for healthy subjects (blue lines).
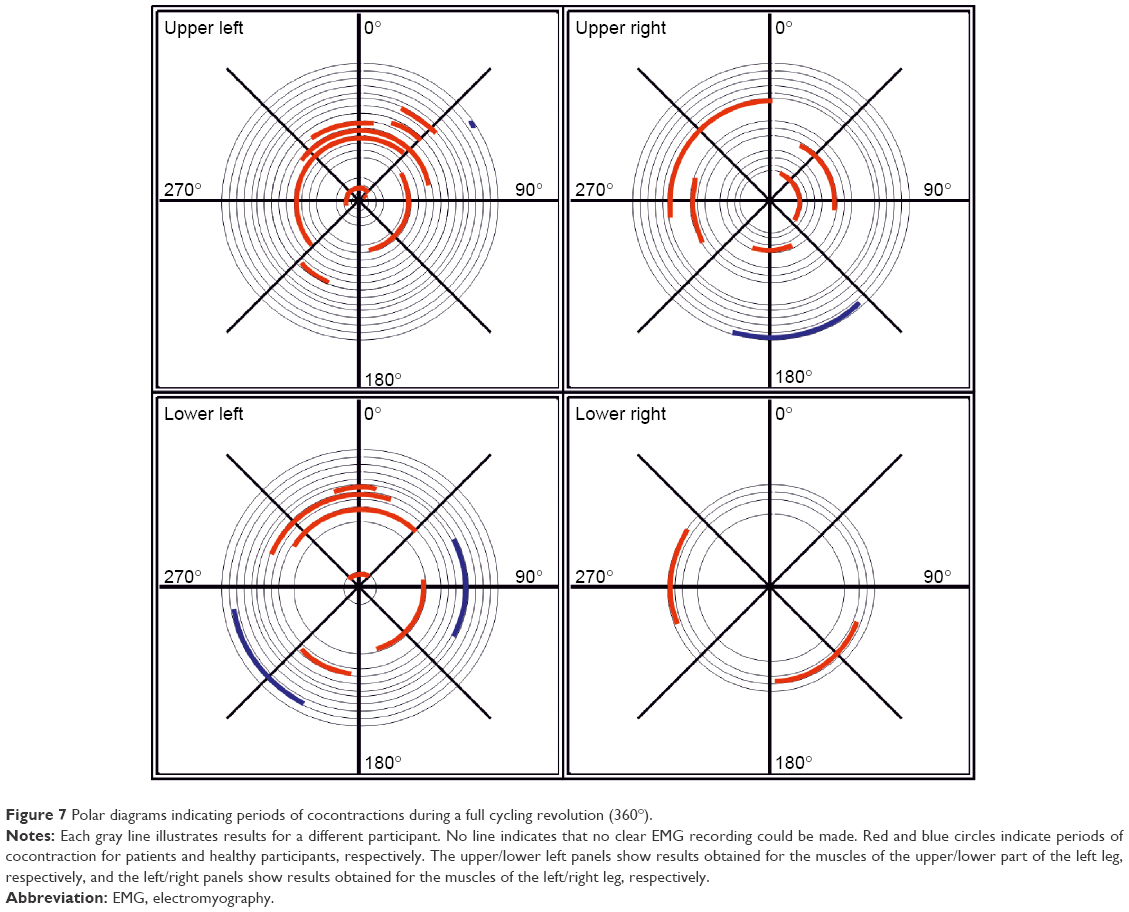 | Figure 7 Polar diagrams indicating periods of cocontractions during a full cycling revolution (360°). |
The cocontraction factor K (“Data analysis” section and Equation 2) is plotted in Figure 8 as a function of the spasticity level MAS for each pair of agonist–antagonist muscles. The K factor is a measure of the degree of cocontraction, with longer periods of cocontraction being translated by larger values of the K factor. Qualitatively, the lines show a tendency for large K factors being associated with higher spasticity levels. No statistical significant effect of MAS was, however, obtained, which might be due to the lower number of cocontractions recorded for some MAS levels.
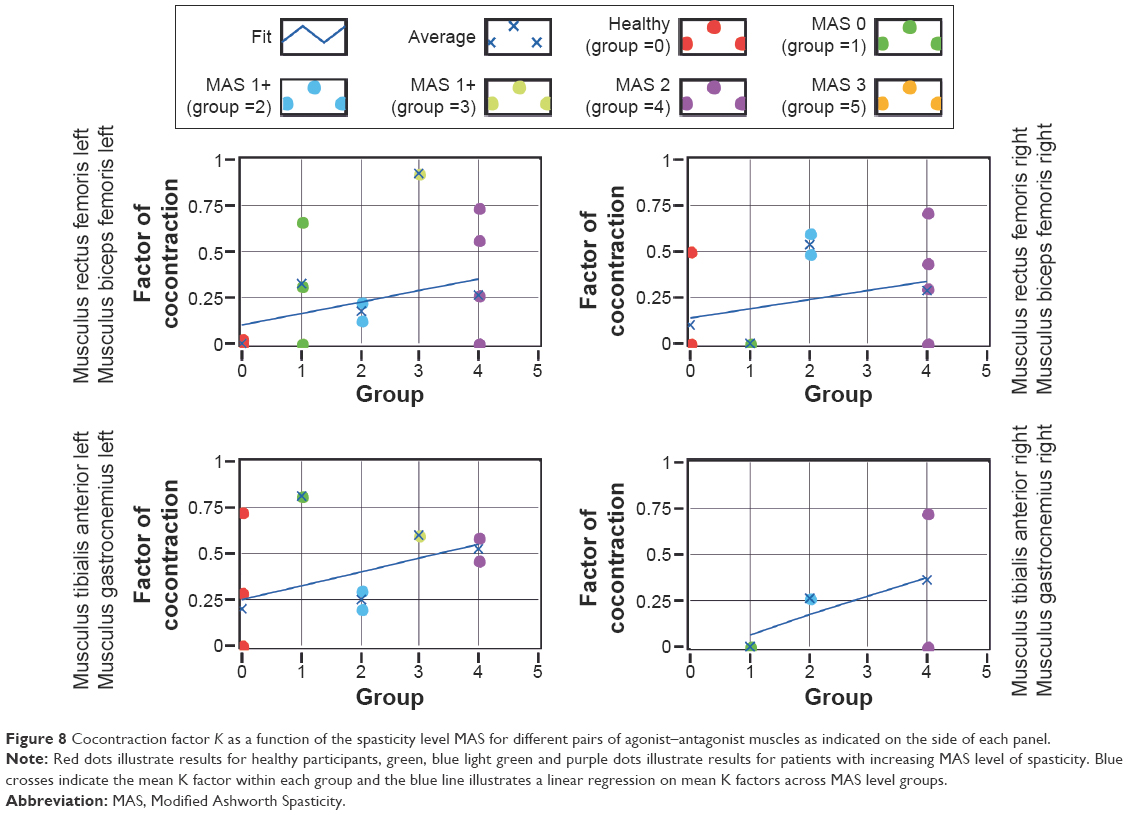 | Figure 8 Cocontraction factor K as a function of the spasticity level MAS for different pairs of agonist–antagonist muscles as indicated on the side of each panel. |
A similar tendency is observed if instead of the MAS level the GMFCS level is plotted (not represented here): larger K factors tend to be associated with larger GMFCS levels.
The cycling tempo is more irregular in patients with CP than in healthy subjects
Figure 9 illustrates the average time each participant spent in a given quadrant. Participants were asked to cycle as regularly as possible (ie, equal speed) throughout the entire circumference path. This means that in the ideal situation, a person would spend equal proportions of time, ~25%, in each quadrant. This was indeed the case for healthy participants. Patients with CP, however, spent between 17% and 27% of the time approximately in the first quadrant, and most spent >25% of time in the second quadrant, between 23% and 33% in the third quadrant, and between 19% and 27% in the fourth quadrant. Generally, patients with CP showed a much more variable tempo, spending more time in the second and third quadrants than in the first and fourth quadrants.
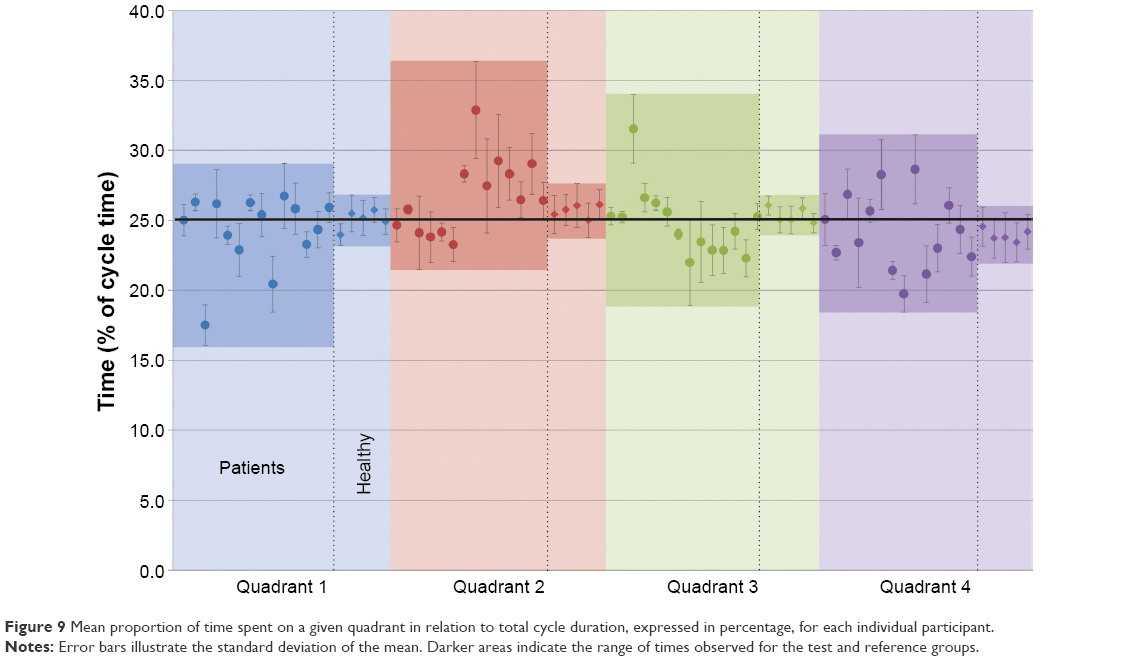 | Figure 9 Mean proportion of time spent on a given quadrant in relation to total cycle duration, expressed in percentage, for each individual participant. |
Discussion
Leg muscular activation patterns during cycling in an ergometer measured with a customized EMG system were generally consistent with equivalent measures reported in the literature.11,19,20 In particular, comparison of polar diagrams (Figure 4) with those presented in Figure 5 of Momeni et al20 for a workload of 50 W shows that in this study, muscle activations occurred in shorter periods of the travel path but that the relative position during the period of muscle activation is similar to that described in Momeni et al.20 The shorter duration of activation in the current study may be due to differences in the way that onsets/offsets of muscle activation were defined as well as in differences in workload.13 In the current experiment, the workload was not fixed unlike in the study of Momeni et al,20 and it may be that participants in the current study cycled with an effective lower load. Furthermore, the FWHM criterion used here to detect the onset and offset of muscle activation sets the threshold at 50% of the maximum amplitude obtained from the normalized average activity for a given muscle. In the study of Momeni et al,20 the threshold corresponded to 10% of the maximum amplitude, a criterion that tends to yield earlier onsets and later offsets.
In comparison to healthy participants, patients with CP showed earlier onsets of muscle activation, longer periods of activity (Figure 4 and Table 2), and higher occurrence of cocontractions (Figure 7). Similar observations were reported by Kaplan11 in children with CP using a standard bicycle and by Johnston et al13 during recumbent cycling. In Kaplan’s study, 52% of the children with diplegic spastic CP showed cocontractions of the Musculus rectus femoris and the hamstrings, while in Johnston et al’s study, 66% of the muscle pairings in the leg showed cocontractions. In the current study, cocontractions were observed in 70% of the total number of possible muscle pairings, across patients, in both legs.
The more frequent occurrence of cocontractions in patients with CP is likely to result from a combination of several factors, namely, altered corticospinal and spinal segmental control of lower leg muscles. Effective differences in the pattern of muscle coactivation between patients with congenital spasticity and patients with spasticity symptoms that started already in adulthood have been suggested to reflect abnormal development of the corticospinal projections21 and spinal segmental tracts.22 All patients in the current study have deficits due to early brain damage, and the cocontractions observed are therefore likely determined by an immature neural circuitry involved in motor control. This possibility is consistent with the observation, for some patients, of muscle activation during periods of the cycle further away from the reference activation patterns obtained from healthy participants (Figure 4).
In addition, deficient muscle strength necessary to perform the movement could have contributed to a more frequent occurrence of cocontractions in patients with CP. The lack of movement in these patients prevents the development of muscular strength, and this may lead to the recruitment of several muscles to reach stability during movement. This would be in-line with the inefficient use of lower leg muscles during cycling reported by Johnston et al.13
Also a deficient ability to select the appropriate muscles to perform the movement most efficiently as well as an impaired reciprocal inhibition in patients with CP23 could have contributed to more frequent cocontractions in CP.
Observed also in the current study was a tendency for earlier onsets, longer durations of activation, and frequency of cocontractions to increase with the level of spasticity (Figures 6 and 8). The observation conforms to clinical observations showing that patients become severely limited when the muscle tone is high, with cocontractions reducing movements of the joints and with the reciprocal innervation of muscles being affected. However, the wide variability observed here for the B and K factors among patients within a single MAS group suggests that although the degree of spasticity influences the onset and duration of the muscle activation, it does not account fully for the differences to the healthy group observed.
This variability also applies to the temporal pattern of cycling. The group of healthy subjects showed comparatively more homogeneous results, spending approximately one-fourth of the total cycling time in each quadrant. Patients with CP showed an irregular tempo during cycling, spending more time in quadrants two and three than in the first and fourth quadrants (Figure 9). One possible reason for the difference in the second quadrant is that in this part of the cycle path, the leg is changing from a stretched to a flexed position, and this movement requires muscle strength. This may explain the longer time spent in these quadrants 2 and 3, as changing movement might be difficult if the ability to voluntarily move the leg and apply the adequate force to the pedal is affected. In this moment, the opposite leg is also in a changing position, and its activity seems not to be enough to compensate for the other leg. Once again similar results were reported by Kaplan,11 especially the short timing in the moment that the leg changes from a flexion to an extension position. Also Chen et al24 reported a leg asymmetry during cycling on a bicycle ergometer by stroke patients, with the healthy leg dominating the movement.
Several commercialized systems are being increasingly used in the rehabilitation of patients with impaired leg muscle tone.25,26 The EMG activity patterns presented here provide information that can be used in the development of feedback systems that can inform the patient when there is an incorrect muscle activation pattern during cycling. The aim would be to train a more efficient use of the lower leg muscles, this way supporting the work of therapists in more actively promoting the development of more physiological patterns of muscle activation during training in an ergometer.27,28
Conclusion
Patterns of lower leg muscle activation during cycling on a recumbent ergometer were observed to be altered in patients with CP, when compared to healthy controls. Earlier onsets of muscle activation and longer periods of activation were observed. Furthermore, cocontractions were more frequent and the cycling tempo was more variable. Some of the deviations are associated to higher levels of muscle spasticity.
Acknowledgments
The authors thank the therapists and participants of the Münchner Förderzentrum, Munich, Germany, for the time and support to this study. Experimental work was financially supported by the Kraußianum Foundation through the Bayerisches Staatsministerium für Wissenschaft, Forschung und Kunst (Germany) and by the company Paravan that lent the ergometer for the study.
Disclosure
TB and RL were financed by the Würth Foundation, and VT and AAP were funded by the Buhl-Strohmaier Foundation.The authors report no other conflicts of interest in this work.
References
Rosenbaum P, Paneth N, Leviton A, et al. A report: the definition and classification of cerebral palsy April 2006. Dev Med Child Neurol Suppl. 2007;109:8–14. | ||
Odding E, Roebroeck ME, Stam HJ. The epidemiology of cerebral palsy: incidence, impairments and risk factors. Disabil Rehabil. 2006;28(4):183–191. | ||
Beckung E, Hagberg G. Neuroimpairments, activity limitations, and participation restrictions in children with cerebral palsy. Dev Med Child Neurol. 2002;44(5):309–316. | ||
Peet DS. Retrospective review of the epidemiology of epilepsy in special schools for children with cerebral palsy, learning difficulties, and language and communication difficulties. Mcgill J Med. 2006;9(1):19. | ||
Ego A, Lidzba K, Brovedani P, et al. Visual–perceptual impairment in children with cerebral palsy: a systematic review. Dev Med Child Neurol. 2015;57(s2):46–51. | ||
Cooper J, Majnemer A, Rosenblatt B, Birnbaum R. The determination of sensory deficits in children with hemiplegic cerebral palsy. J Child Neurol. 1995;10(4):300–309. | ||
Jiang ZD, Liu XY, Shi BP, Lin L, Bu CF, Wilkinson AR. Brainstem auditory outcomes and correlation with neurodevelopment after perinatal asphyxia. Pediatr Neurol. 2008;39(3):189–195. | ||
Curtis DJ, Bencke J, Mygind B. The effect of training in an interactive dynamic stander on ankle dorsiflexion and gross motor function in children with cerebral palsy. Dev Neurorehabil. 2014;17(6):393–397. | ||
Blumenstein T, Zeitlmann H, Alves-Pinto A, Turova V, Lampe R. Optimization of electric bicycle for youths with disabilities. Springer Plus. 2014;3:646. | ||
Runciman P, Derman W, Ferreira S, Albertus-Kajee Y, Tucker R. A descriptive comparison of sprint cycling performance and neuromuscular characteristics in able-bodied athletes and paralympic athletes with cerebral palsy. Am J Phys Med Rehabil. 2015;94(1):28–37. | ||
Kaplan SL. Cycling patterns in children with and without cerebral palsy. Dev Med Child Neurol. 1995;37(7):620–630. | ||
Lauer RT, Johnston TE, Smith BT, Lee SC. Lower extremity muscle activity during cycling in adolescents with and without cerebral palsy. Clin Biomech. 2008;23(4):442–449. | ||
Johnston TE, Barr AE, Lee SC. Biomechanics of submaximal recumbent cycling in adolescents with and without cerebral palsy. Phys Ther. 2007;87(5):572–585. | ||
Wakeling J, Delaney R, Dudkiewicz I. A method for quantifying dynamic muscle dysfunction in children and young adults with cerebral palsy. Gait Posture. 2007;25(4):580–589. | ||
Gage JR. Gait Analysis in Cerebral Palsy. London: Mac Keith Press; 1991. | ||
Bohannon RW, Smith MB. Interrater reliability of a modified Ashworth scale of muscle spasticity. Phys Ther. 1987;67(2):206–207. | ||
Hermens HJ, Freriks B, Merletti R, et al. European recommendations for surface electromyography. Roessingh Res Dev. 1999;8(2):13–54. | ||
Halaki M, Ginn K. Normalization of EMG signals: to normalize or not to normalize and what to normalize to? In: Naik GR, editor. Computational Intelligence in Electromyography Analysis – A Perspective on Current Applications and Future Challenges. Rijeka, Croatia. INTECH; 2012:175–194. | ||
Hamzaid NA, Smith RM, Davis GM. Isokinetic cycling and elliptical stepping: a kinematic and muscle activation analysis. Clin Res Foot Ankle. 2013;1:117. | ||
Momeni K, Faghri PD, Evans M. Lower-extremity joint kinematics and muscle activations during semi-reclined cycling at different workloads in healthy individuals. J Neuroeng Rehabil. 2014;11(1):146. | ||
Brouwer B, Ashby P. Altered corticospinal projections to lower limb motoneurons in subjects with cerebral palsy. Brain. 1991;114(3):1395–1407. | ||
Myklebust BM, Gottlieb GL, Penn RD, Agarwal GC. Reciprocal excitation of antagonistic muscles as a differentiating feature in spasticity. Ann Neurol. 1982;12(4):367–374. | ||
Mockford M, Caulton JM. The pathophysiological basis of weakness in children with cerebral palsy. Pediatr Phys Ther. 2010;22(2):222–233. | ||
Chen H-Y, Chen S-C, Chen J-JJ, Fu L-L, Wang YL. Kinesiological and kinematical analysis for stroke subjects with asymmetrical cycling movement patterns. J Electromyogr Kinesiol. 2005;15(6):587–595. | ||
Doğan-Aslan M, Nakipoğlu-Yüzer GF, Doğan A, Karabay I, Özgirgin N. The effect of electromyographic biofeedback treatment in improving upper extremity functioning of patients with hemiplegic stroke. J Stroke Cerebrovasc Dis. 2012;21(3):187–192. | ||
Rayegani S, Raeissadat S, Sedighipour L, et al. Effect of neurofeedback and electromyographic-biofeedback therapy on improving hand function in stroke patients. Top Stroke Rehabil. 2014;21(2):137–151. | ||
Clark BC, Goss DA, Walkowski S, Hoffman RL, Ross A, Thomas JS. Neurophysiologic effects of spinal manipulation in patients with chronic low back pain. BMC Musculoskelet Disord. 2011;12(1):170. | ||
Liu J, Xu D, Ren Y, Zhang L-Q. Evaluations of neuromuscular dynamics of hyperactive reflexes poststroke. J Rehabil Res Dev. 2011;48(5):577–586. |
 © 2016 The Author(s). This work is published and licensed by Dove Medical Press Limited. The
full terms of this license are available at https://www.dovepress.com/terms
and incorporate the Creative Commons Attribution
- Non Commercial (unported, 3.0) License.
By accessing the work you hereby accept the Terms. Non-commercial uses of the work are permitted
without any further permission from Dove Medical Press Limited, provided the work is properly
attributed. For permission for commercial use of this work, please see paragraphs 4.2 and 5 of our Terms.
© 2016 The Author(s). This work is published and licensed by Dove Medical Press Limited. The
full terms of this license are available at https://www.dovepress.com/terms
and incorporate the Creative Commons Attribution
- Non Commercial (unported, 3.0) License.
By accessing the work you hereby accept the Terms. Non-commercial uses of the work are permitted
without any further permission from Dove Medical Press Limited, provided the work is properly
attributed. For permission for commercial use of this work, please see paragraphs 4.2 and 5 of our Terms.