Back to Journals » Neuropsychiatric Disease and Treatment » Volume 11
Altered intrinsic regional spontaneous brain activity in patients with optic neuritis: a resting-state functional magnetic resonance imaging study
Authors Shao Y ![]() , Cai F, Zhong Y, Huang X, Zhang Y, Hu P, Pei C, Zhou F
, Cai F, Zhong Y, Huang X, Zhang Y, Hu P, Pei C, Zhou F ![]() , Zeng X
, Zeng X
Received 23 August 2015
Accepted for publication 27 October 2015
Published 11 December 2015 Volume 2015:11 Pages 3065—3073
DOI https://doi.org/10.2147/NDT.S92968
Checked for plagiarism Yes
Review by Single anonymous peer review
Peer reviewer comments 2
Editor who approved publication: Professor Wai Kwong Tang
Yi Shao,1,* Feng-Qin Cai,2,* Yu-Lin Zhong,1 Xin Huang,1,3 Ying Zhang,1 Pei-Hong Hu,1 Chong-Gang Pei,1 Fu-Qing Zhou,2 Xian-Jun Zeng2
1Department of Ophthalmology, 2Department of Radiology, First Affiliated Hospital of Nanchang University, Nanchang, 3Department of Ophthalmology, First People’s Hospital of Jiujiang, Jiujiang, People’s Republic of China
*These authors contributed equally to this work
Objective: To investigate the underlying regional homogeneity (ReHo) in brain-activity deficit in patients with optic neuritis (ON) and its relationship with behavioral performance.
Materials and methods: In total, twelve patients with ON (four males and eight females) and twelve (four males and eight females) age-, sex-, and education-matched healthy controls underwent resting-state functional magnetic resonance imaging scans. The ReHo method was used to assess the local features of spontaneous brain activity. Correlation analysis was used to explore the relationship between the observed mean ReHo values of the different brain areas and the visual evoked potential (VEP) in patients with ON.
Results: Compared with the healthy controls, patients with ON showed lower ReHo in the left cerebellum, posterior lobe, left middle temporal gyrus, right insula, right superior temporal gyrus, left middle frontal gyrus, bilateral anterior cingulate cortex, left superior frontal gyrus, right superior frontal gyrus, and right precentral gyrus, and higher ReHo in the cluster of the left fusiform gyrus and right inferior parietal lobule. Meanwhile, we found that the VEP amplitude of the right eye in patients with ON showed a positive correlation with the ReHo signal value of the left cerebellum posterior lobe (r=0.701, P=0.011), the right superior frontal gyrus (r=0.731, P=0.007), and the left fusiform gyrus (r=0.644, P=0.024). We also found that the VEP latency of the right eye in ON showed a positive correlation with the ReHo signal value of the right insula (r=0.595, P=0.041).
Conclusion: ON may involve dysfunction in the default-mode network, which may reflect the underlying pathologic mechanism.
Keywords: optic neuritis, regional homogeneity, rs-fMRI, visual evoked potential
Introduction
Optic neuritis (ON) is an inflammatory disease of the optic nerve, presenting with an abrupt loss of vision, pain during movement of the eye, relative afferent pupillary defect, and disk edema.1 ON will lead to lesions of optic nerve axons and to apoptosis of retinal ganglion cells. ON can also be a symptom of multiple sclerosis (MS).2 ON is more common relative to the incidence of MS in Asia compared with the USA.3 Although treatment of the inflammation results in good eyesight recovery in many patients with ON, in others, vision does not return to normal, and may be accompanied by abnormal color vision and visual field defects. ON is commonly considered a retinal disease, but a study demonstrated that patients with ON presented with abnormalities in the visual cortex.4 Therefore, the mechanism of optic neuropathy and cerebral functional area damage caused by ON requires characterization.
Visual evoked potential (VEP) is an important clinical test for diagnosis of ON. VEP has been studied in patients with ON, and the VEP features of ON are amplitude decrease and prolonged latency, which reflect nerve-axon lesions and apoptosis of retinal ganglion cells. A previous study demonstrated that VEP is superior to optical coherence tomography for detection of clinical and subclinical ON.5 VEP can also reflect the severity of optic nerve injury. The significant correlation of multifocal VEP latency suggests a role for demyelination in promoting axonal loss.6 In addition, VEP can be used to evaluate the prognosis of ON. A previous study showed that patients with ON still had multifocal VEP amplitude delays present in many locations, even if they recovered near-normal sensitivity of vision.7
Functional magnetic resonance imaging (fMRI) has been used for research into ON, and a previous study using fMRI found decreased functional connectivity in the visual system after acute ON.8 Diffusion tensor imaging can accurately measure the fractional anisotropy and mean diffusivity of the visual pathway. Previous studies showed significantly decreased mean fractional anisotropy in the affected nerves in patients with idiopathic demyelinating ON.9 In the acute phase of ON, activation of the lateral geniculate nucleus during visual stimulation of the affected eye was significantly reduced.10 A previous study reported that the optic nerve of the patients with ON showed lower FA in the white matter and decreased fiber structure,11 while diffusion-tensor MRI parameters of ON correlated significantly with the amplitude of VEP.12 Although these findings showed neuronal morphological changes in the ON, there was far less evidence for changes in the neuromechanism.
A previous study has shown that the reliable propagation of synchronous neural activity is crucial for neural information processing.13 The regional homogeneity (ReHo) method, a widely used resting-state fMRI measure, has been used to explore the local synchronization of spontaneous fMRI signals by calculating Kendall’s coefficient concordance of the time series of dynamic fluctuations of voxels within a given cluster, providing important information on brain activity.14,15 However, cerebral dysfunction may lead to altered neuronal synchrony, which will have an adverse effect on neural information processing.16 The ReHo method has been successfully used to investigate the mechanism of such diseases as epilepsy,17 primary insomnia,18 Parkinson’s,19 and depression.20 However, it has not yet been used to explore pathophysiological changes in ON. In the current study, we explored the regional spontaneous brain activity in ON and its relationship with VEP, using the ReHo method.
Materials and methods
Subjects
Twelve patients with ON (four males and eight females) were recruited from the Ophthalmology Department of the First Affiliated Hospital of Nanchang University Hospital. Inclusion criteria were: 1) acute vision loss with or without eye pain; 2) visual field abnormalities associated with damage of nerve fibers; 3) patients with relative pupillary conduction block or abnormal VEPs; 4) no clinical or laboratory evidence of compression or ischemic, toxic, genetic, metabolic, or invasive optic neuropathy; 5) patients without acute vision loss due to retinal disease, alternative eye disease, or disease of the nervous system; 6) no obvious abnormality in the brain parenchyma with head MRI; 7) no history of inborn or other acquired diseases, such as psychiatric disorders, hypertension, diabetes mellitus, or coronary artery disease, and no addictions, such as heroin addiction, smoking addiction, or alcohol addiction; 8) no organ transplantation in the body; and 9) moderate body shape and weight.
Twelve healthy controls (HCs; four males and eight females) who were age-, sex-, and education status-matched to the ON subjects were recruited for this study. All HCs met the following criteria: 1) no abnormalities in visual pathways or brain parenchyma with head MRI; 2) no ocular disease, naked-eye corrected visual acuity (VA) >1.0; 3) sex and age consistent with the ON group; 4) normal nervous and mental system, no headaches; 5) and no contraindications for MRI. All the methods of this research followed the Declaration of Helsinki and conformed to the principles of medical ethics. For each subject, the study protocol and procedure were fully explained, and written consent was obtained. The experiment was authorized by the First Affiliated Hospital of Nanchang ethics committee.
MRI parameters
MRI scanning was performed on a 3 T MR scanner (Trio; Siemens AG, Berlin, Germany). High-resolution T1-weighted images were acquired with a three-dimensional spoiled gradient-recalled sequence in an axial orientation: 176 images (repetition time =1,900 ms, echo time =2.26 ms, thickness =1.0 mm, gap =0.5 mm, acquisition matrix =256×256, field of view =250×250 mm, flip angle =9°) were obtained. Finally, 240 functional images (repetition time =2,000 ms, echo time =30 ms, thickness =4.0 mm, gap =1.2 mm, acquisition matrix =64×64, flip angle =90°, field of view =220×220 mm, 30 axial slices with gradient-recalled echo-planar imaging pulse sequence) covering the whole brain were obtained.
fMRI data analysis
All the functional data were checked by MRIcro software (McCausland Center for Brain Imaging, Columbia, SC, USA) (www.mricro.com) to exclude the defective ones. The first ten volumes of each session were discarded for the initial unstable magenetization state and the unadaptability of participants. The rest of the data were preprocessed using SPM8 (http://www.fil.ion.ucl.ac.uk/spm) and DPARSFA (http://rfmri.org/DPARSF) software. The following steps were slice timing, head-motion correction, spatial normalization, smooth with a Gaussian kernel of 6×6×6 mm3 full width at half maximum. In head-motion correction, participants whose head motion was more than 1.5 mm or 1.5° in any of the six parameters (x, y, z, pitch, roll, yaw) were excluded. Then, the fMRI images were spatially normalized to the Montreal Neurological Institute space using the standard echo-planar imaging template and resampled at a resolution of 3×3×3 mm. Finally, detrending and band-pass filtering (0.01–0.08 Hz) of the fMRI data were conducted to reduce the effects of low-frequency drift and physiological high-frequency respiratory and cardiac noise.
ReHo computation based on Kendall’s coefficient of concordance (KCC) was performed with REST software (http://www.resting-fmri.Sourceforge.net). Individual ReHo maps were generated by calculating the KCC of the time series of a given voxel with those of its nearest neighbors (26 voxels) in a voxel-wise manner with the formula:14
|
|
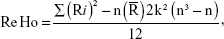
where ReHo is the KCC for a given voxel, ranging from 0 to 1. When the ranked time series is more consistent with its adjacent ones, the KCC value is closer to 1; k is the voxel number among time series (in our study, k =27, including one given voxel that was located in the cubic center and its adjacent 26 voxels); n is the number of ranks; Ri is the sum rank of the ith time point, and  = (n+1)/2*k/2 is the mean of the Ri’s. The KCC value refers to the central voxel among the cluster. The individual KCC ReHo map was generated on a voxel-wise basis for all data sets. To reduce the influence of individual variations in the KCC value, normalization of ReHo maps was done by dividing the KCC among each voxel by the averaged KCC of the whole brain. The resulting fMRI data were then spatially smoothed with a Gaussian kernel of 6×6×6 mm3 full width at half maximum.
Statistical analysis
For fMRI data, a general linear model analysis was performed with the SPM8 toolkit to investigate the group differences in ReHo between patients with ON and HCs, after controlling for the effects of age and sex. The significance level was set at P<0.05, Gaussian random-field theory-corrected, minimum z>2.3.
For behavioral performances, a two-sample Student’s t-test was used for continuous data. P<0.05 was considered statistically significant. SPSS version 20.0 (IBM Corporation, Armonk, NY, USA) statistical software was used for all the statistical analyses.
Brain–behavior correlation analysis
Based on the ReHo findings, the different brain regions between groups were classified as regions of interest with REST software. For each region of interest, the mean ReHo value was extracted by averaging the ReHo value over all voxels. Finally, a correlation analysis was performed to investigate the relationship between the mean ReHo value in each of those different areas in the ON group and the related behavioral performances. P<0.005 was considered statistically significant.
Clinical data analysis
All the subjects underwent the pattern-reversal VEP stimulation in a dark and quiet room for both eyes by using the RETLPORT electrophysiological instrument (Roland, Brandenburg, Germany). Latencies were filtered and analyzed by means of repeated (100) simulations twice for each eye. The VEP amplitude was evaluated based on the laboratory-designed reference value. The cumulative clinical measurement included optical coherence tomography and best-corrected VA.
Results
Behavioral results
There were no significant differences in weight (P=0.973), age (P=0.885), height (P=0.791), or body mass index (P=0.793) between the ON and HC groups. There were significant differences between the two patient groups in best-corrected VA – right (P<0.001), best-corrected VA – left (P=0.001), latency – right (in ms) of the VEP (P=0.020), amplitude – right (in μV) of the VEP (P<0.001), latency – left of the VEP (P=0.036), and amplitude – left of the VEP (P=0.012) between the patients with ON and the HCs. The details are presented in Table 1.
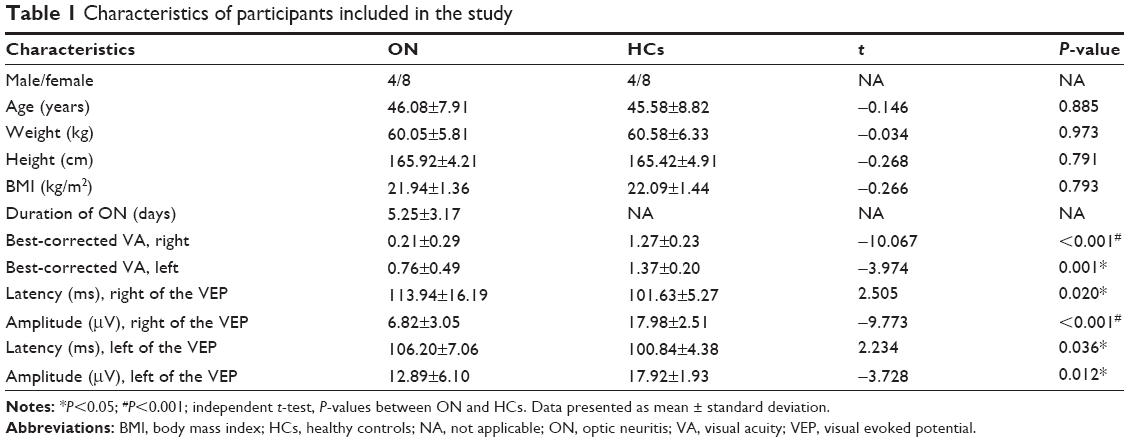 | Table 1 Characteristics of participants included in the study |
ReHo differences
Compared with HCs, patients with ON had significantly decreased ReHo values in the following brain regions: left cerebellum posterior lobe, left middle temporal gyrus, right insula, right superior temporal gyrus, left middle frontal gyrus, bilateral anterior cingulate cortex, bilateral medial frontal gyrus, left superior frontal gyrus, right superior frontal gyrus, and right precentral gyrus (Figure 1 [blue] and Table 2). Brain areas with significantly increased ReHo values in the ON group were the left fusiform gyrus and right inferior parietal lobule (Figure 1 [red] and Table 2). The mean of the altered ReHo between the ON and HC groups is shown in Figure 2.
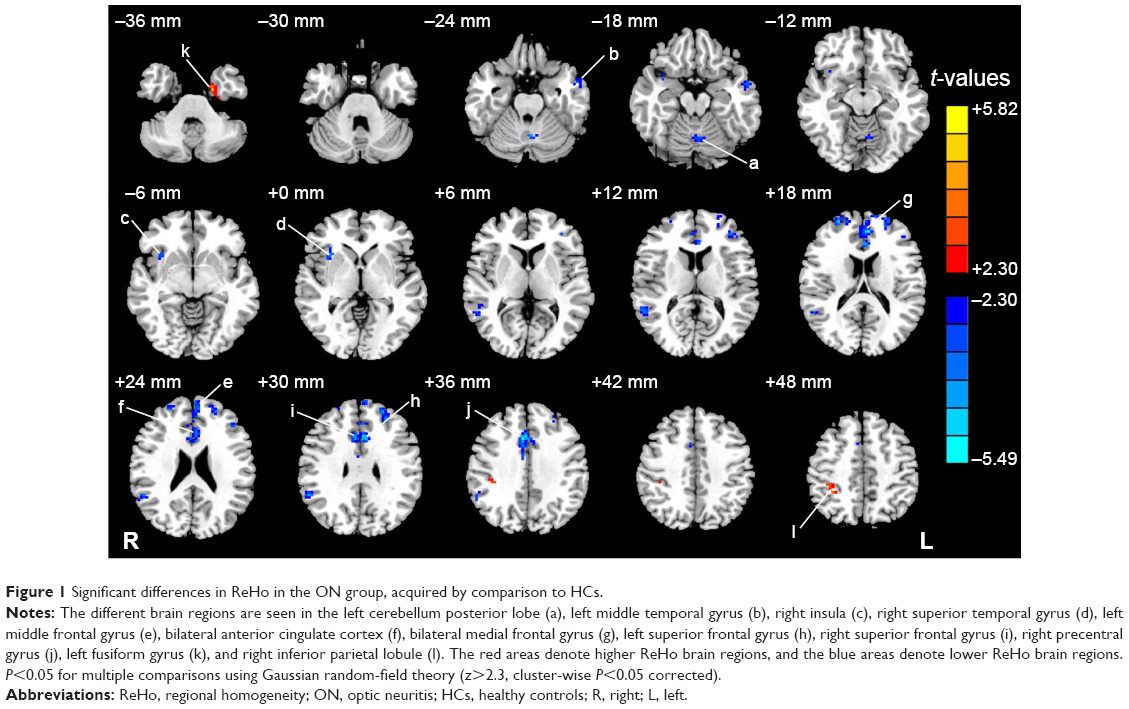 | Figure 1 Significant differences in ReHo in the ON group, acquired by comparison to HCs. |
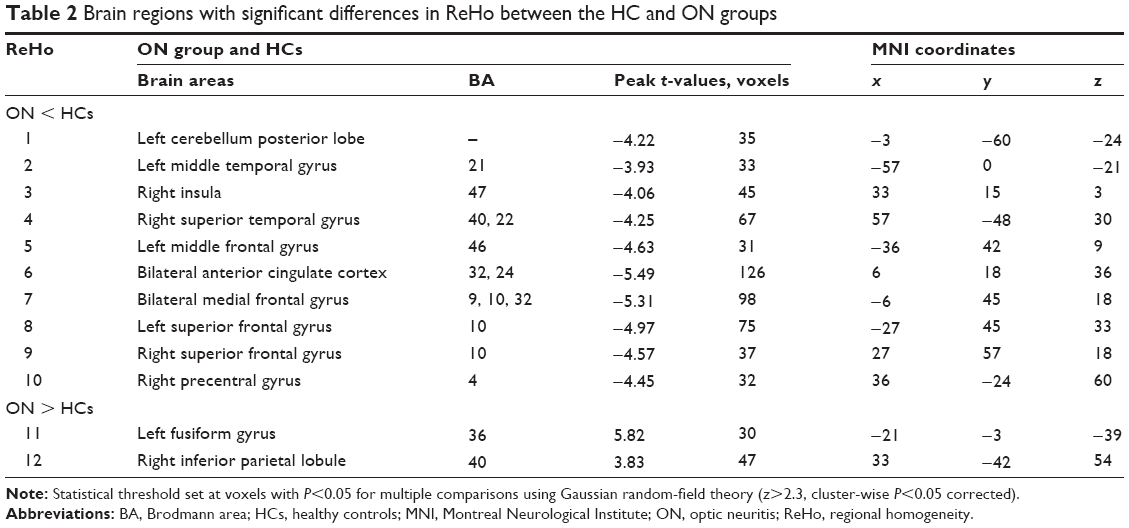 | Table 2 Brain regions with significant differences in ReHo between the HC and ON groups |
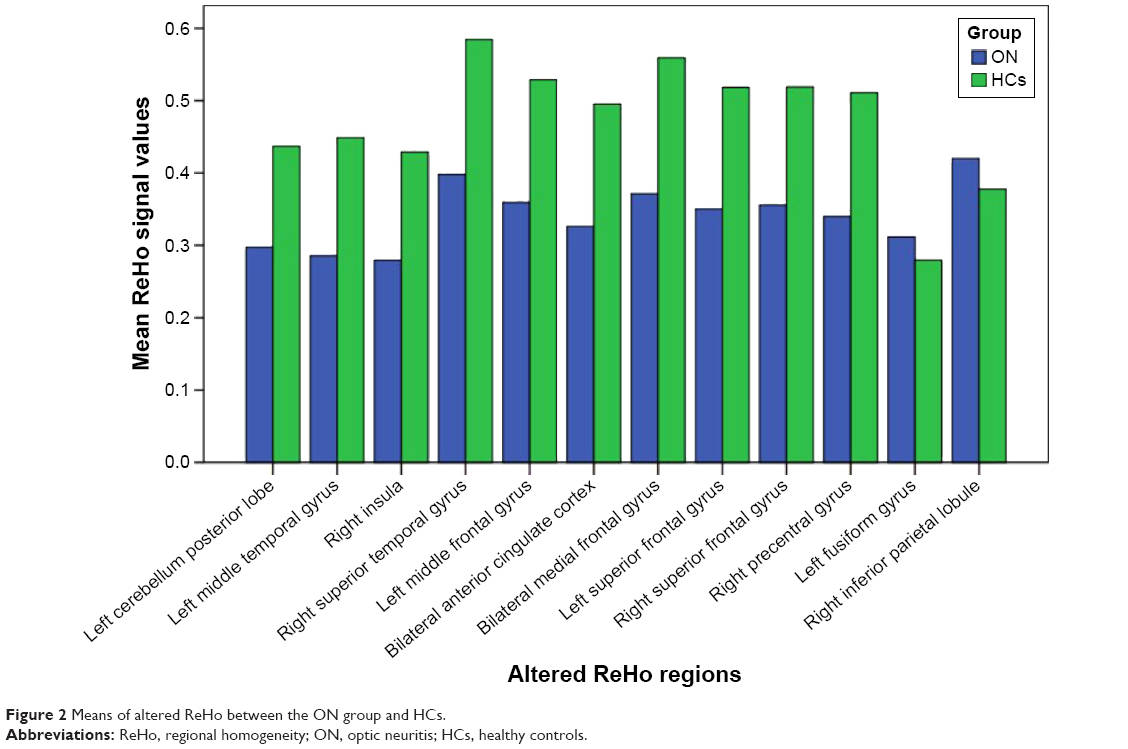 | Figure 2 Means of altered ReHo between the ON group and HCs. |
Correlation analysis
The VEP amplitude of the right eye in the ON group showed a positive correlation with the ReHo signal value of the left cerebellum posterior lobe (r=0.701, P=0.011) (Figure 3A), right superior frontal gyrus (r=0.731, P=0.007) (Figure 3B), and left fusiform gyrus (r=0.644, P=0.024) (Figure 3D). Meanwhile, the VEP latency of the right eye in the ON group showed a positive correlation with the ReHo signal value of the right insula (r=0.595, P=0.041) (Figure 3C).
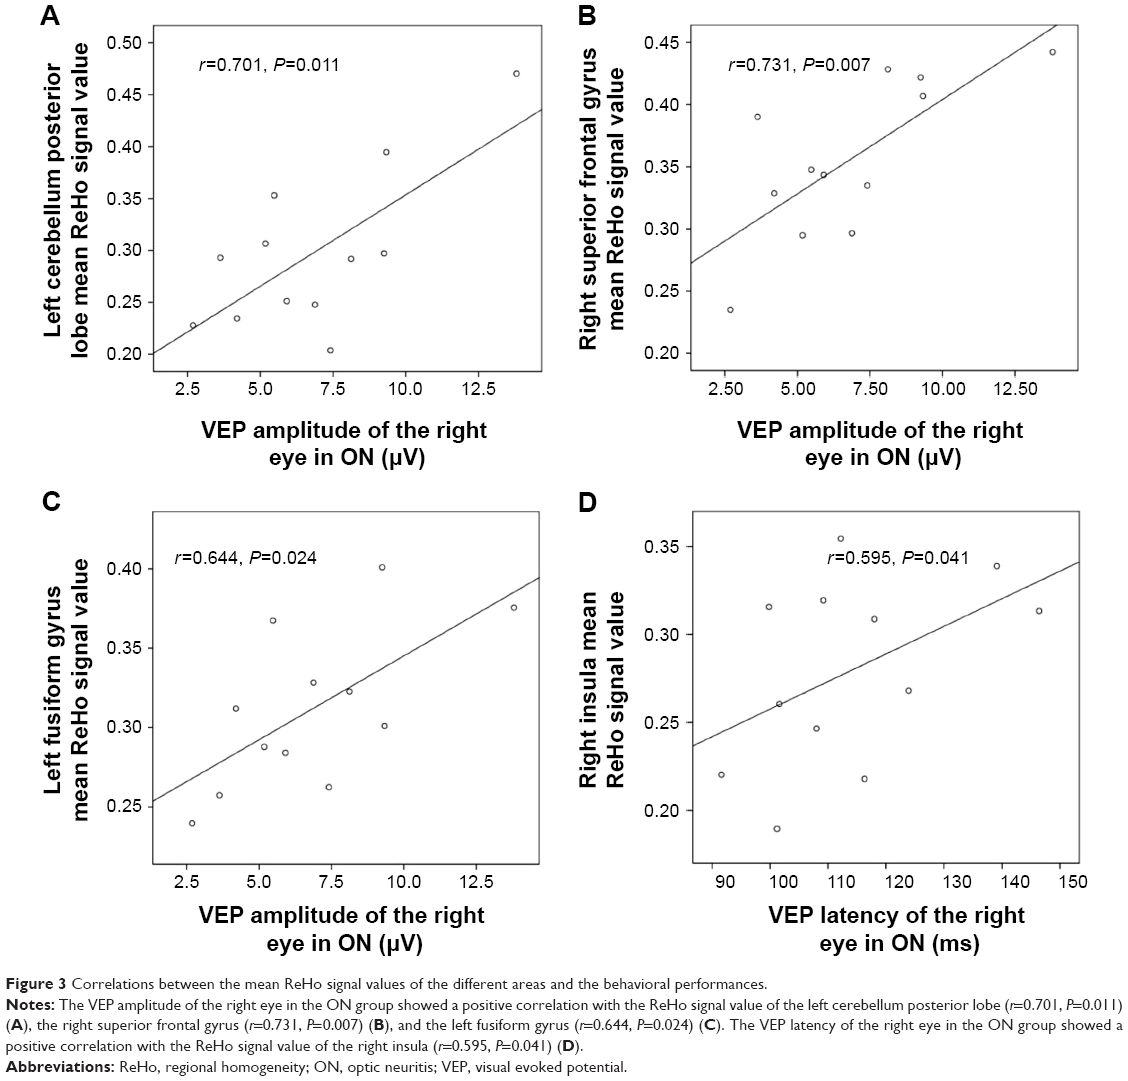 | Figure 3 Correlations between the mean ReHo signal values of the different areas and the behavioral performances. |
Receiver-operating characteristic curve
We found differences in ReHo areas between the ON and HC groups, which might be utilized as markers to separate patients from HCs. To test this possibility, the mean ReHo values of the different brain regions were extracted and used for analysis of the receiver-operating characteristic curves. In our study, the values for the area under the curve of the left cerebellum posterior lobe (Figure 4A) and the cluster of the right precentral gyrus (Figure 4B) were 0.917 and 0.958, respectively.
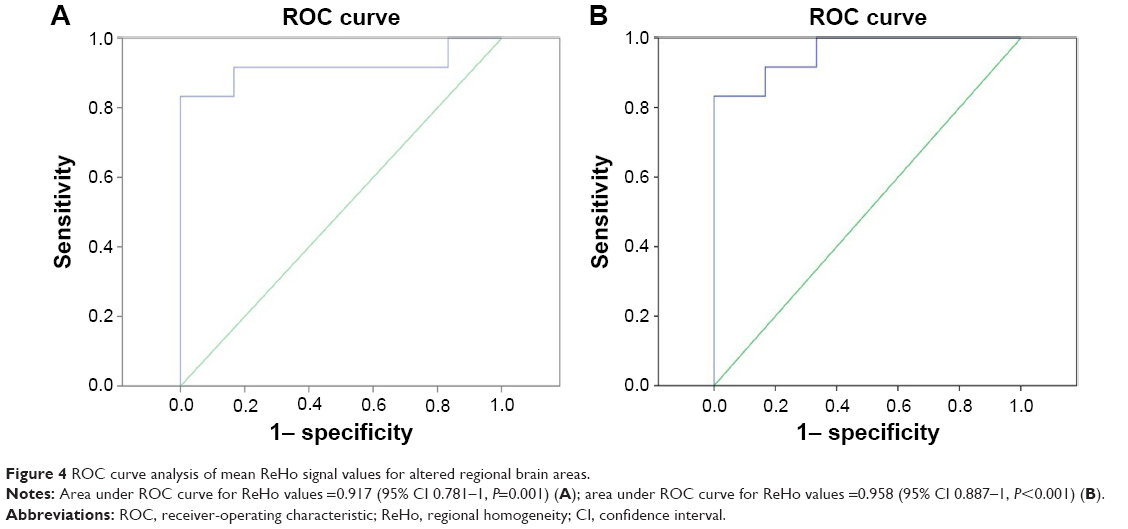 | Figure 4 ROC curve analysis of mean ReHo signal values for altered regional brain areas. |
Discussion
To our knowledge, this study is the first to evaluate the effect of ON on resting-state brain activity using the ReHo approach. In our study, we found that the ON group showed lower ReHo in the left cerebellum, posterior lobe, left middle temporal gyrus, right insula, right superior temporal gyrus, left middle frontal gyrus, bilateral anterior cingulate cortex, left superior frontal gyrus, right superior frontal gyrus, and right precentral gyrus, and higher ReHo in the cluster of the left fusiform gyrus and right inferior parietal lobule. Furthermore, we observed that the VEP amplitude of the right eye in ON showed a positive correlation with the ReHo signal value of the left cerebellum posterior lobe (r=0.701, P=0.011), right superior frontal gyrus (r=0.731, P=0.007), and left fusiform gyrus (r=0.644, P=0.024). We also found that the VEP latency of the right eye in ON showed a positive correlation with the ReHo signal value of the right insula (r=0.595, P=0.041); also, there was no obvious sex difference on ReHo signals in patients with ON in our study.
The cerebellum may be involved in cognition, in addition to its role in motion control,21 and damage to this area could lead to cognitive dysfunction.22 Previous studies have demonstrated that dysfunction of the cerebellum is involved in mood disorders,23 bipolar disorder,24 and depression.25 It is well known that ON is the foremost clinical feature of MS in 20% of patients,26 and Kutzelnigg et al27 found that cerebellar cortical demyelination is common in patients with MS. Ceccarelli et al28 demonstrated that patients with primary progressive MS had more obvious activation of the left cerebellum compared with patients having other forms of MS, while Loitfelder et al29 found that patients with relapsing–remitting MS showed increased activation in the cerebellum on fMRI. In support of these findings, we also found that patients with ON showed lower ReHo in the left cerebellum posterior lobe. ON may result in dysfunction of motor function. Furthermore, we also found that the VEP amplitude of the right eye in ON showed a positive correlation with the ReHo signal value of the left cerebellum posterior lobe (r=0.701, P=0.011). The reduced VEP amplitude of the eye in ON reflects the severity of optic nerve injury. Therefore, ON severity and cerebellar function are closely related. Our findings suggest that ON has a harmful effect on the cerebellum.
A previous study has demonstrated that there are some brain regions that show greater activity during the resting state than during task performance, and that these play an important role in maintaining steady brain function. The default-mode network (DMN) in the brain is continually activated during a resting-state condition.30 Many brain-function areas are involved in the DMN, including the medial frontal, anterior cingulate, inferior temporal, posterior cingulate, precuneus, and inferior parietal regions, and these brain areas have always been the hot spot in the study of the default mode.31 Several studies have shown dysfunction of the DMN in Parkinson’s disease,32 Alzheimer’s disease,33 schizophrenia,34 and depression.35 Toosy et al36 found that patients with ON showed abnormal activation of areas in the posterior parietal and lateral temporal cortices, while Werring et al37 reported similar findings in the lateral temporal and posterior parietal cortices and in the thalamus. Rocca et al38 reported that patients with MS had DMN abnormalities, which correlated with cognitive impairment. In support of these findings, we also found that patients with ON showed lower ReHo in the bilateral anterior cingulate cortex, bilateral medial frontal gyrus, and right superior temporal gyrus, indicating that ON has a harmful effect on the DMN. Furthermore, we also found that the VEP amplitude of the right eye in ON showed a positive correlation with the ReHo signal value of the right superior frontal gyrus (r=0.731, P=0.007). We therefore conclude that ON may lead to dysfunction of the right superior frontal gyrus.
The insula is located in the depths of the lateral sulcus,39 and has anatomical connections with the frontal, parietal, and temporal lobes.40 Previous studies have demonstrated that the insula play an important role in consciousness, bodily urges, and the control and suppression of natural urges.41,42 Dysfunction of the insula is also associated with disease, such as Alzheimer’s disease43 and epilepsy.44 Toosy et al36 and Werring et al37 found that patients with ON showed abnormal activation of areas in the insula–claustrum. In support of these findings, we found that patients with ON showed lower ReHo in areas of the right insula. Furthermore, we found that the VEP latency of the right eye in ON showed a positive correlation with the ReHo signal value of the right insula (r=0.595, P=0.041). ON may therefore lead to dysfunction of the insula.
The precentral gyrus is a part of the primary motor cortex that contains large neurons that connect to muscle.45 Cruz Gómez et al46 found that patients with MS showed a higher degree of gray matter in regions of the right paracentral gyrus, compared with HCs. Eshaghi et al47 also observed that patients with MS showed a higher level of decrease in gray-matter volume in the paracentral gyrus. In support of these findings, we also found that patients with ON showed lower ReHo in areas of the right precentral gyrus. Therefore, we conclude that ON has a harmful effect on the precentral gyrus as well.
The fusiform gyrus is the “fusiform face area”, which participates in face processing and social cognition.48,49 A previous study demonstrated that visual stimuli can cause increases in blood flow in the contralateral posterior fusiform.50 Therefore, fusiform gyrus function is closely related to visual function. In our study, we found that patients with ON showed higher ReHo in the cluster of the left fusiform gyrus. The higher ReHo areas in the left fusiform gyrus may relate to the compensation of the visual function in ON. Furthermore, we also observed that the VEP amplitude of the right eye in ON showed a positive correlation with the ReHo signal value of the left fusiform gyrus (r=0.644, P=0.024). A previous study51 showed that patients with ON had reduced VEP amplitude compared with controls. The reduced VEP amplitude in ON, to some extent, reflects the severity of ON. That is to say, the increased ReHo values of the fusiform gyrus may relate to the recovery of visual function in ON.
The inferior parietal lobule contributes to visual word recognition.52 Dysfunction of the inferior parietal lobule is also associated with such diseases as schizophrenia53 and Alzheimer’s.54 In our study, we found that patients with ON showed higher ReHo in the cluster of the right inferior parietal lobule, which may reflect compensation of the visual function in ON.
Conclusion
In summary, we found that patients with ON had brain changes, including abnormal spontaneous activity participation, which showed negative correlations with the amplitude of the eye. These findings provide important information for the understanding of the neural mechanisms underlying ON.
Acknowledgments
This study was supported by the National Natural Science Foundation of China (81160118 and 81400372); Clinical Medicine Research Special-Purpose Foundation of China (L2012052); Jiangxi Province Voyage Project (2014022); Jiangxi Province Degree and Postgraduate Education Reform Project (2015); Science and Technology Platform Construction Project of Jiangxi Province (2013116); Youth Science Foundation of Jiangxi Province (20151BAB215016); Technology and Science Foundation of Jiangxi Province (20151BBG70223); Jiangxi Province Education Department Scientific Research Foundation (GJJ14170); Health Development Planning Commission Science Foundation of Jiangxi Province (20155154); and Scholar Project of Ganjiang River (2015).
Disclosure
This was not an industry-supported study. The authors report no conflicts of interest in this work.
References
Jayaraman M, Gandhi RA, Ravi P, et al. Multifocal visual evoked potential in optic neuritis, ischemic optic neuropathy and compressive optic neuropathy. Indian J Ophthalmol. 2014;62(3):299–304. | ||
Pau D, Al Zubidi N, Yalamanchili S, Plant GT, Lee AG. Optic neuritis. Eye (Lond). 2011;25(7):833–842. | ||
Wakakura M, Minei-Higa R, Oono S, et al. Baseline features of idiopathic optic neuritis as determined by a multicenter treatment trial in Japan. Optic Neuritis Treatment Trial Multicenter Cooperative Research Group (ONMRG). Jpn J Ophthalmol. 1999;43(2):127–132. | ||
Audoin B, Fernando KT, Swanton JK, Thompson AJ, Plant GT, Miller DH. Selective magnetization transfer ratio decrease in the visual cortex following optic neuritis. Brain. 2006;129(Pt 4):1031–1039. | ||
Grecescu M. Optical coherence tomography versus visual evoked potentials in detecting subclinical visual impairment in multiple sclerosis. J Med Life. 2014;7(4):538–541. | ||
Klistorner A, Arvind H, Nguyen T. Axonal loss and myelin in early ON loss in postacute optic neuritis. Ann Neurol. 2008;64(3):325–331. | ||
Hood DC, Odel J G, Zhang X. Tracking the recovery of local optic nerve function after optic neuritis: a multifocal VEP study. Invest Ophthalmol Vis Sci. 2000;41(12):4032–4038. | ||
Wu GF, Brier MR, Parks CA, Ances BM, Van Stavern GP. An eye on brain integrity: acute optic neuritis affects resting state functional connectivity. Invest Ophthalmol Vis Sci. 2015;56(4):2541–2546. | ||
Li M, Li J, He H, et al. Directional diffusivity changes in the optic nerve and optic radiation in optic neuritis. Br J Radiol. 2011;84(1000):304–314. | ||
Korsholm K, Madsen KH, Frederiksen JL, Skimminge A, Lund TE. Recovery from optic neuritis: an ROI-based analysis of LGN and visual cortical areas. Brain. 2007;130(Pt 5):1244–1253. | ||
Mascioli G, Salvolini S, Cavola GL, et al. Functional MRI examination of visual pathways in patients with unilateral optic neuritis. Radiol Res Pract. 2012;2012:265306. | ||
Trip SA, Wheeler-Kingshott C, Jones SJ, et al. Optic nerve diffusion tensor imaging in optic neuritis. Neuroimage. 2006;30(2):498–505. | ||
Huang X, Zhong YL, Zeng XJ, et al. Disturbed spontaneous brain activity pattern in patients with primary angle-closure glaucoma using amplitude of low-frequency fluctuation: a fMRI study. Neuropsychiatr Dis Treat. 2015;11:1877–1883. | ||
Zang Y, Jiang T, Lu Y, He Y, Tian L. Regional homogeneity approach to fMRI data analysis. Neuroimage. 2004;22(1):394–400. | ||
Tononi G, McIntosh AR, Russell DP, Edelman GM. Functional clustering: identifying strongly interactive brain regions in neuroimaging data. Neuroimage. 1998;7(2):133–149. | ||
Zhang Z, Liu Y, Jiang T, et al. Altered spontaneous activity in Alzheimer’s disease and mild cognitive impairment revealed by regional homogeneity. Neuroimage. 2012;59(2):1429–1440. | ||
Tang YL, Ji GJ, Yu Y, et al. Altered regional homogeneity in rolandic epilepsy: a resting-state fMRI study. Biomed Res Int. 2014;2014:960395. | ||
Dai XJ, Peng DC, Gong HH, et al. Altered intrinsic regional brain spontaneous activity and subjective sleep quality in patients with chronic primary insomnia: a resting-state fMRI study. Neuropsychiatr Dis Treat. 2014;10:2163–2175. | ||
Wu T, Long X, Zang Y, et al. Regional homogeneity changes in patients with Parkinson’s disease. Hum Brain Mapp. 2009;30(5):1502–1510. | ||
Yu D, Yuan K, Zhao L, Liang F, Qin W. Regional homogeneity abnormalities affected by depressive symptoms in migraine patients without aura: a resting state study. PLoS One. 2013;8(10):e77933. | ||
Glickstein M, Doron K. Cerebellum: connections and functions. Cerebellum. 2008;7(4):589–594. | ||
Paulus KS, Magnano I, Conti M. Pure post-stroke cerebellar cognitive affective syndrome: a case report. Neurol Sci. 2004;25(4):220–224. | ||
Soares JC, Mann JJ. The anatomy of mood disorders – review of structural neuroimaging studies. Biol Psychiatry. 1997;41(1):86–106. | ||
Baldaçara L, Nery-Fernandes F, Rocha M, et al. Is cerebellar volume related to bipolar disorder? J Affect Disord. 2011;135(1–3):305–309. | ||
Bledsoe JC, Semrud-Clikeman M, Pliszka SR. Neuroanatomical and neuropsychological correlates of the cerebellum in children with attention-deficit/hyperactivity disorder – combined type. J Am Acad Child Adolesc Psychiatry. 2011;50(6):593–601. | ||
Dooley MC, Foroozan R. Optic neuritis. J Ophthalmic Vis Res. 2010;5(3):182–187. | ||
Kutzelnigg A, Faber-Rod JC, Bauer J, et al. Widespread demyelination in the cerebellar cortex in multiple sclerosis. Brain Pathol. 2007;17(1):38–44. | ||
Ceccarelli A, Rocca MA, Valsasina P, et al. Structural and functional magnetic resonance imaging correlates of motor network dysfunction in primary progressive multiple sclerosis. Eur J Neurosci. 2010;31(7):1273–1280. | ||
Loitfelder M, Fazekas F, Koschutnig K, et al. Brain activity changes in cognitive networks in relapsing-remitting multiple sclerosis – insights from a longitudinal fMRI study. PLoS One. 2014;9(4):e93715. | ||
Raichle ME, MacLeod AM, Snyder AZ, Powers WJ, Gusnard DA, Shulman GL. A default mode of brain function. Proc Natl Acad Sci U S A. 2001;98(2):676–682. | ||
Beason-Held LL. Dementia and the default mode. Curr Alzheimer Res. 2011;8(4):361–365. | ||
Yao N, Shek-Kwan Chang R, Cheung C, et al. The default mode network is disrupted in Parkinson’s disease with visual hallucinations. Hum Brain Mapp. 2014;35(11):5658–5666. | ||
Chang YT, Huang CW, Chang YH, et al. Amyloid burden in the hippocampus and default mode network: relationships with gray matter volume and cognitive performance in mild stage Alzheimer disease. Medicine (Baltimore). 2015;94(16):e763. | ||
Pankow A, Deserno L, Walter M, et al. Reduced default mode network connectivity in schizophrenia patients. Schizophr Res. 2015;165(1):90–93. | ||
Liu Y, Wu X, Zhang J, Guo X, Long Z, Yao L. Altered effective connectivity model in the default mode network between bipolar and unipolar depression based on resting-state fMRI. J Affect Disord. 2015;182:8–17. | ||
Toosy AT, Werring DJ, Bullmore ET, et al. Functional magnetic resonance imaging of the cortical response to photic stimulation in humans following optic neuritis recovery. Neurosci Lett. 2002;330(3):255–259. | ||
Werring DJ, Bullmore ET, Toosy AT, et al. Recovery from optic neuritis is associated with a change in the distribution of cerebral response to visual stimulation: a functional magnetic resonance imaging study. J Neurol Neurosurg Psychiatry. 2000;68(4):441–449. | ||
Rocca MA, Valsasina P, Absinta M, et al. Default-mode network dysfunction and cognitive impairment in progressive MS. Neurology. 2010;74(16):1252–1259. | ||
Mesulam MM, Mufson EJ. Insula of the Old World monkey. III: Efferent cortical output and comments on function. J Comp Neurol. 1982;212(1):38–52. | ||
Flynn FG, Benson DF, Ardila A. Anatomy of the insula – functional and clinical correlates. Aphasiology. 1999;13(1):55–78. | ||
Naqvi NH, Rudrauf D, Damasio H, Bechara A. Damage to the insula disrupts addiction to cigarette smoking. Science. 2007;315(5811):531–534. | ||
Lerner A, Bagic A, Hanakawa T, et al. Involvement of insula and cingulate cortices in control and suppression of natural urges. Cereb Cortex. 2009;19(1):218–223. | ||
Hayata TT, Bergo FP, Rezende TJ, et al. Cortical correlates of affective syndrome in dementia due to Alzheimer’s disease. Arq Neuropsiquiatr. 2015;73(7):553–560. | ||
Dylgjeri S, Taussig D, Chipaux M, et al. Insular and insulo-opercular epilepsy in childhood: an SEEG study. Seizure. 2014;23(4):300–308. | ||
Binkofski F, Fink GR, Geyer S, et al. Neural activity in human primary motor cortex areas 4a and 4p is modulated differentially by attention to action. J Neurophysiol. 2002;88(1):514–519. | ||
Cruz Gómez AJ, Ventura Campos N, Belenguer A, Ávila C, Forn C. Regional brain atrophy and functional connectivity changes related to fatigue in multiple sclerosis. PLoS One. 2013;8(10):e77914. | ||
Eshaghi A, Bodini B, Ridgway GR, et al. Temporal and spatial evolution of grey matter atrophy in primary progressive multiple sclerosis. Neuroimage. 2014;86(100):257–264. | ||
Grelotti DJ, Klin AJ, Gauthier, et al. fMRI activation of the fusiform gyrus and amygdala to cartoon characters but not to faces in a boy with autism. Neuropsychologia. 2005;43(3):373–385. | ||
Kreifelts B, Jacob H, Brück C, Erb M, Ethofer T, Wildgruber D. Non-verbal emotion communication training induces specific changes in brain function and structure. Front Hum Neurosci. 2013;7:648. | ||
Mangun GR, Buonocore MH, Girelli M, Jha AP. ERP and fMRI measures of visual spatial selective attention. Hum Brain Mapp. 1998;6(5–6):383–389. | ||
Parisi V, Pierelli F, Restuccia R, et al. Impaired VEP after photostress response in multiple sclerosis patients previously affected byoptic neuritis. Electroencephalogr Clin Neurophysiol. 1998;108(1):73–79. | ||
Sliwinska MW, James A, Devlin JT. Inferior parietal lobule contributions to visual word recognition. J Cogn Neurosci. 2015;27(3):593–604. | ||
Danivas V, Kalmady S, Arasappa R, et al. Inferior parietal lobule volume and Schneiderian first-rank symptoms in antipsychotic-naïve schizophrenia: a 3-Tesla MRI study. Indian J Psychol Med. 2009;31(2):82–87. | ||
Reed TT, Pierce WM Jr, Turner DM, Markesbery WR, Butterfield DA. Proteomic identification of nitrated brain proteins in early Alzheimer’s disease inferior parietal lobule. J Cell Mol Med. 2009;13(8B):2019–2029. |
 © 2015 The Author(s). This work is published and licensed by Dove Medical Press Limited. The
full terms of this license are available at https://www.dovepress.com/terms
and incorporate the Creative Commons Attribution
- Non Commercial (unported, 3.0) License.
By accessing the work you hereby accept the Terms. Non-commercial uses of the work are permitted
without any further permission from Dove Medical Press Limited, provided the work is properly
attributed. For permission for commercial use of this work, please see paragraphs 4.2 and 5 of our Terms.
© 2015 The Author(s). This work is published and licensed by Dove Medical Press Limited. The
full terms of this license are available at https://www.dovepress.com/terms
and incorporate the Creative Commons Attribution
- Non Commercial (unported, 3.0) License.
By accessing the work you hereby accept the Terms. Non-commercial uses of the work are permitted
without any further permission from Dove Medical Press Limited, provided the work is properly
attributed. For permission for commercial use of this work, please see paragraphs 4.2 and 5 of our Terms.