Back to Journals » Neuropsychiatric Disease and Treatment » Volume 22
Altered Habenula Resting-State Functional Connectivity and Spatial Associations with Neurotransmitter Receptor Distribution of Major Depressive Disorder with and without Anhedonia
Authors Luo X, Wu Y, Yuan L ![]() , Wang Y
, Wang Y ![]() , Li J, Xu P, Lian J, Liu X
, Li J, Xu P, Lian J, Liu X ![]() , Shen Z
, Shen Z
Received 7 November 2025
Accepted for publication 21 March 2026
Published 27 March 2026 Volume 2026:22 577735
DOI https://doi.org/10.2147/NDT.S577735
Checked for plagiarism Yes
Review by Single anonymous peer review
Peer reviewer comments 2
Editor who approved publication: Professor Taro Kishi
Xiaoyun Luo,1,* Yanru Wu,1,* Lijin Yuan,1 Yiyun Wang,1 Jing Li,1 Pu Xu,1 Jigang Lian,1 Xiaoyan Liu,2 Zonglin Shen1,3
1Department of Psychiatry, The First Affiliated Hospital of Kunming Medical University, Kunming, People’s Republic of China; 2Department of Psychiatry, Affiliated Mental Health Center & Hangzhou Seventh People’s Hospital, Zhejiang University School of Medicine, Hangzhou, People’s Republic of China; 3Yunnan Clinical Medical Center for Mental Disorders, Kunming, People’s Republic of China
*These authors contributed equally to this work
Correspondence: Xiaoyan Liu, Email [email protected] Zonglin Shen, Email [email protected]
Objective: This study aimed to examine functional connectivity (FC) alterations in patients with major depressive disorder (MDD), specifically comparing those with and without anhedonia.
Methods: 24 MDD patients with anhedonia (MDD-WA), 17 MDD patients without anhedonia (MDD-WoA), and 40 healthy controls (HCs) underwent resting-state functional magnetic resonance imaging (rs-fMRI). Intrinsic brain function was assessed using resting-state FC and spatial associations with neurotransmitter receptor distribution analyses. The habenula (Hb) was selected as the region of interest (ROI), and the whole-brain FC of the Hb was compared across groups. Spatial correlations between inter-group FC differences and whole-brain neurotransmitter receptor/transporter expression templates, derived using the JuSpace tool, were analyzed. Additionally, FC values from differential brain regions were extracted and correlated with the scores on the clinical scale.
Results: Compared to MDD-WoA patients, MDD-WA patients exhibited reduced FC between the Hb and the left middle frontal gyrus (MFG). Enhanced FC was observed between the Hb and bilateral putamen in MDD-WA patients compared to HCs. Additionally, in the MDD-WA group, changes in the Hb whole-brain FC demonstrated positive correlations with the spatial density distribution of specific neurotransmitter receptors and transporters. In contrast, MDD-WoA showed no significant Hb FC differences or neurotransmitter correlations compared to HCs. No significant correlations were found between the FC values of the intergroup-different brain regions and the total SHAPS-C, total HAMD-17, and all HAMD-17 factor scores (anxiety/somatization, weight loss, cognitive disturbance, retardation, and sleep disturbance).
Conclusion: In patients with MDD-WA, FC between the habenula and bilateral putamen, as well as between the habenula and left MFG, was altered. Given that the putamen is a core component of the striatum, all these findings suggest that habenula-prefrontal-striatal dysconnectivity may represent an anhedonia-specific biomarker in MDD. The FC patterns between the habenula and bilateral putamen/left middle frontal gyrus, along with the related neurotransmitter profiles identified in this study, may serve as objective indicators for monitoring therapeutic efficacy in the future.
Keywords: major depressive disorder, anhedonia, habenula, functional connectivity, neurotransmitter receptors
Introduction
Major depressive disorder (MDD) is a complex psychiatric condition characterized by persistent depressive mood, anhedonia, fatigue, and disturbances in appetite and body weight.1 Anhedonia, a core diagnostic criterion of MDD, involves impaired ability to experience pleasure or diminished motivation to pursue previously rewarding activities. This core symptom poses significant therapeutic challenges and predicts poor long-term clinical outcomes.2,3 Empirical evidence demonstrates that patients with severe anhedonic symptoms exhibit heightened susceptibility to suicidal ideation and demonstrate reduced therapeutic responsiveness to both pharmacological and psychotherapeutic interventions.2,3 Therefore, elucidating the etiopathological mechanisms underlying anhedonia is critical for advancing diagnostic precision and therapeutic strategies in MDD.
The neurobiological mechanisms underlying anhedonia in depression remain unclear, with current research primarily focusing on neural circuitry, molecular genetics, and immune-inflammatory pathways.4 At the neural circuit level, anhedonia is robustly linked to dysregulation within the mesolimbic reward system, including structures such as the ventral tegmental area (VTA), nucleus accumbens (NAc), prefrontal cortex (PFC), amygdala, and hippocampus. Structural abnormalities and functional connectivity disruptions within this circuit impair reward processing mechanisms, thereby contributing to anhedonic symptoms.5,6 Anhedonia comprises two distinct forms: anticipatory anhedonia (reduced motivation for reward seeking) and consummatory anhedonia (reduced pleasure during reward consumption). Previous studies have indicated that the SHAPS-C scale primarily assesses consummatory anhedonia.7 Additionally, emerging evidence indicates that aberrant functional connectivity between the reward network (RN) and other large-scale brain networks, particularly the default mode network (DMN), plays a crucial role in the anhedonia pathophysiology, with diminished resting-state connectivity between these networks correlating with increased symptom severity.8
Emerging evidence has elucidated the critical role of dysregulated aversion circuits in the neurobiological mechanisms underlying anhedonia. These circuits encompass key brain regions, including the lateral habenula (LHb), medial prefrontal cortex (mPFC), ventral pallidum, ventral tegmental area (VTA), amygdala, and insula.9,10 Previous fMRI studies in MDD patients have demonstrated that anhedonia severity positively correlates with insular activation during negative emotional stimuli processing.11 Furthermore, ventral pallidum dysfunction contributes to anhedonia by disrupting both reward expectation and evaluation in patients with MDD.12,13 Preclinical rodent studies employing chronic stress paradigms indicate that early life stress-induced anhedonia is mediated through augmented structural connectivity between the amygdala and prefrontal cortex (PFC), resulting in elevated corticotropin-releasing hormone (CRH) production in the amygdala.14 These findings highlight a complex interplay between stress-mediated pathways and aversion circuit dysregulation in anhedonia pathogenesis. Furthermore, the insula—a pivotal hub for interoception15 —may contribute to the pathophysiology of anhedonia through its hyperactivation, potentially amplifying neural responses to negative emotional stimuli.
The habenula (Hb), a phylogenetically conserved epithalamic structure, is a critical neural substrate in anhedonia pathophysiology, particularly through its role in aversion processing. Comprising two distinct subnuclei—the medial habenula (MHb) and lateral habenula (LHb)—the Hb exhibits specialized functions, with the LHb serving as a key neural hub for the integration of aversive stimuli.10 The LHb demonstrates extensive functional connectivity with both the reward system and motor control regions, underpinning its significant influence on reward sensitivity and processing deficits in MDD.10 Neurophysiological studies indicate that glutamatergic activation within the LHb inhibits ventral tegmental area (VTA) neurons, particularly those responsive to reward stimuli and suppressed by aversive inputs.16 This mechanistic insight is further supported by functional neuroimaging evidence, which reveals heightened activity in the Hb-VTA pathway during aversive stimuli exposure.17 Collectively, these findings underscore the Hb-VTA circuit as a critical modulator of reward-aversion processing, with Hb dysfunction potentially driving maladaptive behavioral responses characterized by increased sensitivity to negative stimuli and diminished reward responsiveness.
At the neurochemical level, the habenula exhibits bidirectional regulation with the monoaminergic systems. Preclinical evidence indicates that serotonergic projections from the dorsal raphe nucleus (DRN) inhibit lateral habenula (LHb) neuronal excitability. Conversely, reduced 5-hydroxytryptamine (5-HT) transmission promotes depressive-like behaviors via LHb activation.18 The LHb also strongly suppresses serotonergic output, inhibiting over 50% of 5-HT release in the DRN.19 Similarly, the dopaminergic (DA) system is reciprocally regulated: the dopamine receptor agonist apomorphine increases the spontaneous firing rate of LHb neurons,20 whereas single-pulse electrical stimulation of the habenula exerts a transient inhibitory effect on 97% of DA neurons in the ventral tegmental area (VTA) and substantia nigra pars compacta.21 Collectively, the habenula modulates 5-HT and DA release via its efferent projections to the DRN and VTA, respectively, thereby playing a pivotal role in regulating emotional processes within the reward circuitry.
Anhedonia, a core symptom of MDD, involves dysregulation in neural circuitry and neurotransmitter systems, reflecting a complex interplay between molecular and systems-level regulatory mechanisms in the brain. Specifically, neural circuit abnormalities are characterized by impaired functionality in the reward pathway and hyperactivation in the aversion circuit. The Hb, a critical node in the brain’s anti-reward system and a central component of the aversion circuit, plays a pivotal role in the pathophysiology of anhedonia through its influence on both neural circuit dynamics and neurobiological processes. Depression pathogenesis has been increasingly investigated using resting-state functional magnetic resonance imaging (rs-fMRI), task-based fMRI, and effective connectivity fMRI.22 In this context, the present study used rs-fMRI to analyze habenular functional connectivity alterations in depressed patients with and without anhedonia, and to examine their relationship with neurotransmitter receptor distributions.
First, we adopted a case-control study design and used fMRI to assess whole-brain FC changes of the Hb in patients with MDD. Second, we obtained information on relevant receptors and transporters in patients with MDD to explore the spatial correlation between depression-related changes in functional connectivity and the distribution of neurotransmitter receptors. We hypothesized that (1) the MDD-WA group would exhibit decreased functional connectivity between the habenula and middle frontal gyrus compared with the MDD-WoA group, and would show increased functional connectivity between the habenula and putamen compared with the HCs; (2) whole-brain Hb FC alterations in MDD would be correlated with the density of 5-HT receptors/transporters and DA receptors/transporters. Based on these hypotheses, this study aims to systematically elucidate the differential pathophysiological features of MDD with and without anhedonia, thereby providing a theoretical basis for clinical diagnosis and treatment practice. These results may not only help establish diagnostic criteria but also offer implications for individualized treatment plans.
Materials and Methods
Participants
The current study recruited 46 participants from the outpatient and inpatient psychiatric departments at the First Affiliated Hospital of Kunming Medical University between June 2023 and September 2024. During the recruitment phase, medication status were strictly controlled. All patients in both the MDD-WA and MDD-WoA groups were first-episode, medication-naïve individuals.
The inclusion criteria for MDD patients were: (1) age between 17 and 60 years; (2) diagnosis of MDD according to the Diagnostic and Statistical Manual of Mental Disorders, Fifth Edition (DSM-5) criteria; (3) no educational restrictions, with sufficient cognitive capacity to comprehend and complete psychometric assessments; (4) a minimum score of 14 on the 17-item Hamilton Depression Rating Scale (HAMD-17); and (5) provision of written informed consent by either the participant or their legal guardian. Exclusion criteria were: (1) any psychiatric diagnosis other than MDD based on the DSM-5 criteria; (2) history of significant neurological conditions, including severe head trauma, brain tumors, intracranial infections, cerebrovascular diseases, epilepsy, or other identifiable neurological lesions; (3) severe systemic illnesses interfering with participation (investigator-determined); (4) pregnancy; and (5) magnetic resonance imaging (MRI) contraindications (vascular stent implantation, cardiac pacemakers, metallic dental implants, or claustrophobia).
Healthy controls (HCs) were recruited based on the following inclusion criteria: (1) age between 17 and 60 years; (2) sufficient cognitive capacity to complete assessments regardless of educational background; and (3) provision of written informed consent by either the participant or their legal guardian. Exclusion criteria for HC participants were: (1) family history of psychiatric disorders; (2) history of severe physical illnesses, neurological disorders, or traumatic brain injuries; (3) pregnancy; and (4) magnetic resonance imaging (MRI) contraindications. After screening, 51 HCs were enrolled.
The research protocol received formal ethical approval from the Institutional Review Board of the First Affiliated Hospital of Kunming Medical University (Approval No: (2022) Ethics Review L No. 269). Written informed consent was obtained from all participants before study enrollment and under the age of 18 had their informed consent signed by their legal guardians.
Clinical Assessment
Demographic and clinical characteristics, including age, gender, ethnicity, educational level, medical history, and family history, were collected using a standardized questionnaire. Clinical assessments were performed by a board-certified psychiatrist affiliated from the Department of Psychiatry at the First Affiliated Hospital of Kunming Medical University. The severity of depressive symptoms was evaluated using the HAMD-17, a validated clinician-administered instrument. The HAMD-17 assesses five distinct domains: anxiety/somatization (including psychic anxiety, somatic anxiety, gastrointestinal symptoms, general symptoms, hypochondriasis, and insight), weight loss, cognitive impairment (encompassing guilt, suicidal ideation, and agitation), psychomotor retardation (evaluating depressed mood, work and interest, retardation, and sexual symptoms), and sleep disturbance (assessing difficulty falling asleep, light sleep, and early awakening). Domain-specific scores were calculated as the sum of individual item scores divided by the number of items within each domain.23 Additionally, anhedonia severity was measured using the Snaith-Hamilton Pleasure Scale-Chinese version (SHAPS-C),24 a 14-item scale that evaluates four dimensions: interest and pastimes, social interactions, sensory experiences, and dietary pleasure. Responses were recorded on a 4-point Likert scale (1 = strongly agree, 2 = agree, 3 = disagree, 4 = strongly disagree). For analytical purposes, responses were binarized25 (agree/strongly agree=0; disagree/strongly disagree=1). Participants with a transformed total score > 5 were classified into the Major Depressive Disorder with Anhedonia (MDD-WA) group, while those with scores ≤5 were classified into the Major Depressive Disorder without Anhedonia (MDD-WoA) group.
fMRI Data Acquisition and Preprocessing
Neuroimaging data were obtained from all participants utilizing a 3.0T GE MRI scanner under the supervision of a certified radiological technician at the First Affiliated Hospital of Kunming Medical University. To mitigate motion artifacts, participants were positioned in a supine posture with their heads immobilized using foam padding and were instructed to maintain a resting state with their eyes closed while remaining conscious. Resting-state functional magnetic resonance imaging (rs-fMRI) was conducted employing a single-shot gradient-recalled-echo echo-planar-imaging (SS-GRE-EPI) sequence with the following acquisition parameters: repetition time (TR) = 2000 ms; echo time (TE) = 35 ms; field of view (FOV) = 220×220 mm2; matrix size = 64 × 64; flip angle (FA) = 90°; slice thickness = 3.0 mm; 36 axial slices; and 185 temporal volumes.
Neuroimaging data preprocessing was conducted using the Data Processing and Analysis of Brain Imaging (DPABI) toolbox (version 4.3, http://www.rfmri.org/Dpabi) within the MATLAB 2020a computational environment. The standardized preprocessing protocol includes seven sequential steps: (1) elimination of the initial 10 functional volumes to mitigate magnetic field instability and facilitate participant acclimatization; (2) implementation of slice timing correction to compensate for temporal discrepancies inherent in multi-slice acquisition protocols; (3) motion correction with stringent exclusion criteria established at translational displacements exceeding 2.5 mm or rotational deviations surpassing 2.5° in any spatial dimension; (4) spatial normalization to the Montreal Neurological Institute (MNI) standard template space utilizing the DARTEL (Diffeomorphic Anatomical Registration Through Exponentiated Lie algebra) algorithm, with subsequent resampling to an isotropic voxel resolution of 3×3×3 mm3; (5) application of spatial smoothing with a 4 mm full-width at half-maximum (FWHM) Gaussian kernel to enhance signal-to-noise ratio; (6) linear detrending to eliminate baseline drift artifacts; and (7) band-pass filtering (0.01–0.1 Hz) to attenuate both low-frequency drift and high-frequency physiological noise. To further minimize confounding effects, nuisance covariates comprising Friston-24 motion parameters, white matter signal, and cerebrospinal fluid signal were regressed from the data.
Define ROI
The habenula (Hb) template was obtained from the Automated Human Habenula Segmentation Program (version v0.1-alpha, https://github.com/junqianxulab/habenula_segmentation). Given the small anatomical volume of the habenula and the absence of significant functional connectivity differences between its medial and lateral subregions,26 the present study employed the REST toolbox (http://restfmri.net/forum/) to generate a unified habenula template. This composite template was then resliced in MNI space at 3×3×3 mm3 resolution for subsequent analyses.
Functional Connectivity
Functional connectivity (FC) analysis was performed using the DPABI toolbox implemented in the MATLAB environment. The analytical protocol proceeded as follows: First, Pearson correlation coefficients were calculated between the mean time series of the Hb and the mean time series of each voxel throughout the whole brain for each subject. These correlation coefficients were subsequently transformed into z-values using Fisher’s z-transformation to normalize their distribution. The resulting FC values for each voxel across the whole brain were then employed to quantify the strength of functional connectivity between the seed region and corresponding cerebral areas. Regions demonstrating statistically significant FC values were subsequently identified.
Spatial Correlation Between Whole-Brain FC of the Hb in MDD and the Density Distribution of Neurotransmitter Receptors/Transporters
To investigate the neural mechanisms underlying Hb whole-brain FC alterations in MDD, voxel-wise unthresholded T-statistic maps derived from t-tests (representing Hb whole-brain FC changes in MDD with or without anhedonia) were spatially correlated with brain-wide expression patterns of receptors and transporters using the JuSpace toolbox.27 Specifically, mean regional values were extracted from the T-statistic maps and whole-brain spatial expression profiles of neurotransmitter receptors/transporters, based on the Neuromorphometrics atlas. Spatial correlations between these mean regional values and the whole-brain of neurotransmitter receptors and transporters were then computed. Positron emission tomography (PET)-and single-photon emission computed tomography (SPECT)-derived maps of neurotransmitter receptors and transporters were analyzed via Spearman correlation within the JuSpace toolbox, with false discovery rate (FDR) correction for multiple comparisons at a significance threshold of p < 0.05.
Statistical Analysis
Demographic and clinical data were analyzed using the Statistical Package for the Social Sciences (SPSS, version 26.0). Categorical variables such as gender were analyzed using Chi-square tests (χ2). Normally distributed data between three groups were analyzed by ANOVA. Independent sample t-tests were performed to compare data that are normally distributed between two groups. Specifically, independent sample T-tests were used to compare the inter-group differences of anxiety/somaticization factor scores and cognitive impairment factor scores between the MDD-WA and MDD-WoA groups. A P value <0.05 was considered statistically significant. Analysis of covariance (ANCOVA) was performed to evaluate FC among the three groups using the DPABI toolbox (version 4.3, http://www.rfmri.org/Dpabi), adjusting age and gender as the covariates. Independent samples t-tests were conducted to compare Hb whole-brain FC between groups. Subsequently, the unthresholded T-statistic maps derived from the preceding t-tests were utilized as input for spatial correlation analysis with the brain-wide spatial expression of receptors/transporters provided by the JuSpace toolbox. JuSpace enables spatial correlation analysis between magnetic resonance imaging data and neurotransmitter maps derived from nuclear imaging. Its workflow comprises five stages: data input and experimental design, regional mean value extraction, parameter configuration, spatial correlation analysis with statistical testing, and result output and validation.28 Gaussian random field theory (GRF) was applied to correct for multiple comparisons, with significance thresholds set at p < 0.05 (voxel significance: p < 0.005; cluster significance: p < 0.05). Finally, FC values from brain regions exhibiting statistically significant differences were extracted using region of interest (ROI) analysis. These values were then correlated with clinical characteristics, including total scores of the HAMD-17 and the SHAPS-C, as well as factor scores for anxiety/somatization, weight loss, cognitive impairment, retardation, and sleep disturbance. A p-value < 0.05 was considered statistically significant.
Results
Demographic Data and Clinical Symptoms
2 MDD patients and 2 HCs were excluded due to poor image quality. 2 MDD patients and 9 HCs were then excluded due to motion artifacts. Additionally, 1 MDD patient was excluded due to incomplete scale data. As a result, the final study cohort comprised three groups: the MDD-WA group (n=24; 9 males, 15 females; median age=22.50, interquartile range [IQR]=20-29.75), the MDD-WoA group (n=17; 6 males, 11 females; mean age=27.76±8.63), and the HC group (n=40; 14 males, 26 females; median age=25, IQR=23-27.75).
Demographic analysis revealed no statistically significant differences among the three groups in terms of age (P=0.290), years of education (P=0.270), or gender (P=0.979). Significant differences in the total SHAPS-C score (P<0.01) were observed between the MDD-WA and MDD-WoA groups. However, no significant differences in the total HAMD-17 score (P=0.902) or its subscale scores (weight loss factor (P=0.066), retardation factor (P=0.234), sleep disturbance factor (P=0.923), anxiety/somatization factor (P=0.785), and cognitive impairment factor (P=0.305) were observed between these groups (See Table 1).
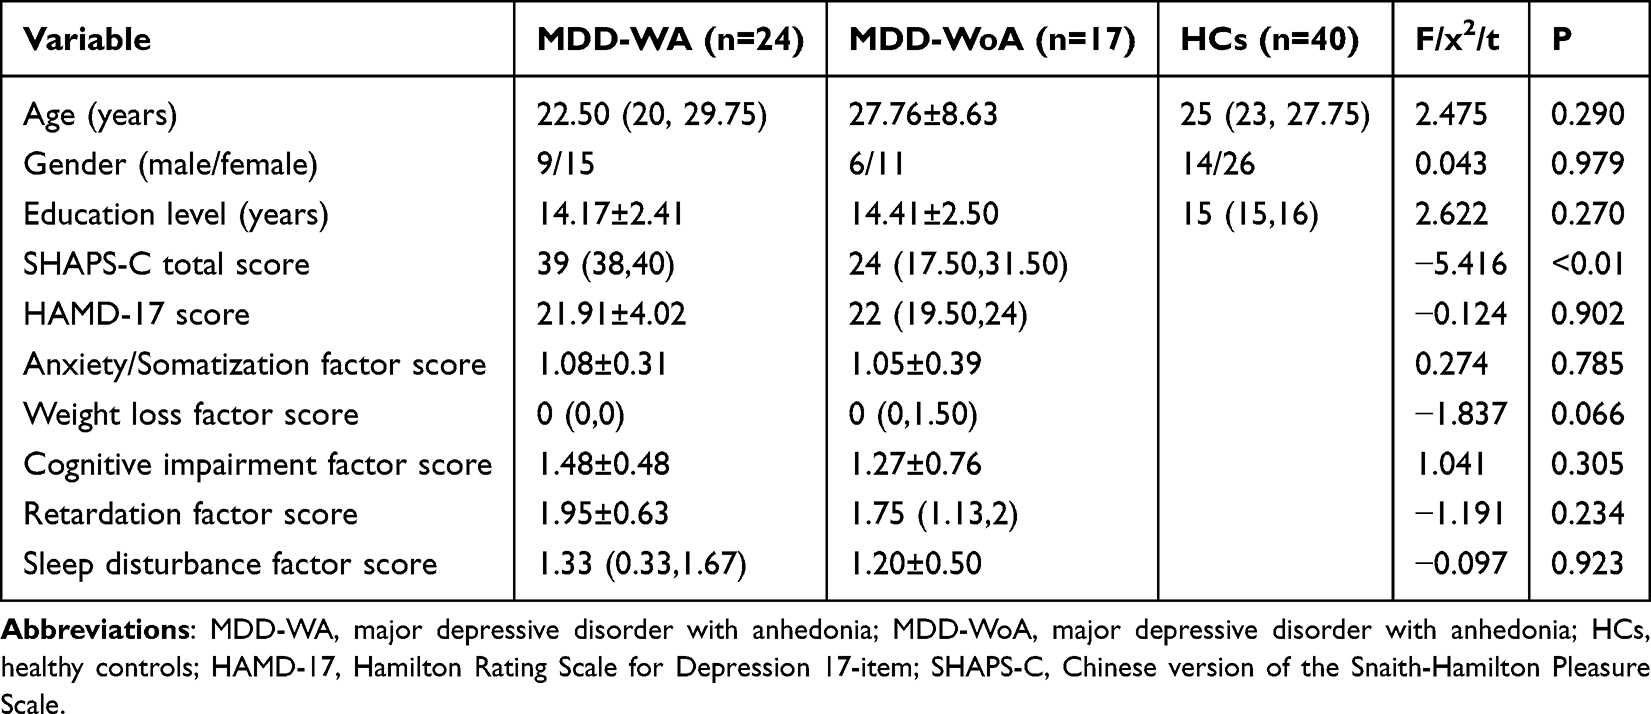 |
Table 1 Demographic and Clinical Characteristics of MDD-WA, MDD-WoA and HC Groups |
FC Between-Group Differences
Covariance analysis revealed no statistically significant differences in brain regions between the two groups. Independent sample t-tests indicated that, compared to the MDD-WoA group, the MDD-WA group exhibited significantly reduced FC between the Hb and the left middle frontal gyrus (MFG) (MNI coordinates: x = −42, y = 0, z = 57; voxels = 146; Z = −5.1954, p < 0.05). Additionally, when compared to the HC group, the MDD-WA group demonstrated significantly enhanced FC between the Hb and the left putamen (MNI coordinates: x = −21, y = 12, z = −12; voxels =134; Z = 4.2797, p < 0.05), as well as the right putamen (MNI coordinates: x = 21, y = 9, z = −12; voxels =141; Z = 4.4915, p < 0.05). Detailed results are presented in Table 2, Figures 1 and 2. The mean and standard deviation of FC between the Hb and the whole brain across the three groups are depicted in Figure 3.
 |
Table 2 Group Differences in Hb Whole-Brain FC Among MDD-WA, MDD-WoA and HC Groups |
 |
Figure 1 Brain regions with significantly different Hb whole-brain FC between the MDD-WA group and the MDD-WoA group. |
 |
Figure 2 Brain regions with significantly different Hb whole-brain FC between the MDD-WA group and the HC group. |
 |
Figure 3 Mean and standard deviation of Hb and whole-brain FC in MDD-WA, MDD-WoA, and HC groups. |
Correlations Between FC Changes of Hb and the Spatial Density Distribution of Neurotransmitter Receptors/Transporters in MDD
Neurotransmitter Receptors/Transporters of Hb’s FC Changes Between the MDD-WA Group and the MDD-WoA Group
Significant associations were observed between alterations in Hb levels and whole-brain FC with key neurotransmitter systems in both the MDD-WA group and the MDD-WoA. Specifically, these changes were correlated with the serotonin system (SERT), dopamine system (D1, DAT, FDOPA), noradrenaline transporter (NAT), and vesicular acetylcholine transporter (VAChT). Details are presented in Table 3 and Figure 4.
 |
Table 3 Correlations Between FC Changes of Hb in the MDD-WA Group and the MDD-WoA Group and the Spatial Distribution of Neurotransmitter Receptors/Transporters |
 |
Figure 4 Spatial distribution correlations between FC alterations in Hb and neurotransmitter receptors/transporters in the MDD-WA group and the MDD-WoA group. Abbreviations: D1, dopamine D1; D2, dopamine D2; DAT, dopamine transporter; FDOPA, dopamine synthesizing ability; 5-HT1a, 5-HT subtype 1a; 5-HT1b, 5-HT1b subtype; 5-HT2a, 5-HT subtype 2a; 5-HT4, 5-HT subtype 4; SERT, serotonin transporter; CB1, cannabinoid receptor 1; GABAa, GABAergic receptor subtype a; MU, mu-opioid receptor; NAT, norepinephrine transporter; VAChT, vesicular acetylcholine transporter; mGluR5, metabotropic glutamate type 5 receptor. Notes: “*” indicates significant correlation. |
Neurotransmitter Receptors/Transporters of Hb’s FC Changes Between the MDD-WA Group and the HC Group
Similarly, when comparing the MDD-WA group and the HC group, changes in Hb and whole-brain FC were significantly associated with the serotonin system (SERT), dopamine system (D1, D2, DAT, FDOPA), NAT, and VAChT, as presented in Table 4 and Figure 5.
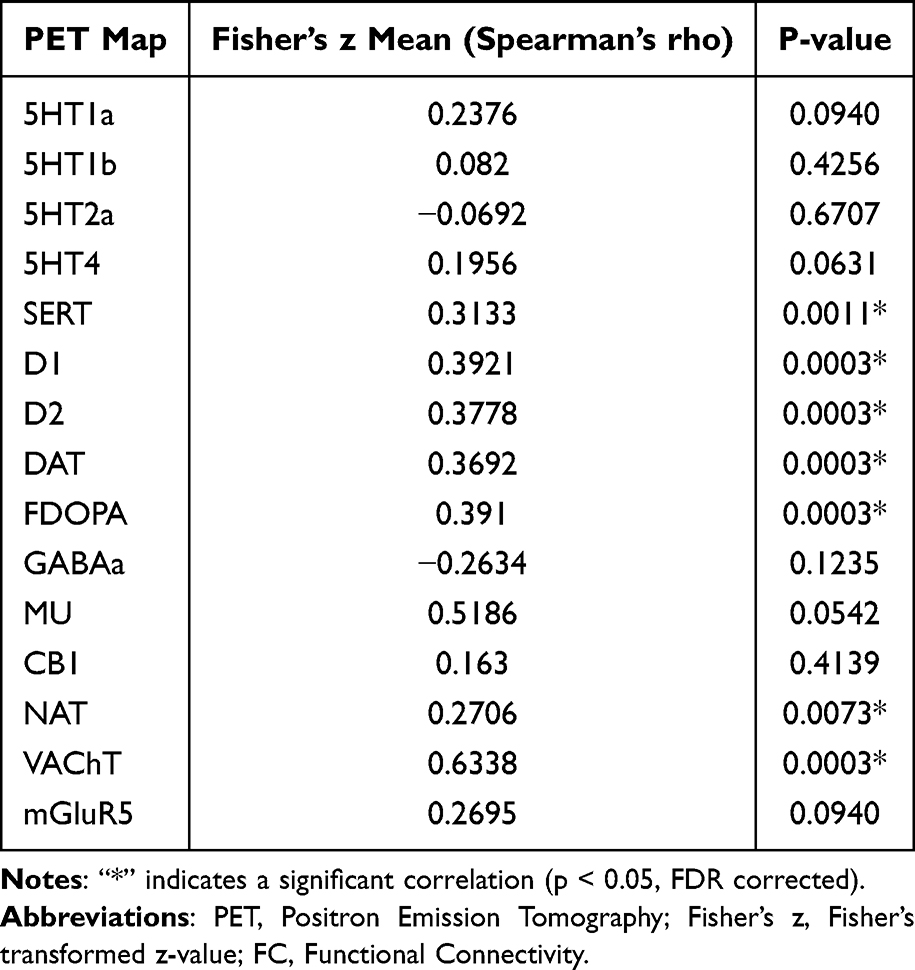 |
Table 4 Spatial Distribution Correlations Between Hb FC Alterations in MDD-WA versus HC and Neurotransmitter Receptors/Transporters |
 |
Figure 5 Spatial distribution correlations between Hb FC alterations and neurotransmitter receptors/transporters in the MDD-WA group and the HC group. Abbreviations: D1, dopamine D1; D2, dopamine D2; DAT, dopamine transporter; FDOPA, dopamine synthesizing ability; 5-HT1a, 5-HT subtype 1a; 5-HT1b, 5-HT1b subtype; 5-HT2a, 5-HT subtype 2a; 5-HT4, 5-HT subtype 4; SERT, serotonin transporter; CB1, cannabinoid receptor 1; GABAa, GABAergic receptor subtype a; MU, mu-opioid receptor; NAT, norepinephrine transporter; VAChT, vesicular acetylcholine transporter; mGluR5, metabotropic glutamate type 5 receptor. Notes: “*” indicates significant correlation. |
Neurotransmitter Receptors/Transporters of Hb FC Changes Between the MDD-WoA Group and the HC Group
No significant correlations were observed between Hb whole-brain FC and the spatial distribution of neurotransmitter receptors/transporters in the MDD-WoA group relative to the HC group.
Correlations Between Abnormal FC and Clinical Characteristics
In the MDD-WA group, the FC values between the Hb and the left MFG showed no significant correlations with SHAPS-C total scores (r=−0.168, P=0.432), HAMD-17 total scores (r=0.105, P=0.632), or any of the HAMD-17 subscales, including: anxiety/somatization factor (r=−0.049, P=0.825), weight loss factor (r=−0.068, P=0.758), cognitive impairment factor (r=−0.138, P=0.529), retardation factor (r=0.017, P=0.938), and sleep disturbance factor (r=−0.002, P=0.993). Detailed results are presented in Figure 6.
 |
Figure 6 Correlations between abnormal FC and clinical characteristics in the MDD-WA group. Notes: (A) Correlation between FC values of Hb and left MFG with anxiety/somatization factor scores in the MDD-WA group; (B) Correlation between FC values of Hb and left MFG with weight loss factor scores in the MDD-WA group; (C) Correlation between FC values of Hb and left MFG with cognitive impairment factor scores in the MDD-WA group; (D) Correlation between FC values of Hb and left MFG with retardation factor scores in the MDD-WA group; (E) Correlation between FC values of Hb and left MFG with sleep disorder factor scores in the MDD-WA group; (F) Correlation between FC values of Hb and left MFG with HAMD-17 total scores in the MDD-WA group; (G) Correlation between FC values of Hb and left MFG with SHAPS-C total scores in the MDD-WA group. |
FC values between the Hb and left putamen in the MDD-WA group revealed no statistically significant associations with clinical characteristics: SHAPS-C total score (r = −0.061, P = 0.776), HAMD-17 total score (r = 0.217, P = 0.320), and the HAMD-17 subscales including the anxiety/somatization factor (r = 0.341, P = 0.111), weight loss factor (r = 0.317, P = 0.141), cognitive impairment factor (r = −0.102, P = 0.645), the retardation factor (r = 0.077, P = 0.727), and sleep disturbance factor (r = 0.261, P = 0.229).
In the MDD-WA group, the Hb and FC values of the right putamen demonstrated no significant associations with clinical characteristics: SHAPS-C total score (r = −0.128, P = 0.553), HAMD-17 total score (r = −0.006, P = 0.979), and the HAMD-17 subscales including the anxiety/somatization factor (r = 0.102, P = 0.642), weight loss factor (r = 0.193, P = 0.379), cognitive impairment factor (r = −0.061, P = 0.782), retardation factor (r = 0.070, P = 0.751), or sleep disturbance factor (r = 0.193, P = 0.379).
Similarly, in the MDD-WoA group, the Hb and FC values of the left middle frontal gyrus (MFG) also demonstrated no significant associations with clinical characteristics: SHAPS-C total score (r = −0.208, P = 0.423), HAMD-17 total score (r = 0.074, P = 0.777), and the HAMD-17 subscales including the anxiety/somatization factor (r = 0.099, P = 0.706), weight loss factor (r = −0.124, P = 0.636), cognitive impairment factor (r = 0.097, P = 0.711), retardation factor (r = 0.038, P = 0.884), and sleep disturbance factor (r = −0.243, P = 0.348).
Collectively, these results indicate that FC values between the Hb and the examined brain regions were not significantly correlated with the clinical characteristics assessed in either MDD subgroup (Figure 7).
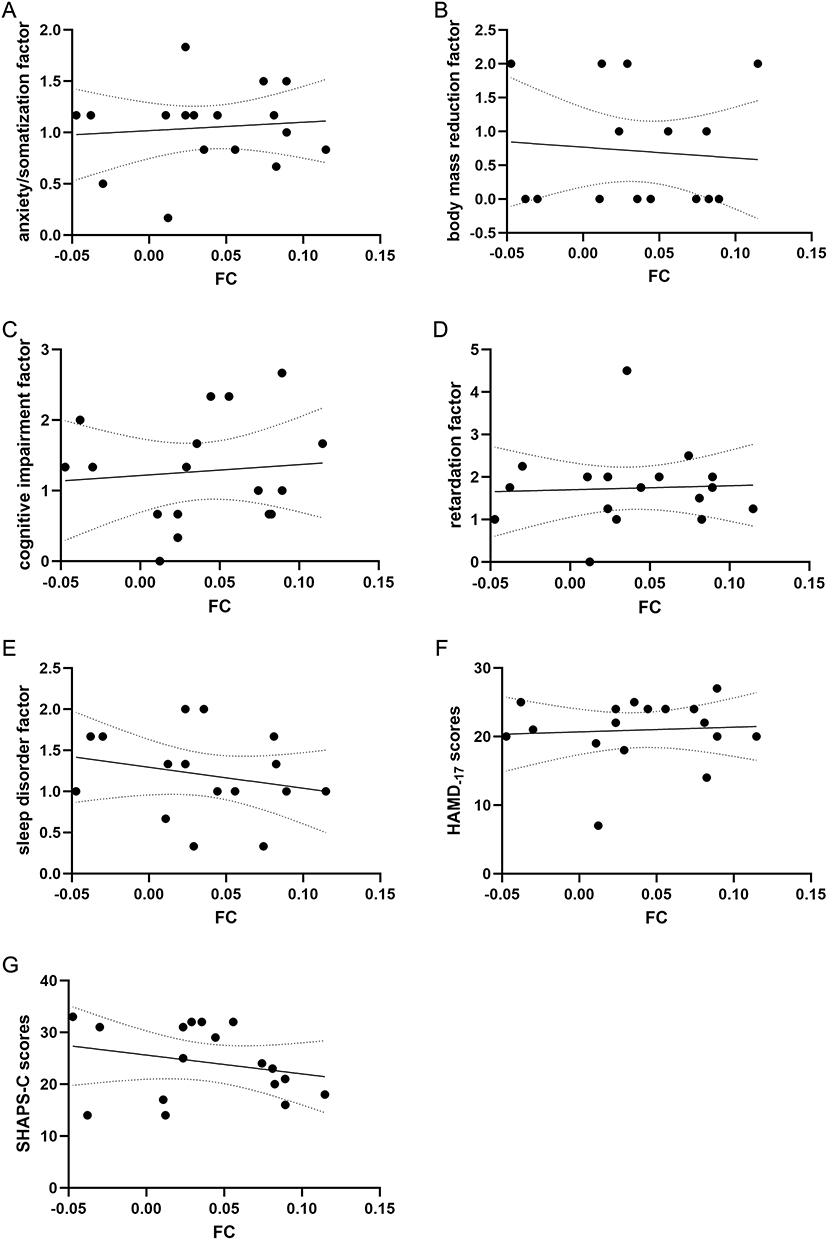 |
Figure 7 Correlations between abnormal FC and clinical characteristics in the MDD-WoA group. Notes: (A) Correlation between FC values of Hb and left MFG with anxiety/somatization factor scores in the MDD-WoA group; (B) Correlation between FC values of Hb and left MFG with weight loss factor scores in the MDD-WoA group; (C) Correlation between FC values of Hb and left MFG with cognitive impairment factor scores in the MDD-WoA group; (D) Correlation between FC values of Hb and left MFG with retardation factor scores in the MDD-WoA group; (E) Correlation between FC values of Hb and left MFG with sleep disorder factor scores in the MDD-WoA group; (F) Correlation between FC values of Hb and left MFG with HAMD-17 total scores in the MDD-WoA group; (G) Correlation between FC values of Hb and left MFG with SHAPS-C total scores in the MDD-WoA group. |
Discussion
The current study identified significantly enhanced FC between the Hb and bilateral putamen in the MDD-WA group relative to the HC group. This finding aligns with prior research by Bi et al29 indicating diminished FC between the putamen and dorsolateral prefrontal cortex (dlPFC) during self-effort decision-making in subthreshold depression. Considering the dlPFC’s critical role in motivated behavior through mesolimbic dopamine (DA) system modulation and its essential role in reward-related action planning and execution,30 the observed reduction in FC between the putamen and raphe nuclei (RN) may potentially underlie the pathophysiology of anhedonia. Supporting this interpretation, extant literature has elucidated that the putamen not only transmits neural signals to the Hb but also receives indirect afferent inputs from the Hb via the VTA,31 suggesting a reciprocal regulatory interaction between these neural structures. The results showed increased functional connectivity between the habenula and bilateral putamen in the MDD-WA group, suggesting hyperconnectivity or network imbalance within this circuit. As an anti-reward center, the habenula exerts inhibitory output that suppresses putaminal function, disrupts normal responses to reward stimuli, impairs reward signal processing, and diminishes hedonic experience—ultimately contributing to anhedonia. Furthermore, given that the SHAPS-C scale primarily assesses consummatory anhedonia,7 our results suggest the MDD-WA patients may specifically manifest this anhedonia subtype. This conclusion is supported by previous research findings showing a significant association between consummatory anhedonia and reduced putamen activation,32 highlighting the potential contribution of putamen dysfunction to the neurobiological mechanisms of anhedonia in the MDD-WA population.
The middle frontal gyrus (MFG), a key subregion of the prefrontal cortex (PFC), critically regulates executive functions, cognitive processes, and negative emotional processing.33 Previous research demonstrated that the PFC modulates DA release through synaptic interactions with VTA DA neuron dendrites.34 Given Hb’s inhibitory control over DA release from VTA DA neurons,21 we hypothesize that reduced FC between the Hb and MFG may disrupt DA signaling, potentially contributing to anhedonia pathophysiology. As a central hub within the salience network (SN), the MFG’s connectivity with other brain regions is implicated in the modulation of emotional and motivational processes in individuals with anhedonia. The SN exhibits characteristic hyperactivity to negative stimuli and hypoactivity to positive stimuli.35 Notably, while both nucleus accumbens (NAc) and Hb are implicated in anhedonia, they demonstrate opposing functional roles. Recent neuroimaging studies have identified enhanced FC between the MFG and bilateral NAc in patients with MDD exhibiting melancholic features, which are characterized by pronounced anhedonia.36 This observation, combined with the reduced FC between the MFG and Hb identified in the present study, highlights the MFG’s pivotal role in anhedonia through its regulatory influence on the Hb. Furthermore, correlation analyses between FC values of intergroup differential brain regions and scores on the SHAPS-C, HAMD-17, and the five-factor model revealed no significant associations. Collectively, these findings suggest that the FC in the putamen, MFG, and Hb is independent of clinical characteristics and may represent a core neurobiological mechanism underlying MDD-WA population.
Selective serotonin reuptake inhibitors (SSRIs) alleviate depression primarily by inhibiting the serotonin transporter (SERT), thereby increasing extracellular serotonin (5-HT) concentrations.37 Emerging evidence suggests that lipopolysaccharide exposure and chronic inflammatory conditions can promote anhedonia through the upregulation of SERT activity.38,39 Additionally, the 5-HT system synergizes with the DA system to regulate glutamate release in the VTA, which subsequently drives DA release in the NAc and modulates reward-related behaviors.40 In this study, a positive correlation was identified between whole-brain FC alterations in the Hb associated with MDD and the spatial density distribution of SERT. These findings suggest that changes in SERT availability, encompassing both spatial density and functional activity, as well as its interactions with other neurotransmitter systems, play a critical role in the pathophysiology of anhedonia.
Extensive research established that D1 receptors in the PFC critically regulate cognitive processes.41 Consistent with these findings, our study revealed that the MDD-WA group demonstrated significantly reduced FC between the Hb and left MFG. This FC reduction showed a positive spatial correlation with regional D1 receptor density, suggesting that decreased D1 receptor density may contribute to anhedonic symptomatology. Conversely, enhanced D1 receptor density could potentially mitigate Hb-MFG FC deficits through the modulation of frontal lobe-mediated cognitive control mechanisms. Furthermore, MDD-WA patients exhibited increased FC between the Hb and bilateral putamen relative to healthy controls (HCs), which positively correlated with D2 receptor density distribution. This aligns with findings of previous neuroimaging studies indicating that elevated D2/3 receptor availability in the ventral striatum of MDD patients inversely correlated with motivational anhedonia severity.42 Notably, no significant association was observed between whole-brain Hb FC alterations and D2 receptor spatial density distribution when comparing MDD-WA and MDD-WoA groups, indicating potential subtype-specific neurobiological mechanisms. Future investigations of dopaminergic receptor dynamics should incorporate anhedonia subtyping to facilitate the development of precision medicine strategies for MDD treatment.
The whole-brain FC alterations of the Hb in the MDD-WA group demonstrated a positive correlation with dopamine transporter (DAT) spatial density. This aligns with previous research findings suggesting that DAT density in the putamen and caudate nucleus regions was significantly higher in MDD patients compared to HCs,43 indicating its potential utility as a diagnostic biomarker for MDD. However, two independent meta-analyses found no significant DAT differences between MDD patients and HCs.44,45 Notably, Mizuno et al observed reduced DAT density in MDD patients after excluding studies employing tracers with high SERT affinity.45 The observed inconsistencies in DAT spatial density findings in MDD may arise from limitations in the structural and functional analysis of the putamen, sample heterogeneity, variations in tracer selection, and differences in the assessment scales for anhedonia symptoms. Furthermore, inflammatory processes may exacerbate anhedonia by impairing DA synthesis and release. Pharmacological interventions, such as DA precursor drugs (eg., levodopa), can mitigate inflammation-induced reductions in DA synthesis, thereby alleviating symptoms.46 Moreover, in healthy individuals, fluorodopa (FDOPA) uptake in the putamen is positively correlated with DAT availability, suggesting that DA synthesis and reuptake mechanisms collectively regulate synaptic DA homeostasis.47
Selective serotonin and norepinephrine reuptake inhibitors (SNRIs) such as venlafaxine are effective in mitigating anhedonia and motivational impairments in patients with MDD. Previous research has suggested that norepinephrine (NA) modulates PFC cognitive functions through α1 and α2 adrenergic receptors.48 Furthermore, the NA system interacts with the DA system within the PFC, thereby influencing DA release and function. The norepinephrine transporter (NAT) plays a critical role in regulating DA clearance within the PFC, which in turn affects cognitive and emotional processing.49 The current study observed reduced FC between the Hb and the middle frontal gyrus (MFG) in MDD-WA patients, and this FC reduction was positively correlated with NAT spatial density. We proposed that increased NAT distribution in the PFC of MDD-WA patients may results in decreased NA and DA levels, which contributes to PFC dysfunction, as evidenced by the diminished FC between the MFG and Hb.
Recent studies have elucidated that cholinergic neuronal activation in the Hb modulates DA neurons in the VTA and reduces serotonin (5-HT) immunoreactivity in the DRN, thereby playing a pivotal role in regulating anhedonic states.50 The vesicular acetylcholine transporter (VAChT), a key protein responsible for transporting acetylcholine (ACh) into synaptic vesicles, serves as a robust marker of cholinergic neuronal activity.51 Pontine tegmental cholinergic neurons project extensively to various brain regions, including the thalamus, basal ganglia, and basal forebrain, among which the putamen is the primary target.52 Overexpression of VAChT has been shown to enhance ACh release into the synaptic cleft, a phenomenon that has been validated in regions such as the hippocampus and striatum.53 In the hippocampus, increased ACh release is associated with improved cognitive functions, including learning and memory. Based on these findings, we hypothesize that increased spatial density of VAChT may indirectly influence DA and 5-HT concentrations by enhancing cholinergic signaling in the Hb and putamen, thereby modulating anhedonic symptoms. Additionally, reduced cholinergic signaling has been strongly correlated with the manifestation of anhedonic behaviors.
In the present study, patients with MDD in both the anhedonic and non-anhedonic groups exhibited pathological alterations in functional connectivity. The habenula showed abnormal connectivity with anti‑reward, reward and emotion-regulation networks — a pattern reflecting disrupted interactions among brain networks during reward processing in depression. Specifically, aberrant functional connectivity between the habenula and the putamen, a core node of the reward network, aligns with dysregulated brain networks observed in MDD and other psychiatric disorders. Furthermore, the phenotypic differences between MDD-WA and MDD-WoA extend the principle of “shared networks but distinct modulatory patterns” within MDD, highlighting the inherent heterogeneity of its pathophysiology. Notably, no significant abnormalities in habenula-related functional connectivity were observed in the MDD-WoA group. This may reflect the use of the SHAPS scale for stratifying patients according to anhedonia. Although effective at distinguishing anhedonic from non‑anhedonic patients, the scale may nevertheless include other depressive subtypes in the non-anhedonic group whose pathogenesis does not involve reward‑related neural circuits. Consequently, no significant regional abnormalities were detected after correction for multiple comparisons. In summary, this study supports the view that depressive subtypes represent a spectrum of disorders with shared characteristics yet distinct biological and neuroimaging mechanisms—features that can be further elucidated using task‑based functional magnetic resonance imaging (task-fMRI) and effective connectivity fMRI.22
Limitations
We acknowledge several methodological limitations of the current study: (1) This study is preliminary in nature, and its small sample size highlights the need for future research with larger, more diverse cohorts to substantiate and generalize our findings. (2) The limited sample size also precluded a detailed analysis of distinct heterogeneous subtypes of anhedonia among depressed patients. Furthermore, methodological variability in distinguishing between MDD with anhedonia (MDD-WA) and MDD without anhedonia (MDD-WoA) across existing studies has led to substantial heterogeneity in reported results. (3) The cross-sectional design of the current study inherently restricts the ability to infer causal relationships between alterations in whole-brain functional connectivity (FC) of the habenula (Hb) and neurotransmitter dynamics in MDD-WA patients, as well as to clarify potential associations with disease progression and long-term prognosis. (4) Given the small volume of the habenula (approximately 30–150 mm3), reliable segmentation using 3T MRI is challenging, and partial volume effects may lead to signal blurring. Future studies should therefore employ higher-field MRI, such as 7.0T MRI, to examine these findings more rigorously. (5) During prolonged resting-state scanning, healthy controls often show inattention and mild involuntary head movements. In contrast, patients with major depressive disorder (especially those with anhedonia and psychomotor retardation) exhibit clinical features such as sustained attention, reduced somatic activity, and psychomotor retardation. Furthermore, healthy controls showed lower motivation and engagement in the MRI scan compared with the MDD group. Patients with MDD were typically more concerned about their clinical condition and often viewed scanning as part of their diagnosis and treatment, resulting in higher compliance than healthy controls.
Conclusions
In conclusion, this study demonstrates that abnormal FC between the Hb and bilateral putamen, as well as the left MFG, in patients with major depressive disorder with anhedonia (MDD-WA) may contribute to the underlying pathophysiological mechanisms of anhedonia. Moreover, these FC alterations show significant correlations with changes in the spatial density of specific neurotransmitter receptors and transporters. These findings offer novel neuroimaging evidence that advances our understanding of the neuropathological substrates associated with MDD-WA. The absence of significant correlations between habenula functional connectivity values and clinical symptom scores suggests that habenula-prefrontal-striatal dysconnectivity may represent an anhedonia-specific biomarker in MDD. The FC patterns between the habenula and bilateral putamen/left middle frontal gyrus, along with the related neurotransmitter profiles identified in this study, may serve as objective indicators for monitoring therapeutic efficacy in the future.
Ethical Declaration
This study complies with the Declaration of Helsinki.
Acknowledgments
We would like to thank all the subjects for their participation in this study. We thank Jingting Yan for providing language help and writing assistance.
Funding
This study was funded by the National Natural Science Foundation of China (82260277), Yunnan Fundamental Research Projects (202301AT070126), Yunnan Revitalization Talent Support Program and Yunnan Clinical Medical Center for Mental Disorders (2024YNLCYXZX0006).
Disclosure
The authors declared no conflicts of interest related to this work.
References
1. Miller CH, Davis EG, King LS, Sacchet MD, Grill-Spector K, Gotlib IH. The structure of depressive symptoms and characteristics and their relation to overall severity in major depressive disorder. Psychiatry Res. 2020;294:113399.
2. Daghigh A, Daghigh V, Niazi M, Nadorff MR. The association between anhedonia, suicide ideation, and suicide attempts: a replication in a persian student sample. Suicide Life-Threatening Behav. 2018;49(3):678–17. doi:10.1111/sltb.12469
3. Serretti A. Anhedonia and depressive disorders. Clin Psychopharmacol Neurosci. 2023;21(3):401–409. doi:10.9758/cpn.23.1086
4. Sharma S, Powers A, Bradley B, Ressler KJ. Gene × environment determinants of stress- and anxiety-related disorders. Ann Rev Psychol. 2016;67(1):239–261. doi:10.1146/annurev-psych-122414-033408
5. Keller J, Young CB, Kelley E, Prater K, Levitin DJ, Menon V. Trait anhedonia is associated with reduced reactivity and connectivity of mesolimbic and paralimbic reward pathways. J Psychiatr Res. 2013;47(10):1319–1328. doi:10.1016/j.jpsychires.2013.05.015
6. Wang S, Leri F, Rizvi SJ. Anhedonia as a central factor in depression: neural mechanisms revealed from preclinical to clinical evidence. Prog Neuro Psychopharmacol Biol Psychiatry. 2021;110:110289.
7. Leventhal AM, Unger JB, Audrain-McGovern J, Sussman S, Volk HE, Strong DR. Measuring anhedonia in adolescents: a psychometric analysis. J Personal Assessment. 2015;97(5):506–514. doi:10.1080/00223891.2015.1029072
8. Li G, Cao C, Fang R, et al. Neural correlates of posttraumatic anhedonia symptoms: decreased functional connectivity between ventral pallidum and default mode network regions. J Psychiatr Res. 2021;140:30–34. doi:10.1016/j.jpsychires.2021.05.061
9. Gan X, Zhou X, Li J, et al. Common and distinct neurofunctional representations of core and social disgust in the brain: coordinate-based and network meta-analyses. Neurosci Biobehav Rev. 2022;135:104553.
10. Hu H, Cui Y, Yang Y. Circuits and functions of the lateral habenula in health and in disease. Nat Rev Neurosci. 2020;21(5):277–295. doi:10.1038/s41583-020-0292-4
11. Henderson SE, Vallejo AI, Ely BA, et al. The neural correlates of emotional face-processing in adolescent depression: a dimensional approach focusing on anhedonia and illness severity. Psychiatry Res Neuroim. 2014;224(3):234–241. doi:10.1016/j.pscychresns.2014.09.006
12. Carvalho Poyraz F, Holzner E, Bailey MR, et al. Decreasing striatopallidal pathway function enhances motivation by energizing the initiation of goal-directed action. J Neurosci. 2016;36(22):5988–6001. doi:10.1523/JNEUROSCI.0444-16.2016
13. Coccurello R. Anhedonia in depression symptomatology: appetite dysregulation and defective brain reward processing. Behav Brain Res. 2019;372:112041. doi:10.1016/j.bbr.2019.112041
14. Bolton JL, Molet J, Regev L, et al. Anhedonia following early-life adversity involves aberrant interaction of reward and anxiety circuits and is reversed by partial silencing of amygdala corticotropin-releasing hormone gene. Biol Psychiatry. 2018;83(2):137–147. doi:10.1016/j.biopsych.2017.08.023
15. Chen WG, Schloesser D, Arensdorf AM, et al. The emerging science of interoception: sensing, integrating, interpreting, and regulating signals within the self. Trends Neurosci. 2021;44(1):3–16. doi:10.1016/j.tins.2020.10.007
16. Li J, Fan R, Liu X, Shen X, Liu X, Zhao H. The convergence of aversion and reward signals in individual neurons of the mice lateral habenula. Exp Neurol. 2021;339:113637. doi:10.1016/j.expneurol.2021.113637
17. Hennigan K, D’Ardenne K, McClure SM. Distinct midbrain and habenula pathways are involved in processing aversive events in humans. J Neurosci. 2015;35(1):198–208. doi:10.1523/JNEUROSCI.0927-14.2015
18. Zhang H, Li K, Chen H-S, et al. Dorsal raphe projection inhibits the excitatory inputs on lateral habenula and alleviates depressive behaviors in rats. Brain Struct Funct. 2018;223(5):2243–2258. doi:10.1007/s00429-018-1623-3
19. Sartorius A, Kiening KL, Kirsch P, et al. Remission of major depression under deep brain stimulation of the lateral habenula in a therapy-refractory patient. Biol Psychiatry. 2010;67(2):e9–e11. doi:10.1016/j.biopsych.2009.08.027
20. Kowski AB, Veh RW, Weiss T. Dopaminergic activation excites rat lateral habenular neurons in vivo. Neuroscience. 2009;161(4):1154–1165. doi:10.1016/j.neuroscience.2009.04.026
21. Ji H, Shepard PD. Lateral habenula stimulation inhibits rat midbrain dopamine neurons through a GABAA receptor-mediated mechanism. J Neurosci. 2007;27(26):6923–6930. doi:10.1523/JNEUROSCI.0958-07.2007
22. Stoyanov D, Aryutova K, Kandilarova S, et al. Diagnostic task specific activations in functional MRI and aberrant connectivity of insula with middle frontal gyrus can inform the differential diagnosis of psychosis. Diagnostics. 2021;11:95. doi:10.3390/diagnostics11010095
23. Ramos-Brieva JA, Cordero-Villafafila A. A new validation of the Hamilton rating scale for depression. J Psychiatr Res. 1988;22(1):21–28. doi:10.1016/0022-3956(88)90024-6
24. Liu W-H, Wang L-Z, Zhu Y-H, Min-hui L, Chan RCK. Clinical utility of the snaith-Hamilton-pleasure scale in the Chinese settings. BMC Psychiatry. 2012;12. doi:10.1186/1471-244X-12-184
25. Vinckier F, Gourion D, Mouchabac S. Anhedonia predicts poor psychosocial functioning: results from a large cohort of patients treated for major depressive disorder by general practitioners. Eur Psychiatry. 2017;44:1–8. doi:10.1016/j.eurpsy.2017.02.485
26. Torrisi S, Nord CL, Balderston NL, Roiser JP, Grillon C, Ernst M. Resting state connectivity of the human habenula at ultra-high field. NeuroImage. 2017;147:872–879. doi:10.1016/j.neuroimage.2016.10.034
27. Brašić JR, Cascella N, Kumar A, et al. Positron emission tomography experience with 2‐[18f]fluoro‐3‐(2(s)‐azetidinylmethoxy)pyridine (2‐[18f]fa) in the living human brain of smokers with paranoid schizophrenia. Synapse. 2011;66(4):352–368. doi:10.1002/syn.21520
28. Dukart J, Holiga S, Rullmann M, et al. JuSpace: a tool for spatial correlation analyses of magnetic resonance imaging data with nuclear imaging derived neurotransmitter maps. Hum Brain Mapp. 2021;42(3):555–566. PMID: 33079453; PMCID: PMC7814756. doi:10.1002/hbm.25244
29. Bi R, Dong W, Zheng Z, Li S, Zhang D. Altered motivation of effortful decision‐making for self and others in subthreshold depression. Depression Anxiety. 2022;39(8–9):633–645. doi:10.1002/da.23267
30. Ballard IC, Murty VP, Carter RM, MacInnes JJ, Huettel SA, Adcock RA. Dorsolateral prefrontal cortex drives mesolimbic dopaminergic regions to initiate motivated behavior. J Neurosci. 2011;31(28):10340–10346. doi:10.1523/JNEUROSCI.0895-11.2011
31. Arfuso M, Salas R, Castellanos FX, Krain Roy A. Evidence of altered habenular intrinsic functional connectivity in pediatric ADHD. J Attention Disord. 2019;25(5):749–757. doi:10.1177/1087054719843177
32. Zhang B, Lin P, Shi H, et al. Mapping anhedonia-specific dysfunction in a transdiagnostic approach: an ale meta-analysis. Brain Imaging Behav. 2015;10(3):920–939. doi:10.1007/s11682-015-9457-6
33. Blair KS, Smith BW, Mitchell DGV, et al. Modulation of emotion by cognition and cognition by emotion. NeuroImage. 2007;35(1):430–440. doi:10.1016/j.neuroimage.2006.11.048
34. Carr DB, Sesack SR. Projections from the rat prefrontal cortex to the ventral tegmental area: target specificity in the synaptic associations with mesoaccumbens and mesocortical neurons. J Neurosci. 2000;20(10):3864–3873. doi:10.1523/JNEUROSCI.20-10-03864.2000
35. Pisoni A, Davis SW, Smoski M. Neural signatures of saliency-mapping in anhedonia: a narrative review. Psychiatry Res. 2021;304:114123.
36. Chen Z, Ou Y, Liu F, et al. Increased brain nucleus accumbens functional connectivity in melancholic depression. Neuropharmacology. 2024;243:109798.
37. Pourhamzeh M, Moravej FG, Arabi M, et al. The roles of serotonin in neuropsychiatric disorders. Cell Mol Neurobiol. 2021;42(6):1671–1692. doi:10.1007/s10571-021-01064-9
38. Brown E, Mc Veigh CJ, Santos L, et al. Tnfα-dependent anhedonia and upregulation of hippocampal serotonin transporter activity in a mouse model of collagen-induced arthritis. Neuropharmacology. 2018;137:211–220. doi:10.1016/j.neuropharm.2018.04.023
39. van Heesch F, Prins J, Konsman JP, et al. Lipopolysaccharide-induced anhedonia is abolished in male serotonin transporter knockout rats: an intracranial self-stimulation study. Brain Behav Immun. 2013;29:98–103. doi:10.1016/j.bbi.2012.12.013
40. Wang H-L, Zhang S, Qi J, et al. Dorsal raphe dual serotonin-glutamate neurons drive reward by establishing excitatory synapses on vta mesoaccumbens dopamine neurons. Cell Rep. 2019;26(5):1128–1142.e1127. doi:10.1016/j.celrep.2019.01.014
41. Anastasiades PG, Boada C, Carter AG. Cell-type-specific d1 dopamine receptor modulation of projection neurons and interneurons in the prefrontal cortex. Cereb Cortex. 2019;29(7):3224–3242. doi:10.1093/cercor/bhy299
42. Peciña M, Sikora M, Avery ET, et al. Striatal dopamine d2/3 receptor-mediated neurotransmission in major depression: implications for anhedonia, anxiety and treatment response. Eur Neuropsychopharmacol. 2017;27(10):977–986. doi:10.1016/j.euroneuro.2017.08.427
43. Amsterdam JD, Newberg AB, Soeller I, Shults J. Greater striatal dopamine transporter density may be associated with major depressive episode. J Affective Disorders. 2012;141(2–3):425–431. doi:10.1016/j.jad.2012.03.007
44. Li Z, He Y, Tang J, Zong X, Hu M, Chen X. Molecular imaging of striatal dopamine transporters in major depression—a meta-analysis. J Affective Disorders. 2015;174:137–143. doi:10.1016/j.jad.2014.11.045
45. Mizuno Y, Ashok AH, Bhat BB, Jauhar S, Howes OD. Dopamine in major depressive disorder: a systematic review and meta-analysis of in vivo imaging studies. J Psychopharmacol. 2023;37(11):1058–1069. doi:10.1177/02698811231200881
46. Felger JC, Hernandez CR, Miller AH. Levodopa reverses cytokine-induced reductions in striatal dopamine release. Intl J Neuropsychopharmacol. 2015;18(4). doi:10.1093/ijnp/pyu084
47. Yamamoto Y, Takahata K, Kubota M, et al. Differential associations of dopamine synthesis capacity with the dopamine transporter and d2 receptor availability as assessed by pet in the living human brain. NeuroImage. 2021;226:117543.
48. Ramos BP, Arnsten AFT. Adrenergic pharmacology and cognition: focus on the prefrontal cortex. Pharmacol Ther. 2007;113(3):523–536. doi:10.1016/j.pharmthera.2006.11.006
49. Ventura R, Alcaro A, Puglisi-Allegra S. Prefrontal cortical norepinephrine release is critical for morphine-induced reward, reinstatement and dopamine release in the nucleus accumbens. Cereb Cortex. 2005;15(12):1877–1886. doi:10.1093/cercor/bhi066
50. Han S, Yang SH, Kim JY, et al. Down-regulation of cholinergic signaling in the habenula induces anhedonia-like behavior. Sci Rep. 2017;7(1). doi:10.1038/s41598-017-16991-1
51. Prado Vania F, Roy A, Kolisnyk B, Gros R, Prado Marco AM. Regulation of cholinergic activity by the vesicular acetylcholine transporter. Biochem J. 2013;450(2):265–274. doi:10.1042/BJ20121662
52. Mori F, K-i O, Nomura T, Kobayashi Y. The pedunculopontine tegmental nucleus as a motor and cognitive interface between the cerebellum and basal ganglia. Front Neuroanatomy. 2016;10:10. doi:10.3389/fnana.2016.00010
53. Nagy PM, Aubert I. Overexpression of the vesicular acetylcholine transporter enhances dendritic complexity of adult-born hippocampal neurons and improves acquisition of spatial memory during aging. Neurobiol Aging. 2015;36(5):1881–1889. doi:10.1016/j.neurobiolaging.2015.02.021
 © 2026 The Author(s). This work is published and licensed by Dove Medical Press Limited. The
full terms of this license are available at https://www.dovepress.com/terms
and incorporate the Creative Commons Attribution
- Non Commercial (unported, 4.0) License.
By accessing the work you hereby accept the Terms. Non-commercial uses of the work are permitted
without any further permission from Dove Medical Press Limited, provided the work is properly
attributed. For permission for commercial use of this work, please see paragraphs 4.2 and 5 of our Terms.
© 2026 The Author(s). This work is published and licensed by Dove Medical Press Limited. The
full terms of this license are available at https://www.dovepress.com/terms
and incorporate the Creative Commons Attribution
- Non Commercial (unported, 4.0) License.
By accessing the work you hereby accept the Terms. Non-commercial uses of the work are permitted
without any further permission from Dove Medical Press Limited, provided the work is properly
attributed. For permission for commercial use of this work, please see paragraphs 4.2 and 5 of our Terms.
Recommended articles
Neural Correlates of Anhedonia in Major Depressive Disorder: Insights from Concurrent Analysis of Feedback-Related Negativity and Stimulus-Preceding Negativity
Sun Y, Huang Z, Gao X, Chen L, Wang J, Zhou Z, Zhou H
Neuropsychiatric Disease and Treatment 2023, 19:2549-2560
Published Date: 23 November 2023