Back to Journals » Nature and Science of Sleep » Volume 14
Altered Functional Connectivity and Topological Organization of Brain Networks Correlate to Cognitive Impairments After Sleep Deprivation
Authors Ning Y ![]() , Zheng S
, Zheng S ![]() , Feng S
, Feng S ![]() , Li K, Jia H
, Li K, Jia H ![]()
Received 13 March 2022
Accepted for publication 29 June 2022
Published 15 July 2022 Volume 2022:14 Pages 1285—1297
DOI https://doi.org/10.2147/NSS.S366224
Checked for plagiarism Yes
Review by Single anonymous peer review
Peer reviewer comments 5
Editor who approved publication: Prof. Dr. Ahmed BaHammam
Yanzhe Ning,1– 3 Sisi Zheng,1– 3 Sitong Feng,1– 3 Kuangshi Li,4 Hongxiao Jia1– 3
1The Beijing Key Laboratory of Mental Disorders, Beijing Anding Hospital, Capital Medical University, Beijing, People’s Republic of China; 2The National Clinical Research Center for Mental Disorders, Beijing Anding Hospital, Capital Medical University, Beijing, People’s Republic of China; 3Advanced Innovation Center for Human Brain Protection, Capital Medical University, Beijing, People’s Republic of China; 4Dongzhimen Hospital, Beijing University of Chinese Medicine, Beijing, People’s Republic of China
Correspondence: Hongxiao Jia, The Beijing Key Laboratory of Mental Disorders, Beijing Anding Hospital, Capital Medical University, Beijing, People’s Republic of China, Email [email protected] Kuangshi Li, Dongzhimen Hospital, Beijing University of Chinese Medicine, Beijing, 100700, People’s Republic of China, Email [email protected]
Introduction: Sleep deprivation (SD) has a detrimental effect on cognitive functions. Numerous studies have indicated the mechanisms underlying cognitive impairments after SD in brain networks. However, the findings based on the functional connectivity (FC) and topological architecture of brain networks are inconsistent.
Methods: In this study, we recruited 30 healthy participants with regular sleep (aged 25.20 ± 2.20 years). All participants performed the repeatable battery for the assessment of neuropsychological status and resting-state fMRI scans twice, during the rested wakefulness (RW) state and after 24 h of total SD. Using the Dosenbach atlas, both large-scale FC and topological features of brain networks (ie nodal, global and local efficiency) were calculated for the RW and SD states. Furthermore, the correlation analysis was conducted to explore the relationship between the changes in FC and topological features of brain networks and cognitive performances.
Results: Compared to the RW state, the large-scale brain network results showed decreased between-network FC in somatomotor network (SMN)-default mode network (DMN), SMN-frontoparietal network (FPN), and SMN-ventral attention network (VAN), and increased between-network FC in the dorsal attention network (DAN)-VAN, DAN-SMN after SD. The clustering coefficient, characteristic path length and local efficiency decreased after SD. Moreover, the decreased attention score positively correlated with the decreased topological measures and negatively correlated with the FC of DAN-SMN.
Conclusion: Our results suggested that the increased FC of DAN-SMN and decreased topological features of brain networks may act as neural indicators for the decrease in attention after SD.
Clinical Trial Registration: The study was registered at the Chinese Clinical Trial Registry, registration ID: ChiCTR2000039858, China.
Keywords: brain network, functional connectivity, sleep deprivation, cognitive impairment, topological feature
Introduction
An increasing number of individuals report insufficient sleep due to multiple factors, such as shift work, stress, and the use of electronic devices before sleep.1 Research has shown that 3 in 10 adults slept for less than 7 h per day on average in 2010, compared with the 20th century.2 Sleep deprivation (SD) has become a prevailing problem for many individuals in modern societies, leading to accidents and increasing the risk of illness.3 Studies on SD have surmounted over recent years and shown the critical role of normal sleep in health.4 Notably, SD also interferes with the cognitive function of individuals, including sustained attention, executive function, and long-term memory, which affects working performance.5,6
The effect of SD on cognitive functions can be reliably probed using functional magnetic resonance imaging (fMRI).7 Functional brain networks display correlated activities when an individual is awake and at rest.8 Prior fMRI studies have illustrated that SD most strongly impairs brain network connectivity in prefrontal cortical regions which affect cognitive function, such as working memory.9 Functional connectivity (FC) is a direct approach to calculate connectivity across seed areas or brain networks.10 FC was altered in the default mode network (DMN), salience network (SN), dorsal attention network (DAN), and frontoparietal network (FPN) during SD.11,12 DMN is preferentially activated when people are engaged in internally oriented tasks, such as daydreaming and retrieving memories.13 SN can direct the individuals’ attention by identifying factors crucial to biological and cognitive functions.14 DAN contributes to the voluntary, top-down deployment of attention,15 and FPN regulates cognitive control and executive control.16 Specifically, 24 h of SD decreases FC between the left junction of the anterior and anterolateral hippocampal area and the DMN, potentially damaging somatosensory processes.17 SD also increases FC between the dorsal DMN and the ventral DMN, which correlates with the performance of working memory.18 Other fMRI studies have revealed that SD reduces the intrinsic connectivity within DMN and the correlation between DMN and anti-correlated network (ACN).11,19 The reduced connectivity between these brain networks is associated with decreased vigilance of SD participants.19 Task-state fMRI studies showed that sleep loss reduces the connectivity between DMN and attentional networks, in association with the decline in vigilance and attention.20 Although numerous studies have revealed the mechanisms underlying cognitive impairments after SD in brain networks, the results on whether the cause is hyper-connectivity or hypo-connectivity are inconsistent.
Graph theory is a branch of mathematics dating back to the 18th century. Graph theory is used to model pairwise relations between participants. A graph consists of vertices/nodes and edges.21 Graph theory approaches are perfect for the brain since the brain can be visualized as a network of nodes and edges.22 The use of graph theory can provide new insights into the structure and function of brain network systems.23 The elements (nodes and vertices) and their pairwise links (edges and connections) collected in a matrix define the graph’s topology, providing a comprehensive map of all the relations across the different brain regions and their interactions. The small-world network is generated using graph theory in the whole brain networks.24 The human brain can be modeled as a complex network with the “small-world features”, which are characterized by a high clustering coefficient and a short path of anatomical and functional connectivities.25,26 Also, the small-worldness is considered an ideal organizational architecture for integrating global and local information.27 Previous electroencephalogram (EEG) magnetoencephalography (MEG) studies on topological features of brain networks have revealed that SD leads to widespread disrupted networks.28,29 However, to date, there is only one graph theory-based fMRI study on SD showed the enhanced small-world properties after 34 h SD and negatively correlated emotional instability.30 It remains to be validated using other durations of SD. The relationship between the altered topological properties and cognitive impairments after 24 h SD remains unexplored.
In this study, we recruited 30 healthy participants with regular sleep and performed resting-state fMRI scans during the rested wakefulness (RW) state and after 24 h of total SD. After surface-based preprocessing, both large-scale network FC and topological properties were calculated for RW and SD states and compared to indicate mechanisms underlying cognitive impairments. Based on the cognitive impairments after SD, we speculated that the FC between brain networks disrupts and the small-worldness decreases after SD. Moreover, the changes in FC and topological features of brain networks might be significantly correlated with cognitive performances.
Materials and Methods
Participants
Thirty healthy participants (14 females) studying in college, aged 20–30 years (25.20 ± 2.20 years) with an education duration of 18.10 ± 2.45 years, were recruited between November 2020 and August 2021. All participants met the following criteria: 1) they had no symptoms associated with sleep disorders and Pittsburgh Sleep Quality Index (PSQI) score <5; 2) they had normal sleep patterns and not extreme morning or evening types according to the Horne-Ostberg Morningness-Eveningness Questionnaire; 3) they were right-handed; 4) they had no history of neurologic or psychiatric disorders; 5) they had no history of trauma stimuli for the latest 1 year; 6) they had no habitual caffeine, smoking, alcohol, or other substance addiction; 7) they had no MRI contraindications. Our study protocol had been approved by the Ethics Committee of Beijing Anding Hospital Affiliated with Capital Medical University. All enrolled participants signed the informed consent before the study in accordance with the Declaration of Helsinki.
Study Procedure
All recruited participants were required to visit our laboratory twice. A brief introduction to the study protocol was provided and informed consent was signed during the first visit. During the second visit after a week, the participants were required to wake up at 7:00 am and reach the laboratory before 8:00 am for the 24 h SD from 7:00 am on that day to 7:00 am on the next day. During the SD, all participants were required to stay awake all the time and not consume tea, coffee, or alcohol. The research group members monitored the participants in turns, to prevent the participants from falling asleep. The participants were woken up immediately, if they showed any signs of falling asleep. All participants were required to complete the MRI scans at the beginning of the study and after 24 h of SD. The first MRI scan was a 490-s resting-state and 250-s T1 scan, and the second 490-s resting-state scan was performed at 7:00 am the next day. The participants were reminded not to fall asleep during scanning before each scan, and the participants who reported falling asleep during the fMRI scan were excluded.
Cognitive Assessments
In the current study, the Chinese version of the Repeatable Battery for the Assessment of Neuropsychological Status (RBANS) with relatively good reliability and validity was employed to measure global cognition.31 The RBANS comprises 12 subtests to assess five cognitive abilities: visuospatial/constructional ability, immediate and delayed memory, language, and attention. The 12 subtests include story memory, list learning, line orientation, figure copy, photo naming, semantic fluency, digit span, coding, list recall, story recall, list recognition, and figure recall subtests. Each of the components is based on two subtests, except for delayed memory, which is based on four subtests. The five domain-specific index scores were calculated according to the Chinese norm. A higher RBANS score was associated with better cognitive functions. The entire test lasted for about 30 minutes. A trained neuropsychologist performed the test for all the recruited participants according to standardized procedures.
MRI Acquisition
The MRI scan was acquired using a 3.0 Tesla Prisma MRI scanner (Siemens, Germany) at the Beijing Anding Hospital, Beijing, China. Participants were required to stay still, keep their eyes closed, and refrain from falling asleep during the scan. The foam head holders were immobilized to reduce head movements, and earplugs were worn to reduce the noise from the MRI machine.
The high-resolution structural information for anatomical localization was obtained by applying 3D MRI sequences before the functional scanning. The resting-state fMRI data were collected with a single-shot, gradient-recalled echo-planar imaging sequence with the following parameters: echotime = 30 ms, repetition time = 2000 ms, flip angle = 90°, matrix = 64 × 64, gap = 1 mm, field of view = 225 mm × 225 mm, slice thickness = 3.5 mm, 32 interleaved axial slices and 180 volumes.
Data Processing
Data were processed using DPABI32 following the methods published by Yan et al.33
Anatomical Data Preprocessing
The T1 images were converted into the BIDS dataset. They were then corrected for intensity non-uniformity using N4BiasFieldCorrection34 which was provided by ANTs 2.3.3. The derived images were skull-stripped using OASIS30ANTs as the target template. The remaining brain tissues were segmented into the cerebrospinal fluid (CSF), white-matter (WM) and gray-matter (GM) using BET (FSL 5.0.9). A classic method, which reconciles ANTs-derived and FreeSurfer-derived segmentations of the cortical gray-matter of Mindboggle,35 was applied to refine the brain mask estimated previously. Volume-based spatial normalization to one standard space (MNI152NLin2009cAsym) was performed through nonlinear registration with antsRegistration (ANTs 2.3.3), using brain-extracted versions of both T1 reference and the T1 template. Meanwhile, ICBM 152 Nonlinear Asymmetrical template version 2009c was used for spatial normalization.
Functional Data Preprocessing
First, the custom methodology of fMRIPrep36 was used to generate the reference volume and its skull-stripped version. Susceptibility distortion correction (SDC) was omitted. Bbregister (FreeSurfer), which implements boundary-based registration, was applied for co-registering the fMRI reference and T1 reference. Moreover, slice-time was corrected using 3dTshift from AFNI and spatiotemporal filtering was conducted using mcflirt (FSL). The BOLD time series were resampled into standard space and a preprocessed BOLD run was generated in the MNI 152 NLin2009c Asym space. Framewise displacement (FD), DVARS, and three region-wise global signals were calculated using the preprocessed BOLD. Additionally, a set of physiological regressors were extracted to allow for component-based noise correction (CompCor). The above components were dropped from the BOLD and frames that exceeded a threshold of 0.5 mm FD or 1.5 standardized DVARS were annotated as motion outliers. Gridded (volumetric) resampling was performed using ants Apply Transforms (ANTs), configured with Lanczos interpolation to minimize the smoothing effects of other kernels.
Large-Scale Network Calculation
The Dosenbach atlas,37 which contains 142 regions of interests (ROIs) (except 18 ROIs in the cerebellum), was selected to extract the BOLD signals which were averaged across all voxels in the ROIs. Each node of the atlas was a sphere with a radius of 5 mm. Pearson’s correlation coefficient of the BOLD signals was calculated to define the functional connectivity (FC) for a pair of ROIs. The values of FC were transformed to z-scores using Fisher’s r‐to‐z formula. To explore the relationship of each large-scale network, we also classified suprathreshold edges by their membership in the networks defined by Yeo et al and Yan et al.33,38 The seven networks were the visual network (VN, 22 ROIs located in the occipital lobe and posterior fusiform gyrus), somatosensory‐motor network (SMN, 29 ROIs located in the precentral and postcentral gyrus and auditory cortex), DAN (14 ROIs located in the temporo‐occipital cortex, angular gyrus, superior parietal lobule, and premotor cortex), ventral attention network (VAN, 16 ROIs located in the supramarginal gyrus, insula, middle frontal gyrus, and supplementary motor area), subcortical network (SCN, seven ROIs located in the putamen and thalamus), FPN (21 ROIs located in the superior parietal lobule, precuneus, lateral frontal cortex, and dorsal cingulate cortex), and DMN (33 ROIs located in the inferior parietal lobule, posterior cingulate cortex, lateral temporal cortex, and ventral and medial prefrontal cortex). The location of the seven large-scale networks is shown in Figure 1. The average of the FC z-scores of all the involved edges was used to evaluate the FC among the seven networks. The paired t-test was used to compare the FC within and between groups (p < 0.05, False Discovery Rate Correction).
 |
Figure 1 The seven large-scale networks screened in the brain map. Abbreviations: DAN, dorsal attention network; DMN, default mode network; FPN, frontoparietal network; L, left; R, right; SCN, subcortical network; SMN, somatosensory network; VAN, ventral attention network; VN, visual network. |
Small-World Network Analysis
In this study, the correlation coefficient matrix derived from the Dosenbach atlas was processed into an undirected binary matrix using the sparsity threshold method. The range of sparsity was from 0.05 to 0.5, and the step of sparsity was 0.05. The topological organizational changes in the whole brain functional network were described by analyzing small-world metrics, network efficiency and nodal efficiency. The small-world metrics mainly included the clustering coefficient (Cp) and characteristic path length (Lp), which represented the mean clustering coefficient and characteristic path length of 100 random networks. The network efficiency included global efficiency (Eg) and the local efficiency (Eloc). The Eloc is the mean local efficiency over all nodes in the network, and the Eg is defined as the measure of the global efficiency of parallel information transfer in the network. Small-world metrics and network efficiency between the two states were compared using paired t-tests (p < 0.05). The paired t-test of nodal efficiency between the two states utilized multiple corrections (p < 0.05, False Discovery Rate Correction).
Results
Demographic and Clinical Information
Thirty healthy participants (14 females) were recruited in the current study. Tests for five cognitive abilities from RBANS were performed in SD and RW states and compared using the paired t-test or a non-parametric test. We observed a significant decline in attention (t = −7.79, p < 0.001) after SD. No significant differences were observed between the SD and RW states in immediate memory (t = 1.81, p = 0.08), visuospatial/constructional (z = −1.55, p = 0.12), language (t = 1.02, p = 0.31), and delayed memory (t = 0.65, p = 0.52). Detailed results are shown in Table 1.
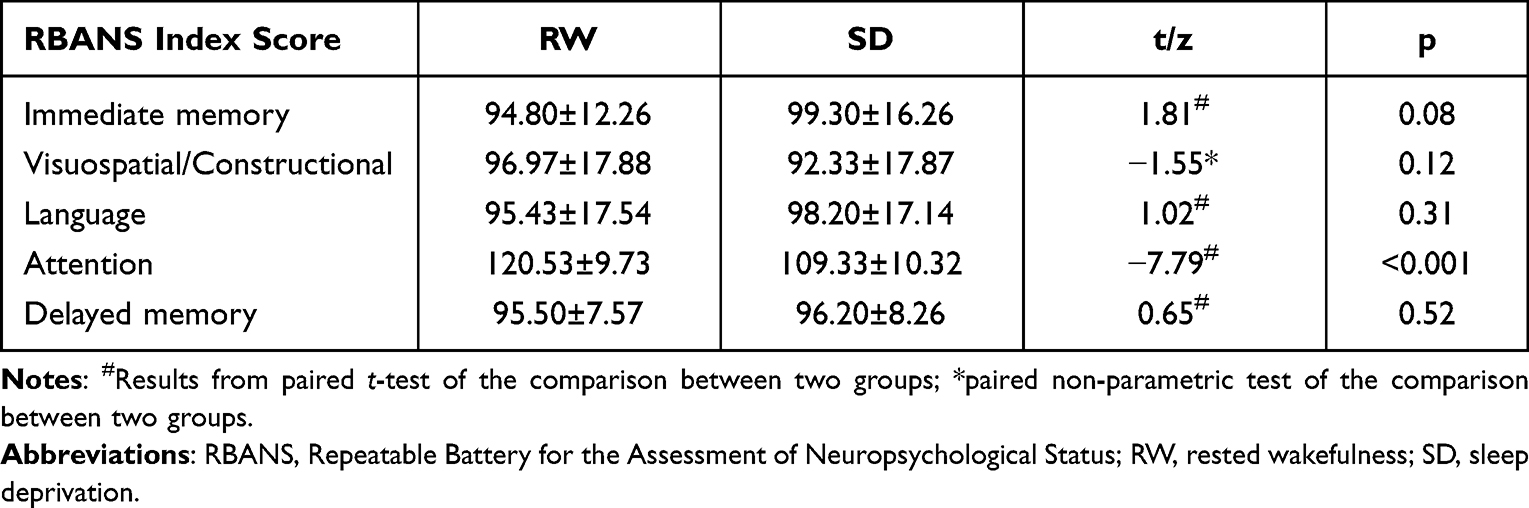 |
Table 1 The Results of RBANS Between SD and RW States |
Large-Scale Network FC
Large-scale within- and between-network FC were calculated between the SD and RW states. The participants showed a significant decrease in between-network FC in SMN-DMN, SMN-FPN, and SMN-VAN, and an increase in between-network FC in DAN-VAN and DAN-SMN. No abnormal within-network FC was observed after SD. This finding suggested extensive abnormal between-network FCs after SD. The details are shown in Table 2 and Figure 2.
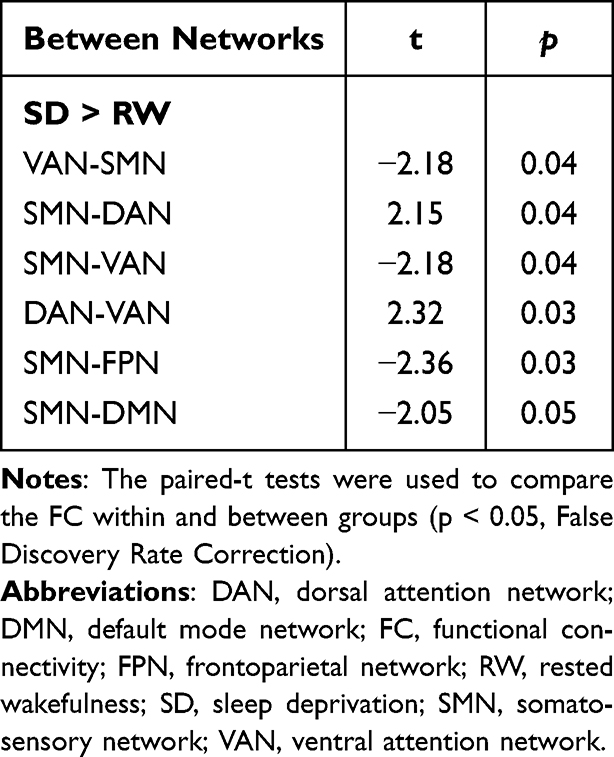 |
Table 2 Large-Scale Between-Network FC Changes |
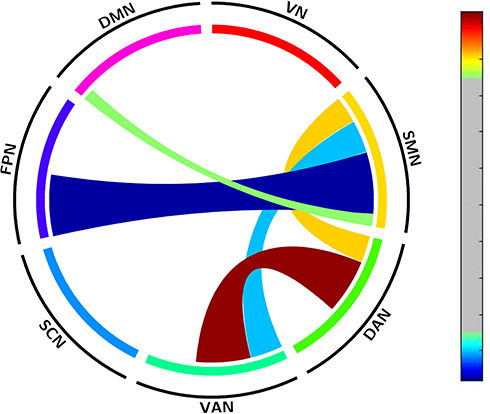 |
Figure 2 Altered large-scale network functional connectivity between the SD and RW states. For T value color bar, blue indicates functional connectivity decrease while red indicates functional connectivity increase. The result was corrected by FDR-corrected p < 0.05 (two-tailed). Abbreviations: DAN, dorsal attention network; DMN, default mode network; FC, functional connectivity; FPN, frontoparietal network; L, left; R, right; SCN, subcortical network; SMN, somatosensory network; VAN, ventral attention network; VN, visual network; RW, rested wakefulness; SD, sleep deprivation. |
Topological Properties of Brain Networks
The sparsity range of 0.05 ≤ sparsity ≤ 0.5 was selected to construct the matrices. We compared the small-world parameters between the SD and RW states. The Cp and Lp of the brain networks showed significant reductions in the SD state compared to the RW state (Cp, 0.05 ≤ sparsity ≤ 0.5; Lp, 0.1 ≤ sparsity ≤ 0.2). Regarding network efficiency, Eloc (t = −2.42, p = 0.0185) significantly decreased after SD. This finding suggested decreased small-world properties after SD. Detailed results are shown in Figure 3.
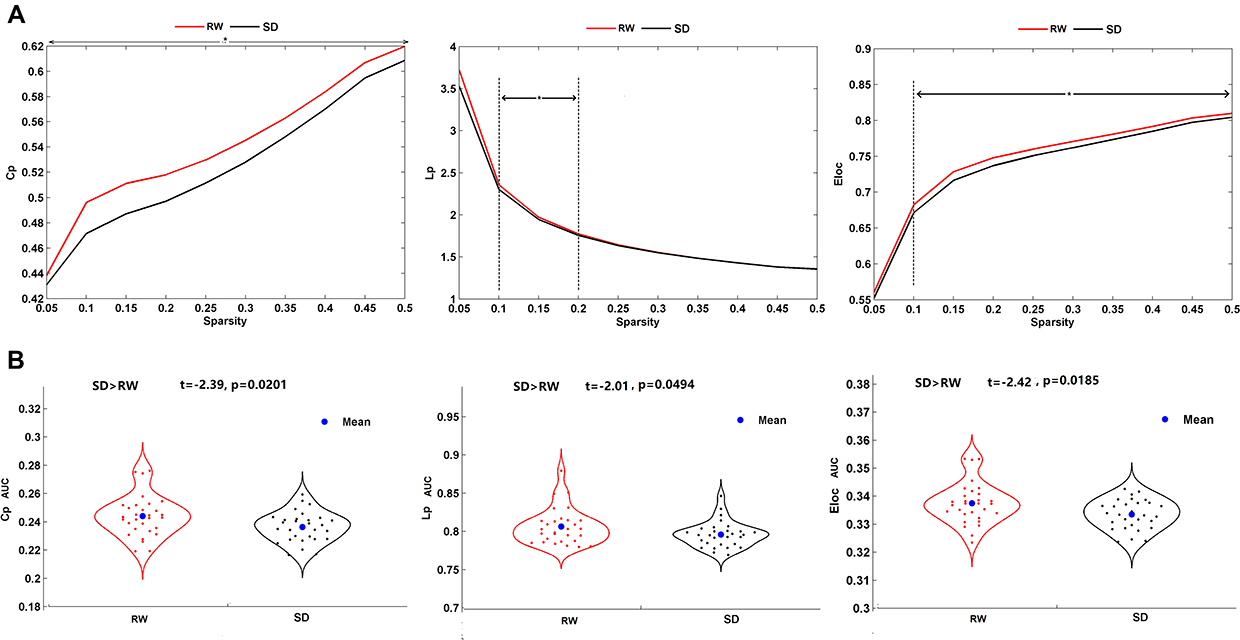 |
Figure 3 Altered network topological properties between the SD and RW states. (A) The clustering coefficient (Cp), characteristic path length (Lp) and local efficiency (Eloc) across a sparsity range between 0.05 and 0.5. Asterisks indicate a significant difference at this sparsity threshold. (B) Violin plots illustrating the area under the curve (AUC) parameters of the Cp, Lp and Eloc for SD and RW states. *p < 0.05. Abbreviations: RW, rested wakefulness; SD, sleep deprivation. |
We also observed decreased nodal efficiency in the SMN (right parietal lobe, right precentral gyrus and left temporal lobe), DMN (left ventral prefrontal cortex, left anterior prefrontal cortex, left precuneus, and right anterior cingulate cortex), and VAN (right post insula) after SD. Detailed results are shown in Figure 4 and Table 3.
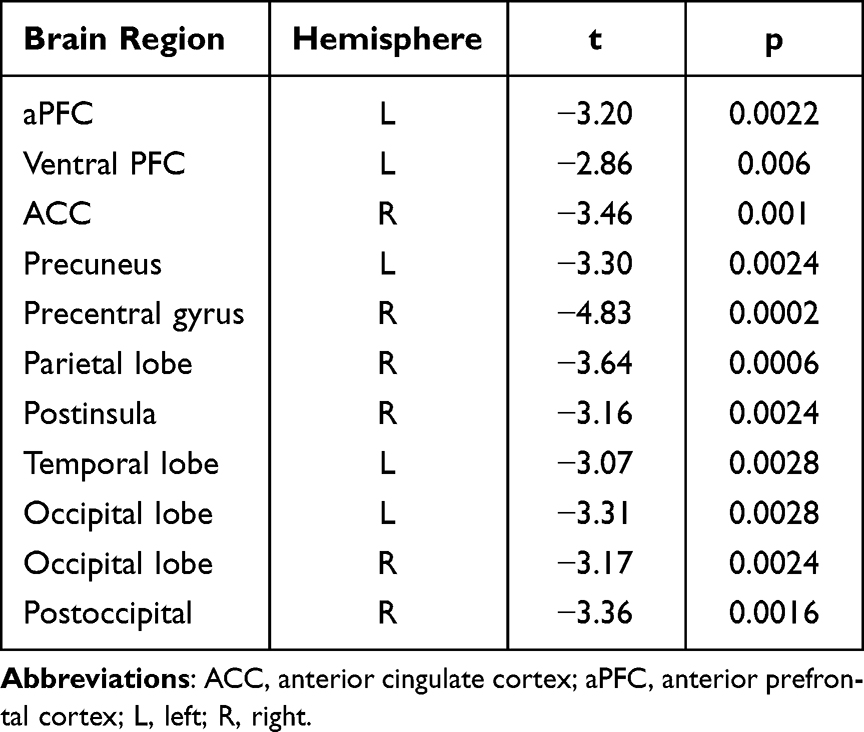 |
Table 3 Brain Regions in Decreased Nodal Efficiency Between SD and RW States |
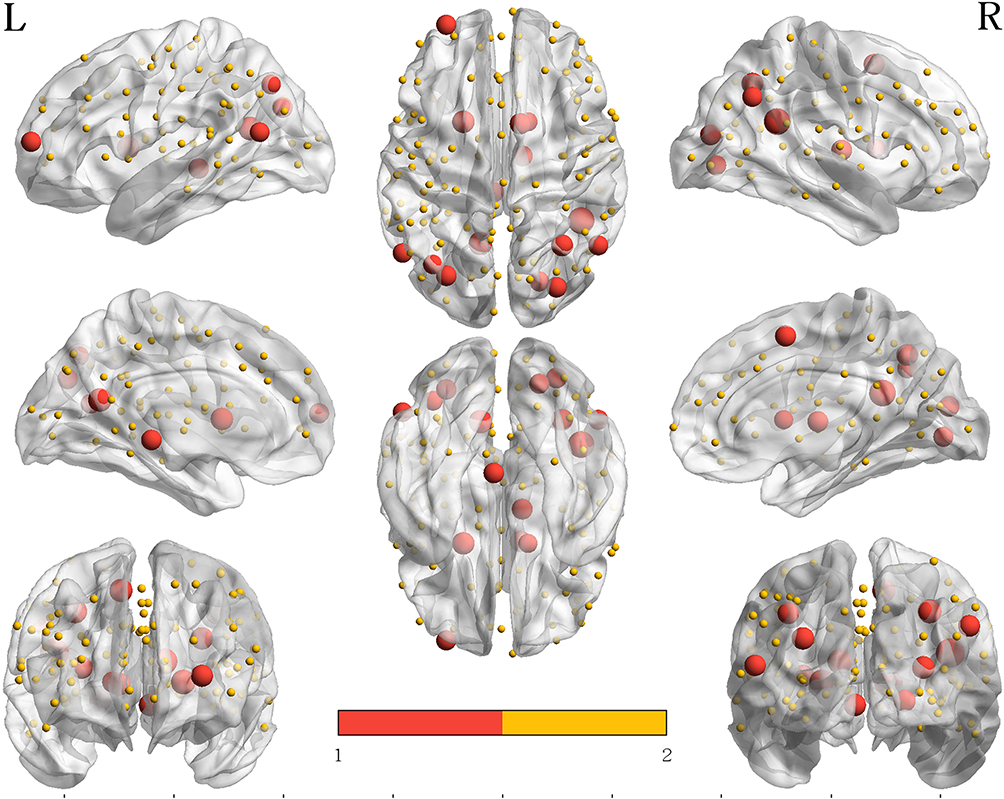 |
Figure 4 Group differences in efficiency at the nodal level. Insignificant nodes are shown as yellow spheres, whereas red (RW > SD) spheres denote significant differences after FDR correction. The size of the significant nodes reflects the effect sizes of group differences. Abbreviations: RW, rested wakefulness; SD, sleep deprivation. |
Correlation Analysis
To explore the relationship between the altered FC and topological features of brain networks and attention, we first conducted a correlation analysis between changes in FC (ΔX = XSD-XRW) and changes in attention score. The change in FC in DAN-SMN change was negatively correlated with the change in attention score (R = −0.39, p = 0.032). We then conducted the correlation analysis between changes in the attention score and changes in the topological measure. The changes in Cp, Lp and Elocal s were positively correlated with the change in attention score (Cp, R = 0.42, p = 0.02; Lp, R = 0.48, p = 0.0069; Eloc, R = 0.40, p = 0.027). Detailed results are shown in Figure 5.
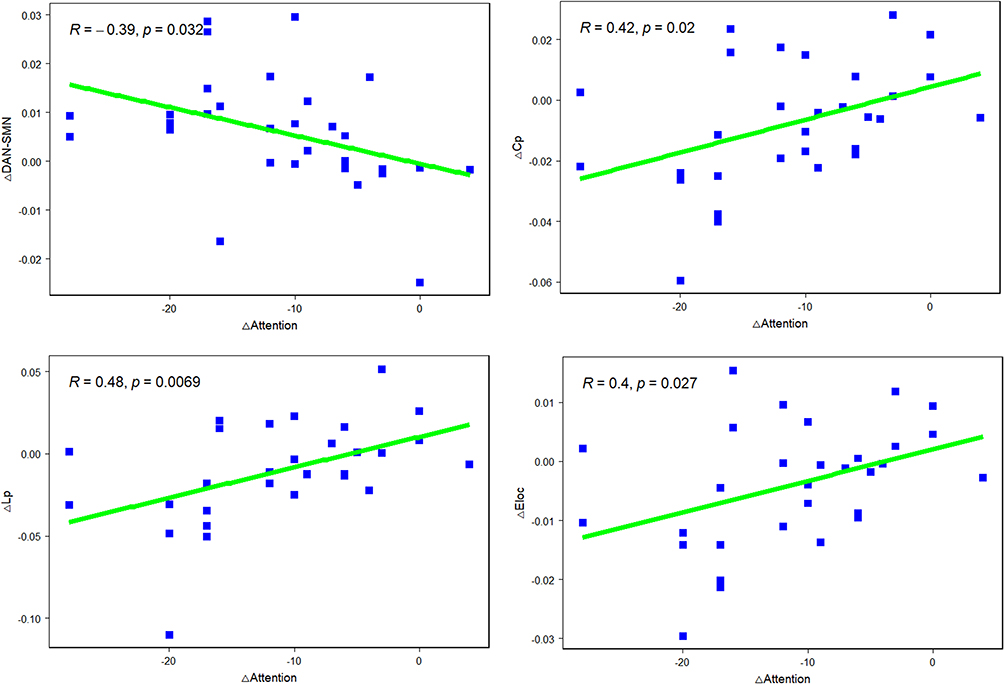 |
Figure 5 Correlation analysis between the altered FC and topological features of brain networks and attention. Abbreviations: ΔX=XSD-XRW; Cp, clustering coefficient; Eloc, local efficiency; Lp, characteristic path length; RW, rested wakefulness; SD, sleep deprivation. |
Discussion
To the best of our knowledge, this is the first study to utilize both large-scale network FC and topological properties based on surface to explore the mechanisms underlying cognitive impairments after 24 h of SD. We observed a significant decline in attention after SD. Compared to the RW state, the large-scale brain network results showed decreased between-network FC in SMN-DMN, SMN-FPN, and SMN-VAN and increased between-network FC in DAN-VAN and DAN-SMN after 24 h of SD. The Cp, Lp and Elocal decreased after SD. Moreover, the decreased attention score was positively correlated with the decreased topological measures, and negatively correlated with the increased FC of DAN-SMN. Our findings demonstrated that SD altered the FC in extensive brain networks and decreased small-world properties of resting-state networks.
Abnormal Large-Scale Network FC After SD
In the large-scale brain network, we found decreased between-network FC in SMN-DMN, SMN-FPN, and SMN-VAN and increased between-network FC in DAN -VAN, DAN-SMN after SD. In line with our results, the MEG study revealed large-scale rearrangements in the functional network after 24 h of SD.29 Previous fMRI studies also demonstrated that abnormalities in the functional brain networks in SD involve SMN, DMN, Salience Network (SN), DAN, and FPN.11,12,39 DMN is an internally directed network, which was reported to show a decrease in FC after SD.11 DMN can impact the rest–stimulus interactions in the corresponding sensory cortices,40 which may explain the decreased FC in DMN-SMN after SD. It was also shown that SD affected DAN which is associated with the top-down deployment of attention.41,42 Several fMRI studies showed that SD changed the intrinsic connectivity within the DAN and the related anti-correlated network (ie DMN).11,19 FPN, which mainly supports the control of information processing, contributes to verbal expression, memory, and cognitive control.43 SD lead to a decrease in FC in FPN-DMN, which is associated with working-memory performance.12 The SMN was found to be more affected (more pairs of large-scale networks) than other networks in the current study. Brain regions of the SMN control motor, somatosensory and auditory processing, and are responsible for external stimuli and internally generated movement. It was demonstrated that the brain networks related to sleep and wakefulness are modulated by sensory inputs, and both sensory information and deprivation may induce changes in the brain networks related to sleep and wakefulness.44 One previous study also illustrated that the altered FC in SMN is associated with the vulnerability of objective vigilance after SD.45 Thus, our results may support the notion that the SMN is the core network of altered large-scale networks due to sleep loss. The DAN controls goal-oriented top-down deployment of attention,46 and the VAN, partly overlapping with SN mediates stimulus-driven bottom-up attentional reorienting.47 The interaction between the two networks is competitive among multiple stimuli in the visual cortex and mediated the selection of behaviorally relevant information.48 A previous study on healthy participants demonstrated that granger causal influences from VAN to DAN are negatively associated with attention.49 Regions of the SMN are spatially adjacent to regions of the DAN and VAN in the brain, and cooperate with DAN and VAN during the external tasks.38 Furthermore, it was reported that SD affects only the top-down processing of attention.50 In the current study, we observed that the increased FC in DAN-SMN negatively correlated with the decreased attention score. Hence, we speculated that the increased FC in DAN-SMN might be served as a biomarker for the abnormal top-down processing of attention after SD. In short, the abnormal between-network FC after SD might explain the SD‑induced impairments in cognition.
Decreased Small-World Properties After SD
We conducted the graph theory analysis following the construction of the resting-state networks, and observed that the Cp, Lp and Elocal decreased after SD. The topological result revealed that functional brain networks underwent rearrangements at the global level. In line with our results, the decreased topological features in functional and structural brain networks were reported in numerous neurological and psychiatric disorders, such as major depression, primary insomnia, and shift work disorder.51–53 A recent EEG study showed a significant decrease of small-worldness in delta and theta bands after 24 h of SD.28 Nevertheless, a published graph theory-based study on the whole brain networks revealed that the small-world property of resting-state networks is significantly enhanced after 34 h of SD.30 We speculated that this contradictory result was due to the difference in the duration of SD and circadian influences. Cognitive performances, including vigilant attention, during the morning hours following a sleepless night, are partially restored until the afternoon despite continuing SD.54 Moreover, our results revealed that the decreased attention scores positively correlated with the decreased topological measures. Hence, we speculated that the worse attention performance after 24 h of SD than 34 h of SD led to the decreased small-world property of brain networks.
To demonstrate the strength of analysis method in our study, we used the surface-based preprocessing method, which was better than the volume-based method for registration, reproducibility of algorithms and surface reconstructions.55 Moreover, we utilized a different approach for large-scale brain network analysis from the previous approach to explore SD-related abnormalities in intrinsic FC in all pairs of brain networks.
Limitations and Future Directions
However, there were certain limitations. First, the recruited participants were not monitored in the lab and simply reported their sleep duration the night before the RW scan, which probably had some effect on the results. Secondly, several studies have suggested that longer resting-state scans improve reliability and replicability.56,57 In the current study, we collected 490-s resting-state data. Future studies with longer resting-state scans are needed to validate our results. Thirdly, our results showed higher scores for immediate and delayed memory and language after SD, which could not be used to interpret the mechanisms underlying memory decline. We think that certain RBANS tasks have practice effects, especially when the test is repeated within 24 h. It may be necessary to set up a separate rested control group to compare performance changes in future studies. Finally, only young participants were recruited, and other factors (eg body composition and physical fitness) were not controlled in the current study. Therefore, the results could not be extrapolated to individuals in other age groups. Participants from a broader age range should be recruited in the future.
Conclusion
Our results revealed the abnormal FC in extensive brain networks and decreased small-world property of resting-state networks after 24 h of SD. Furthermore, our results suggested that the increased FC of DAN-SMN and decreased topological features of brain networks may act as neural indicators for attention decline after SD.
Data Sharing Statement
The data that support the findings of this study are available from the corresponding author (Hongxiao Jia) upon reasonable request. Additionally, the individual deidentified participant data are available after contacting the corresponding author via email ([email protected]). The data will be available immediately following publication without an end date.
Acknowledgments
This study is supported by the National Natural Science Foundation (Grant no.81904120, 82004437), Beijing Hospitals Authority Youth Program (Grant no. QML20201901), Beijing Natural Science Foundation (Grant no. 7212050), Beijing Hospitals Authority Clinical Medicine Development of Special Funding (Grant no. ZYLX202129), and Beijing Hospitals Authority’s Ascent Plan (Grant no. DFL20191901).
Disclosure
The authors declare that there was no conflict of interest.
References
1. Bixler E. Sleep and society: an epidemiological perspective. Sleep Med. 2009;10(Suppl 1):S3–S6. doi:10.1016/j.sleep.2009.07.005
2. Schoenborn CA, Adams PE. Health behaviors of adults: United States, 2005–2007. Vital Health Stat Series 10. 2010;245:1–132.
3. Philip P, Akerstedt T. Transport and industrial safety, how are they affected by sleepiness and sleep restriction? Sleep Med Rev. 2006;10(5):347–356. doi:10.1016/j.smrv.2006.04.002
4. Liew SC, Aung T. Sleep deprivation and its association with diseases- a review. Sleep Med. 2021;77:192–204. doi:10.1016/j.sleep.2020.07.048
5. Yarkoni T, Poldrack RA, Nichols TE, Van Essen DC, Wager TD. Large-scale automated synthesis of human functional neuroimaging data. Nat Methods. 2011;8(8):665–670. doi:10.1038/nmeth.1635
6. Lowe CJ, Safati A, Hall PA. The neurocognitive consequences of sleep restriction: a meta-analytic review. Neurosci Biobehav Rev. 2017;80:586–604. doi:10.1016/j.neubiorev.2017.07.010
7. Chee MW, Chuah LY. Functional neuroimaging insights into how sleep and sleep deprivation affect memory and cognition. Curr Opin Neurol. 2008;21(4):417–423. doi:10.1097/WCO.0b013e3283052cf7
8. Greicius MD, Krasnow B, Reiss AL, Menon V. Functional connectivity in the resting brain: a network analysis of the default mode hypothesis. Proc Natl Acad Sci USA. 2003;100(1):253–258. doi:10.1073/pnas.0135058100
9. Verweij IM, Romeijn N, Smit DJ, Piantoni G, Van Someren EJ. Sleep deprivation leads to a loss of functional connectivity in frontal brain regions. BMC Neurosci. 2014;15:88. doi:10.1186/1471-2202-15-88
10. Mu Q, Nahas Z, Johnson KA, et al. Decreased cortical response to verbal working memory following sleep deprivation. Sleep. 2005;28(1):55–67. doi:10.1093/sleep/28.1.55
11. De Havas JA, Parimal S, Soon CS, Chee MW. Sleep deprivation reduces default mode network connectivity and anti-correlation during rest and task performance. Neuroimage. 2012;59(2):1745–1751. doi:10.1016/j.neuroimage.2011.08.026
12. Dai C, Zhang Y, Cai X, et al. Effects of sleep deprivation on working memory: change in functional connectivity between the dorsal attention, default mode, and fronto-parietal networks. Front Hum Neurosci. 2020;14:360. doi:10.3389/fnhum.2020.00360
13. Buckner RL. The serendipitous discovery of the brain’s default network. Neuroimage. 2012;62(2):1137–1145. doi:10.1016/j.neuroimage.2011.10.035
14. Bailey SK, Aboud KS, Nguyen TQ, Cutting LE. Applying a network framework to the neurobiology of reading and dyslexia. J Neurodev Disord. 2018;10(1):37. doi:10.1186/s11689-018-9251-z
15. Bell PT, Shine JM. Estimating large-scale network convergence in the human functional connectome. Brain Connect. 2015;5(9):565–574. doi:10.1089/brain.2015.0348
16. Scolari M, Seidl-Rathkopf KN, Kastner S. Functions of the human frontoparietal attention network: evidence from neuroimaging. Curr Opin Behav Sci. 2015;1:32–39. doi:10.1016/j.cobeha.2014.08.003
17. Zhao R, Zhang X, Zhu Y, et al. Disrupted resting-state functional connectivity in hippocampal subregions after sleep deprivation. Neuroscience. 2019;398:37–54. doi:10.1016/j.neuroscience.2018.11.049
18. Chen WH, Chen J, Lin X, et al. Dissociable effects of sleep deprivation on functional connectivity in the dorsal and ventral default mode networks. Sleep Med. 2018;50:137–144. doi:10.1016/j.sleep.2018.05.040
19. Yeo BT, Tandi J, Chee MW. Functional connectivity during rested wakefulness predicts vulnerability to sleep deprivation. Neuroimage. 2015;111:147–158. doi:10.1016/j.neuroimage.2015.02.018
20. Fox MD, Snyder AZ, Vincent JL, Corbetta M, Van Essen DC, Raichle ME. The human brain is intrinsically organized into dynamic, anticorrelated functional networks. Proc Natl Acad Sci USA. 2005;102(27):9673–9678. doi:10.1073/pnas.0504136102
21. Bondy JA, Murty USR. Graph Theory. Springer; 2008. ISBN 978-1-84628-969-9.
22. Sporns O. Graph theory methods: applications in brain networks. Dialogues Clin Neurosci. 2018;20(2):111–121. doi:10.31887/DCNS.2018.20.2/osporns
23. Bullmore E, Sporns O. Complex brain networks: graph theoretical analysis of structural and functional systems. Nat Rev Neurosci. 2009;10(3):186–198. doi:10.1038/nrn2575
24. Bassett DS, Bullmore ET. Small-world brain networks revisited. Neuroscientist. 2017;23(5):499–516. doi:10.1177/1073858416667720
25. Sporns O, Chialvo DR, Kaiser M, Hilgetag CC. Organization, development and function of complex brain networks. Trends Cogn Sci. 2004;8(9):418–425. doi:10.1016/j.tics.2004.07.008
26. Strogatz SH. Exploring complex networks. Nature. 2001;410(6825):268–276. doi:10.1038/35065725
27. Tan B, Kong X, Yang P, Jin Z, Li L. The difference of brain functional connectivity between eyes-closed and eyes-open using graph theoretical analysis. Comput Math Methods Med. 2013;2013:976365. doi:10.1155/2013/976365
28. Miraglia F, Tomino C, Vecchio F, Gorgoni M, De Gennaro L, Rossini PM. The brain network organization during sleep onset after deprivation. Clin Neurophysiol. 2021;132(1):36–44. doi:10.1016/j.clinph.2020.10.016
29. Pesoli M, Rucco R, Liparoti M, et al. A night of sleep deprivation alters brain connectivity and affects specific executive functions. Neurol Sci. 2022;43(2):1025–1034. doi:10.1007/s10072-021-05437-2
30. Liu H, Li H, Wang Y, Lei X. Enhanced brain small-worldness after sleep deprivation: a compensatory effect. J Sleep Res. 2014;23(5):554–563. doi:10.1111/jsr.12147
31. Cheng Y, Wu W, Wang J, Feng W, Wu X, Li C. Clinical research Reliability and validity of the repeatable battery for the assessment of neuropsychological status in community-dwelling elderly. Arch Med Sci. 2011;7(5):850–857. doi:10.5114/aoms.2011.25561
32. Yan CG, Wang XD, Zuo XN, Zang YF. DPABI: data processing & analysis for (Resting-State) brain imaging. Neuroinformatics. 2016;14(3):339–351. doi:10.1007/s12021-016-9299-4
33. Li L, Su YA, Wu YK, et al. Eight-week antidepressant treatment reduces functional connectivity in first-episode drug-naive patients with major depressive disorder. Hum Brain Mapp. 2021;42(8):2593–2605. doi:10.1002/hbm.25391
34. Tustison NJ, Avants BB, Cook PA, et al. N4ITK: improved N3 bias correction. IEEE Trans Med Imaging. 2010;29(6):1310–1320. doi:10.1109/TMI.2010.2046908
35. Klein A, Ghosh SS, Bao FS, et al. Mindboggling morphometry of human brains. PLoS Comput Biol. 2017;13(2):e1005350. doi:10.1371/journal.pcbi.1005350
36. Esteban O, Markiewicz CJ, Blair RW, et al. fMRIPrep: a robust preprocessing pipeline for functional MRI. Nat Methods. 2019;16(1):111–116. doi:10.1038/s41592-018-0235-4
37. Dosenbach NU, Nardos B, Cohen AL, et al. Prediction of individual brain maturity using fMRI. Science. 2010;329(5997):1358–1361. doi:10.1126/science.1194144
38. Yeo BT, Krienen FM, Sepulcre J, et al. The organization of the human cerebral cortex estimated by intrinsic functional connectivity. J Neurophysiol. 2011;106(3):1125–1165. doi:10.1152/jn.00338.2011
39. Krause AJ, Simon EB, Mander BA, et al. The sleep-deprived human brain. Nat Rev Neurosci. 2017;18(7):404–418. doi:10.1038/nrn.2017.55
40. Menon V. Large-scale brain networks and psychopathology: a unifying triple network model. Trends Cogn Sci. 2011;15(10):483–506. doi:10.1016/j.tics.2011.08.003
41. Hutton JS, Dudley J, Horowitz-Kraus T, DeWitt T, Holland SK. Functional connectivity of attention, visual, and language networks during audio, illustrated, and animated stories in preschool-age children. Brain Connect. 2019;9(7):580–592. doi:10.1089/brain.2019.0679
42. Zhou X, Wu T, Yu J, Lei X. Sleep deprivation makes the young brain resemble the elderly brain: a large-scale brain networks study. Brain Connect. 2017;7(1):58–68. doi:10.1089/brain.2016.0452
43. Zhu W, Chen Q, Xia L, et al. Common and distinct brain networks underlying verbal and visual creativity. Hum Brain Mapp. 2017;38(4):2094–2111. doi:10.1002/hbm.23507
44. Velluti RA. Interactions between sleep and sensory physiology. J Sleep Res. 1997;6(2):61–77. doi:10.1046/j.1365-2869.1997.00031.x
45. Tian Y, Xie C, Lei X. Isolation of subjectively reported sleepiness and objectively measured vigilance during sleep deprivation: a resting-state fMRI study. Cogn Neurodyn. 2022. doi:10.1007/s11571-021-09772-0
46. Corbetta M, Patel G, Shulman GL. The reorienting system of the human brain: from environment to theory of mind. Neuron. 2008;58(3):306–324. doi:10.1016/j.neuron.2008.04.017
47. Fox MD, Corbetta M, Snyder AZ, Vincent JL, Raichle ME. Spontaneous neuronal activity distinguishes human dorsal and ventral attention systems. Proc Natl Acad Sci USA. 2006;103(26):10046–10051. doi:10.1073/pnas.0604187103
48. McMains S, Kastner S. Interactions of top-down and bottom-up mechanisms in human visual cortex. J Neurosci. 2011;31(2):587–597. doi:10.1523/JNEUROSCI.3766-10.2011
49. Wen X, Yao L, Liu Y, Ding M. Causal interactions in attention networks predict behavioral performance. J Neurosci. 2012;32(4):1284–1292. doi:10.1523/JNEUROSCI.2817-11.2012
50. Gevers W, Deliens G, Hoffmann S, Notebaert W, Peigneux P. Sleep deprivation selectively disrupts top-down adaptation to cognitive conflict in the Stroop test. J Sleep Res. 2015;24(6):666–672. doi:10.1111/jsr.12320
51. Yang H, Chen X, Chen ZB, et al. Disrupted intrinsic functional brain topology in patients with major depressive disorder. Mol Psychiatry. 2021;26(12):7363–7371. doi:10.1038/s41380-021-01247-2
52. Lu FM, Dai J, Couto TA, et al. Diffusion tensor imaging tractography reveals disrupted white matter structural connectivity network in healthy adults with insomnia symptoms. Front Hum Neurosci. 2017;11:583. doi:10.3389/fnhum.2017.00583
53. Ning Y, Fang M, Zhang Y, et al. Attention performance correlated with white matter structural brain networks in shift work disorder. Front Psychiatry. 2021;12:802830. doi:10.3389/fpsyt.2021.802830
54. Hudson AN, Van Dongen HPA, Honn KA. Sleep deprivation, vigilant attention, and brain function: a review. Neuropsychopharmacology. 2020;45(1):21–30. doi:10.1038/s41386-019-0432-6
55. Coalson TS, Van Essen DC, Glasser MF. The impact of traditional neuroimaging methods on the spatial localization of cortical areas. Proc Natl Acad Sci USA. 2018;115(27):E6356–E6365. doi:10.1073/pnas.1801582115
56. Birn RM, Molloy EK, Patriat R, et al. The effect of scan length on the reliability of resting-state fMRI connectivity estimates. Neuroimage. 2013;83:550–558. doi:10.1016/j.neuroimage.2013.05.099
57. Laumann TO, Gordon EM, Adeyemo B, et al. Functional system and areal organization of a highly sampled individual human brain. Neuron. 2015;87(3):657–670. doi:10.1016/j.neuron.2015.06.037
 © 2022 The Author(s). This work is published and licensed by Dove Medical Press Limited. The
full terms of this license are available at https://www.dovepress.com/terms
and incorporate the Creative Commons Attribution
- Non Commercial (unported, 3.0) License.
By accessing the work you hereby accept the Terms. Non-commercial uses of the work are permitted
without any further permission from Dove Medical Press Limited, provided the work is properly
attributed. For permission for commercial use of this work, please see paragraphs 4.2 and 5 of our Terms.
© 2022 The Author(s). This work is published and licensed by Dove Medical Press Limited. The
full terms of this license are available at https://www.dovepress.com/terms
and incorporate the Creative Commons Attribution
- Non Commercial (unported, 3.0) License.
By accessing the work you hereby accept the Terms. Non-commercial uses of the work are permitted
without any further permission from Dove Medical Press Limited, provided the work is properly
attributed. For permission for commercial use of this work, please see paragraphs 4.2 and 5 of our Terms.
Recommended articles
Altered Functional Connectivity of Large-Scale Brain Networks in Psychogenic Erectile Dysfunction Associated with Cognitive Impairments
Feng S, Dong L, Yan B, Zheng S, Feng Z, Li X, Li J, Sun N, Ning Y, Jia H
Neuropsychiatric Disease and Treatment 2023, 19:1925-1933
Published Date: 5 September 2023