Back to Journals » International Journal of Chronic Obstructive Pulmonary Disease » Volume 13
Altered community compositions of Proteobacteria in adults with bronchiectasis
Authors Guan WJ, Yuan JJ, Li HM, Gao YH ![]() , Chen CL, Huang Y
, Chen CL, Huang Y ![]() , Chen RC
, Chen RC ![]() , Zhong NS
, Zhong NS
Received 8 December 2017
Accepted for publication 11 May 2018
Published 17 July 2018 Volume 2018:13 Pages 2173—2182
DOI https://doi.org/10.2147/COPD.S159335
Checked for plagiarism Yes
Review by Single anonymous peer review
Peer reviewer comments 2
Editor who approved publication: Dr Chunxue Bai
Wei-Jie Guan,1,2 Jing-Jing Yuan,1 Hui-Min Li,1 Yong-Hua Gao,3 Chun-Lan Chen,1 Yan Huang,1 Rong-Chang Chen,1 Nan-Shan Zhong1,2
1State Key Laboratory of Respiratory Disease, National Clinical Research Center for Respiratory Disease, Guangzhou Institute of Respiratory Health, The First Affiliated Hospital of Guangzhou Medical University, Guangzhou, People’s Republic of China; 2Sino-French Hoffmann Institute, Guangzhou Medical University, Guangzhou, People’s Republic of China; 3Department of Respiratory and Critical Care Medicine, First Affiliated Hospital of Zhengzhou University, Zhengzhou, People’s Republic of China
Background: Bronchiectasis is a debilitating disease with chronic airway infection. Proteobacteria, the dominant phylum, can be detected with high-throughput sequencing.
Objective: To stratify Proteobacteria compositions according to culture findings in bronchiectasis.
Patients and methods: We sampled sputum, split for culture and 16srRNA sequencing, from 106 patients with stable bronchiectasis and 17 healthy subjects. Paired sputa from 22 bronchiectasis patients were collected during exacerbations and convalescence.
Results: Forty-five, 41, and 20 patients with clinically stable bronchiectasis had isolated Pseudomonas aeruginosa (PA), other potentially pathogenic microorganisms, and commensals at the initial visit, respectively. The PA group (but not other groups) demonstrated significantly greater relative abundance of Proteobacteria, and lower Shannon–Wiener Diversity Index, Simpson Diversity Index, and richness compared with healthy subjects. Pseudomonas was the dominant genus that discriminated bronchiectasis patients (particularly in the PA group) from healthy subjects. Compared with baseline levels, Proteobacteria community compositions in the PA group, but not in other groups, were more resilient during exacerbations and convalescence.
Conclusion: Proteobacteria community compositions could be partially reflected by conventional sputum bacterial culture. Significantly altered Proteobacteria community compositions – particularly, the increased relative abundance of Pseudomonas and diminished community diversity – represent critical targets for novel interventions to restore normal airway microenvironment in patients with bronchiectasis.
Keywords: bronchiectasis, Proteobacteria, Pseudomonas aeruginosa, culture, exacerbation
Introduction
Bronchiectasis is a debilitating disease characterized by disrupted airway microenvironment.1–3 Microbial dysbiosis plays pivotal roles in eliciting airway inflammation4,5 and in aggravating oxidative stress and excessive matrix metalloproteinase release.6,7 Identification of pathogenic microorganisms responsible for the vicious cycle may guide targeted therapy.8 Proteobacteria is the dominant phylum, comprising pathogens that are of clinical significance (eg, Pseudomonas spp., Haemophilus spp.).9,10 Although culture has been a “gold standard” for determining sputum bacteriology, limited categories of potentially pathogenic microorganisms (PPMs) could be detected,11 raising concerns of under-detection in bronchiectasis.
Advances in molecular genotyping have enabled systematic exploration of microbial compositions in asthma,12,13 cystic fibrosis,14,15 interstitial lung disease,16 and bronchiectasis.17–21 In-depth analysis of microbial compositions in bronchiectasis is clinically significant because they correlate with lung function17,20,21 and change dynamically during exacerbations.18 Nevertheless, how Proteobacteria compositions correlate with culture findings remains unclear.
We hypothesized that sputum Proteobacteria compositions could be partially reflected by culture findings. We determined Proteobacteria compositions by stratifying culture findings in adults with clinically stable bronchiectasis, and evaluate the changes in Proteobacteria composition during bronchiectasis exacerbation and convalescence.
Patients and methods
Patients
Between March 2014 and November 2015, consecutive adult bronchiectasis patients (age >18 years) were enrolled from our outpatient clinics. Bronchiectasis was confirmed by high-resolution computed tomography (HRCT) of the chest, effective within 12 months. All patients could spontaneously expectorate at baseline visits, and remained exacerbation-free for 4 weeks. Exacerbations were defined as at least three criteria lasting for ≥2 days: significantly increased/aggravated sputum purulence/volume, tachypnea, chest pain, cough frequency, fever, wheezing, fatigue, hemoptysis, and exercise intolerance.11,22,23 We excluded patients with traction bronchiectasis, malignancy, acute respiratory tract infection, or antibiotic (excepting low-dose macrolides) use within the 4 weeks preceding study enrolment.
Healthy subjects (94% were never-smokers), recruited from a health check-up center, were aged 18–75 years and had no respiratory diseases, malignancy, or respiratory tract infection within 4 weeks.
The Ethics Committee of The First Affiliated Hospital of Guangzhou Medical University gave approval (Medical Ethics Year 2012 [The 33rd]). Written informed consent was obtained from all study participants (clinical trial registration number: NCT01761214).
Study design
At baseline, subjects underwent history inquiry, spirometry, and sputum sampling. Patients with bronchiectasis were followed-up every 3–4 months for repeated sputum cultures to determine isolation or colonization of Pseudomonas aeruginosa (see detailed definition in Supplementary materials).11,22 All patients were grouped according to their initial culture findings. In this study, bacterial isolation was defined as sputum culture positive to any of the PPM (mentioned above) at the initial visit. Bacterial colonization (referred to as infection for P. aeruginosa) was defined as sputum culture positive of an identical PPM for at least 2 occasions within 1 year, at least 3 months apart. Bacterial isolation denoted sputum culture positive of PPMs at baseline.
During follow-up, patients underwent reassessment of spirometry and sputum sampling once exacerbations were confirmed, followed by antibiotic treatment.22,23 During exacerbation visits, sputum was sampled prior to initiation of antibiotics. We undertook convalescence visits at 1 week after 14-day antibiotic therapy. Only one sample at (typically, the first) exacerbation and convalescence hospital visits was collected for individual patients.
Clinical assessment
Bronchiectasis etiologies were determined using a validated protocol.22 We conducted spirometry with spirometers (QUARK PFT; COSMED Inc., Italy).23 Key parameters reflecting chest radiography included bronchiectatic lobes and HRCT scores (Modified Reiff Score). The main variables extracted from history inquiry were exacerbation frequency within 2 years, duration of symptoms, and smoking history.
Sputum collection and bacteriology
Fresh sputum was sampled during hospital visits. To minimize oral contamination, patients thoroughly gargled their mouths with distilled water and took deep breaths before expectoration into sterile plastic container.24 Hypertonic saline (3%–5%) induction, validated for microbiota assessment,18 was applied for healthy subjects (who cannot spontaneously expectorate sputum). Oral salivary contamination conferred limited impacts on sputum microbial compositions.10,18 Sputum was split for culture and sequencing and stored in −80°C freezers before biomarker measurement.
Conventional culture was applied for sputum. We stratified culture findings into a P. aeruginosa-positive (PA group), other potentially pathogenic microorganism-positive (PPM group), and culture-negative group (Comm group). PPM denoted Haemophilus spp., Staphylococcus aureus, Klebsiella spp. and miscellaneous bacteria that are of clinical significance.11
DNA extraction and sequencing
Nucleic acids were extracted using physical disruption and a centrifugal absorption column, followed by Agarose gel electrophoresis and quality control with an ND-100 Nanodrop system (Thermo Fisher Scientific, Waltham, MA, USA). Samples that met quality-control criteria were subject to library construction, and barcoded before pooling.
DNA was sequenced using the Miseq System (Illumina Inc., USA). Raw reads were denoised, followed by chimera removal. We clustered the remaining high-quality sequences into operational taxonomic units (OTUs) at 97% similarity. We aligned sequences for individual OTU, and assigned taxonomic identities by defining 50% as the confidence threshold. We rarefied the denoised files to calculate the Shannon–Wiener Diversity Index, and ran analyses to phyla and genera levels of taxonomic resolution. Sequences were deposited in GenBank under the accession number SAMN06768146-SAMN06768292. A flowchart demonstrating the main procedures associated with data processing is shown in Figure S1.
Statistical analysis
Data were processed with the R statistics package (www.r-project.org) and GraphPad Prism (GraphPad Inc., San Diego, USA). Numerical data were presented as mean ± SD for normal distribution, or median (interquartile range) for non-normal distribution. Between-group differences were compared with independent t-tests for unpaired data or Wilcoxon signed-rank tests for paired data. Multiple-group comparisons were made using analysis of variance or analysis of covariance. Paired t-tests were applied to pairwise samples. We analyzed κ statistics to evaluate the concordance between presence/absence of genera detected with culture and sequencing. Multiple-group comparison was subject to Bonferroni correction. We calculated the Shannon–Wiener Diversity Index, Simpson Diversity Index, and richness for reflecting community compositions. We used principal component analysis to assess the distinct bacterial phyla or genera when the patient remained clinically stable and during an exacerbation. We conducted linear multivariate regression analysis to determine how key clinical variables correlated with the relative abundance of Proteobacteria, and Shannon–Wiener Diversity Index of different phyla. We applied Bray–Curtis metrics for pairwise comparisons of community compositions, which were compared at different visits using a nonmetric multidimensional scaling algorithm.
Results
Subject recruitment
Two hundred and thirty-two subjects underwent screening, and the baseline assessment included 106 bronchiectasis patients and 17 healthy subjects. Twenty-two patients were included in the exacerbation subgroup, of whom 19 completed convalescence visits (Figure 1).
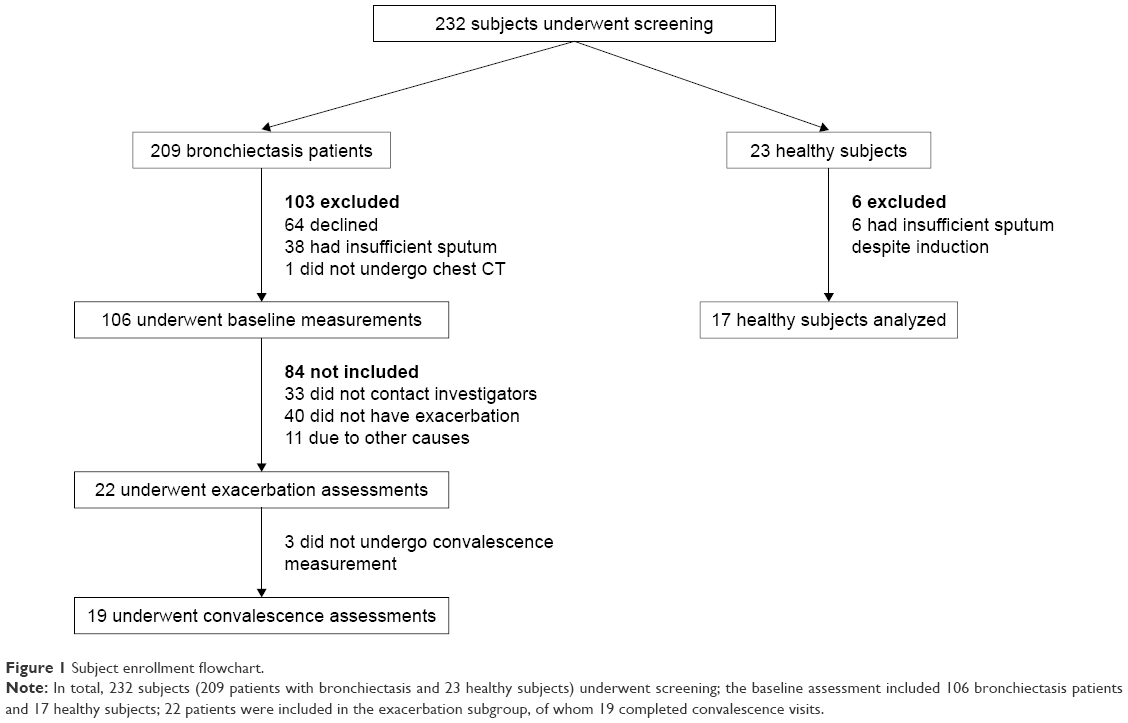 | Figure 1 Subject enrollment flowchart. |
Clinical characteristics
Patients who were included in baseline assessment (n=106) represented a cohort with predominantly moderate disease severity. Most patients had idiopathic and post-infectious bronchiectasis. At the initial visit, 45, 41, and 20 bronchiectasis patients had PA, other PPMs, and commensals isolation. Thirty-five of 45 (77.8%) patients had colonization by P. aeruginosa (Table S1). None of the patients had simultaneously isolated P. aeruginosa and other potentially pathogenic bacteria at any visit. Patients who were included in the baseline assessment (n=106) did not differ from those in the exacerbation subgroup (n=22) nor those excluded (n=103) in terms of demographics and the Bronchiectasis Severity Index (Table S2). A comparison of clinical characteristics of the PA, PPM, and Comm groups is presented in Table 1. Healthy subjects were older and had higher body mass index (P<0.05) compared with patients with bronchiectasis.
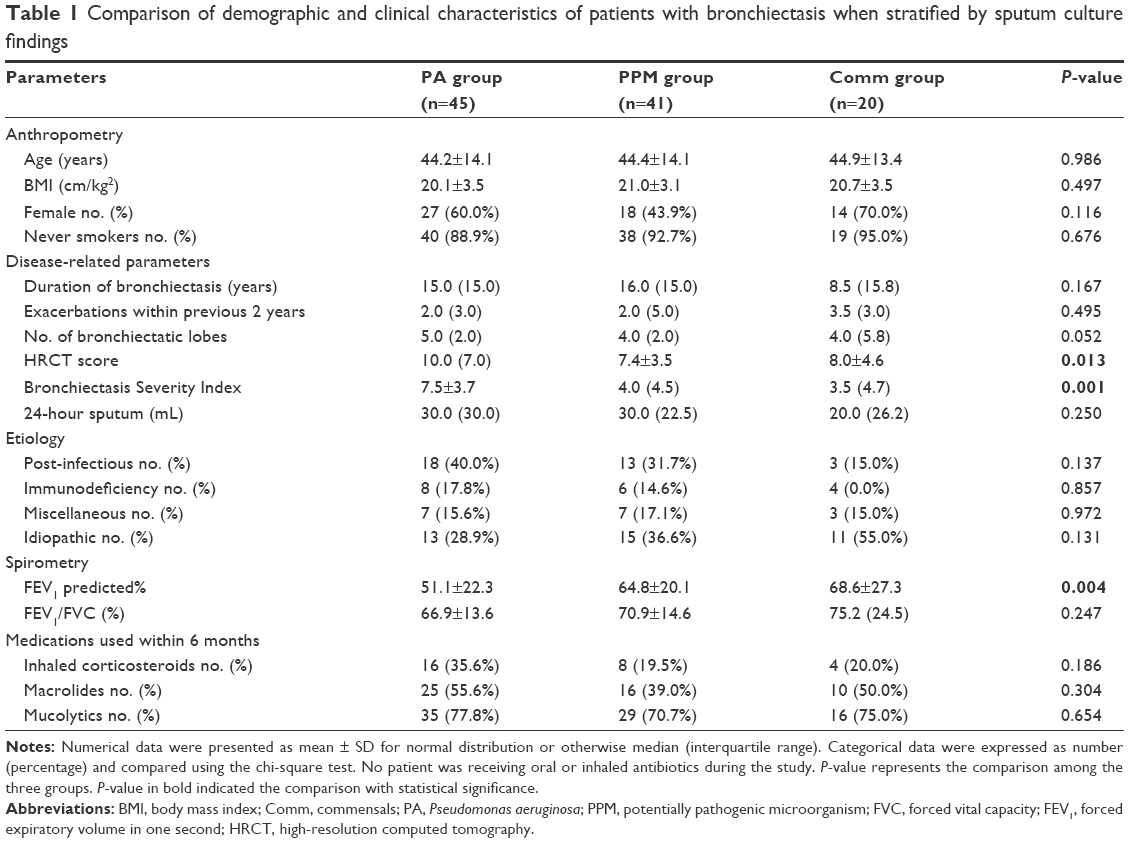 | Table 1 Comparison of demographic and clinical characteristics of patients with bronchiectasis when stratified by sputum culture findings |
Sequencing results
Following filtering of low-quality reads and removal of reads not classified to the kingdom “Bacteria”, we collectively identified 45,331 OTUs at 97% identity, with 1,478 OTUs per sample among patients with bronchiectasis for all visits (Table S3). The median unique OTUs were not different in patients with bronchiectasis at clinical stability, exacerbation, and convalescence (43 [range 9–80], 37 [17–74], and 43 [15–67]; [P=0.348]). A median of 46, 41, and 29 unique OTUs was detected in the PA, PPM, and Comm groups (P=0.007), respectively.
Microbial compositions
The most common phylum among patients with clinically stable bronchiectasis and healthy subjects was Proteobacteria (mean relative abundance, 83.79% vs 75.33%, P=0.017), followed by Firmicutes (7.31% vs 10.49%, P=0.022) and Bacteroidetes (5.20% vs 8.97%, P=0.005; Figures 2A and S2). Compared with healthy subjects (mean, 75.33%), the relative abundance of Proteobacteria was significantly higher in the PA group (mean, 92.07%, P<0.001) but not in the PPM (82.83%, P=0.056) or Comm group (67.13%, P=0.353). The PA, PPM, and Comm groups differed considerably in the relative abundance of Proteobacteria (P<0.001; Figure S3A and C). Patients in the PA group had lower relative abundance of Firmicutes and Bacteroidetes than other groups. No significant difference was found in the relative abundance of major phyla between healthy subjects and the PPM group, or the Comm group (both P>0.05; Table S4, Figure S3B and D).
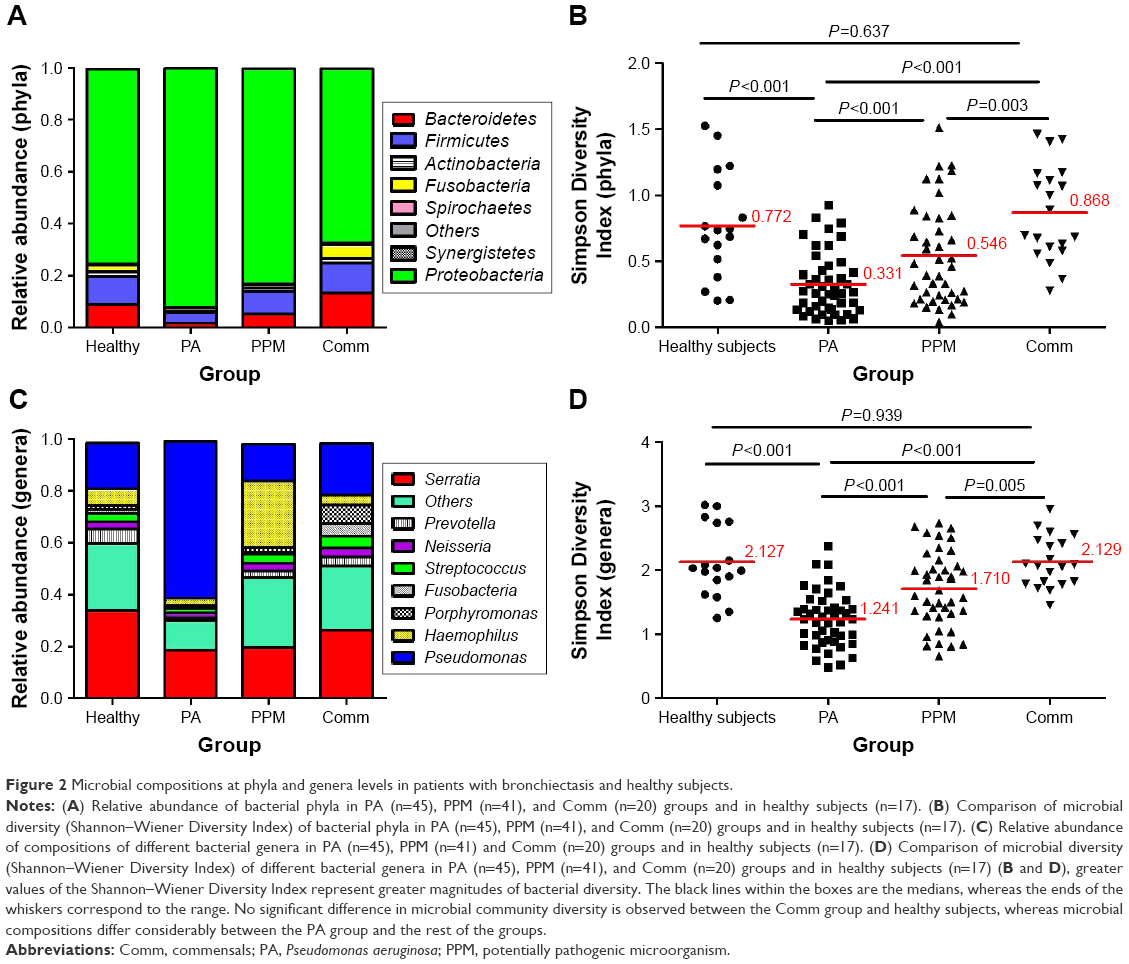 | Figure 2 Microbial compositions at phyla and genera levels in patients with bronchiectasis and healthy subjects. |
Genera compositions differed considerably. The relative abundance of Serratia increased progressively in the PA (mean 18.48%), PPM (19.70%), and Comm groups (26.39%) and healthy subjects (33.79%; Figure 2C). Focusing on the phylum Proteobacteria, the Pseudomonas spp. dominated (mean relative abundance 60.46%) in the PA group, but not in other groups (14.28%–19.67%). Moreover, the relative abundance of Pseudomonas differed significantly among the PA, PPM, and Comm groups (P<0.001). However, the relative abundance of the Pseudomonas spp. was not different among the PPM group, Comm group, and healthy subjects. A greater relative abundance of Haemophilus (mean, 25.53%) was observed in the PPM group than in other groups (2.71%–6.30%). Genera composition was comparable between healthy subjects and the Comm group (Table S5; Figure S4A–D).
Furthermore, Proteobacteria and Pseudomonas spp. contributed the most (92.07% and 38.33%) to the similarity of bacterial composition at phyla and genera levels, respectively (Tables 2 and S6).
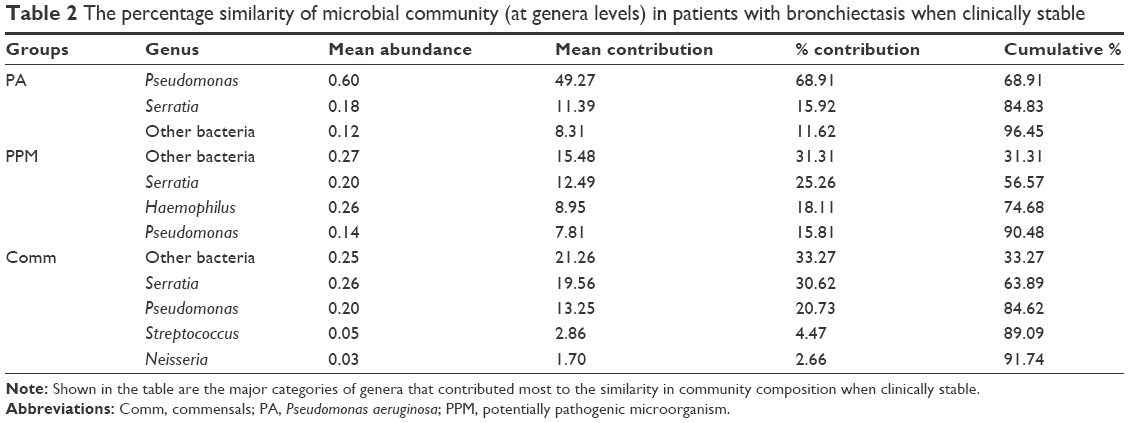 | Table 2 The percentage similarity of microbial community (at genera levels) in patients with bronchiectasis when clinically stable |
Concordance between sequencing and culture
Concordance between culture and sequencing was good (κ=0.75, 95% CI 0.62–0.88) when stratifying bacteriology into PA vs non-PA category, but not for PPM (including Pseudomonas spp.) versus commensals (κ=0.46, 95% CI 0.30–0.62). The relative abundance of dominant genera correlated significantly with bacterial loads detected with culture (r=0.51, P<0.001).
Community diversity
At phyla levels, the PA group demonstrated substantially reduced bacterial diversity (mean 0.33), followed by the PPM group (mean 0.55), Comm group (mean 0.87), and healthy subjects (mean 0.77). There was no remarkable difference between healthy subjects and the Comm group (P=0.637; Figure 2B). Similar findings were replicated at genera levels, with the PA group demonstrating most dramatically reduced diversity (mean 1.24) and a lack of significant difference between healthy subjects and the Comm group (P=0.939; Figure 2D).
Compared with healthy subjects, both the Simpson Diversity Index and richness were substantially lower in bronchiectasis (both P<0.001; Table S7). The PA group demonstrated the lowest levels of Simpson Diversity Index and bacterial richness, followed by the PPM and Comm groups, at phyla (Figure S5A and B) and genera levels (Figure S5C and D).
At phyla levels, except for richness, we found comparable relative abundance of Proteobacteria, the Shannon–Wiener and Simpson Diversity Index (all P>0.05) between patients with colonization of P. aeruginosa and isolation of P. aeruginosa (transiently infected), and between regular users of macrolides and their counterparts (Table S7).
Microbial compositions during exacerbations and convalescence
We noted a disparate distribution of phyla Proteobacteria, Firmicutes, and Bacteroidetes in the coordinate axis. Proteobacteria explained most of the dissimilarity for microbial compositions. Pseudomonas and Haemophilus contributed most to the community structural variation when remaining clinically stable and during exacerbations (Figure 3A and B). However, key clinical parameters (including the prior exacerbation frequency, HRCT scores, and lung function) did not correlate with the relative abundance of Proteobacteria and the Shannon–Wiener Diversity Index in clinically stable bronchiectasis. No correlation was found between key clinical parameters and the Simpson Diversity Index and richness at phyla level, except that the Bronchiectasis Severity Index (which has taken into account colonization status of any potentially pathogenic bacteria) correlated with bacterial richness (Table S8).
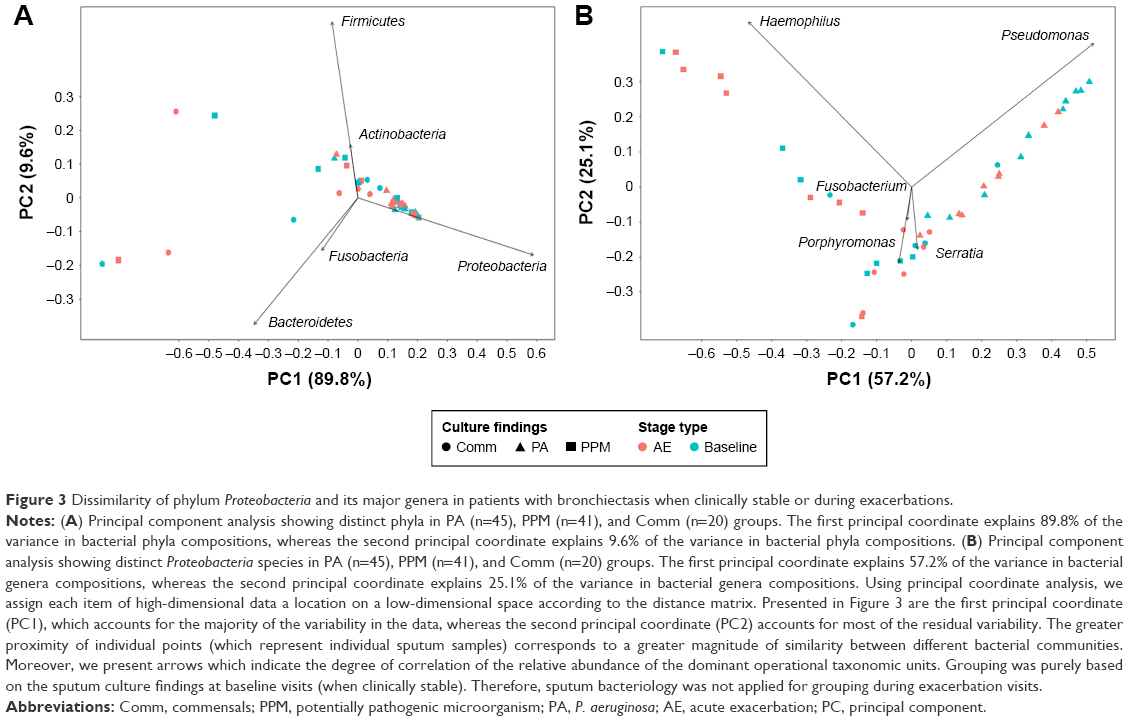 | Figure 3 Dissimilarity of phylum Proteobacteria and its major genera in patients with bronchiectasis when clinically stable or during exacerbations. |
In light of Proteobacteria predominance, we interrogated whether there would be greater changes in its relative abundance and bacterial diversity during bronchiectatic exacerbations and convalescence. Three patients (30.0%) in the PA group had converted from P. aeruginosa at baseline to miscellaneous bacteria during exacerbations. However, their data were still included in the PA group. Compared with the baseline, there were no significant differences in the total copies of Proteobacteria (Figure S6A–C), Shannon–Wiener Diversity Index (Figure S6D–F), Simpson Diversity Index (Figure S7A–C), or richness during exacerbations and convalescence (Figure S8A–C, all P>0.05). Stratification by baseline culture findings did not reveal differential changes during exacerbations and convalescence (Figures S6–S8).
Finally, we compared the pairwise Bray–Curtis distances for 22 sputa samples (exacerbation cohort) using a non-metric multidimensional scaling model. There were considerable overlaps in the dots representing different visits for individuals in PA group (Figure 4A), particularly the pairs for baseline and exacerbation visits. However, greater separations were observed in the PPM (Figure 4B) and Comm groups (Figure 4C), particularly when focusing on baseline and exacerbation visits.
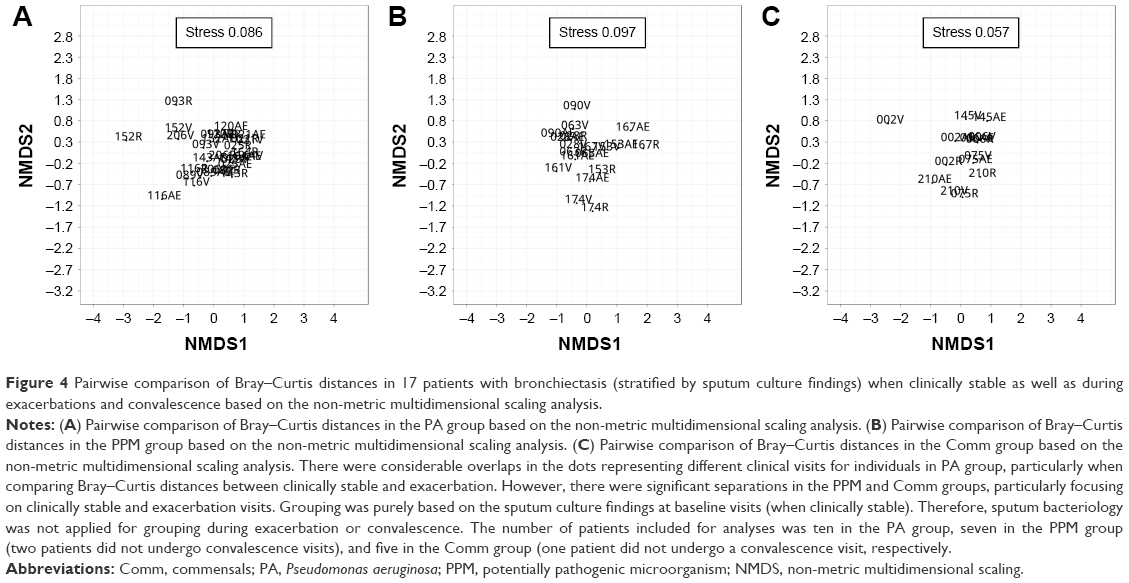 | Figure 4 Pairwise comparison of Bray–Curtis distances in 17 patients with bronchiectasis (stratified by sputum culture findings) when clinically stable as well as during exacerbations and convalescence based on the non-metric multidimensional scaling analysis. |
Discussion
Our study revealed a differential relative abundance and diversity of Proteobacteria (particularly Pseudomonas) stratified by culture findings in bronchiectasis. The PA group distinguished considerably from other groups with regard to Proteobacteria compositions, which varied less significantly during exacerbations and convalescence compared with baseline.
A key question was whether airway Proteobacteria compositions differed considerably when stratified by culture findings. Our study has extended previous reports which confirmed the predominance of Proteobacteria in bronchiectasis regardless of culture findings.17–19,21,26,27
Pseudomonas solely predominated in the PA group, albeit being detectable in other groups. The outgrowth of Pseudomonas was associated with greater relative abundance of Proteobacteria. These help to interpret the greater concordance between sequencing and culture findings for Pseudomonas. According to the pathogen competition theory,28 the predominance of Pseudomonas and other PPMs (eg, Haemophilus) is mutually exclusive. Greater abundance of Pseudomonas, which is frequently accompanied by reduced bacterial diversity, renders an outgrowth of Pseudomonas spp. that can be more readily identified with sputum culture. Nonetheless, Haemophilus reportedly dominated in the phylum Proteobacteria,17–19,22,27 which was not invariably observed herein. Differences in smoking status,21,26,27 concomitant use of medications (particularly inhaled corticosteroids), and disease severity might contribute to the disparity.21,27 For instance, patients regularly on macrolide therapy might demonstrate a predominance of Pseudomonas, but not Haemophilus.27
In the Comm group, we unexpectedly observed a predominance of Enterobacteriaceae (eg, Serratia spp.), the relative abundance of which was comparable with that of healthy subjects. Most genera of Enterobacteriaceae are facultative anaerobes that cannot be readily identified with aerobic culture. In fact, Enterobacteriaceae was reportedly more prevalent in bronchiectasis patients with new-onset community-acquired pneumonia or recurrent infection.25,29 Our data suggested that outgrowth of Pseudomonas counteracted the growth of Haemophilus and Enterobacteriaceae.
We noted comparable Proteobacteria community compositions and Shannon–Wiener Diversity Index between the Comm group and healthy subjects. The magnitude of differences in Proteobacteria community compositions in the PPM group was greater when compared with the PA group. This might be related to the lower relative abundance of Proteobacteria and higher relative abundance of other phyla (eg, Firmicutes, Bacteroidetes), respectively. Acquisition of Proteobacteria might have imposed immense pressures of growth (eg, virulence factors) on the less pathogenic bacteria, including Veillonella, Porphyromonas, and Prevotella.17,18 Patients with bronchiectasis with isolated normal flora (commensals) demonstrated minor airway inflammation,11 indirectly lending support to the aggravated inflammatory responses associated with airway dysbiosis – particularly, acquisition of P. aeruginosa.
No significant correlation was found between the relative abundance of Proteobacteria (including Pseudomonas spp.) and the key clinical parameters reflecting the disease severity except for bacterial richness, which partially echoed a recent study’s findings.26 From the data available, bacterial richness – but not relative abundance – preferentially reflected the severity of bronchiectasis.
The PA group demonstrated greater resistance to the changes at exacerbations and convalescence, compared with the PPM and Comm groups. This finding mirrored that reported in Tunney et al’s study,18 which included patients who had predominantly Pseudomonas isolation. Similarly, no substantial changes were observed in community compositions in patients with isolation of P. aeruginosa following long-term erythromycin treatment.27 Therefore, community compositions might be more persistently disrupted following Pseudomonas acquisition. Unlike less (Veillonella, Prevotella)17,18 or more pathogenic genera (Haemophilus),18,19,21 the extensive resistance and biofilm formation of P. aeruginosa has rendered its eradication difficult despite exhaustive antibiotic therapy.30 Our findings offer further evidence with regard to the differences in community compositions in PA group.
Despite a similar rate of colonization of P. aeruginosa, a previous study reported non-significant differences in sputum microbial compositions between the PA-colonized and non-PA-colonized groups in patients with COPD,31 which was in contrast to our main findings. Note that the percentage of patients regularly receiving inhaled corticosteroids and other inhaled bronchodilators was significantly greater among patients with severe COPD. Moreover, most patients in our study had moderate bronchiectasis, whereas Millares et al mainly recruited patients with severe COPD. Finally, the pathophysiology of bronchiectasis differs from that of COPD. These collectively indicated that the different sputum microbial compositions between bronchiectasis and COPD may have been affected by concomitant medications, disease severity, and underlying pathophysiology, or all of these factors. Nonetheless, no major difference in sputum microbial compositions was observed during exacerbations as compared with steady-state in both bronchiectasis and severe COPD, suggesting that sputum microbial compositions might not be the sole culprit responsible for exaggerated inflammatory responses and worsening of symptoms.
Apart from previous studies,17–19,21,26,27 we have focused on Proteobacteria compositions in bronchiectasis. Airway dysbiosis, measured with high-throughput sequencing which currently costs more than culture techniques, called for novel interventions (eg, probiotics) to restore the ecological balance. The resistance of Proteobacteria community composition after antibiotic therapy in the PA group highlighted an integration of novel interventions aside from antibiotics. The concordance between culture and sequencing findings in the PA group has justified our estimation of Proteobacteria compositions according to Pseudomonas predominance. A sequencing-based antibiotic selection strategy might be preferable because of its greater ability in identifying the expansion of pathogenic Proteobacteria genera.
Some caveats deserve comments. Potential salivary contamination cannot be completely avoided. There have been notable differences in sputum microbial compositions sampled with hypertonic saline induction and spontaneous cough.32 Nonetheless, sputum sampling via spontaneous coughing would be preferred by most bronchiectasis patients, and sputum expectoration avoided an invasive approach (eg, bronchoscopy), rendering our findings clinically applicable. Sputum induction for healthy subjects, although valid for sputum collection, created a bias toward comparison of microbial compositions for spontaneous sputum. We sampled sputa once when clinically stable; however, repeat analysis suggested minimal variation in the relative abundance at phyla levels (Table S9). A plethora of microorganisms may have collectively shaped the airway niche; therefore, we failed to address the interactions between bacteria and viruses/fungi. The demographic characteristics and lung function differed considerably between healthy subjects and patients with bronchiectasis, which might have partially confounded our comparisons on sputum microbial compositions. The limited sample size for both exacerbation and convalescence cohorts could have accounted for the limited changes in sputum microbial compositions during bronchiectatic exacerbations and convalescence as compared with baseline levels. However, similar findings have been demonstrated in another cohort of patients with bronchiectasis, suggesting that changes in microbial compositions might have limited contribution in the exaggerated inflammatory responses.18 The current study design cannot fully address whether the expansion of Fusobacteria and Porphyromonas in the Comm group was responsible for the decline in the relative abundance of Serratia. Further investigations are warranted to determine whether changes in anaerobe compositions may indicate predisposition to the disease state. Finally, analysis on exacerbation and convalescence was biased by the antibiotics administered and symptoms which led to the heterogeneity of exacerbations.
Limitations
There remain some unanswered questions related to the sputum microbial compositions in patients with bronchiectasis. For instance, it is likely that an initial dysbiosis of commensal anaerobes could result in an increased likelihood of subsequent infection. In addition, it is unclear whether a broader killing of commensal microbiota by Serratia upon treatment would lead to a greater ability of opportunistic pathogens to invade and finally colonize bronchiectatic airways, which needs to be addressed in future investigations. We only sampled sputa at a single time point among most patients (when clinically stable); however, repeat analysis suggested minimal variation in relative abundance at phyla levels (Table S9).
Conclusion
In summary, the significant alterations of Proteobacteria compositions indicate disrupted airway dysbiosis, calling for integrated management for normalizing microbial compositions in bronchiectasis.
Acknowledgments
The authors would like to thank Xiu-juan Tang, Mei Zheng, Qian Li, Zhi-qiang Huang, Fei-long He, Xiao-yong Shen, Chao Wen, Zhi-wen Chen, and Prof Bi-liang Zhang (Guangzhou Ribobio Co. Ltd., Guangzhou, People’s Republic of China) for their technical assistance and advice. None of the funding sources had any role in the study.
Author contributions
All authors contributed toward data analysis, drafting and revising the paper and agree to be accountable for all aspects of the work.
Disclosure
Dr Guan declared that he has received National Natural Science Foundation No. 81400010, Pearl River S&T Nova Program of Guangzhou No. 201710010097 and Guangdong Province Universities and Colleges Pearl River Scholar Funded Scheme 2017. Dr Gao declared that he has received National Natural Science Foundation No. 81500006. Profs Zhong and RC Chen declared that they had received Changjiang Scholars and Innovative Research Team in University ITR0961, The National Key Technology R&D Program of the 12th National Five-year Development Plan 2012BAI05B01 and National Key Scientific & Technology Support Program: Collaborative innovation of Clinical Research for chronic obstructive pulmonary disease and lung cancer No. 2013BAI09B09. The other authors report no conflicts of interest in this work.
References
Barker AF. Bronchiectasis. N Engl J Med. 2002;346(18):1383–1393. | ||
Pasteur MC, Helliwell SM, Houghton SJ, et al. An investigation into causative factors in patients with bronchiectasis. Am J Respir Crit Care Med. 2000;162(4 Pt 1):1277–1284. | ||
Pasteur MC, Bilton D, Hill AT; British Thoracic Society Bronchiectasis non-CF Guideline Group. British Thoracic Society guideline for non-CF bronchiectasis. Thorax. 2010;65 Suppl 1:i1–i58. | ||
Sadikot RT, Blackwell TS, Christman JW, Prince AS. Pathogen-host interactions in Pseudomonas aeruginosa pneumonia. Am J Respir Crit Care Med. 2005;171(11):1209–1223. | ||
King PT, Hutchinson PE, Johnson PD, Holmes PW, Freezer NJ, Holdsworth SR. Adaptive immunity to nontypeable Haemophilus influenzae. Am J Respir Crit Care Med. 2003;167(4):587–592. | ||
Horvath I, Loukides S, Wodehouse T, Kharitonov SA, Cole PJ, Barnes PJ. Increased levels of exhaled carbon monoxide in bronchiectasis: a new marker of oxidative stress. Thorax. 1998;53(10):867–870. | ||
Zheng L, Lam WK, Tipoe GL, et al. Overexpression of matrix metalloproteinase-8 and -9 in bronchiectatic airways in vivo. Eur Respir J. 2002;20(1):170–176. | ||
Cole PJ. Inflammation: a two-edged sword – the model of bronchiectasis. Eur J Respir Dis Suppl. 1986;147:6–15. | ||
Tunney MM, Field TR, Moriarty TF, et al. Detection of anaerobic bacteria in high numbers in sputum from patients with cystic fibrosis. Am J Respir Crit Care Med. 2008;177(9):995–1001. | ||
Rogers GB, Carroll MP, Serisier DJ, et al. Use of 16S rRNA gene profiling by terminal restriction fragment length polymorphism analysis to compare bacterial communities in sputum and mouthwash samples from patients with cystic fibrosis. J Clin Microbiol. 2006;44(7):2601–2604. | ||
Guan WJ, Gao YH, Xu G, et al. Sputum bacteriology in steady-state bronchiectasis in Guangzhou, China. Int J Tuberc Lung Dis. 2015;19(5):610–619. | ||
Marri PR, Stern DA, Wright AL, Billheimer D, Martinez FD. Asthma-associated differences in microbial composition of induced sputum. J Allergy Clin Immunol. 2013;131(2):346–352.e1–e3. | ||
Goleva E, Jackson LP, Harris JK, et al. The effects of airway microbiome on corticosteroid responsiveness in asthma. Am J Respir Crit Care Med. 2013;188(10):1193–1201. | ||
Carmody LA, Zhao J, Schloss PD, et al. Changes in cystic fibrosis airway microbiota at pulmonary exacerbation. Ann Am Thorac Soc. 2013;10(3):179–187. | ||
Zemanick ET, Harris JK, Wagner BD, et al. Inflammation and airway microbiota during cystic fibrosis pulmonary exacerbations. PLoS One. 2013;8(4):e62917. | ||
Han MK, Zhou Y, Murray S, et al; COMET Investigators. Lung microbiome and disease progression in idiopathic pulmonary fibrosis: an analysis of the COMET study. Lancet Respir Med. 2014;2(7):548–556. | ||
Rogers GB, van der Gast CJ, Cuthbertson L, et al. Clinical measures of disease in adults non-CF bronchiectasis correlate with airway microbiota composition. Thorax. 2013;68(8):731–737. | ||
Tunney MM, Einarsson GG, Wei L, et al. Lung microbiota and bacterial abundance in patients with bronchiectasis when clinically stable and during exacerbation. Am J Respir Crit Care Med. 2013;187(10):1118–1126. | ||
Purcell P, Jary H, Perry A, et al. Polymicrobial airway bacterial communities in adult bronchiectasis patients. BMC Microbiol. 2014;14:130. | ||
Taylor SL, Rogers GB, Chen AC, Burr LD, McGuckin MA, Serisier DJ. Matrix metalloproteinases vary with airway microbiota composition and lung function in non-cystic fibrosis bronchiectasis. Ann Am Thorac Soc. 2015;12(5):701–707. | ||
Rogers GB, Zain NM, Bruce KD, et al. A novel microbiota stratification system predicts future exacerbations in bronchiectasis. Ann Am Thorac Soc. 2014;11(4):496–503. | ||
Guan WJ, Gao YH, Xu G, et al. Aetiology of bronchiectasis in Guangzhou, southern China. Respirology. 2015;20(5):739–748. | ||
Gao YH, Guan WJ, Xu G, et al. The role of viral infection in pulmonary exacerbations of bronchiectasis in adults: a prospective study. Chest. 2015;147(6):16351643. | ||
Tsang KW, Ho PL, Lam WK, et al. Inhaled fluticasone reduces sputum inflammatory indices in severe bronchiectasis. Am J Respir Crit Care Med. 1998;158(3):723–727. | ||
Wang JY, Hsueh PR, Wang JT, Lee LN, Yang PC, Luh KT. Recurrent infections and chronic colonization by an Escherichia coli clone in the respiratory tract of a patient with severe cystic bronchiectasis. J Clin Microbiol. 2000;38(7):2766–2767. | ||
Cox MJ, Turek EM, Hennessy C, et al. Longitudinal assessment of sputum microbiome by sequencing of the 16S rRNA gene in non-cystic fibrosis bronchiectasis patients. PLoS One. 2017;12(2):e0170622. | ||
Rogers GB, Bruce KD, Martin ML, Burr LD, Serisier DJ. The effect of long-term macrolide treatment on respiratory microbiota composition in non-cystic fibrosis bronchiectasis: an analysis from the randomized, double-blind, placebo-controlled BLESS trial. Lancet Respir Med. 2014;2(12):988–996. | ||
Rogers GB, van der Gast CJ, Serisier DJ. Predominant pathogen competition and core microbiota divergence in chronic airway infection. ISME J. 2015;9(1):217–225. | ||
Polverino E, Cilloniz C, Menendez R, et al. Microbiology and outcomes of community acquired pneumonia in non cystic-fibrosis bronchiectasis patients. J Infect. 2015;71(1):28–36. | ||
Wilson R, Aksamit T, Aliberti S, et al. Challenges in managing Pseudomonas aeruginosa in non-cystic fibrosis bronchiectasis. Respir Med. 2016;117:179–189. | ||
Millares L, Ferrari R, Gallego M, et al. Bronchial microbiome of severe COPD patients colonised by Pseudomonas aeruginosa. Eur J Clin Microbiol Infect Dis. 2014;33(7):1101–1111. | ||
Tangedal S, Aanerud M, Grønseth R, et al. Comparing microbiota profiles in induced and spontaneous sputum samples in COPD patients. Respir Res. 2017;18(1):164. |
 © 2018 The Author(s). This work is published and licensed by Dove Medical Press Limited. The
full terms of this license are available at https://www.dovepress.com/terms
and incorporate the Creative Commons Attribution
- Non Commercial (unported, 3.0) License.
By accessing the work you hereby accept the Terms. Non-commercial uses of the work are permitted
without any further permission from Dove Medical Press Limited, provided the work is properly
attributed. For permission for commercial use of this work, please see paragraphs 4.2 and 5 of our Terms.
© 2018 The Author(s). This work is published and licensed by Dove Medical Press Limited. The
full terms of this license are available at https://www.dovepress.com/terms
and incorporate the Creative Commons Attribution
- Non Commercial (unported, 3.0) License.
By accessing the work you hereby accept the Terms. Non-commercial uses of the work are permitted
without any further permission from Dove Medical Press Limited, provided the work is properly
attributed. For permission for commercial use of this work, please see paragraphs 4.2 and 5 of our Terms.