")
Back to Journals » Neuropsychiatric Disease and Treatment » Volume 18
Alterations of Regional Homogeneity in Parkinson’s Disease with Rapid Eye Movement Sleep Behavior Disorder
Authors Jiang X, Pan Y, Zhu S, Wang Y , Gu R, Jiang Y , Shen B, Zhu J, Xu S , Yan J, Dong J , Zhang W , Xiao C, Zhang L
Received 17 August 2022
Accepted for publication 6 December 2022
Published 19 December 2022 Volume 2022:18 Pages 2967—2978
DOI https://doi.org/10.2147/NDT.S384752
Checked for plagiarism Yes
Review by Single anonymous peer review
Peer reviewer comments 4
Editor who approved publication: Dr Yuping Ning
Xu Jiang,1,* Yang Pan,1,* Sha Zhu,1 Yaxi Wang,1 Ruxin Gu,1 Yinyin Jiang,1 Bo Shen,1 Jun Zhu,1 Shulan Xu,1 Jun Yan,1 Jingde Dong,1 Wenbin Zhang,2 Chaoyong Xiao,3 Li Zhang1
1Department of Geriatrics, Nanjing Brain Hospital Affiliated to Nanjing Medical University, Nanjing, People’s Republic of China; 2Department of Neurosurgery, Nanjing Brain Hospital Affiliated to Nanjing Medical University, Nanjing, People’s Republic of China; 3Department of Radiology, Nanjing Brain Hospital Affiliated to Nanjing Medical University, Nanjing, People’s Republic of China
*These authors contributed equally to this work
Correspondence: Li Zhang, Department of Geriatrics, Nanjing Brain Hospital Affiliated to Nanjing Medical University, Nanjing, People’s Republic of China, Email [email protected]
Objective: Patients with rapid eye movement (REM) sleep behavior disorder (RBD) in Parkinson’s disease (PD-RBD) tend to have poor cognitive performance and faster cognitive deterioration, and the potential mechanism is still ambiguous. Therefore, this study aimed to detect the alterations in local brain function in PD-RBD.
Methods: Fifty patients, including 23 patients with PD-RBD and 27 patients with PD without RBD (PD-nRBD), and 26 healthy controls were enrolled. All subjects were subjected to one-night polysomnography and underwent resting-state functional magnetic resonance imaging (rs-fMRI). The fMRI images of the three groups were analyzed by regional homogeneity (ReHo) to observe the local neural activity. Correlations between altered ReHo values and chin electromyographic (EMG) density scores and cognitive scores in the PD subgroups were assessed.
Results: Compared with the patients with PD-nRBD, the patients with PD-RBD had higher ReHo values in the frontal cortex (the right superior frontal gyrus, the right middle frontal gyrus and the left medial superior frontal gyrus), the right caudate nucleus and the right anterior cingulate gyrus, and compared with the HCs, the patients with PD-RBD had lower ReHo values in the bilateral cuneus, the bilateral precuneus, the left inferior temporal gyrus and the left inferior occipital gyrus. For the patients with PD-RBD, the phasic chin EMG density scores were positively correlated with the ReHo values in the left medial superior frontal gyrus, and the tonic chin EMG density scores were positively correlated with the ReHo values in the right anterior cingulate gyrus.
Conclusion: This study indicates that increased ReHo in the frontal cortex, the caudate nucleus and the anterior cingulate gyrus may be linked with the abnormal motor behaviors during REM sleep and that decreased ReHo in the posterior regions may be related to the visuospatial–executive function in patients with PD-RBD.
Keywords: Parkinson’s disease, rapid eye movement sleep behavior disorder, resting-state fMRI, regional homogeneity
Introduction
Rapid eye movement (REM) sleep behavior disorder (RBD) is a parasomnia characterised by abnormal behaviors during REM sleep, such as talking, laughing, kicking and leaping from bed, and allowing the loss of normal skeletal muscle atonia (also known as REM sleep without atonia, or RSWA, considering the increased electromyographic (EMG) activity) which is classified as tonic RSWA or phasic RSWA.1,2 The incidence of RBD in Parkinson’s disease (PD-RBD) is up to 35–60%,3 and it has been increasing over time.4 It has been reported that RBD is the predictor of the diffuse/malignant PD phenotype for whom the progression rate of PD may be the most rapid.5 Moreover, the patients with PD-RBD tend to have poor cognitive performance and faster cognitive deterioration, eg, declines in visuospatial–executive function.6,7 One study found that decreased functional connectivity in the posterior regions may be related to the visuospatial–executive function.8 However, the relevant research on the visuospatial–executive function in patients with PD-RBD using the resting-state functional magnetic resonance imaging (rs-fMRI) method is still scarce.
During normal REM sleep, the excitatory projection from the subcoeruleus/prelocus coeruleus complex activates the inhibitory ventromedial medulla and the nucleus of the spinal cord, which results in the hyperpolarization of the spinal cord and prevents the REM muscle tone.9,10 During RBD, the deterioration of the circuit of the subcoeruleus/prelocus coeruleus complex–ventromedial medulla–spinal motor neuron may lead to the loss of muscle atonia, allowing abnormal behaviors to occur during the REM sleep phase.9,10 With further research, other studies have reported that dysfunction of the neocortex and limbic system may be related to the abnormal behaviors in patients with PD-RBD.11,12 In terms of the origin of aberrant motor behaviors in RBD, there are two different hypotheses: the cortical hypothesis and the brainstem hypothesis.9 During normal REM sleep, the ventromedial medulla inhibits the spinal cord, preventing the motor cortex from producing movement. The former hypothesis proposed that the motor cortex can produce abnormal movements considering the impaired ventromedial medulla in RBD. Likewise, ventromedial medulla also can inhibit the spinal cord, which prevents the red nucleus from producing movement during normal REM sleep. The latter hypothesis proposed that the red nucleus can produce aberrant movements considering the impaired ventromedial medulla in RBD. In addition, in terms of the neocortex and limbic system, the specific mechanism of RBD in PD detected by fMRI methods remains controversial yet. A few studies have investigated PD-RBD-related functional abnormalities, with one study finding decreased brain activity in the primary motor cortex and premotor cortex using the amplitude of low-frequency fluctuations, which were associated with the motor behaviors during the REM sleep.13 Other studies showed the increased centrality role of the frontal-temporal regions and limbic system, which were also related to the motor behaviors.12,14 The literature on rs-fMRI in PD with RBD is still scarce, and there is no evidence of a clear pattern of functional abnormalities in this clinical PD subtype.
Resting-state functional magnetic resonance imaging can reflect constant brain activity based on blood oxygen level-dependent fluctuations in low frequencies15 and has been applied to the diagnosis and research of PD.16,17 Regional homogeneity (ReHo), as a commonly used method of fMRI, can measure the resemblance of a given voxel to its nearest neighbours in terms of the time series in a voxelwise method and represent changes in the local brain region synchronously at the whole-brain level.18 A region with an increased ReHo can suggest a topical functional unit. Instead, it may indicate local aberrant neural activities, which means a state of desynchronized function.19 ReHo has been frequently used to explore the abnormalities in brain activities20,21 and has even been used as a suitable noninvasive imaging marker for PD.22,23 Thus, we used the ReHo method to study the brain neural activity among the patients with PD-RBD, PD without RBD (PD-nRBD) and healthy controls (HCs) to further elucidate the neural substrates of REM sleep motor activity. We also correlated functional activity with the tonic and phasic REM sleep motor activity (or RSWA) and cognitive function in PD-RBD.
Materials and Methods
Participants
A total of 23 PD-RBD patients (5 females and 18 males) and 27 PD-nRBD patients (9 females and 18 males), aging from 50 to 75 years, were recruited from Nanjing Brain Hospital Affiliated to Nanjing Medical University and diagnosed with PD in accordance with the UK Parkinson’s Disease Brain Bank criteria24 from July 2015 to December 2018. At the same time, 26 HCs (12 females and 14 males) matched to the PDs in terms of age, sex and education were recruited. Participants who had parkinsonism, dementia, psychiatric disorders according to DSM-5 criteria,25 obstructive sleep apnoea syndrome, epilepsy, claustrophobia and artifacts were excluded. All participants were right-handed. Prior to the fMRI scan, all participants underwent comprehensive examinations during the off-state for 12–15 h. The approval of the Medical Ethics Committee of Nanjing Brain Hospital Affiliated to Nanjing Medical University was obtained (2015-KY015). All subjects recruited into this study provided written informed consent.
Demographic and clinical data, including age, education, sex, disease duration and clinical symptoms, were registered on the same day. Levodopa equivalent daily dose (LEDD) was calculated according to the previous research.26 The Unified PD Rating Scale-III (UPDRS-III) and H&Y stage were used to assess the motor symptoms and disease severity of patients with PD.27,28 The Montreal Cognitive Assessment (MoCA), MoCA domain and Hamilton Depression Rating Scale (HAMD) were applied to evaluate the cognitive function and psychological symptoms.29,30
The demographic and clinical data of the participants are shown in Table 1. A total of 76 subjects were included in this study, and no one was excluded. No significant differences in age (p = 0.12), education (p = 0.36), sex (p = 0.20), MoCA-naming (p = 0.57), MoCA-attention (p = 0.86), MoCA-language (p = 0.49), MoCA-abstraction (p = 0.15), MoCA-delayed memory (p = 0.09), MoCA-orientation (p = 0.47) and HAMD (p = 0.76) were found among the three groups. In addition, no significant differences in disease duration (p = 0.30), UPDRS-III (p = 0.68), H&Y stage (p = 0.93) and LEDD (p = 0.47) were found between the PD-RBD and PD-nRBD groups. Compared with the HCs, patients with PD-RBD showed relatively low MoCA-visuospatial skills/executive scores (p < 0.05).
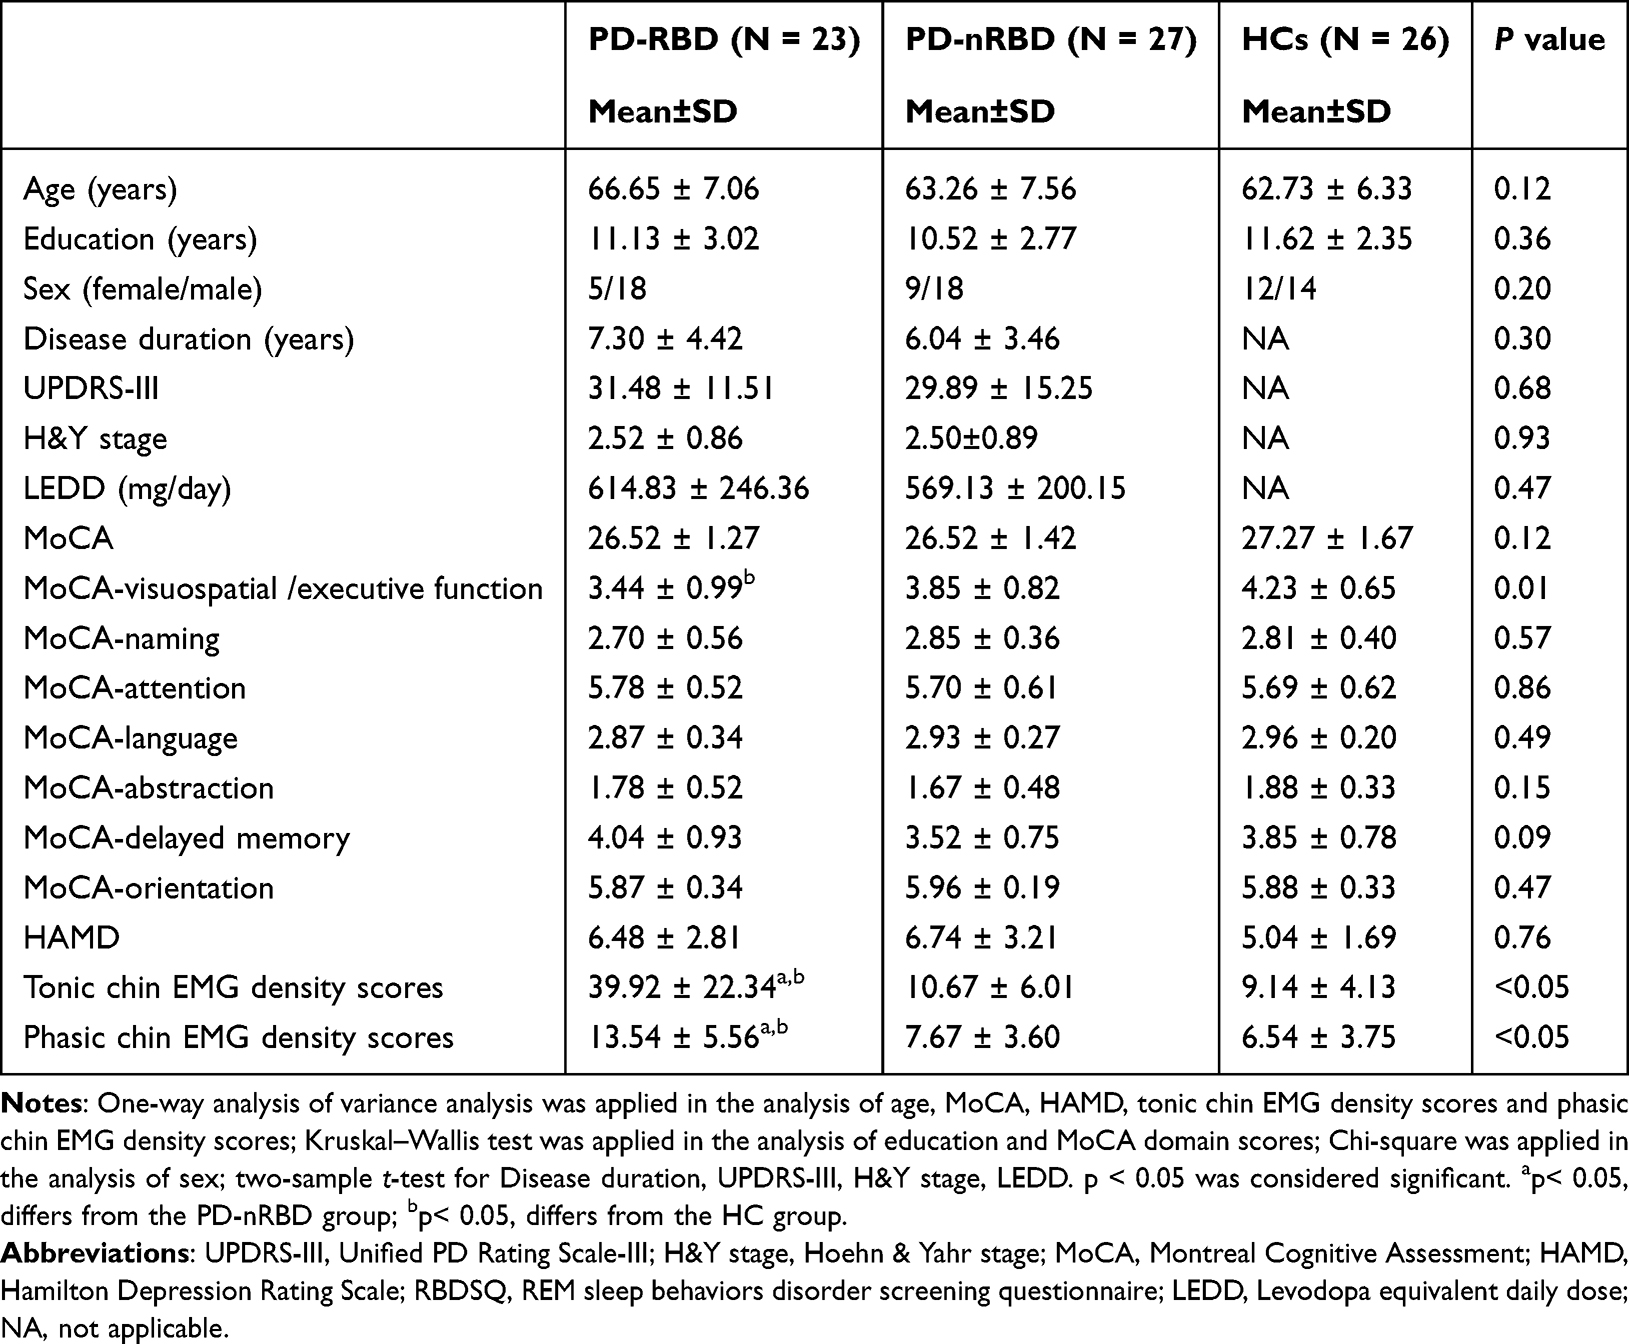 |
Table 1 Demographic and Clinical Characteristics of All Subjects |
Polysomnography (PSG)
The diagnosis of RBD was based on the American Academy of Sleep Medication criterion.1 All subjects underwent one-night PSG. Subjects who had repeated episodes of behavior or vocalization that were confirmed by PSG to arise during REM and had no atonia during REM sleep on the PSG were considered as PD-RBD; the others were classified as PD-nRBD or HCs.
The PSG equipment consisted of six standard electrode derivations (C3-A2, C4-A1, O1-A2, O2-A1, F3-A2, and F4-A1) in order to monitor EEG activity, chin EMG, left and right electrooculograms, electrocardiograms, left and right limb electromyograms, oral and nasal airflow, thoracic and abdominal movements, body position and pulse oximetry. The sleep stage and chin EMG activity (tonic chin EMG activity and phasic chin EMG activity) were classified and quantified according to Montplaisir et al.31 Aberrant muscle activity in the REM sleep stage was identified when the tonic chin EMG activity exceeded 30% of the total REM sleep time or the phasic chin EMG activity exceeded 15% of the total REM sleep time.31 Compared with the HCs, patients with PD-RBD showed relatively low tonic chin EMG density scores (p < 0.05) and phasic chin EMG density scores (p < 0.05). At the same time, compared with the patients with PD-RBD, patients with PD-nRBD exhibited relatively high tonic chin EMG density scores (p < 0.05) and phasic chin EMG density scores (p < 0.05) (Table 1).
Functional Magnetic Resonance Imaging Data Acquisition
Magnetic resonance imaging examinations were carried out on a 3.0 T MRI scanner (Siemens, Verio, Germany) equipped with 8-channel phased-array head coils during the off stage to decrease the medication’s influence on the images,32 with the anti-PD medications discontinued for at least 12 h.33 Subjects were instructed to lie flat, close their eyes, remain awake in the process of scanning. To restrict head movement, sponge pads were placed on all subjects. T1 images were acquired using the 3D magnetisation-prepared rapid gradient-echo (3D-MPRAGE) sequence with the following parameters: repetition time (TR) = 1900 ms, echo time (TE) = 2.48 ms, flip angle (FA) = 9°, matrix size = 256 × 256, field of view (FoV) = 250 mm × 250 mm, slice number = 176, slice thickness = 1 mm, and slice gap = 0 mm. The total scan time was 4 min 18s. Functional images were obtained using an echo-planar imaging (EPI) sequence (TR = 2000 ms, TE = 25 ms, FA = 90, matrix size = 64 × 64, FOV = 240 mm × 240 mm, slice number = 33, slice thickness = 4 mm, and slice gap = 0 mm). The total scan time was 8 min 6 s.
Data Preprocessing
Data preprocessing was performed by the Data Processing Assistant for Resting-State fMRI (DPARSF, http://www.restfmri.net/forum/DPARSF), which is based on the Resting-State fMRI Data Analysis Toolkit (REST V1.8; http://www.restfmri.net) and Statistical Parametric Mapping software (SPM8; http://www.fil.ion.ucl.ac.uk/spm). The first 10 volumes of the functional data for each subject were removed. The remaining 230 volumes were processed with the following steps: slice timing, head-motion correction, T1 segmentation using the diffeomorphic anatomical registration through exponentiated lie algebra algorithm, spatial normalization into the Montreal Neurological Institute (MNI) space using the echo-planar imaging template and resampling to 3 × 3 × 3 mm3, removing linear drift, detrend and bandpass filtering (0.01–0.08 HZ). No participants were dropped out due to head motion of more than 2.5 mm of translation or 2.5̊ of rotation from our study. Individual mean framewise displacement (FD), median FD, and maximum FD were determined using a prior study,34 taking into account motion-related variances among the subjects. There were no significant differences in mean FD, median FD, or max FD across the groups (Figure 1). At the same time, the T1 images were coregistered and segmented using a linear transformation in a unified model. Then, the grey matter (GM) volume was affine-transformed into MNI space with modulation to obtain the actual GM values.
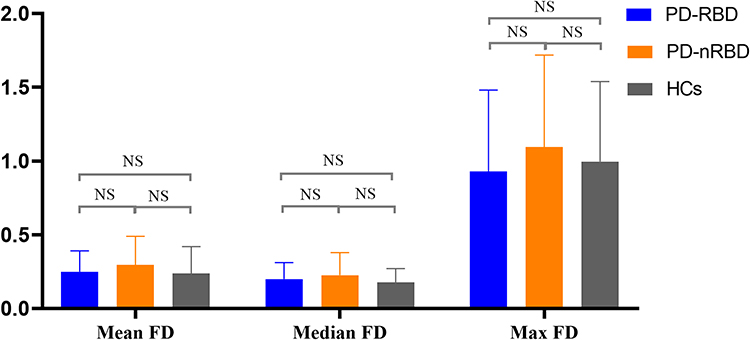 |
Figure 1 The comparison of framewise displacement between the groups. Abbreviation: NS, no significance. |
Regional Homogeneity
For the time series of each given voxel and those of its nearest neighbours (26 voxels), the Kendall coefficient of concordance (KCC) was calculated in a voxelwise method. Then, the KCC of each voxel was divided into the average KCC of the whole brain for standardisation. Finally, the ReHo maps were smoothed by the Gaussian filter of 4 mm of full width at half maximum.
Statistical Analysis
For normally distributed data, the one-way analysis of variance (ANOVA) and two-sample t-test were used. For non-normally distributed data, the Kruskal–Wallis test was applied. For qualitative data, the chi-squared test was used. ANOVA analysis was applied for the analysis of age, MoCA, HAMD, tonic chin EMG density scores and phasic chin EMG density scores; The Kruskal–Wallis test was applied in the analysis of education and MoCA domain scores; the Chi-square test was used for the analysis of sex; the two-sample t-test was used for disease duration, UPDRS-III and LEDD. All of the data were compared using SPSS 23.0 statistical analysis software (SPSS Inc. Chicago, IL). The significance level was set to p < 0.05.
Analysis of covariance (ANCOVA) was used to analyse the difference in ReHo values among the three groups, with age, sex, education and GM volume as covariates considering their confounding effect.35–38 The significance threshold was set to voxel-level p < 0.005 (corresponding to cluster-level p < 0.01, as determined by AlphaSim correction). Then, we extracted the brain areas with significant differences as the mask. The two-sample post hoc t-test was performed to create ReHo maps within the mask between each pair of the three groups (PD-RBD vs PD-nRBD, PD-RBD vs HCs and PD-nRBD vs HCs). The statistical threshold for the ReHo maps was set to voxel-level p < 0.005 (corresponding to cluster-level p < 0.01, as determined by AlphaSim correction). Regions with substantial ReHo differences between PD-RBD and PD-nRBD patients were designated as regions of interest, and mean ReHo values from the regions of interest were retrieved. Then, correlation studies were performed to determine the link between ReHo values and clinical indices in all PD patients (PD-RBD and PD-nRBD). Pearson’s correlation was used for normally distributed data; Spearman correlation was used for nonnormally distributed data. Correlations between the ReHo signals from the brains showing significant differences and the MoCA, tonic chin EMG activity and phasic chin EMG activity were evaluated using Pearson’s correlation, and the ReHo values and the MoCA domain scores were evaluated using Spearman correlation with a threshold of p < 0.05.
Results
Regional Homogeneity
The results of ANCOVA showed significant differences in ReHo values among the patients with PD-RBD, PD-nRBD and HCs. Then, we performed two-sample post-hoc t-test to detect significant differences between each pair of the three groups (Table 2). Compared with the PD-nRBD group, the PD-RBD group had higher ReHo values in the right superior frontal gyrus, the right middle frontal gyrus, the left medial superior frontal gyrus, the right caudate nucleus and the right anterior cingulate gyrus (Figure 2). In addition, the PD-RBD group showed higher ReHo values in the right superior frontal gyrus, the right middle frontal gyrus, the left superior frontal gyrus, the right inferior frontal gyrus (triangular part), the right putamen, the right thalamus and the anterior cingulate gyrus but lower ReHo values in the bilateral cuneus, the bilateral precuneus, the left inferior temporal gyrus and the left inferior occipital gyrus compared with the HCs (Figure 3). Compared with the HCs (Figure 4), the PD-nRBD group demonstrated higher ReHo in the left superior frontal gyrus and the bilateral thalamus and lower ReHo in the left occipital gyrus.
 |
Table 2 ReHo Differences Among PD-RBD, PD-nRBD and NCs |
 |
Figure 2 ReHo differences between PD-RBD and PD-nRBD. The results were displayed in MNI space, the red color represents the increased ReHo, while the blue color represents the decreased ReHo. |
 |
Figure 3 ReHo differences between PD-RBD and HCs. The results were displayed in MNI space, the red color represents the increased ReHo, while the blue color represents the decreased ReHo. |
 |
Figure 4 ReHo differences between PD-nRBD and HCs. The results were displayed in MNI space, the red color represents the increased ReHo, while the blue color represents the decreased ReHo. |
Correlation Analysis
In the PD-RBD group, the results showed that the phasic chin EMG density scores positively correlated with the ReHo values in the left medial superior frontal gyrus (r = 0.44, p = 0.04) and the tonic chin EMG density scores were positively correlated with the ReHo values in the right anterior cingulate gyrus (r = 0.56, p = 0.01) (Table 3).
 |
Table 3 Behavioral Correlations with Abnormal ReHo in PD-RBD and PD-nRBD Group |
Discussion
In this study, we applied the ReHo method to compare the significant differences in neural activity among the PD-RBD patients, PD-nRBD patients and HCs. This approach may be beneficial to determine the mechanism of the RBD in patients with PD-RBD. Two important findings were discovered in this study. First, the PD-RBD group showed the increased ReHo values in the frontal cortex, the caudate nucleus and the anterior cingulate gyrus compared with the PD-nRBD group. The PD-RBD group’s phasic chin EMG density scores were positively correlated with the ReHo values in the left medial superior frontal gyrus, and their tonic chin EMG density scores were positively correlated with the ReHo values in the anterior cingulate gyrus for the patients with PD-RBD, which may be linked with the abnormal motor behaviors during REM sleep. Second, the patients with PD-RBD showed abnormal brain activity in the posterior regions compared to the HCs, such as the precuneus and occipital gyrus, which may be related to visuospatial–executive function.
RBD is thought to involve the cortical limbic system, which can control emotions, because the behaviors observed during RBD are aggressive and the recalled dreams are unpleasant and frightening.36 The cortical hypothesis proposes that activation of the limbic system can generate unpleasant dreams and excite the sensorimotor cortex and then produce the movement in RBD.9 The anterior cingulate gyrus, which plays an important role in mood regulation, can be intensely activated by the nightmares during REM sleep.39 Electric stimulation of the anterior cingulate gyrus could trigger movements similar to those commonly observed during RBD episodes,40 and one study showed that the decreased GM volume in the anterior cingulate gyrus might be linked with the mood changes in patients with the PD-RBD.41 Simultaneously, the frontal cortex is an important part of the motor cortex. A study showed that frontal theta waves are involved in the processing of emotional memories during REM sleep.42 Previous electroencephalography and MRI studies have found that the activation and thinning of the frontal cortex may be related to the generation of dream-enacting behaviors in RBD during phasic REM sleep rather than tonic REM sleep.12,38,43 These interesting findings were similar to our results that the patients with PD-RBD exhibited the activation in the frontal cortex and the cingulate gyrus, and the phasic and tonic chin EMG activity was related to the frontal cortex and anterior cingulate gyrus. This demonstrated that overactivation of the frontal cortex and the anterior cingulate gyrus may be linked with the generation of the aberrant motor behaviors during REM sleep, which may further support the cortical hypothesis.
The final mechanism of RBD, whether mediated through the cortical hypothesis or the brainstem hypothesis, is that brainstem injury cannot inhibit the motor neurons of the spinal cord, resulting in movement during REM sleep.9 The restoration of motor control during REM sleep supports a brief reestablishment of the basal ganglia loop in RBD.44 Some researchers found increased betweenness centrality of the caudate nucleus and reduced striatal dopaminergic innervation in RBD,45,46 considering that the indirect pathway of the basal ganglia network may result in the overactivity of the caudate nucleus due to loss of inhibitory nigrostriatal dopaminergic projections, which could restrain brainstem activity and produce nocturnal movements.47 Similarly, increased activity in the caudate nucleus was observed in the PD-RBD in our study, and previous studies found that the PD-RBD patients show more severe nigrostriatal dopaminergic impairment, especially at the caudate level compared with the PD-nRBD patients.48,49 Thus, we further speculate that the caudate nucleus may be involved in the mechanism of RBD by exacerbating the alterations of the brainstem network.
Furthermore, we found that the patients with PD-RBD showed changes in the posterior regions in our study, which were associated with visuospatial–executive function, suggesting that the visual and executive information integration may be related to their occurrence of cognitive impairment. The parietal-occipital cortex, as an indispensable part of the posterior region, has been extensively proven to be involved in the acquisition of visuospatial–executive information.50,51 Moreover, it has been hypothesized that the precuneus implicated in the detailed visuospatial information integration and processing by virtue of orchestrating the temporal-parietal-occipital network.52,53 Previous MRI studies have demonstrated that the functional connectivity between the superior occipital gyrus and the superior parietal gyrus, the precuneus and posterior cingulate gyrus were decreased in patients with PD-RBD, which were related to the poor visuospatial–executive function.8,54,55 These results concurred with our study, where the decreased brain activity in the posterior regions and significant differences in the score of visuospatial–executive function was exhibited in the PD-RBD group relative to the HCs, suggesting that the PD-RBD group may represent more serious neurodegeneration in terms of cognitive impairment, especially the visuospatial–executive impairment.3 In addition, Hu et al have demonstrated that visuospatial–executive function impairment might predict the progression of mild cognitive impairment,6 and a longitudinal follow-up study should be conducted.
However, some limitations of this study need to be addressed. First, the sample size of our study was relatively small, which may limit the examination of minor brain structures that correlate with REM sleep motor activity in PD-RBD. Thus, the specific neural basis of RBD in PD still needs further analysis using a larger sample size. Second, our results only represent the activation of some brain regions. The functional connectivity among the caudate nucleus, the anterior cingulate gyrus and the frontal cortex needs further exploration. At the same time, it is considerable way that we apply functional connectivity based on machine learning approaches such as support vector machine or deep learning approaches such as long short-term memory networks to the study of PD-RBD.56–58
Conclusions
In conclusion, we used the ReHo method to investigate the brain activity of PD patients with RBD. Increased ReHo in the frontal cortex, the caudate nucleus and the anterior cingulate gyrus may be linked with the abnormal motor behaviors during REM sleep, and decreased ReHo in the posterior regions may be related to declines in visuospatial–executive function in patients with PD-RBD. These findings extend our knowledge of how PD-RBD affects brain function mainly involving in the mechanism and cognition.
Data Sharing Statement
The data used to support the findings of this study are available from the corresponding author upon request.
Statement of Ethics
The study was approved by the Ethics committee of Nanjing Brain Hospital Affiliated to Nanjing Medical University. All participants signed a written informed consent before the study. All procedures followed the declaration of Helsinki.
Acknowledgments
This study was supported by National Natural Science Foundation of China (82171249, 82101332), Special Funds of the Jiangsu Provincial Key Research and Development Program (BE2019612), Jiangsu Provincial Cadre Health Projects (BJ20005), Jiangsu Provincial Elderly Health Research Project (LD2021013, LR2021018), Nanjing Rehabilitation Medicine Center Project, Nanjing Industrial and Information Development Special Fund Project, Nanjing Medical Science and Technology Development Foundation (QRX17026), Nanjing Medical University School Fund Project (NMUB20210223).
Author Contributions
All authors made a significant contribution to the work reported, whether that is in the conception, study design, execution, acquisition of data, analysis and interpretation, or in all these areas; took part in drafting, revising or critically reviewing the article; gave final approval of the version to be published; have agreed on the journal to which the article has been submitted; and agree to be accountable for all aspects of the work.
Disclosure
The authors declare that there are no conflicts of interest regarding the publication of this paper.
References
1. Sateia MJ. International classification of sleep disorders-third edition: highlights and modifications. Chest. 2014;146(5):1387–1394. doi:10.1378/chest.14-0970
2. Patriat R, Pisharady PK, Amundsen-Huffmaster S, et al. White matter microstructure in Parkinson’s disease with and without elevated rapid eye movement sleep muscle tone. Brain Commun. 2022;4(2):fcac027. doi:10.1093/braincomms/fcac027
3. Pagano G, De Micco R, Yousaf T, Wilson H, Chandra A, Politis MJN. REM behavior disorder predicts motor progression and cognitive decline in Parkinson disease. Neurology. 2018;91(10):e894–e905. doi:10.1212/WNL.0000000000006134
4. Bjørnarå K, Dietrichs E, Toft M. Longitudinal assessment of probable rapid eye movement sleep behaviour disorder in Parkinson’s disease. Eur J Neurol. 2015;22(8):1242–1244. doi:10.1111/ene.12723
5. Fereshtehnejad S, Romenets S, Anang J, Latreille V, Gagnon J, Postuma R. New clinical subtypes of Parkinson disease and their longitudinal progression: a prospective cohort comparison with other phenotypes. JAMA Neurol. 2015;72(8):863–873. doi:10.1001/jamaneurol.2015.0703
6. Liu Y, Lawton M, Lo C, et al. Longitudinal changes in Parkinson’s disease symptoms with and without rapid eye movement sleep behavior disorder: the oxford discovery cohort study. Mov Disord. 2021;36(12):2821–2832. doi:10.1002/mds.28763
7. Trout J, Christiansen T, Bulkley M, et al. Cognitive impairments and self-reported sleep in early-stage Parkinson’s disease with versus without probable REM sleep behavior disorder. Brain Sci. 2019;10(1):9.
8. Jiang X, Wu Z, Zhong M, et al. Abnormal gray matter volume and functional connectivity in Parkinson’s disease with rapid eye movement sleep behavior disorder. Parkinsons Dis. 2021;2021:8851027. doi:10.1155/2021/8851027
9. Iranzo A. The REM sleep circuit and how its impairment leads to REM sleep behavior disorder. Cell Tissue Res. 2018;373(1):245–266. doi:10.1007/s00441-018-2852-8
10. Roguski A, Rayment D, Whone AL, Jones MW, Rolinski M. A neurologist’s guide to REM sleep behavior disorder. Front Neurol. 2020;11:610. doi:10.3389/fneur.2020.00610
11. Matzaras R, Shi K, Artemiadis A, et al. Brain neuroimaging of rapid eye movement sleep behavior disorder in Parkinson’s disease: a systematic review. J Parkinsons Dis. 2022;12(1):69–83. doi:10.3233/JPD-212571
12. Li J, Zeng Q, Zhou W, et al. Altered brain functional network in Parkinson disease with rapid eye movement sleep behavior disorder. Front Neurol. 2020;11:563624. doi:10.3389/fneur.2020.563624
13. Li D, Huang P, Zang Y, et al. Abnormal baseline brain activity in Parkinson’s disease with and without REM sleep behavior disorder: a resting-state functional MRI study. JMRI. 2017;46(3):697–703. doi:10.1002/jmri.25571
14. Guo T, Guan X, Zeng Q, et al. Alterations of brain structural network in Parkinson’s disease with and without rapid eye movement sleep behavior disorder. Front Neurol. 2018;9:334. doi:10.3389/fneur.2018.00334
15. Vincent J, Patel G, Fox M, et al. Intrinsic functional architecture in the anaesthetized monkey brain. Nature. 2007;447(7140):83–86. doi:10.1038/nature05758
16. Kawabata K, Watanabe H, Bagarinao E, et al. Cerebello-basal ganglia connectivity fingerprints related to motor/cognitive performance in Parkinson’s disease. Parkinsonism Relat Disord. 2020;80:21–27. doi:10.1016/j.parkreldis.2020.09.005
17. Liu Q, Shi Z, Wang K, et al. Treatment enhances betweenness centrality of fronto-parietal network in Parkinson’s patients. Front Comput Neurosci. 2022;16:891384. doi:10.3389/fncom.2022.891384
18. Zang Y, Jiang T, Lu Y, He Y, Tian LJN. Regional homogeneity approach to fMRI data analysis. Neuro Image. 2004;22(1):394–400. doi:10.1016/j.neuroimage.2003.12.030
19. Choe I, Yeo S, Chung K, Kim S, Lim S. Decreased and increased cerebral regional homogeneity in early Parkinson’s disease. Brain Rese. 2013;1527:230–237. doi:10.1016/j.brainres.2013.06.027
20. Yue Y, Jiang Y, Shen T, Pu J, Lai HY, Zhang B. ALFF and ReHo mapping reveals different functional patterns in early- and late-onset Parkinson’s disease. Front Neurosci. 2020;14:141. doi:10.3389/fnins.2020.00141
21. Harrington DL, Shen Q, Castillo GN, et al. Aberrant intrinsic activity and connectivity in cognitively normal Parkinson’s disease. Front Aging Neurosci. 2017;9:197. doi:10.3389/fnagi.2017.00197
22. Liu Y, Li M, Chen H, et al. Alterations of regional homogeneity in Parkinson’s disease patients with freezing of gait: a resting-state fMRI study. Front Aging Neurosci. 2019;11:276. doi:10.3389/fnagi.2019.00276
23. Li J, Yuan Y, Wang M, et al. Alterations in regional homogeneity of resting-state brain activity in fatigue of Parkinson’s disease. J Neural Transm. 2017;124(10):1187–1195. doi:10.1007/s00702-017-1748-1
24. Hughes A, Daniel S, Kilford L, AJJon L. neurosurgery, psychiatry. Accuracy of clinical diagnosis of idiopathic Parkinson’s disease: a clinico-pathological study of 100 cases. J Neural Transm Neurosurg Psych. 1992;55(3):181–184. doi:10.1136/jnnp.55.3.181
25. American Psychiatric Association. Diagnostic and Statistical Manual of Mental Disorders: DSM-5. Washington, D.C.: American Psychiatric Association; 2013.
26. Tomlinson C, Stowe R, Patel S, Rick C, Gray R, Clarke CJM. Systematic review of levodopa dose equivalency reporting in Parkinson’s disease. Movement Dis. 2010;25(15):2649–2653. doi:10.1002/mds.23429
27. Goetz CG, Tilley BC, Shaftman SR, et al. Movement disorder society-sponsored revision of the unified Parkinson’s disease rating scale (MDS-UPDRS): scale presentation and clinimetric testing results. Mov Disorders. 2008;23(15):2129–2170. doi:10.1002/mds.22340
28. Hoehn M, Yahr MJN. Parkinsonism: onset. Progres Mortal. 1967;17(5):427–442.
29. Dalrymple-Alford J, MacAskill M, Nakas C, et al. The MoCA: well-suited screen for cognitive impairment in Parkinson disease. Neurology. 2010;75(19):1717–1725. doi:10.1212/WNL.0b013e3181fc29c9
30. Miyasaki JM, Shannon K, Voon V, et al. Practice Parameter: evaluation and treatment of depression, psychosis, and dementia in Parkinson disease (an evidence-based review): [RETIRED]. Neurology. 2006;66(7):996–1002. doi:10.1212/01.wnl.0000215428.46057.3d
31. Montplaisir J, Gagnon J, Fantini M, et al. Polysomnographic diagnosis of idiopathic REM sleep behavior disorder. Movement Dis. 2010;25(13):2044–2051. doi:10.1002/mds.23257
32. Li Z, Chen J, Lin Y, et al. Reduced regional activity and functional connectivity within sensorimotor network in Parkinson’s patients with restless legs syndrome. Mol Pain. 2019;15:1744806919882272. doi:10.1177/1744806919882272
33. Shang S, Zhang H, Feng Y, et al. Region-specific neurovascular decoupling associated with cognitive decline in Parkinson’s disease. Front Aging Neurosci. 2021;13:770528. doi:10.3389/fnagi.2021.770528
34. Power JD, Barnes KA, Snyder AZ, Schlaggar BL, Petersen SE. Spurious but systematic correlations in functional connectivity MRI networks arise from subject motion. Neuroimage. 2012;59(3):2142–2154. doi:10.1016/j.neuroimage.2011.10.018
35. Jia X, Fan W, Wang Z, et al. Progressive prefrontal cortex dysfunction in Parkinson’s disease with probable REM sleep behavior disorder: a 3-year longitudinal study. Front Aging Neurosci. 2021;13:750767. doi:10.3389/fnagi.2021.750767
36. Dauvilliers Y, Schenck CH, Postuma RB, et al. REM sleep behaviour disorder. Nat Rev Dis Primers. 2018;4(1):19. doi:10.1038/s41572-018-0016-5
37. Lövdén M, Fratiglioni L, Glymour M, Lindenberger U, Tucker-Drob EJP. Education and cognitive functioning across the life span. Psychol Sci Public Int. 2020;21(1):6–41. doi:10.1177/1529100620920576
38. Rahayel S, Gaubert M, Postuma RB, et al. Brain atrophy in Parkinson’s disease with polysomnography-confirmed REM sleep behavior disorder. Sleep. 2019;42(6). doi:10.1093/sleep/zsz062
39. Shen C, Wang J, Ma G, et al. Waking-hour cerebral activations in nightmare disorder: a resting-state functional magnetic resonance imaging study. Psychiatry Clin Neurosci. 2016;70(12):573–581. doi:10.1111/pcn.12455
40. Manni R, Terzaghi M, Glorioso M. Motor-behavioral episodes in REM sleep behavior disorder and phasic events during REM sleep. Sleep. 2009;32(2):241–245. doi:10.1093/sleep/32.2.241
41. Boucetta S, Salimi A, Dadar M, Jones BE, Collins DL, Dang-Vu TT. Structural brain alterations associated with rapid eye movement sleep behavior disorder in Parkinson’s Disease. Sci Rep. 2016;6:26782. doi:10.1038/srep26782
42. Eichenlaub JB, van Rijn E, Gaskell MG, et al. Incorporation of recent waking-life experiences in dreams correlates with frontal theta activity in REM sleep. Soc Cogn Affect Neurosci. 2018;13(6):637–647. doi:10.1093/scan/nsy041
43. Sunwoo JS, Cha KS, Byun JI, et al. Abnormal activation of motor cortical network during phasic REM sleep in idiopathic REM sleep behavior disorder. Sleep. 2019;42:2. doi:10.1093/sleep/zsy227
44. De Cock VC, Vidailhet M, Leu S, et al. Restoration of normal motor control in Parkinson’s disease during REM sleep. Brain. 2007;130(Pt 2):450–456. doi:10.1093/brain/awl363
45. Albin RL, Koeppe RA, Chervin RD, et al. Decreased striatal dopaminergic innervation in REM sleep behavior disorder. Neurology. 2000;55(9):1410–1412. doi:10.1212/WNL.55.9.1410
46. Park KM, Lee HJ, Lee BI, Kim SE. Alterations of the brain network in idiopathic rapid eye movement sleep behavior disorder: structural connectivity analysis. Sleep Breath. 2019;23(2):587–593. doi:10.1007/s11325-018-1737-0
47. Alexander GE, Crutcher MD. Functional architecture of basal ganglia circuits: neural substrates of parallel processing. Trends Neurosci. 1990;13(7):266–271. doi:10.1016/0166-2236(90)90107-L
48. Arnaldi D, De Carli F, Picco A, et al. Nigro-caudate dopaminergic deafferentation: a marker of REM sleep behavior disorder? Neurobiol Aging. 2015;36(12):3300–3305. doi:10.1016/j.neurobiolaging.2015.08.025
49. Arnaldi D, Morbelli S, Brugnolo A, et al. Functional neuroimaging and clinical features of drug naive patients with de novo Parkinson’s disease and probable RBD. Parkinsonism Relat Disord. 2016;29:47–53. doi:10.1016/j.parkreldis.2016.05.031
50. Garcia-Diaz AI, Segura B, Baggio HC, et al. Cortical thinning correlates of changes in visuospatial and visuoperceptual performance in Parkinson’s disease: a 4-year follow-up. Parkinsonism Relat Disord. 2018;46:62–68. doi:10.1016/j.parkreldis.2017.11.003
51. Wu L, Liu FT, Ge JJ, et al. Clinical characteristics of cognitive impairment in patients with Parkinson’s disease and its related pattern in (18) F-FDG PET imaging. Hum Brain Mapp. 2018;39(12):4652–4662. doi:10.1002/hbm.24311
52. Schott BH, Wüstenberg T, Lücke E, et al. Gradual acquisition of visuospatial associative memory representations via the dorsal precuneus. Hum Brain Mapp. 2019;40(5):1554–1570. doi:10.1002/hbm.24467
53. Tanglay O, Young IM, Dadario NB, et al. Anatomy and white-matter connections of the precuneus. Brain Imaging Behav. 2021;16(2):574–586.
54. Campabadal A, Inguanzo A, Segura B, et al. Cortical gray matter progression in idiopathic REM sleep behavior disorder and its relation to cognitive decline. Neuroimage Clin. 2020;28:102421. doi:10.1016/j.nicl.2020.102421
55. Oltra J, Campabadal A, Segura B, et al. Disrupted functional connectivity in PD with probable RBD and its cognitive correlates. Sci Rep. 2021;11(1):24351. doi:10.1038/s41598-021-03751-5
56. Tafuri B, Lombardi A, Nigro S, et al. The impact of harmonization on radiomic features in Parkinson’s disease and healthy controls: a multicenter study. Front Neurosci. 2022;16:1012287. doi:10.3389/fnins.2022.1012287
57. Guo X, Tinaz S, Dvornek NC. Characterization of early stage Parkinson’s disease from resting-state fMRI data using a long short-term memory network.
58. Dvornek N, Ventola P, Pelphrey K, Duncan JJM. Identifying autism from resting-state fMRI using long short-term memory networks. Med Image. 2017;10541:362–370.
 © 2022 The Author(s). This work is published and licensed by Dove Medical Press Limited. The full terms of this license are available at https://www.dovepress.com/terms.php and incorporate the Creative Commons Attribution - Non Commercial (unported, v3.0) License.
By accessing the work you hereby accept the Terms. Non-commercial uses of the work are permitted without any further permission from Dove Medical Press Limited, provided the work is properly attributed. For permission for commercial use of this work, please see paragraphs 4.2 and 5 of our Terms.
© 2022 The Author(s). This work is published and licensed by Dove Medical Press Limited. The full terms of this license are available at https://www.dovepress.com/terms.php and incorporate the Creative Commons Attribution - Non Commercial (unported, v3.0) License.
By accessing the work you hereby accept the Terms. Non-commercial uses of the work are permitted without any further permission from Dove Medical Press Limited, provided the work is properly attributed. For permission for commercial use of this work, please see paragraphs 4.2 and 5 of our Terms.