
Back to Journals » Medical Devices: Evidence and Research » Volume 19
Agreement and Accuracy of a Commercial Pulse Oximeter Compared with Arterial Oxygen Saturation During Controlled Hypoxemia in Healthy Volunteers
Authors Lin J, Pan S, Ma L, Ye J, Liu C, Wang F, Zhang X
Received 23 May 2026
Accepted for publication 9 July 2026
Published 14 July 2026 Volume 2026:19 626574
DOI https://doi.org/10.2147/MDER.S626574
Checked for plagiarism Yes
Review by Single anonymous peer review
Peer reviewer comments 2
Editor who approved publication: Professor Mohamad Bashir
Jinqi Lin,1 Shiyan Pan,1 Lan Ma,1 Jilun Ye,1 Chunsheng Liu,2 Fan Wang,2 Xu Zhang1
1School of Biomedical Engineering, Shenzhen University Medical School, Shenzhen, 518000, People’s Republic of China; 2Shenzhen Witleaf Medical Electronics Co., Ltd., Shenzhen, 518000, People’s Republic of China
Correspondence: Xu Zhang, School of Biomedical Engineering, Shenzhen University Medical School, Shenzhen, 518000, People’s Republic of China, Tel +86 13530178350, Email [email protected]
Purpose: Pulse oxygen saturation (SpO2) is widely used for continuous non-invasive oxygenation monitoring, but its accuracy can be affected by sensor design, probe placement, peripheral perfusion, skin pigmentation, motion artifacts, and device algorithms. This study evaluated the accuracy and agreement of a commercial pulse oximetry system (model M201 SpO2 module, Shenzhen Witleaf Medical Electronics Co. Ltd.) with a matched fingertip sensor during non-motion controlled hypoxemia in healthy volunteers, using arterial oxygen saturation (SaO2) measured by arterial blood gas/co-oximetry analysis as the reference standard.
Material and Methods: Eighteen healthy volunteers underwent two phases of controlled hypoxemia. Each phase comprised three target SpO2 plateau ranges (90– 100%, 80– 89%, and 70– 79%). Phase 1 was the desaturation phase, and Phase 2 was a re-oxygenation and repetition phase. After each target plateau stabilized, SpO2 values from the investigational system were recorded, and paired arterial blood samples were collected for SaO2 measurement. Measurement error was defined as SpO2−SaO2. Bias, mean absolute error (MAE), accuracy root mean square (ARMS), 95% limits of agreement (LOA), and proportions of absolute errors exceeding predefined thresholds were calculated.
Results: A total of 432 paired SpO2–SaO2 observations were analyzed. SpO2 showed strong correlation with SaO2 (Pearson r = 0.990; Spearman r = 0.986; both p < 0.001). Overall bias was − 0.061%, with 95% LOA from − 2.65% to 2.53%. MAE and ARMS were 1.05% and 1.32%, respectively. Absolute errors exceeding ± 2%, ± 3%, and ± 4% occurred in 11.57%, 2.55%, and 0% of observations, respectively. ARMS values were 1.03%, 1.19%, and 1.66% across the 90– 100%, 80– 89%, and 70– 79% platform phases, respectively, with increased error dispersion and mild SaO2 underestimation in the 70– 79% phase.
Conclusion: The commercial pulse oximetry system showed good overall agreement with reference SaO2 during controlled hypoxemia, with an ARMS of 1.32% (well below the 4% threshold). Error dispersion increased in the 70– 79% saturation range, with mild underestimation of SaO2 by SpO2. These findings support the clinical performance of this device within the tested saturation range.
Keywords: pulse oximetry, SpO2, SaO2, controlled hypoxemia, co-oximetry, agreement analysis
Introduction
Pulse oxygen saturation (SpO2) monitoring is non-invasive, continuous, real-time, and easy to perform, and is widely used in anesthesia, emergency medicine, intensive care, perioperative monitoring, chronic respiratory disease management, and monitoring in hypoxemic environments.1 SpO2 is essentially a non-invasive estimate of arterial oxygen saturation (SaO2), and its clinical value depends on its accuracy and stability across different oxygen saturation ranges.
Pulse oximeters typically estimate SpO2 based on the differential absorption of red and infrared light by oxygenated and deoxygenated hemoglobin, using photoplethysmographic signals and device-specific algorithms. The commercial pulse oximetry system evaluated in this study (model M201 SpO2 module, Shenzhen Witleaf Medical Electronics Co., Ltd.) is based on this type of non-invasive optical measurement principle. Therefore, in addition to the monitor algorithm, probe structure, probe fit, sensor recognition, resistance to interference, and local perfusion status may all affect the final SpO2 readings.
Controlled hypoxemia studies are commonly used to evaluate the accuracy of pulse oximeters. In such studies, healthy volunteers are typically exposed to adjusted inspired gas mixtures to achieve SaO2 levels covering approximately 70–100%, and SaO2 measured by a co-oximeter or multi-wavelength blood gas analyzer is used as the reference standard. Bias and accuracy root mean square (ARMS) are then calculated to assess SpO2 accuracy relative to SaO2.2–5 The ISO 80601-2-61:2017 standard specifies particular requirements for the basic safety and essential performance of pulse oximeter equipment, including minimum accuracy criteria and validation methodology.6 Published studies and regulatory guidance emphasize that pulse oximeter performance evaluation should consider overall ARMS, errors in the hypoxemic range, participant skin tone distribution, sensor/probe type, and repeated-measurement structure.2,3,6,7
Previous studies have shown that some pulse oximeters perform well in the normal saturation range, whereas measurement errors may increase at lower SaO2 levels. Probe type, sensor position, and skin pigmentation may also influence measurement bias.8–13 Therefore, controlled hypoxemia validation of a specific commercial pulse oximetry system and its matched fingertip sensor can not only evaluate overall accuracy for clinical performance assessment, but also clarify changes in error distribution across different hypoxemia platform phases, providing device-specific evidence for regulatory clearance and clinical application.
Based on paired SpO2 and arterial blood gas/co-oximeter SaO2 data obtained at synchronized time points during a controlled hypoxemia study in healthy volunteers, this study aimed to evaluate the accuracy and agreement of the commercial pulse oximetry system (model M201 SpO2 module). The specific objectives were: (1) to assess the overall correlation and Bland–Altman agreement between SpO2 and SaO2; (2) to calculate overall bias, mean absolute error (MAE), ARMS, and 95% limits of agreement (LOA); (3) to compare error distributions across the 90–100%, 80–89%, and 70–79% experimental platform phases; and (4) to perform validation analyses stratified by measured SaO2 ranges to confirm the robustness of the platform-based findings.
Materials and Methods
Study Design
This was a single-center, prospective, paired-measurement agreement analysis based on a controlled hypoxemia study. The study was conducted in healthy volunteers. Different levels of hypoxemia were induced by adjusting the inspired oxygen concentration. SpO2 values measured by the investigational pulse oximetry system were recorded synchronously with arterial blood sampling for SaO2 measurement. SaO2 was used as the reference standard to evaluate the accuracy and agreement of SpO2 measurements. The detailed trial protocol is available from the corresponding author upon reasonable request. This study was not prospectively registered in a clinical trial registry; at the time of protocol development, prospective registration was not mandated by our institution for device evaluation studies of this type.
Ethical Approval and Informed Consent
The study protocol was jointly developed by the clinical trial institution and the study investigators and was approved by the ethics committee. All participants provided written informed consent. The ethics approval number was PN-202500151. Before the study, all participants were fully informed of the study purpose, procedures, potential risks, and emergency management measures, and they signed written informed consent forms. The study was conducted in accordance with the principles of the Declaration of Helsinki.
Study Participants
A total of 18 healthy young volunteers were included in the final analysis, including 2 Caucasian, 2 Black, and 14 Asian participants. The participants had a mean age of 26.9 ± 5.6 years, a mean height of 165.6 ± 6.5 cm, and a mean body weight of 65.6 ± 14.1 kg. Skin tone ranged from 2 to 9 on the Monk Skin Tone Scale and from type II to VI on the Fitzpatrick skin phototype scale. Each participant completed two rounds of controlled hypoxemia induction, with 12 paired SpO2–SaO2 measurements per round and 24 paired measurements per participant.
The inclusion criteria were as follows: (1) healthy adult volunteers aged 18–45 years; (2) stable vital signs, defined as heart rate 60–100 beats/min, systolic blood pressure 90–140 mmHg, diastolic blood pressure 60–90 mmHg, respiratory rate 12–20 breaths/min, and body temperature 36.0–37.5 °C, all measured during the screening visit; (3) ability to understand and cooperate with the controlled hypoxemia protocol; (4) voluntary provision of written informed consent; and (5) good compliance with study procedures, defined as ability to follow controlled breathing instructions, willingness to remain seated and minimize hand movement during SpO2 recording and blood sampling, and completion of both phases of the controlled hypoxemia protocol. The study was designed to include both men and women and to cover a range of body characteristics, skin tones, and finger circumferences to support evaluation of the applicability of the matched fingertip sensor.
The exclusion criteria were as follows: smoking or long-term exposure to high-carbon-monoxide environments with a risk of elevated carboxyhemoglobin; abnormal methemoglobin levels; age greater than 60 years; pregnancy or lactation; severe cardiopulmonary, hepatic, renal, or systemic disease; coagulation disorders, anemia, or a history of hemoglobinopathy; skin or fingertip abnormalities at the sensor placement site; and any condition judged by the investigator to pose an excessive risk for arterial puncture or controlled hypoxemia induction.
Investigational Device and Measurement Principle
SpO2 was monitored using a pulse oximetry monitoring system developed by Shenzhen Witleaf Medical Electronics Co., Ltd. and a matched fingertip pulse oximetry sensor. In this study, the pulse oximetry monitor host, M201 SpO2 module, embedded algorithm, and matched sensor were evaluated as an integrated investigational system. Detailed technical specifications of the investigational system were documented in the original clinical trial records.
The device uses a dual-wavelength red/infrared optical pulse oximetry principle to acquire fingertip photoplethysmographic signals and calculates SpO2 and pulse rate using an embedded algorithm. According to the clinical trial protocol, the pulse oximetry measurement system provides non-invasive, continuous, real-time monitoring; simultaneous display of pulse waveform and SpO2 values; alarm and trend analysis functions; environmental light interference suppression; and sensor recognition capability.
Controlled Hypoxemia Induction Protocol
All participants rested quietly before the study. The controlled hypoxemia protocol consisted of two phases, each comprising three target SpO2 plateau ranges (90–100%, 80–89%, and 70–79%). Phase 1 (desaturation phase): the inspired oxygen fraction (FiO2) was adjusted via a nitrogen–oxygen gas mixture to gradually reduce SpO2 from approximately 100% to 70% over approximately 30–45 minutes, sequentially passing through the three target plateau ranges. When SpO2 reached the 70–79% range, it was maintained for approximately 5–8 minutes. Phase 2 (re-oxygenation and repetition phase): after completion of Phase 1, participants were re-oxygenated with supplemental oxygen until SpO2 returned to normal levels (>95%). Following re-oxygenation, the same three SpO2 plateau targets were repeated using the same desaturation protocol as Phase 1. According to the clinical trial protocol, each participant contributed a total of 24 sampling points (12 per phase, approximately 4 per plateau per phase), with approximately eight points each in the 90–100%, 80–89%, and 70–79% platform phases.
Platform stability was determined according to the clinical trial protocol. After the target plateau was reached, the reference pulse oxygen saturation and/or end-tidal gas monitoring curves were required to remain stable, with variations within approximately 1% over about 45s. Once stability was achieved, approximately 1 mL of arterial blood was collected, and the SpO2 value from the investigational system was recorded. A second sampling point could be obtained after an interval of approximately 30s. During the study, approximately 0.5% CO2 could be added when necessary to reduce the risk of respiratory alkalosis during hypoxemia induction. If a participant experienced discomfort, significant heart rate or rhythm abnormalities, hemodynamic instability, or if the investigator judged that continued participation posed a safety risk, hypoxemia induction was immediately terminated and the participant was returned to room air or provided with supplemental oxygen.
SpO2 Measurement and Sensor Management
The matched sensor of the investigational device was attached to the index finger or middle finger of the participant’s non-dominant hand, and the sensor position was not changed during the study for the same participant. Before recording, proper sensor placement, adequate probe fit, and stable pulse waveform were confirmed. Motion, local compression, and external light interference were minimized as much as possible. According to the clinical trial protocol, the sensor position was kept consistent for each participant. Light shielding was used when necessary to prevent interference from adjacent sensors or ambient light. The ambient temperature was maintained at 18–28 °C. If peripheral circulation at the fingertip was poor, warming or other measures could be used to improve fingertip perfusion.
Arterial Blood Gas/Co-Oximetry Analysis
Arterial blood samples were collected synchronously after each target plateau had stabilized. The samples were analyzed immediately on site using a blood gas analyzer with co-oximetry capability (ABL90, Radiometer Medical ApS, Denmark) to obtain reference arterial oxygen saturation (SaO2) values. These SaO2 values were used as the reference standard for evaluating the SpO2 accuracy of the investigational system.
Data Stratification and Quality Control
The primary analysis was stratified by experimental platform phase. Paired observations were categorized into the 90–100%, 80–89%, and 70–79% platform phases to evaluate changes in measurement error across different stages of controlled hypoxemia induction. Because SaO2 was the reference standard, a validation analysis was also performed by stratifying the paired observations according to measured SaO2 ranges: 90–100%, 80–89%, and 70–79%.
During data cleaning, SpO2−SaO2 errors were recalculated. According to the clinical trial protocol, the following data were excluded or flagged: data from participants who did not complete the protocol; readings with a drift of more than four percentage points within a 10s platform recording period; data recorded during unstable oxygen saturation platforms; samples with air leakage during arterial blood collection; samples with abnormal blood gas analysis conditions or abnormal blood gas test results; and data with obvious mismatches between blood sampling time and SpO2 recording time or other recording errors. In the present analysis, no paired observation had an absolute error greater than 5%.
Statistical Analysis
Statistical analyses were performed using R software version 4.4.1 (R Foundation for Statistical Computing, Vienna, Austria). Continuous variables are presented as mean ± standard deviation, and categorical variables are presented as counts and percentages. Using SaO2 as the reference standard, the measurement error for the ith paired observation was defined as:
(1)
where di>0 indicates overestimation of SaO2 by SpO2, and di<0 indicates underestimation of SaO2 by SpO2.
Bias was calculated as:
(2)
Mean absolute error (MAE) was calculated as:
(3)
Accuracy root mean square (ARMS/RMSE) was calculated as:
(4)
The 95% limits of agreement (LOA) were calculated as:
(5)
The proportions of absolute errors exceeding ±2%, ±3%, and ±4% were also calculated. Pearson and Spearman correlation analyses were used to evaluate the correlation between SpO2 and SaO2. Bland–Altman plots were used to assess overall agreement.14 Because each participant contributed multiple paired observations, linear mixed-effects models were used to analyze the effects of experimental platform phase and round on SpO2−SaO2 error, with participant ID included as a random effect. In the limitations section, we also note that modified Bland–Altman methods for repeated measurements could be further applied in sensitivity analyses.15 A two-sided p value < 0.05 was considered statistically significant.
Results
Participant Characteristics and Data Distribution
A total of 18 healthy young volunteers were included in the final analysis, yielding 432 synchronized paired SpO2–SaO2 observations. Participant characteristics are summarized in Table 1. The mean age was 26.9 ± 5.6 years, mean height was 165.6 ± 6.5 cm, and mean body weight was 65.6 ± 14.1 kg. The cohort included 6 males and 12 females, with racial distribution of 2 Caucasian, 2 Black, and 14 Asian participants. Skin tone ranged from 2 to 9 on the Monk Skin Tone Scale and from type II to VI on the Fitzpatrick skin phototype scale. Each participant contributed 24 paired observations (12 per phase). Of the 432 total observations, 216 were obtained in Phase 1 and 216 in Phase 2. Each participant contributed 24 paired observations, with 216 paired observations obtained in each of the first and second rounds. Stratified by experimental platform phase, the 90–100%, 80–89%, and 70–79% platform phases included 145, 144, and 143 paired observations, respectively. Stratified by measured SaO2 range, the 90–100%, 80–89%, and 70–79% ranges included 139, 143, and 148 paired observations, respectively, with two observations falling outside these predefined ranges. Overall, the experimental platform phases were well matched with the measured SaO2 ranges.
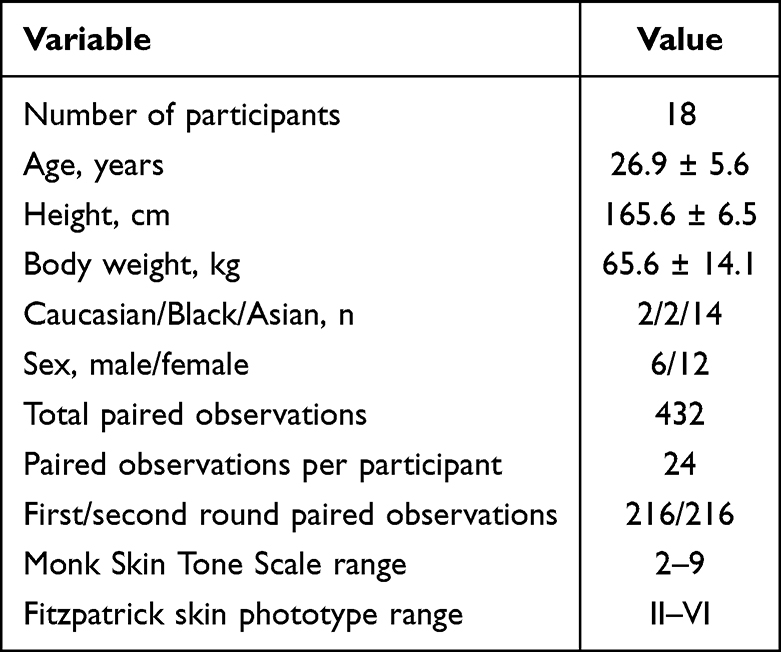 |
Table 1 Participant Characteristics and Data Distribution |
Overall Correlation and Agreement Between SpO2 and SaO2
The mean SpO2 was 85.29% ± 9.14%, and the mean SaO2 was 85.35% ± 8.84%. As shown in Figure 1, the dashed line indicates the line of identity, and the solid line indicates the linear fitted line. The SpO2–SaO2 scatter points were mainly distributed along the line of identity, and the fitted line was close to the reference line, indicating a strong linear relationship between SpO2 and SaO2 across the 70–100% oxygen saturation range. Correlation analysis showed a strong positive correlation between SpO2 and SaO2, with a Pearson correlation coefficient of 0.990 and a Spearman correlation coefficient of 0.986, both p < 0.001.
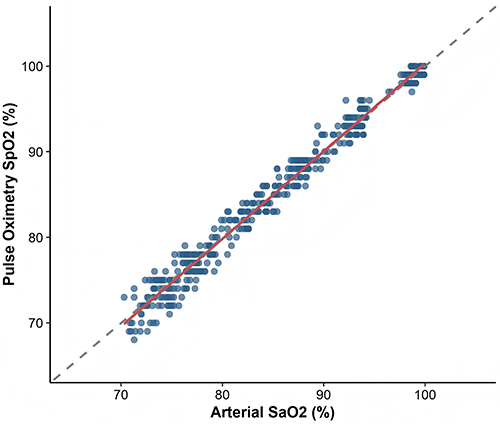 |
Figure 1 Scatter plot showing the correlation between SpO2 and SaO2. |
As shown in Figure 2, the solid line represents the mean bias, and the dashed lines represent the 95% limits of agreement. Bland–Altman analysis showed that SpO2−SaO2 differences were mainly distributed around zero, and most paired observations were within the 95% limits of agreement. The overall error metrics are summarized in Table 2. The overall mean bias was −0.061%, indicating no obvious systematic overestimation or underestimation of SaO2 by SpO2. The 95% confidence interval for bias was −0.186% to 0.064%, and the 95% limits of agreement were −2.65% to 2.53%. The overall MAE was 1.05%, and the ARMS was 1.32%. The proportions of absolute errors exceeding ±2%, ±3%, and ±4% were 11.57%, 2.55%, and 0%, respectively.
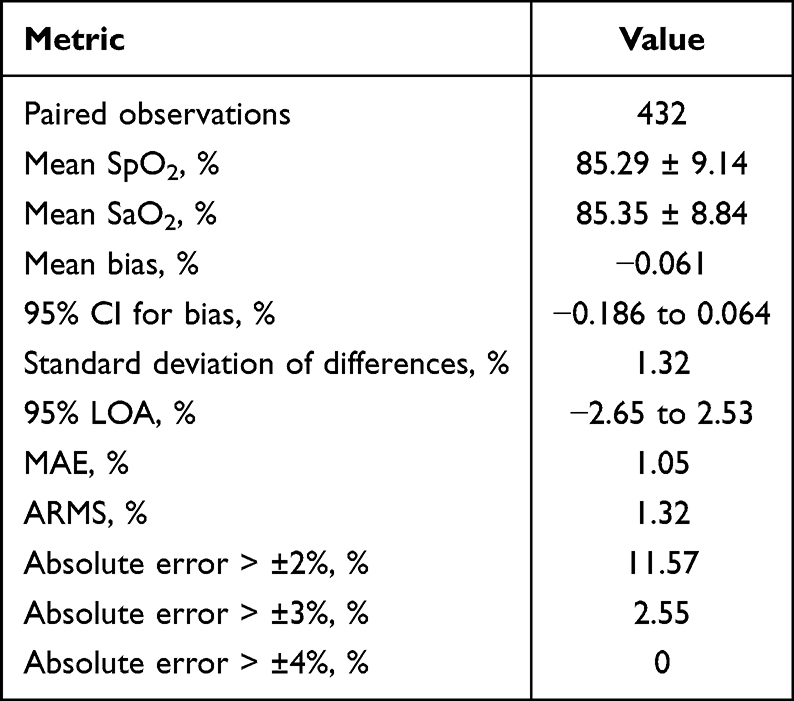 |
Table 2 Overall SpO2–SaO2 Error Analysis |
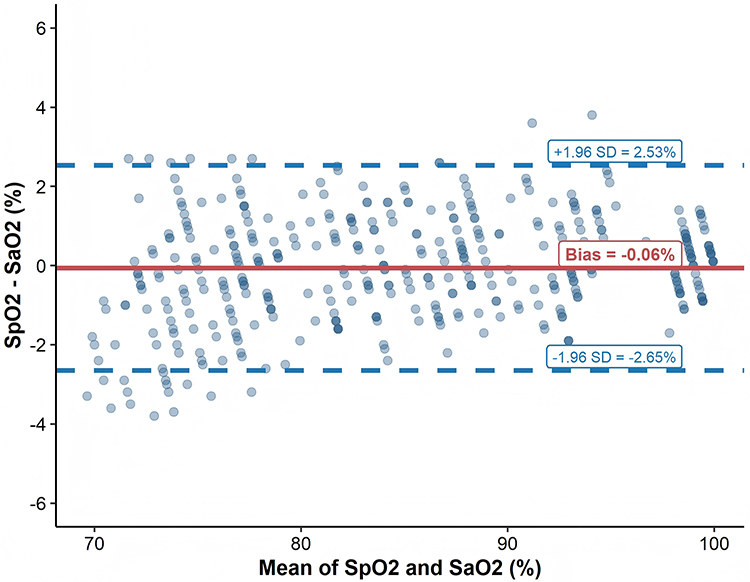 |
Figure 2 Bland–Altman agreement analysis between SpO2 and SaO2. |
Primary Analysis Stratified by Experimental Platform Phase
The error analysis stratified by experimental platform phase is shown in Table 3. The mean biases in the 90–100%, 80–89%, and 70–79% platform phases were 0.159%, 0.141%, and −0.487%, respectively. The corresponding ARMS values were 1.03%, 1.19%, and 1.66%, respectively. The 95% limits of agreement were −1.84% to 2.16%, −2.18% to 2.47%, and −3.61% to 2.64%, respectively.
 |
Table 3 SpO2–SaO2 Error Analysis Stratified by Experimental Platform Phase |
As shown in Figure 3, the dashed line indicates zero error. With decreasing oxygen saturation platform phase, the distribution of SpO2−SaO2 errors became progressively wider. The 70–79% platform phase showed the greatest error dispersion, with a negative shift in the median error, suggesting a mild tendency for SpO2 to underestimate SaO2 under more severe hypoxemia. As shown in Figure 4, the proportions of absolute errors exceeding ±2% and ±3% were higher in the 70–79% platform phase than in the 90–100% and 80–89% phases. However, no paired observations in any platform phase showed an absolute error exceeding ±4%.
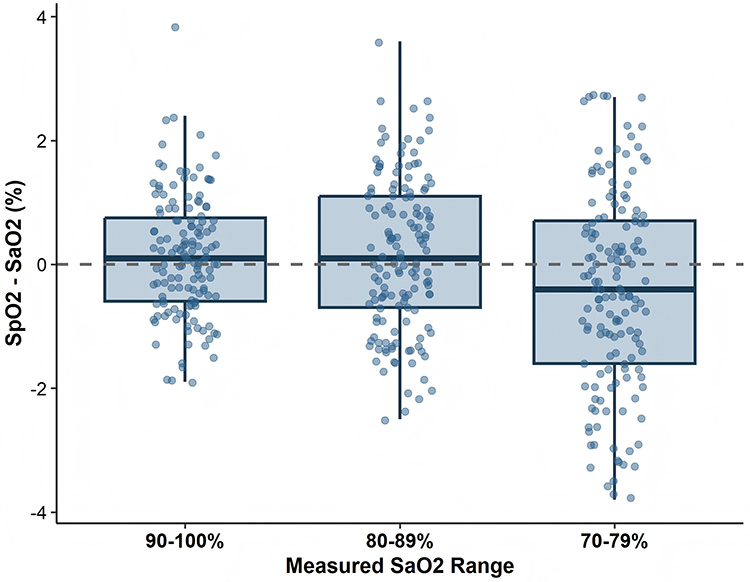 |
Figure 3 Distribution of SpO2−SaO2 error across experimental platform phases. |
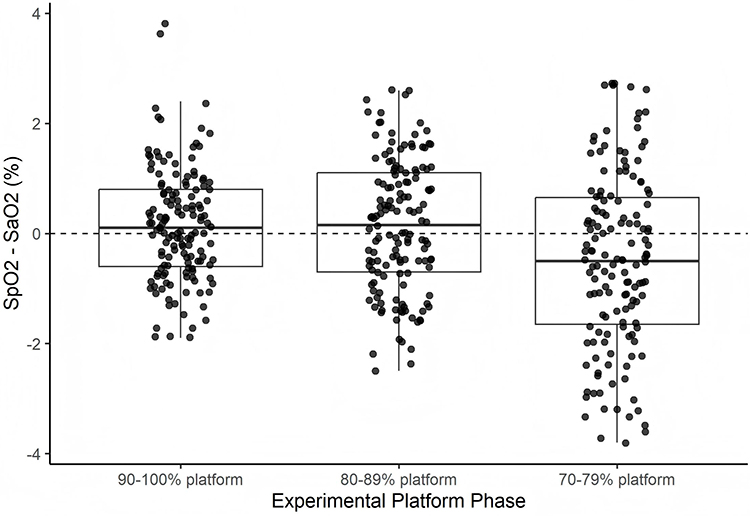 |
Figure 4 Proportion of absolute errors exceeding predefined thresholds across experimental platform phases. |
The linear mixed-effects model showed that experimental platform phase had a significant effect on SpO2−SaO2 error (F = 17.83, p = 3.76 × 10⁻⁸), whereas round had no significant effect (p = 0.147). Pairwise comparisons showed no significant difference between the 90–100% and 80–89% platform phases (p = 0.987), whereas the 70–79% platform phase differed significantly from both the 90–100% and 80–89% phases (p = 7.10 × 10⁻⁷ and p = 1.62 × 10⁻⁶, respectively).
Validation Analysis Stratified by Measured SaO2 Range
To validate the platform-based analysis, a further stratified analysis was performed according to measured SaO2 ranges. The results are shown in Table 4. The 90–100%, 80–89%, and 70–79% measured SaO2 ranges included 139, 143, and 148 paired observations, respectively. The mean biases in these three ranges were 0.138%, 0.145%, and −0.441%, respectively, and the ARMS values were 0.98%, 1.24%, and 1.64%, respectively.
 |
Table 4 Validation Analysis Stratified by Measured SaO2 Range |
As shown in Figure 5, when stratified by measured SaO2 range, the 70–79% range also showed a wider error distribution and a mild negative bias. This finding was consistent with the primary analysis stratified by experimental platform phase, indicating that the increased dispersion of SpO2−SaO2 error at lower oxygen saturation levels was stable across stratification methods.
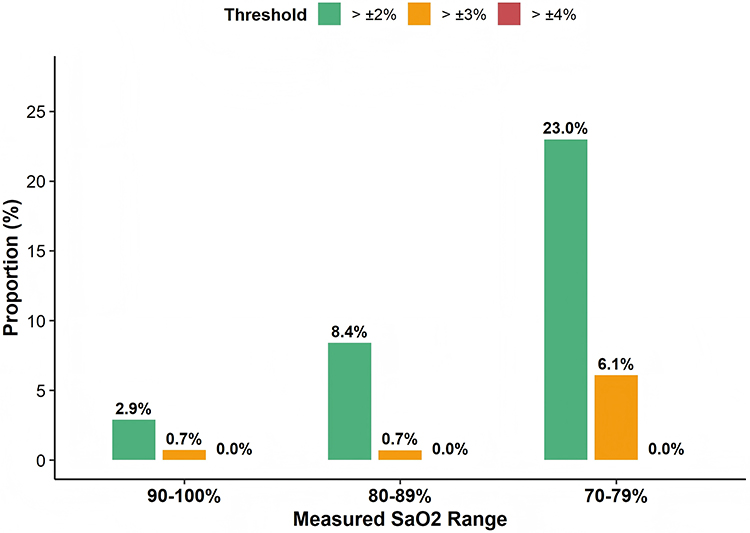 |
Figure 5 Distribution of SpO2−SaO2 error stratified by measured SaO2 range. |
Repeatability Between Rounds and Outlier Assessment
The first and second rounds each included 216 paired observations. In the first round, the mean SpO2−SaO2 bias was −0.133%, the MAE was 1.02%, and the ARMS was 1.29%. In the second round, the mean bias was 0.011%, the MAE was 1.08%, and the ARMS was 1.35%. The linear mixed-effects model showed no significant effect of round on SpO2−SaO2 error, suggesting good repeatability of the error distribution across the two rounds of hypoxemia induction.
No paired observation showed an absolute error greater than 5%, indicating that the overall findings were not driven by extreme outliers.
Safety Results
According to the clinical trial protocol, if a participant developed an irregular heart rhythm, heart rate exceeding the predefined alarm limit, subjective discomfort, or if the investigator judged that continuing the study would pose a safety risk, the study procedure was to be immediately terminated and the participant was returned to room air or provided with supplemental oxygen. After completion of the study, participants were allowed to leave only after safety evaluation by medical staff. No serious adverse events, hypoxemia-related discomfort, or device-related adverse events occurred during the study. All participants were assessed by medical staff and left safely after the study.
Discussion
Main Findings
Based on 432 synchronized paired SpO2–SaO2 observations from 18 healthy volunteers, this study evaluated the accuracy and agreement of a commercial pulse oximetry system (model M201 SpO2 module, Shenzhen Witleaf Medical Electronics Co., Ltd.) during controlled hypoxemia. The overall ARMS was 1.32%, well below the 4% threshold recommended by ISO 80601-2-61:2017. The overall bias was minimal (−0.061%), with 95% LOA from −2.65% to 2.53%. Error dispersion increased in the 70–79% saturation range, with mild underestimation of SaO2 by SpO2.
Relationship to Controlled Hypoxemia Validation Standards and Previous Studies
Controlled hypoxemia studies usually evaluate SpO2 accuracy over the 70–100% SaO2 range, using SaO2 measured by co-oximetry as the reference standard. The ISO 80601-2-61:2017 standard specifies that pulse oximeter accuracy evaluation should include a minimum of 200 paired observations from at least 10 participants, with SaO2 values distributed across the 70–100% range, and that the ARMS should not exceed 4%. This study obtained 432 paired observations across 18 participants, exceeding the minimum observation count recommended by ISO 80601-2-61:2017, while acknowledging that these are repeated measurements from a limited number of participants. The overall ARMS of 1.32% is well within the acceptable threshold.
Significance of Increased Error in the Lower Hypoxemia Platform Phase
The most important finding of this study was not merely that SpO2 and SaO2 were highly correlated, but that the hypoxemia platform phase affected the error distribution. In the 90–100% and 80–89% platform phases, the mean bias was close to zero and slightly positive. In contrast, in the 70–79% platform phase, the mean bias became negative, suggesting that SpO2 may mildly underestimate SaO2 under more severe hypoxemic conditions. In addition, the proportions of absolute errors exceeding ±2% and ±3% increased to 23.78% and 6.29%, respectively, in the 70–79% platform phase. These findings indicate that lower oxygen saturation was associated not only with a shift in mean bias, but also with increased random error and error dispersion.
From a clinical interpretation perspective, mild underestimation of SaO2 by SpO2 is hypoxemia. Nevertheless, the increased error dispersion in the lower hypoxemia range suggests that when SpO2 is below 90% or inconsistent with the clinical presentation, arterial blood gas analysis and the overall clinical context should be considered.
Necessity of Evaluating the Device and Sensor as an Integrated System
The performance of pulse oximetry equipment depends not only on the monitor algorithm, but also on the matched sensor, sensor structure, optical path, probe fit, and local tissue perfusion. Previous probe comparison studies have shown that ARMS and bias can differ substantially when different probes are connected to the same monitor. Studies on sensor malpositioning have also suggested that sensor misalignment can cause considerable SpO2 errors during hypoxemia.2,9,16 Therefore, in the present study, the investigational pulse oximetry monitor and matched fingertip sensor were evaluated as an integrated system, rather than evaluating the monitor or sensor separately.
Skin Tone, Sex, and Fingertip Conditions
Skin pigmentation, sex, finger size, hemoglobin level, fingertip temperature, and peripheral perfusion may all influence pulse oximeter accuracy.8–12 Although this study included participants across a range of skin tones (Monk Skin Tone Scale 2–9; Fitzpatrick types II–VI), the sample size was not powered to evaluate skin tone as an independent predictor of SpO2–SaO2 error. The present results can describe the overall accuracy across participants with different skin tone backgrounds, but cannot fully evaluate skin tone-related bias. Future studies with larger and more diverse cohorts are needed to assess potential skin tone-related bias specifically.17,18
Strengths of This Study
This study has several strengths. First, it used a controlled hypoxemia induction model covering clinically relevant saturation ranges (70–100%), which is the standard methodology for pulse oximeter accuracy evaluation per ISO 80601-2-61:2017. Second, the study obtained 432 paired observations across 18 participants, exceeding the minimum observation count of 200 recommended by ISO 80601-2-61:2017, while acknowledging that these are repeated measurements from a limited number of participants. Third, both platform-based and SaO2-based stratification analyses were performed, confirming the robustness of the findings. Fourth, all adverse events were monitored, and no serious adverse events occurred.
Limitations
This study has several limitations. First, although Monk Skin Tone Scale and Fitzpatrick skin phototype19 were recorded and covered Monk levels 2–9 and Fitzpatrick types II–VI,20 the number of Black/darker-skinned participants was limited, and the sample size within each skin tone category was insufficient to fully evaluate skin tone-related bias. Second, arterial blood samples were analyzed immediately on site using a blood gas analyzer/hemoximeter or co-oximeter to obtain SaO2 values; however, detailed quality control records of the blood gas analyzer, specific co-oximetry measurement details, and the exact time interval between arterial blood sampling and SpO2 recording were not further reported in this manuscript. Third, this study was conducted under non-motion controlled hypoxemia conditions and therefore cannot evaluate performance under non-ideal conditions, such as motion artifacts, low perfusion, strong ambient light interference, nail polish, or hypothermia. Fourth, the present study used an overall Bland–Altman plot to describe agreement and applied mixed-effects models to account for repeated measurements. Future studies could further apply modified Bland–Altman methods for repeated measurements as a sensitivity analysis.15
Clinical Implications
The present results suggest that, under non-motion controlled hypoxemia conditions, the investigational pulse oximetry monitoring system and matched fingertip sensor can accurately reflect arterial oxygen saturation and may provide evidence for continuous non-invasive oxygenation monitoring in hypoxemic environments. However, in the more severe 70–79% hypoxemia platform phase, error dispersion increased. Therefore, when SpO2 is in a lower range or inconsistent with the clinical presentation, SpO2 readings should still be interpreted together with arterial blood gas analysis and the overall clinical context.
Conclusions
In this controlled hypoxemia study, a commercial pulse oximetry system (model M201 SpO2 module) demonstrated good overall agreement with reference SaO2 across the 70%–100% saturation range. The overall ARMS was 1.32%, well below the 4% threshold recommended by ISO 80601-2-61:2017. Error dispersion increased in the 70–79% saturation range, with mild underestimation of SaO2 by SpO2. These findings support the clinical performance of this device within the tested saturation range.
Abbreviations
ARMS, accuracy root mean square; CO2, carbon dioxide; FiO2, fraction of inspired oxygen; LOA, limits of agreement; MAE, mean absolute error; SaO2, arterial oxygen saturation; SpO2, pulse oxygen saturation.
Data Sharing Statement
The de-identified paired SpO2–SaO2 dataset (432 observations from 18 participants) supporting the findings of this study is available as Supplementary Material. The detailed trial protocol is provided for the editor and peer reviewers only and is not intended for publication. Access to device-related technical records may be restricted due to proprietary and regulatory considerations.
Ethics Approval and Informed Consent
The study was conducted in accordance with the Declaration of Helsinki and approved by the Ethics Committee of Shenzhen University Medical School (approval No. PN-202500151; approval date: 20 September 2025). Written informed consent was obtained from all participants involved in the study.
Consent for Publication
Not applicable. This manuscript does not contain identifiable individual participant images, videos, or personal details.
Author Contributions
All authors made a significant contribution to the work reported, whether that is in the conception, study design, execution, acquisition of data, analysis and interpretation, or in all these areas; took part in drafting, revising or critically reviewing the article; gave final approval of the version to be published; have agreed on the journal to which the article has been submitted; and agree to be accountable for all aspects of the work.
Funding
This research was funded by the National Key Research and Development Program of China, subproject “Standardized Quality Control Technology for Clinical Monitoring Devices for Blood Oxygen and Blood Pressure”, grant number 2022YFF0606103 and the Shenzhen Science and Technology Innovation Commission through the Key Project “Research and Development of Key Technologies for an Intelligent Sleep Monitoring and Analysis System” (Project Approval No. 202324N122; Project No. KJZD20230923114306013).
Disclosure
Chunsheng Liu and Fan Wang are employees of Shenzhen Witleaf Medical Electronics Co., Ltd., which developed the investigational pulse oximeter system evaluated in this study. The remaining authors declare no competing interests in this work.
References
1. Jubran A. Pulse oximetry. Crit Care. 2015;19(1):272. doi:10.1186/s13054-015-0984-8
2. Choi BM, Kang BJ, Yun HY, Jeon B, Bang JY, Noh GJ. Performance of the MP570T pulse oximeter in volunteers participating in the controlled desaturation study: a comparison of seven probes. Anesth Pain Med. 2020;15(3):371–13. doi:10.17085/apm.20028
3. Mastrototaro JJ, Leabman M, Shumate J, Tompkins KL. Performance of a wearable ring in controlled hypoxia: a prospective observational study. JMIR Form Res. 2024;8:e54256. doi:10.2196/54256
4. Vikne H, Kjeserud JA, Westgaard W, et al. Validity of pulse oximetry measures for heart rate and oxygen saturation during profound hypoxia in normobaric simulated extreme altitudes. PLoS One. 2025;20(6):e0326674. doi:10.1371/journal.pone.0326674
5. US Food and Drug Administration. Pulse oximeters for medical purposes — non-clinical and clinical performance testing, labeling, and premarket submission recommendations: draft guidance for industry and food and drug administration staff. Silver Spring (MD): FDA; 2025.
6. International Organization for Standardization. ISO 80601-2-61:2017. Medical electrical equipment — part 2–61: particular requirements for basic safety and essential performance of pulse oximeter equipment. Geneva: ISO; 2017.
7. Jiang Y, Spies C, Roghanizad AR, et al. Performance of wearable pulse oximetry during controlled hypoxia induction: instrument validation study. JMIR Form Res. 2026;10:e85253. doi:10.2196/85253
8. Trivedi NS, Ghouri AF, Lai E, Shah NK, Barker SJ. Pulse oximeter performance during desaturation and resaturation: a comparison of seven models. J Clin Anesth. 1997;9(3):184–188. doi:10.1016/S0952-8180(97)00037-8
9. Barker SJ, Hyatt J, Shah NK, Kao YJ. The effect of sensor malpositioning on pulse oximeter accuracy during hypoxemia. Anesthesiology. 1993;79(2):248–254. doi:10.1097/00000542-199308000-00009
10. Bickler PE, Feiner JR, Severinghaus JW. Effects of skin pigmentation on pulse oximeter accuracy at low saturation. Anesthesiology. 2005;102(4):715–719. doi:10.1097/00000542-200504000-00004
11. Feiner JR, Severinghaus JW, Bickler PE. Dark skin decreases the accuracy of pulse oximeters at low oxygen saturation: the effects of oximeter probe type and gender. Anesth Analg. 2007;105(6 Suppl):S18–S23. doi:10.1213/01.ane.0000285988.35174.d9
12. Haxha S, Nwibor C, Ali M, et al. Effect of skin pigmentation and finger choice on accuracy of oxygen saturation measurement in an IoT-based pulse oximeter. Sensors. 2024;24(11):3301. doi:10.3390/s24113301
13. Fawzy A, Ali H, Dziedzic PH, et al. Skin pigmentation and pulse oximeter accuracy in the intensive care unit: a pilot prospective study. Am J Respir Crit Care Med. 2024;210(3):355–358. doi:10.1164/rccm.202401-0036LE
14. Bland JM, Altman DG. Statistical methods for assessing agreement between two methods of clinical measurement. Lancet. 1986;1(8476):307–310. doi:10.1016/S0140-6736(86)90837-8
15. Bland JM, Altman DG. Agreement between methods of measurement with multiple observations per individual. J Biopharm Stat. 2007;17(4):571–582. doi:10.1080/10543400701329422
16. Hughes C, Chen D, Law T, et al. Pulse oximeter performance and skin pigment: comparison of 34 oximeters using current and emerging regulatory frameworks. Anesth Analg. 2026. doi:10.1213/ANE.0000000000008048
17. Sjoding MW, Dickson RP, Iwashyna TJ, Gay SE, Valley TS. Racial bias in pulse oximetry measurement. N Engl J Med. 2020;383(25):2477–2478. doi:10.1056/NEJMc2029240
18. Gottlieb ER, Ziegler J, Morley K, Rush B, Celi LA. Assessment of racial and ethnic differences in oxygen supplementation among patients in the intensive care unit. JAMA Intern Med. 2022;182(8):849–858. doi:10.1001/jamainternmed.2022.2587
19. Monk EP. The monk skin tone scale. SocArXiv [Preprint]. 2023. doi:10.31235/osf.io/pdf4c.
20. Fitzpatrick TB. The validity and practicality of sun-reactive skin types I through VI. Arch Dermatol. 1988;124(6):869–871. doi:10.1001/archderm.124.6.869
 © 2026 The Author(s). This work is published and licensed by Dove Medical Press Limited. The
full terms of this license are available at https://www.dovepress.com/terms
and incorporate the Creative Commons Attribution
- Non Commercial (unported, 4.0) License.
By accessing the work you hereby accept the Terms. Non-commercial uses of the work are permitted
without any further permission from Dove Medical Press Limited, provided the work is properly
attributed. For permission for commercial use of this work, please see paragraphs 4.2 and 5 of our Terms.
© 2026 The Author(s). This work is published and licensed by Dove Medical Press Limited. The
full terms of this license are available at https://www.dovepress.com/terms
and incorporate the Creative Commons Attribution
- Non Commercial (unported, 4.0) License.
By accessing the work you hereby accept the Terms. Non-commercial uses of the work are permitted
without any further permission from Dove Medical Press Limited, provided the work is properly
attributed. For permission for commercial use of this work, please see paragraphs 4.2 and 5 of our Terms.