")
Back to Journals » International Journal of Women's Health » Volume 13
Age at First Marriage and Fertility Decline in Dabat Health and Demographic Surveillance System Site, Northwest Ethiopia: Decomposition Analysis
Authors Alazbih N, Kaya AH, Mengistu M , Gelaye K
Received 13 August 2021
Accepted for publication 18 November 2021
Published 2 December 2021 Volume 2021:13 Pages 1197—1206
DOI https://doi.org/10.2147/IJWH.S334112
Checked for plagiarism Yes
Review by Single anonymous peer review
Peer reviewer comments 2
Editor who approved publication: Professor Elie Al-Chaer
Nega Alazbih,1 Assefa Hailemariam Kaya,2 Mezgebu Mengistu,3 Kassahun Gelaye4
1Department of Population Studies, University of Gondar, Gondar, Ethiopia; 2Population Studies, Addis Ababa University, Addis Ababa, Ethiopia; 3Department of Health System and Policy, Institute of Public Health, College of Medicine and Health Sciences, University of Gondar, Gondar, Ethiopia; 4Department of Epidemiology and Biostatistics, Institute of Public Health, College of Medicine and Health Sciences, University of Gondar, Gondar, Ethiopia
Correspondence: Nega Alazbih Email [email protected]
Background: Fertility decline in Ethiopia has been documented since the 1990s. Amhara National Regional State has recorded the most noticeable fertility decline. However, the specific factors that explain the incipient course of fertility decline in the study area and their relative contributions were not well investigated. Hence, the purpose of this study was to determine contributing factors of fertility decline and to assess variations in fertility that can be attributed to both changes in characteristics and reproductive behaviors of women aged 15– 49 years between 2008 and 2014 in Dabat Demographic and Health Surveillance Site, Northwest Ethiopia.
Methods: Cross-sectional censuses were carried out in a Dabat Health and Demographic Surveillance System site in 2008 and 2014. Data for 4,775 and 10,807 women of reproductive age in 2008 and 2014 were used for the analysis. A Poisson regression model was employed to assess the trends of determinants of fertility, and multivariate decomposition analysis was applied to evaluate observed changes in fertility using data from two consecutive cross-sectional censuses of Dabat HDSS.
Results: Findings indicated that there was a reduction of an average 640.69 births per 1,000 women of reproductive age during 2014 compared to 2008 in the surveillance site (95% CI=− 669.5 to − 582.4). This overall change in fertility was attributed to both the changing characteristics of women (76%) (95% CI=− 524.74 to − 453.13) and their reproductive behavior (24%) (95% CI=− 224.36 to − 79.14). Drivers of the recent fertility decline were increased age at first marriage, a decreased proportion of currently married women, shift in women’s birth to later age, and a higher women’s educational status.
Conclusion: This study indicated that the overall reduction in fertility was attributed to both changing characteristics of women and their reproductive behavior. Major contributors to the changes in fertility were postponing women’s first marriage to a later age and changes in the proportion of currently married women over the study period. Encouraging women to complete at least secondary education is important to increase the age at first marriage and birth, which will in turn accelerate the current fertility transition.
Keywords: fertility decline, decomposition, Dabat Health and Demographic Surveillance System, Ethiopia
Background
Africa continues to have the highest fertility rate in the world. Fertility rates are also significantly higher in Sub-Saharan Africa than in other sections of the continent.1,2 In sub-Saharan African countries, the total fertility rate (TFR) started to decline from 6.7 children per woman in 1970 to 5.1 in 2015.2,3 The pace of fertility decline was claimed to be slower than declines in other low-income countries. In recent decades, however, sub-Saharan Africa has become the region with the most rapid pace of fertility decline.4,5
Fertility differences among subregions in Africa are now bigger than ever because transition to replacement fertility (TFR=2.1) is slower in some sub-regions and countries.6 Compared to other regions of Africa, Southern and Northern Africa showed a relatively high fertility decline, from 6.1 and 6.8 in 1950 to 2.6 and 3.3 in 2015. However, in Western and Middle Africa, the fertility decline was low from 6.4 and 6.1 in 1950 to 5.5 and 5.9 in 2015.3 On the other hand, the same author stated that fertility in Eastern Africa has shown a modest fertility decline in the same period, from 7.1 in 1950 to 4.9 children per woman in 2015.
However, in some East African countries, fertility is still high and the decline is relatively low. For instance, in Uganda fertility declined from 6.7 in 2006 to 5.4 children per woman in 2016.7 TFR in Tanzania is also high and the decline has not been that much significant over the past decade, declining from 5.7 in 2004–05 to 5.2 children per woman in 2015–16.8 On the other hand, in Rwanda, fertility has decreased from 6.1 births per woman in 2005 to 4.2 in 2014–15, a two-child decline in a decade.9 Fertility in Kenya has also decreased from 4.9 births per woman in 2003 to 3.9 births per woman in 2014.10
Ethiopia, in the Horn of Africa, is Africa’s second most populous nation with about 115 million people in 2020.11 Ethiopia has the highest incidence rate of child marriage in the world with a median age at first marriage of 17.1 years in 2016. Contraceptive prevalence rate is among the lowest, although an increasing trend and only 36% of married women used contraceptive methods in 2016.12 The Ethiopian school system consists of 8 years of elementary education, divided into two cycles of 4 years (4+4), and 4 years of secondary education, divided into two stages of 2 years (2+2) education, including a minimum of 3-year bachelor’s degree, making a total of 15 years.13 Ethiopia is also among the countries with a high fertility decline in the past couple of decades. The Ethiopian Demographic and Health Surveys (EDHS) indicated that TFR continued to fall from 6.4 in 1990 to 4.6 children per woman in 2016.12,14 Moreover, the same source indicated regional disparities in fertility decline. TFR in Amhara Regional State, where this study took place, has declined by 28.8% over 11 years from 5.9 in 2000 to 4.2 in 2011, and further to 3.7 children per woman in 2016. TFR of the population of Dabat Health and Demographic Surveillance Site (HDSS) was 3.9 children per woman in 2012, below the regional average in that year.15
A number of studies have suggested that these fertility reductions have been associated with many factors. Fertility declines have been accompanied by changes in demographic, socioeconomic, and cultural factors which may influence attitudes regarding large family sizes.16–19 Other studies have examined factors responsible for rapid fertility decline in low-income countries, including changes in proximate determinants of fertility.20–22 All these factors could bring changes in women’s characteristics as well as in their reproductive behaviors.21,23,24
Measures of demographic processes, particularly fertility levels, have changed significantly over time and show considerable variation across populations at different points in time.25 The changes may be either due to the components attributable to differences in characteristics (education, age, residence, marital status, etc.), or a component attributable to differences in the effects of characteristics or behavioral responses.21,26
These studies, however, did not differentiate between changing characteristics of women over time and changes in reproductive behavior. Hence, the purpose of this study was to determine factors contributing to fertility decline and to assess variations in fertility between 2008 and 2014 in Dabat HDSS that can be attributed to both changes in characteristics and reproductive behaviors of women aged 15–49 years.
Methods
Study Design and Area
The study was based on data obtained from two consecutive cross-sectional censuses of Dabat HDSS conducted from February to May 2008 and from October to December 2014. Dabat HDSS is located in Dabat district, 75 Km north of Gondar and 804 Km northwest of Addis Ababa. Dabat district has a total of 26 rural and four urban kebeles (the smallest administration unit in Ethiopia). According to the 2007 census report, the district had an estimated total population of 145,458. The size of the population was projected to be 172,836 in 2015. Of these, 50.4% were female and 13% were urban inhabitants.27,28 Dabat district was initially selected purposively as a surveillance site for its unique three agro-climatic zones (lowland, midland, and highland) with altitudes ranging from about 1,000 to 2,500 meters above sea level.15 Currently, Dabat HDSS incorporates 13 kebeles. Three of these kebeles were only included in the surveillance site in 2014 and these were not included in this study. Out of the remaining ten, seven were from rural and three from urban kebeles, among which seven were from highland, one from midland, and two from lowland areas, sampled by using the probability proportional to size technique.
Study Population and Data Collection
All women of reproductive age in ten kebeles of the surveillance site were covered during the data collection period. Three kebeles, which were only included in the surveillance site in 2014, were not included in this study. Women were interviewed to collect the necessary information including demographic, socio-economic, and housing characteristics of household members, events that happened in the family, and their birth history. Data were collected using structured, pretested, and interviewer-administered questionnaires. Questionnaires for both censuses were prepared in English and later translated to Amharic and then back to English by professional translators and Public Health experts to check consistency. All interviews were carried out in the local language, Amharic, but saved in English in the database. Diploma and first-degree graduate data collectors and supervisors working in the surveillance site were recruited as interviewers. Training regarding the objective of the study, content of the questionnaires, and techniques to conduct the interviews was given. Data collectors submitted completed questionnaires to their supervisors daily to be checked for completeness and consistency. Incomplete questionnaires were returned to data collectors immediately for correction.
Data Processing and Analysis
Data on women aged 15 to 49 years were entered into the Household Registration System (HRS) version 2.1 and exported to STATA version 14 for analysis. Descriptive statistics were carried out after cleaning data inconsistencies to compute the mean number of children ever born and changes over time in the statistics of some other demographic characteristics. Children ever born was used as the outcome variable. Poisson regression Incidence Rate Ratio (IRR) with 95% confidence interval (95% CI) was used to assess the trends of association of various background characteristics with fertility. Decomposition analysis technique was also employed in identifying characteristics that may explain differences in actual fertility between 2008 and 2014. A multivariate Poisson decomposition model was employed for analysis. This method allows for the decomposition of changes over time in the levels of an outcome variable into those due to differences in observable characteristics (endowments) and those due to different effects of these characteristics (coefficients). The technique also partitions the two components into portions that represent the unique contribution of each predictor to each of the two components in a detailed decomposition.26 The 2014 census was considered for the sake of comparison, while the 2008 data were taken as reference. A negative coefficient for a covariate indicates the expected reduction in the variation of children ever born between the two census periods. The assumptions of Poisson regression were checked using the likelihood ratio test of over-dispersion parameter alpha by running the same regression model using negative binomial distribution. And when the assumptions were fulfilled, ie, the means and variances of the response were about the same, there was no more variation in the response than the model implies. All statistical significances of associations were determined at 0.05 level of significance.
Results
Demographic and Socio-Economic Characteristics
The study included a total of 4,775 women of reproductive age in 2008 and 10,807 in 2014. Numbers of women in each age group have increased, particularly in the 15–19 years age group, which increased enormously from 11.4% in 2008 to 27.6% in 2014. This may be due to the high numbers of young female migrants from the surrounding rural areas as the urban centers and secondary schools and Technical & Vocational Education & Training colleges in the district are located in the surveillance site. In the study area, 75.8% of women in 2008 and 62% in 2014 were rural residents, showing a declining trend. The proportion of women of reproductive age who desired to bear another child has shown a significant reduction from about 63% to 30% in the period 2008 to 2014. The percentage of women who got married before the age of 18 was still high, at 86% in 2014. Moreover, the proportion of women with at least a primary level of education increased from 20.5% to 51.3%, whereas women with no formal education decreased from 79.5% in 2008 to 48.7% in 2014. Regarding marital status, the percentage of single and divorced and widowed women increased from 2.8% in 2008 to 30% in 2014 and from 11% to 15%, whereas currently married women decreased from 86% in 2008 to 55% in 2014. The proportion of women who used any contraceptive method showed no change in both censuses, at approximately 19% (Table 1).
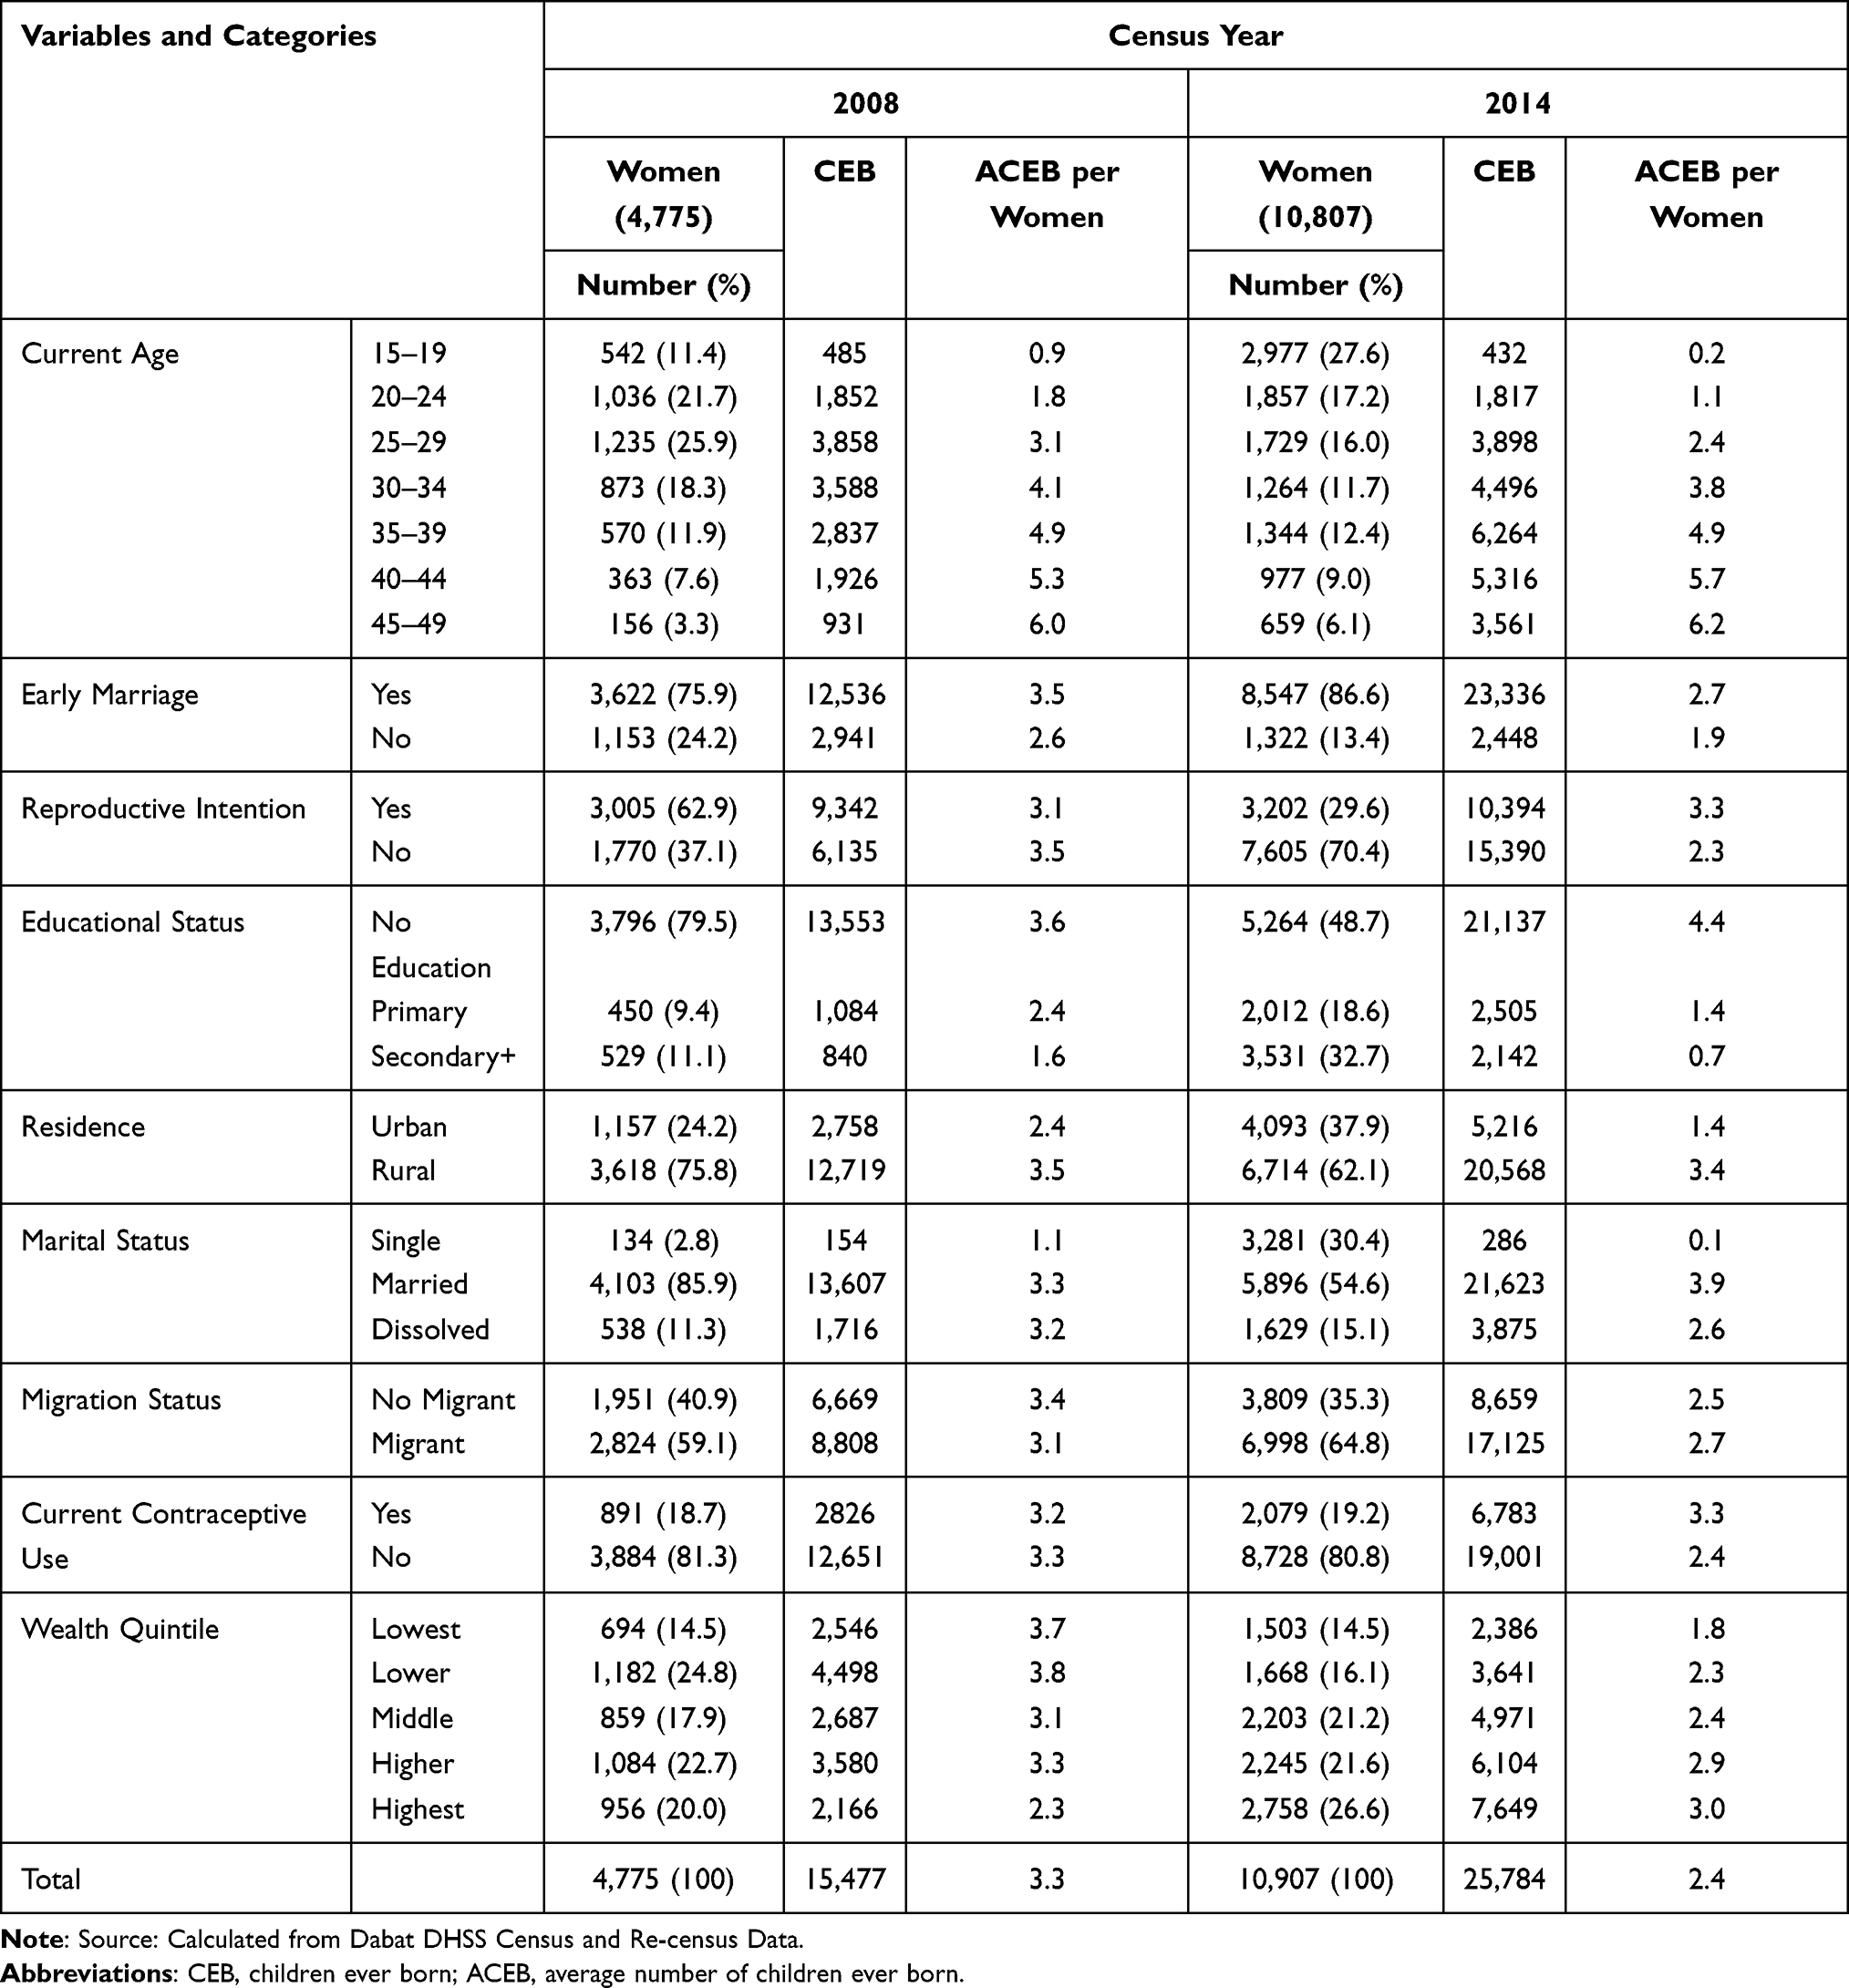 |
Table 1 Distribution of Women and Number of Children Ever Born by Demographic and Socioeconomic Characteristics of Women Aged 15–49 in Dabat HDSS, 2008–2014 |
The mean number of children ever born to women of reproductive age decreased from 3.3 in 2008 to 2.4 in 2014, while the average number of children in the age group 45–49 was higher and slightly increased from 6.0 to 6.2, but showed a decreasing trend among younger age groups. The average number of children ever born was high among women who had the desire to continue bearing children, those with no formal education, rural residents, currently married, married early, and those who currently used contraceptive methods during both censuses. In addition, during the study period, the mean number of children ever born showed a declining trend in all wealth quintiles except for the richest, showing a slight increase. The last census also indicated that the average number of children of women of reproductive age increased with the improvement of their wealth status (Table 1).
Factors Associated with Fertility Levels
Current age of women, age at first marriage, educational status, marital status, reproductive intentions, and residence were significant predictors of fertility changes in both censuses.
Current age of women had a significant influence on the fertility status of women in the study area. In both censuses, there was a gradual rise in the number of children with increased women’s age. Educational status is also significantly and negatively correlated with fertility. Women with high school or higher education had lower risk of having higher fertility compared to those without formal education in 2008 (AIRR=0.79; 95% CI=0.72–0.86) and 2014 (AIRR=0.64; 95% CI=0.61–0.68). On the other hand, women with primary education did not have a significant difference from those with no formal education in 2008 (AIRR=0.98; 95% CI=0.91–1.04), but showed a significant negative association with fertility in 2014 (AIRR=0.90; 95% CI=0.86–0.95). Women whose age at first marriage was ≥18 had lower fertility in 2008 (AIRR=0.77; 95% CI=0.74–0.80) and 2014 (AIRR=0.74; 95% CI=0.70–0.77) compared with women whose age at first marriage was <18, the minimum legal age for marriage in Ethiopia (Table 2).
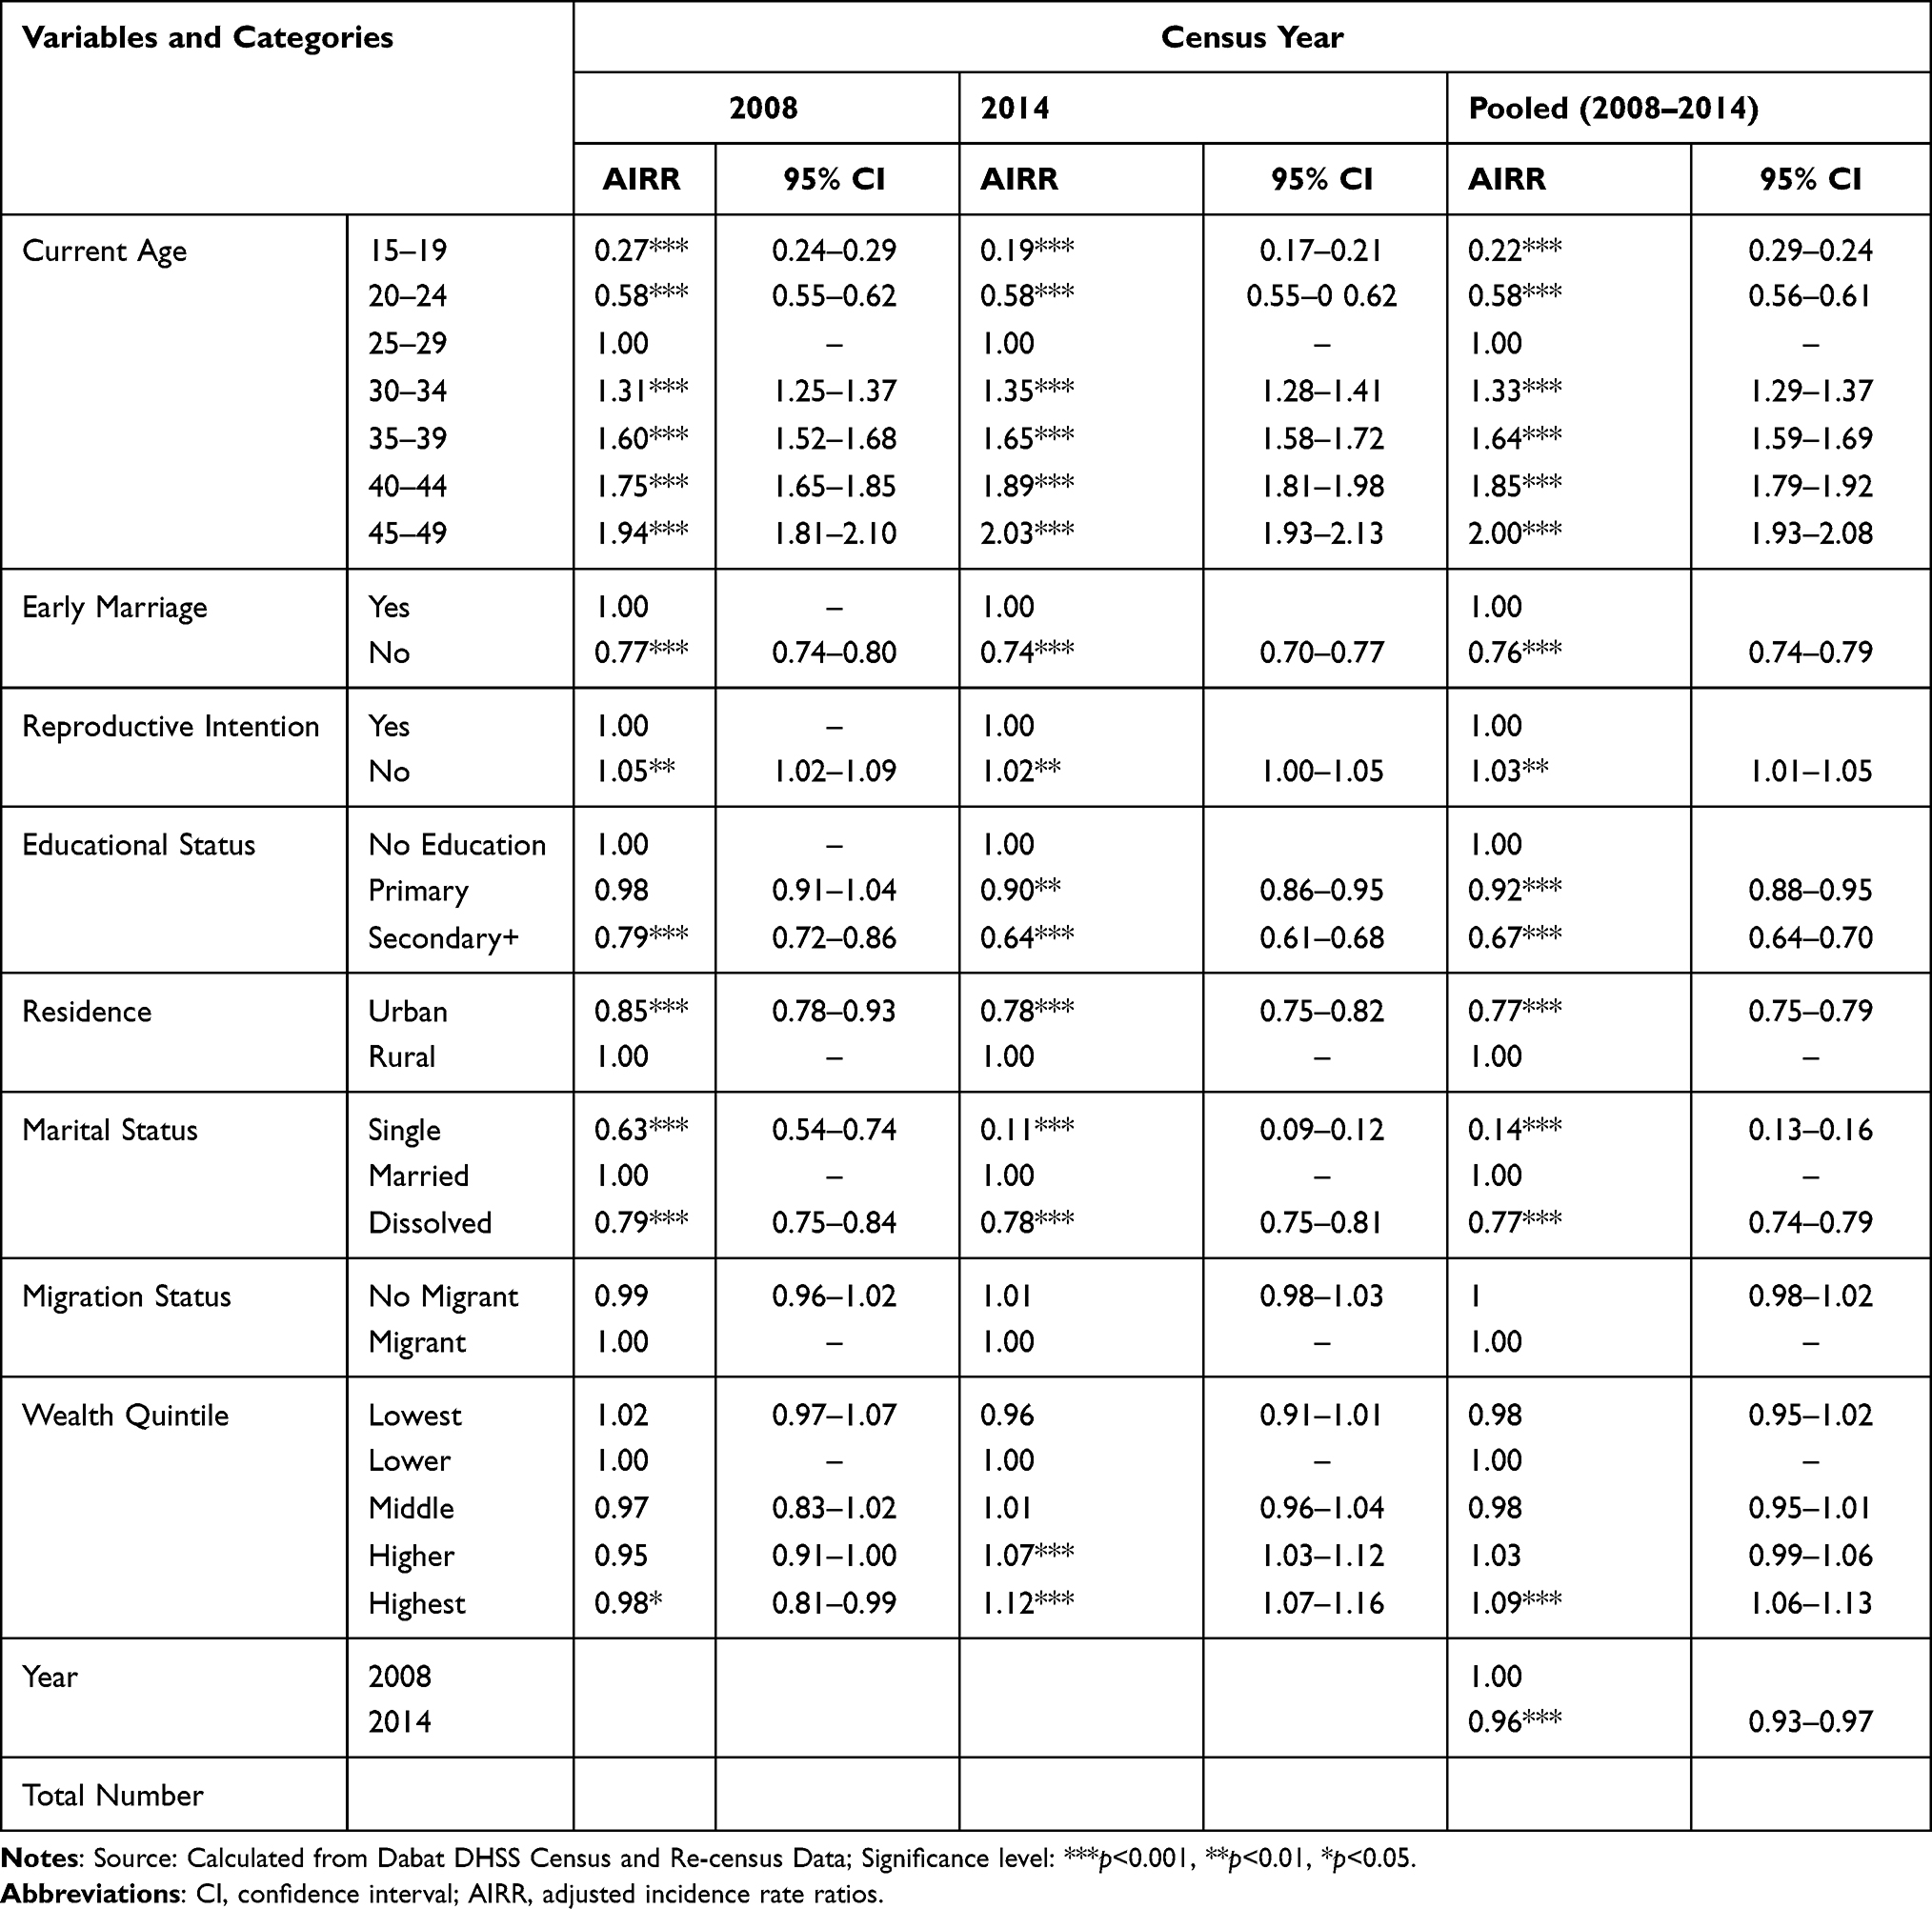 |
Table 2 Multivariate Analysis of Determinant Factors Among Women of Reproductive Age in Dabat HDSS, 2008–2014 |
Compared to currently married women, those who were never married or were divorced or widowed had lower numbers of births in both censuses. Regarding residence, women who lived in urban areas had lower fertility in 2008 (AIRR=0.85; 95% CI=0.78–0.93) and in 2014 (AIRR=0.78; 95%=CI 0.75–0.82) compared to those in rural areas. Women who had no intention to give birth in the future had more births in 2008 (AIRR=1.05; 95% CI=1.02–1.09) and in 2014 (AIRR=1.02; 95% CI=1.00–1.05) compared to those who had the intention to give birth. Women with the highest wealth status had a lower number of births in 2008 (AIRR=0.98; 95% CI=0.81–0.99), but higher numbers in 2014 (AIRR=1.12; 95% CI=1.07–1.16) compared with those who had lower wealth status (Table 2).
Results from the pooled data also showed that current age, age at first marriage, educational status, place of residence, marital status, and reproductive intention were significantly associated with fertility among women of reproductive age in the decade. The census year variables also revealed that fertility was lower in 2014 (AIRR=0.96; 95% CI=0.93–0.97) compared with 2008 (Table 2).
Decomposition of Fertility Decline
There was a reduction of an average 640.69 births (95% CI=−669.5 to −582.4) per 1,000 women of reproductive age during 2014 compared to 2008 in the HDSS. This overall change in fertility between 2008 and 2014 was attributed to both changing characteristics of women and reproductive behavior. The results showed that 488.94 births (95% CI=−524.74 to −453.13) per 1,000 women were attributable to differences in characteristics of women (76.3%), whereas the remaining 151.75 births (95% CI=−224.36 to −79.14) per 1,000 women were explained by changes in the reproductive behavior of women (23.7% coefficient) between 2008 and 2014 (Table 3).
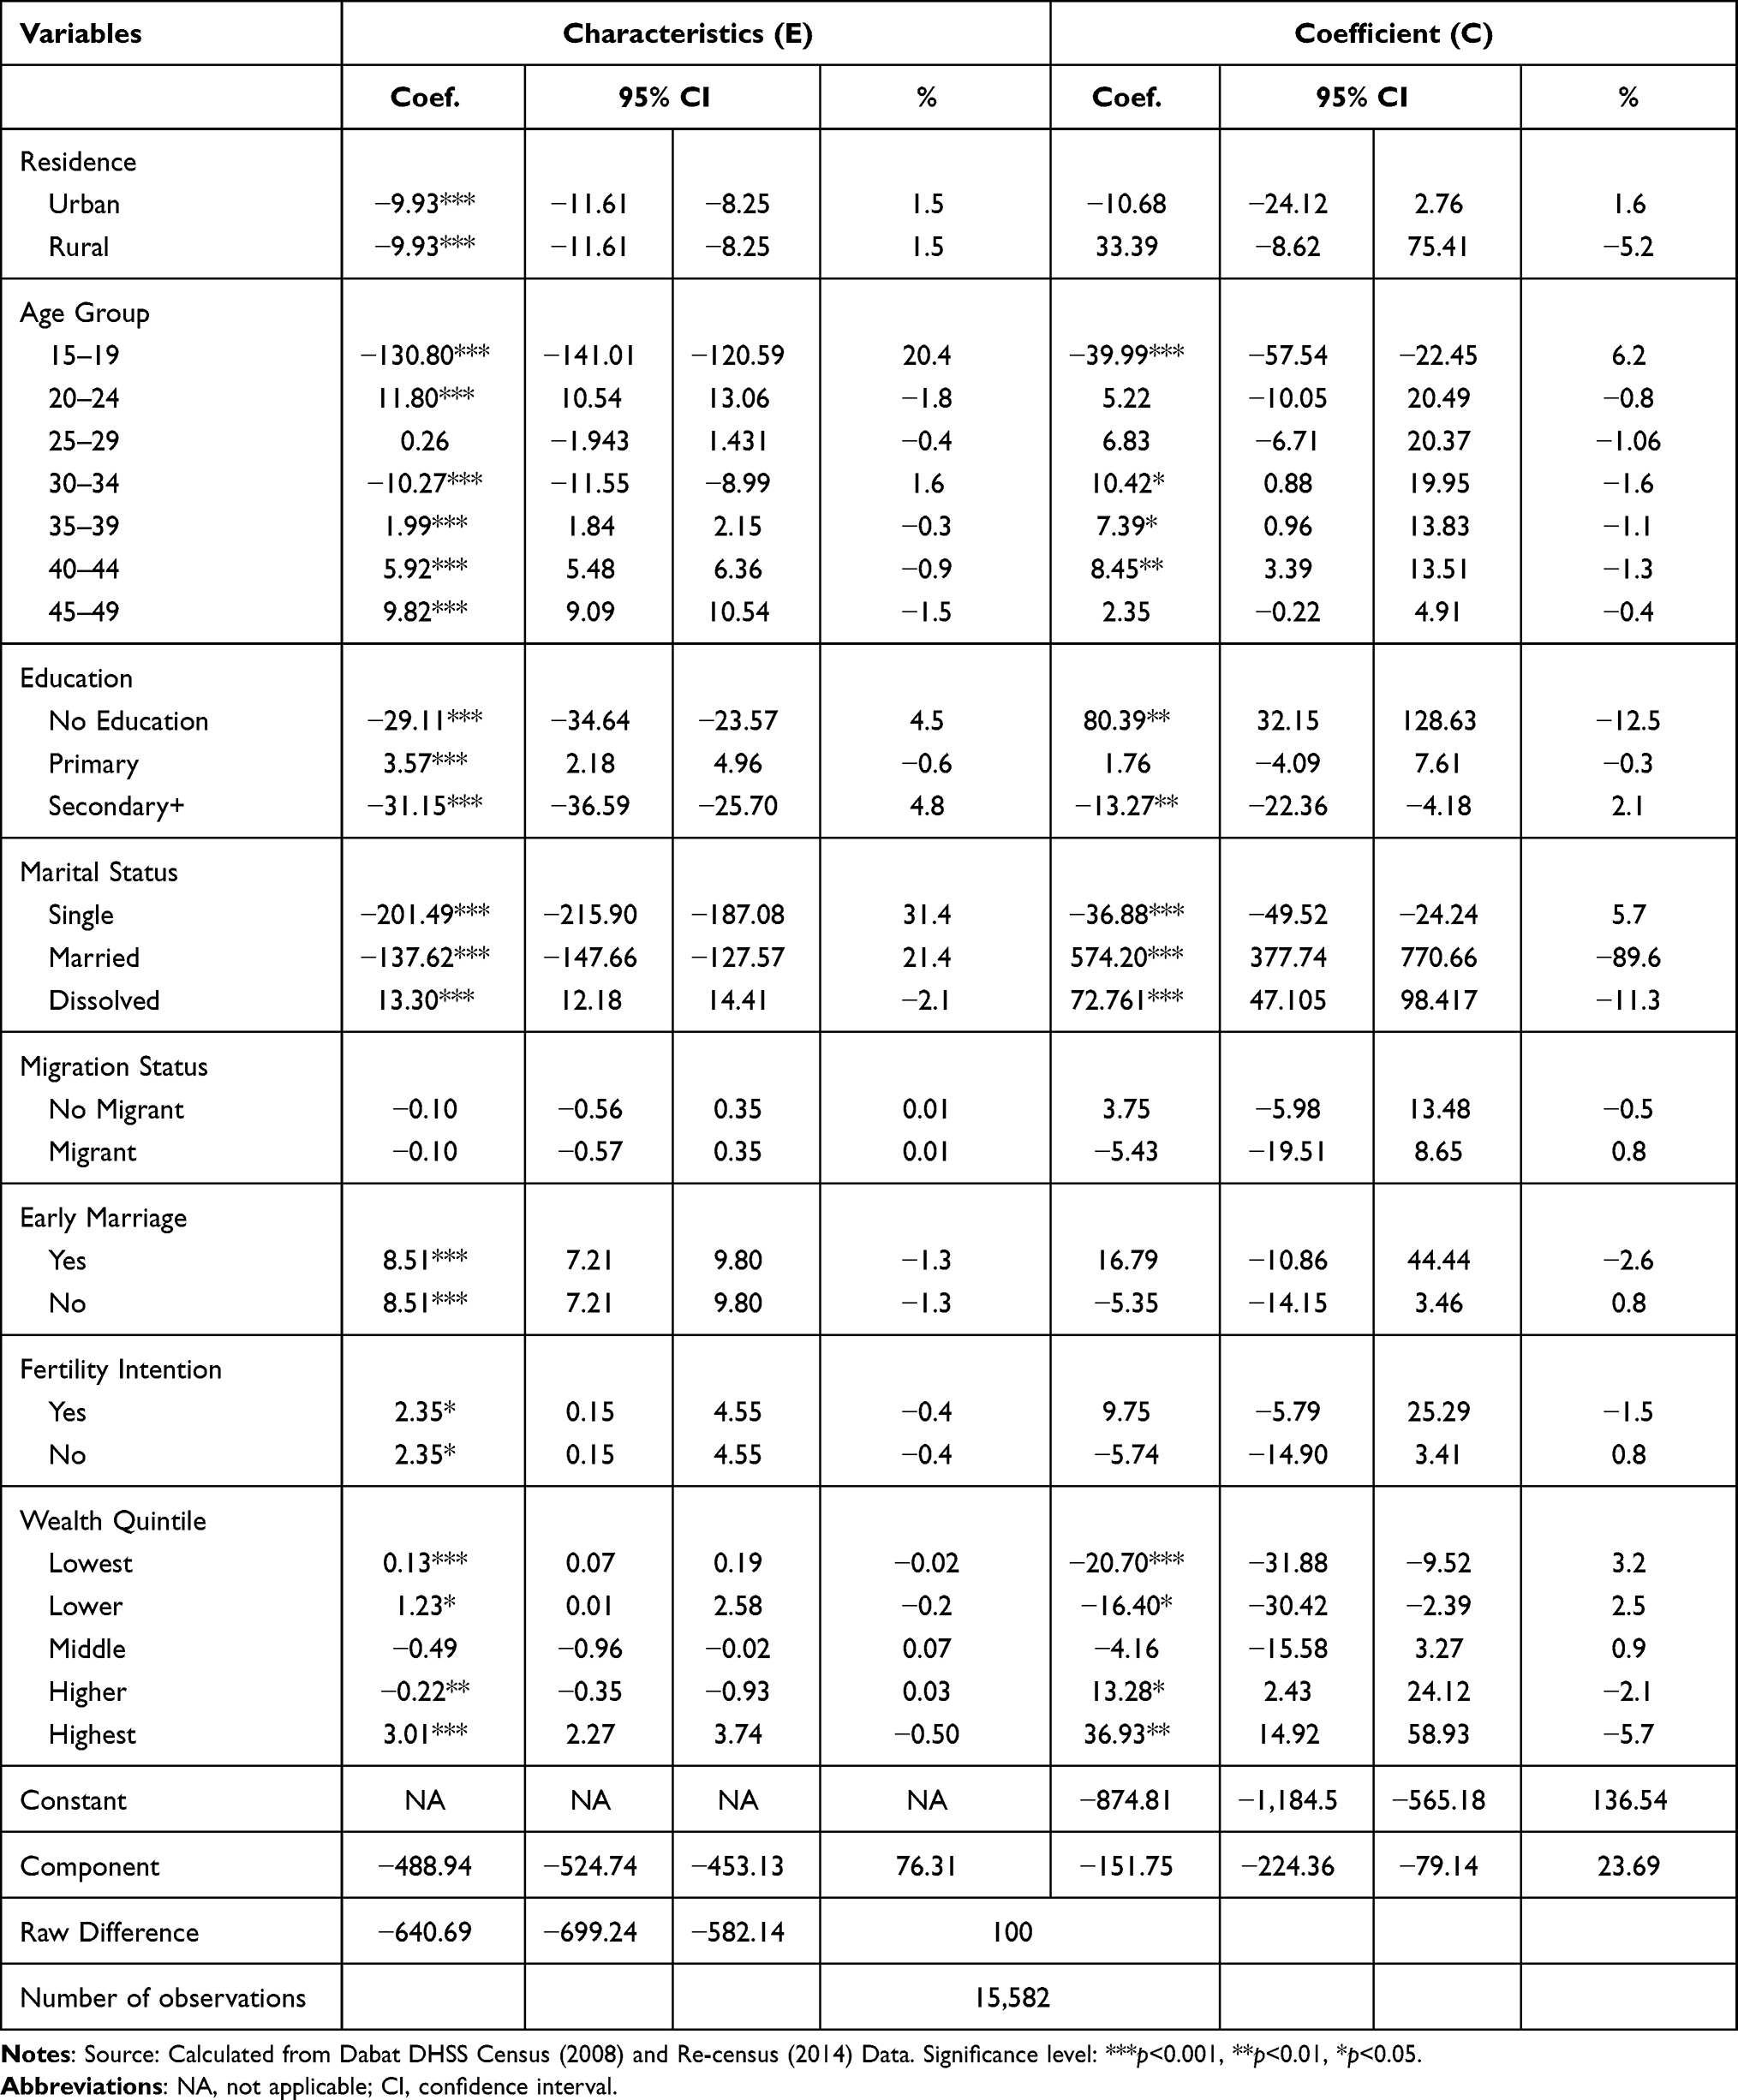 |
Table 3 Decomposition of the Decline of Children Ever Born in Dabat HDSS, 2008–2014, Northwest Ethiopia |
Under the characteristic’s component, the larger proportion of the discrepancy was attributed to postponement of marriage to a later age or to remain single, which contributed 201.49 births (95% CI=−215.90 to −187.08) per 1,000 women (31.4%). The decline in the proportion of currently married women observed in the comparison period also resulted in an average reduction of 137.62 births (95% CI=−147.66 to −127.57) per 1,000 women (21.4%). Postponing birth to a later age has also contributed 130.80 births (95% CI=−141.01 to −120.59) per 1,000 women (20.4%). A decrease in the proportion of women without formal education contributed 29.11 births (95% CI=−34.64 to −23.57) per 1,000 women (4.5%) to the fertility decline and an increase in the proportion of women whose educational attainment was secondary and above contributed 31.15 births (95% CI=−36.56 to −25.70) per 1,000 women (4.8%) to fertility decline (Table 3).
On the other hand, under the coefficient component, the change of women’s reproductive behavior was mainly attributed to postponing birth to later age among young women (6.2%): 39.99 (95% CI=−54.54 to −22.45) births per 1,000 women; postponing first marriage (5.7%): 36.88 births (95% CI=−49.52 to −24.24) per 1,000 women, and higher women’s education with secondary and higher (2.1%) contributed 13.27 births (95% CI=−22.36 to −4.18) per 1,000 women to fertility decline. Women with the lowest (coef=20.70; 95% CI=−31.88 to −9.52) and lower (coef=16.40; 95% CI=−30.42 to −2.39) wealth status also contributed 5.7% to fertility decline (37 births per 1,000 women) in 2014 (Table 3).
Discussion
Significant fertility decline was observed during the study period. The detailed decomposition analysis outlined the overall contributions of determinants to the observed reduction of an average 641 children ever born per 1,000 women during 2014 compared with 2008. This was attributable to both the change in characteristics of women and their reproductive behavior. Major drivers of the recent fertility decline were the increased observed in the age at first marriage, the decrease in the proportion of currently married women, the shift in women’s birth to later age, and the improvement in women’s educational status.
A decline in the average number of CEB was observed during the study period. Mean CEB of women of reproductive age decreased from 3.3 children in 2008 to 2.4 in 2014, whereas the average number of children at the end of reproductive age (45–49 years) showed a slight increase from 6.0 in 2008 to 6.2 children in 2014. This was similar to another study in Amhara National Regional State in northwest Ethiopia using DHS.29
Significant predictors of the determinants of fertility trends were revealed in both 2008 and 2014 censuses. Current age had a strong effect on fertility, in which older women were more likely to have higher numbers of CEB in both 2008 and 2014 censuses compared to younger women. This is supported by similar studies.30–33 Adolescent fertility was nearly absent during the latter census, indicating a shift in the average age of the first pregnancy. Postponement of births to later age and changes in age structure have great contributions to the observed fertility reduction between the two censuses. Several studies have shown that postponement of childbirth to later ages leads to fertility reduction, since women would have fewer years of a reproduction window.30,32–35
Education was also significantly associated with fertility. Women with secondary or higher education had lower fertility compared with women without formal education in both censuses. Our decomposition analysis is supported by previous studies.18,36–38 Increased attainment of higher level education could have delayed marriage, increased desire for small families, and adoption of contraceptive methods.39
The decline in the proportion of currently married women also contributed to the reduction of women’s fertility by changing women’s characteristics. This result is similar to other studies that indicated the reduction of fertility, because women enter into unions at older ages and an increasing proportion of single women with very low premarital fertility.40 Low premarital fertility might be a reflection of negative social sanctions associated with out-of-wedlock births. These shifts in union formation to a later age are commonly attributed to women’s increasing levels of education, greater participation in wage employment, and the development of alternative roles for women outside marriage and motherhood.41
Nowadays in low-income countries, poor people have the same desired fertility even though they tend to have a lower number of births compared to their wealthy compatriots.42 Our study revealed that women in the higher wealth quintiles had a higher number of births in 2014 compared with those in the lower wealth quintiles. This might be attributed to the increasing severe economic difficulties that may initiate women not to give birth, consistent with a study from Tanzania.43
Strengths and Limitations
The strength of this study is that our analysis is based on census data which provides accurate information on fertility for many subdivisions of the population, which is not subject to sampling error, and that the findings can be transferable to areas with similar contexts of Amhara National Regional State that have similar cultural profiles. In addition, multivariate decomposition analysis enabled us to observe changes in reproductive behavior and shifts in the socio-demographic composition of the population. This analysis also partitions changes in outcomes over time into components attributable to changing characteristics and reproductive behavior of women, portioning the unique contribution. The limitation of the study is that we did not determine cause–effect relationships, because we used cross-sectional surveys.
Conclusion
In this study, the reduction in fertility was explained by both differences in characteristics of women and changes in response to behavior between the two census periods. Major drivers of the recent fertility decline in the study area were increased age at first marriage, a decreased proportion of currently married women, the shift in women’s births to later age, and the increase in women’s educational status. Among the other factors of the observed decline in fertility, postponement of women’s first marriage to a later age contributed most. Hence, encouraging women to complete at least secondary education might be important to increase age at first marriage and birth, and then speeding up the current fertility transition.
Abbreviations
HDSS, Health and Demographic Surveillance Site; TFR, total fertility rate; EDHS, Ethiopia’s Demographic and Health Survey; ANRS, Amhara National Regional State; CEB, children ever born.
Data Sharing Statement
Data are available at Dabat Research Center with the permission of the Institute of Public Health at the University of Gondar.
Ethical Considerations
Dabat HDSS has obtained ethical clearance from the Health Research Ethics Review Committee (HRERC) of the University of Gondar. A formal letter was written to the local district administrative and health offices. Informed consent was also obtained from eligible women. The right of the respondent to withdraw from the interview or not to participate at all was informed and respected. All data was anonymized, and identifiers were excluded to ensure confidentiality of the participants. The authors have also obtained an ethical clearance from the Health Research Ethics Review Committee (HRERC) of the University of Gondar for further analysis of the 2008 and 2014 census data conducted in Dabat HDSS site.
Acknowledgments
The authors express their gratitude to Dabat Research Center for providing the data. We also gratefully acknowledge and appreciate Mr. Tariku Dejenie from Addis Ababa University for his technical support in STATA and for giving comments on the first version of this article.
Funding
The authors wish to thank the University of Gondar for funding this study. The funding body was not involved in the design of the study and collection, analysis, and interpretation of data and in writing the manuscript.
Disclosure
The authors declare that they have no competing interests.
References
1. Garenne M, Joseph V. The timing of the fertility transition in Sub-Saharan Africa. World Dev. 2002;30(10):1835–1843. doi:10.1016/S0305-750X(02)00069-4
2. Shapiro D, Hinde A. On the pace of fertility decline in sub-Saharan Africa. Demogr Res. 2017;37(1):1327–1338. doi:10.4054/DemRes.2017.37.40
3. United Nations: Department of Economic and Social Affairs. World population prospects the 2017 revision. 2017.
4. United Nations: Department of Economic and Social Affairs. Fertility levels and trends as assessed in the 2012 revision of world population prospects. 2013.
5. United Nations: Department of Economic and Social affairs. World fertility report [highlights]. 2017.
6. Bongaarts J, Casterline J. Fertility transition: is sub-Saharan Africa different? Popul Dev Rev. 2013;38(SUPPL.1):153–168. doi:10.1111/j.1728-4457.2013.00557.x
7. Uganda Bureau of Statistics (UBOS) and ICF. Uganda Demographic and Health Survey 2016. Kampala, Uganda and Rockville, Maryland, USA: UBOS and ICF; 2018.
8. MoHCDGEC, MoH, NBS, OCGS, and ICF. Tanzania Demographic and Health Survey and Malaria Indicator Survey. MoHCDGEC, MoH, NBS, OCGS, and ICF; 2016.
9. National Institute of Statistics of Rwanda (NISR) [Rwanda], Ministry of Health (MOH) [Rwanda] and I, International. Rwanda demographic and health survey 2014–15 final report. 2016.
10. Kenya National Bureau of Statistics. Kenya demographic and health survey. 2014.
11. Population Reference Bureau. The world population data sheet; 2020. Available from: https://www.prb.org/wp-content/uploads/2020/07/letter-booklet-2020-world-population.pdf.
12. Central Statistical Agency [Ethiopia] & ICF International. Ethiopia Demographic and Health Survey 2016. Addis Ababa, Ethiopia and Calverton, Maryland, USA: Central Statistical Agency and ICF International; 2017.
13. Lasonen J, Kemppainen R, Raheem K. Education and Training in Ethiopia: An Evaluation of Approaching EFA Goals. Institute for Educational Research; 2005:87.
14. Central Statistical Agency [CSA] & ORC Macro. Ethiopia 2000 Demographic and Health Survey. Addis Ababa, Ethiopia and Calverton, Maryland, USA: Central Statistical Agency and ORC Macro; 2001.
15. University of Gondar. Profile of Dabat Health and Demographic Surveillance System/Dabat Research Center. University of Gondar; 2012.
16. Shreffler KM, Nii-Amoo Dodoo F. The role of intergenerational transfers, land, and education in fertility transition in rural Kenya: the case of Nyeri district. Popul Environ. 2009;30(3):75–92. doi:10.1007/s11111-009-0077-1
17. Watkins SC. Local and foreign models of reproduction in Nyanza province, Kenya. Popul Dev Rev Dev Rev. 2000;26:725–759. doi:10.1111/j.1728-4457.2000.00725.x
18. Westoff CF, Bietsch K, Koffman D. Indicators of trends in fertility in Sub-Saharan Africa [AS34]. 2013.
19. Adhikari R. Demographic, socio-economic, and cultural factors affecting fertility differentials in Nepal. BMC Pregnancy Childbirth. 2010;10. doi:10.1186/1471-2393-10-19
20. Anyara EL, Hinde A. Fertility transition in Kenya: a regional analysis of the proximate determinants. 2005.
21. Ariho P, Kabagenyi A, Nzabona A. Determinants of change in fertility pattern among women in Uganda during the period 2006–2011. Fertil Res Pract. 2018;4(1):1–11. doi:10.1186/s40738-018-0046-4
22. Ahmed Shallo S. Roles of proximate determinants of fertility in recent fertility decline in Ethiopia: application of the revised bongaarts model. Open Access J Contracept. 2020;11:33–41. doi:10.2147/OAJC.S251693
23. Rutayisire PC, Hooimeijer P, Broekhuis A. Changes in fertility decline in Rwanda: a decomposition analysis. Int J Popul Res. 2014;2014:1–10. doi:10.1155/2014/486210
24. Alazbih NM, Tewabe GN, Demissie TD. Contraception and fertility transition in AMHARA National Regional State of Ethiopia: an application of BONGAARTS’ model. Fertil Res Pract. 2017;3:1–11.
25. Bongaarts J, Watkins SC. Social interactions and contemporary fertility transitions. Popul Dev Rev. 1996;22(4):639. doi:10.2307/2137804
26. Powers DA, Yoshioka H, Yun M-S. mvdcmp: multivariate decomposition for nonlinear response models. Stata J. 2011;11:556–576. doi:10.1177/1536867X1201100404
27. Amhara Finance and Economic Development Bureau. Development Indicators of Amhara National Regional State, 2014/2015. Bahr Dar, Ethiopia: BoFED; 2016.
28. Central Statistical Agency. The 2007 Population and Housing Census of Ethiopia, Results for ANRS. Addis Ababa, Ethiopia: CSA; 2010.
29. Gteachew Nibret NM. Components of the recent fertility decline in Amhara National Regional State, Ethiopia: a decomposition analysis of Ethiopia demographic and health survey. ERJSSH. 2016;3(2). http://erjssh-uog.org/index.php/ERJSSH/article/view/67/39
30. Alene GD, Worku A. Differentials of fertility in North and South Gondar zones, northwest Ethiopia: a comparative cross-sectional study. BMC Public Health. 2008;8(1). doi:10.1186/1471-2458-8-397
31. Bhargava A. Desired family size, family planning and fertility in Ethiopia. J Biosoc Sci. 2021;39(3):367–381. doi:10.1017/S0021932006001593
32. Fitaw Y, Berhane Y, Worku A. Impact of child mortality and fertility preferences on fertility status in rural Ethiopia. East Afr Med J. 2004;81(6):300–306. doi:10.4314/eamj.v81i6.9179
33. Gebremedhin S, Betre M. Level and differentials of fertility in Awassa Town, Southern Ethiopia. Afr J Reprod Health. 2009;13(1):93–112.
34. Transitional Government of Ethiopia. The national population policy of Ethiopia. Addis Ababa, Ethiopia. 1993.
35. Bongaarts J, Zimmer Z. Living arrangements of older adults in the developing world: an analysis of demographic and health survey household surveys. J Gerontol. 2002;57(3):S145–S157. doi:10.1093/geronb/57.3.S145
36. Bagavos C, Tragaki A. Descriptive finding the compositional effects of education and employment on Greek male and female fertility rates during 2000–2014. Demogr Res. 2017;36:1435–1452. doi:10.4054/DemRes.2017.36.47
37. Mekonnen W, Worku A. Determinants of fertility in rural Ethiopia: the case of Butajira Demographic Surveillance System (DSS). BMC Public Health. 2011;11(1):1–6. doi:10.1186/1471-2458-11-782
38. Shakya KGB. Factors contributing to fertility decline in Nepal. J Popul Soc Stud. 2016;1:13–29.
39. United Nations EC for Africa. Food security and sustainable development division (FSSDD) (2001–12), the state of demographic transition in Africa, Addis Ababa. 2001.
40. Lindstrom DP, Woubalem Z. The demographic components of fertility decline in Addis Ababa, Ethiopia: a decomposition analysis. Genus. 2003;59(3/4):147–158.
41. Cohen B. The emerging fertility transition in sub-Saharan Africa. World Dev. 1998;26(8):1431–1461. doi:10.1016/S0305-750X(98)00058-8
42. Gurmu E, Mace R. Fertility transition driven by poverty the case of Addis Ababa (Ethiopia). 1994:1–34.
43. Mturi AJ, Hinde A. Fertility levels and differentials in Tanzania. 2001.
 © 2021 The Author(s). This work is published and licensed by Dove Medical Press Limited. The full terms of this license are available at https://www.dovepress.com/terms.php and incorporate the Creative Commons Attribution - Non Commercial (unported, v3.0) License.
By accessing the work you hereby accept the Terms. Non-commercial uses of the work are permitted without any further permission from Dove Medical Press Limited, provided the work is properly attributed. For permission for commercial use of this work, please see paragraphs 4.2 and 5 of our Terms.
© 2021 The Author(s). This work is published and licensed by Dove Medical Press Limited. The full terms of this license are available at https://www.dovepress.com/terms.php and incorporate the Creative Commons Attribution - Non Commercial (unported, v3.0) License.
By accessing the work you hereby accept the Terms. Non-commercial uses of the work are permitted without any further permission from Dove Medical Press Limited, provided the work is properly attributed. For permission for commercial use of this work, please see paragraphs 4.2 and 5 of our Terms.