Back to Journals » Diabetes, Metabolic Syndrome and Obesity » Volume 15
Aerobic Exercise Training Improves Microvascular Function and Oxidative Stress Parameters in Diet-Induced Type 2 Diabetic Mice
Authors Lino Rodrigues K, Vieira Dias Da Silva V, Nunes Goulart da Silva Pereira E ![]() , Rangel Silvares R, Peres de Araujo B, Eduardo Ilaquita Flores E, Ramos IP, Pereira Borges J
, Rangel Silvares R, Peres de Araujo B, Eduardo Ilaquita Flores E, Ramos IP, Pereira Borges J ![]() , Fernandes-Santos C, Daliry A
, Fernandes-Santos C, Daliry A
Received 22 March 2022
Accepted for publication 30 June 2022
Published 28 September 2022 Volume 2022:15 Pages 2991—3005
DOI https://doi.org/10.2147/DMSO.S365496
Checked for plagiarism Yes
Review by Single anonymous peer review
Peer reviewer comments 4
Editor who approved publication: Professor Ming-Hui Zou
Karine Lino Rodrigues,1 Vivian Vieira Dias Da Silva,1 Evelyn Nunes Goulart da Silva Pereira,1 Raquel Rangel Silvares,1 Beatriz Peres de Araujo,1 Edgar Eduardo Ilaquita Flores,1 Isalira Peroba Ramos,2 Juliana Pereira Borges,3 Caroline Fernandes-Santos,1,4 Anissa Daliry1
1Laboratory of Cardiovascular Investigation, Oswaldo Cruz Institute, FIOCRUZ, Rio de Janeiro, RJ, Brazil; 2National Center of Structural Biology and Bio-imaging, Federal University of Rio de Janeiro, Rio de Janeiro, RJ, Brazil; 3Laboratory of Physical Activity and Health Promotion, University of Rio de Janeiro, Rio de Janeiro, RJ, Brazil; 4Department of Basic Sciences, Federal Fluminense University, Nova Friburgo, RJ, Brazil
Correspondence: Anissa Daliry, Laboratory of Cardiovascular Investigation, Oswaldo Cruz Institute, FIOCRUZ, Pavilhão Ozorio de Almeida Av. Brasil, 4365 (Room 14), Manguinhos, Rio de Janeiro, RJ, CEP: 21040-900, Brazil, Tel +55 212562-1312, Email [email protected]
Purpose: Type 2 diabetic (T2D) patients have liver and adipose tissue microcirculation disturbances associated with metabolic dysfunction and disease progression. However, the potential role of aerobic training on hepatic and white adipose tissue (WAT) microcirculation and the underlying mechanisms have not been elucidated to date. Therefore, we investigated the role of aerobic training on liver and WAT microcirculation and AGE-RAGE modulation in T2D mice.
Methods: The control group (CTL) was fed standard chow, and T2D was induced by feeding male C57BL/6 a high-fat, high-carbohydrate diet for 24 weeks. In the following 12 weeks, mice underwent aerobic training (CTL EX and T2D EX groups), or were kept sedentary (CTL and T2D groups). We assessed metabolic parameters, biochemical markers, oxidative damage, the AGE-RAGE axis, hepatic steatosis, hepatic stellate cells activation (HSC) and liver and WAT microcirculation.
Results: Hepatic microcirculation was improved in T2D EX mice which were associated with improvements in body, liver and fat mass, blood pressure, hepatic steatosis and fibrosis, and decreased HSC and AGE-RAGE activation. In contrast, improvement in WAT microcirculation, that is, decreased leukocyte recruitment and increased perfusion, was associated with increased catalase antioxidant activity.
Conclusion: Physical training improves hepatic and adipose tissue microcirculatory dysfunction associated with T2D, likely due to downregulation of AGE-RAGE axis, decreased HSC activation and increased antioxidant activity.
Keywords: microcirculation, physical training, AGE-RAGE, hyperglycemia
Introduction
Type 2 diabetes (T2D) is a common term for heterogeneous metabolic disorders, and its main characteristic is hyperglycemia.1 It is characterized by insulin resistance, and is closely associated with obesity. T2D is strongly associated with metabolic disturbances in several tissues, including the liver, leading to the development of non-alcoholic fatty liver disease (NAFLD).2 NAFLD, more recently called metabolic dysfunction-associated fatty liver disease (MAFLD),3 is found in up to 70% of T2D patients, and is responsible for accelerating disease progression.4,5 Further, as the disease progresses, the risk of developing macrovascular and microvascular complications increases.6 We have shown that type 1 diabetic (T1D) rats have liver microcirculatory dysfunction, which can be prevented by oral hypoglycemic agents.7 We also showed that NAFLD is closely related to hepatic microcirculatory abnormalities, such as increased leukocyte recruitment and decreased hepatic microvascular blood flow.8–10 Furthermore, patients with T2D have disturbances in adipose tissue microcirculation, which is associated with obesity, insulin resistance, hyperglycemia, and dyslipidemia.11,12
Advanced glycation end-products (AGEs) are proteins or lipids non-enzymatically altered by the action of reducing sugars. AGEs are produced throughout life and increase under conditions such as oxidative stress and hyperglycemia and several studies suggest that AGEs play a role in diabetes-related complications.13,14 For instance, AGEs promote intracellular and extracellular dysfunction through their ability to bind collagen and other extracellular matrix proteins irreversibly and by binding its receptor, RAGE.15,16 AGE-RAGE binding activates genes involved in oxidative stress, inflammation, thrombosis, and leukocyte recruitment16. Therefore, the AGE-RAGE axis is involved in the pathogenesis and progression of vascular dysfunction in T2D.
Non-pharmacological interventions, such as diet and exercise training can prevent or delay T2D progression and its associated comorbidities17–20 by improving insulin sensitivity, glycosylated hemoglobin, glycemic parameters, lipid profile, blood pressure, and body fat.21,22 In T2D/obese mice, exercise training reduced hepatic steatosis, the expression of lipogenic genes and liver inflammation, regardless of body adiposity, and increased the phosphorylation of acetyl-CoA-carboxylase and oxidative genes, reversing complications caused by T2D in the liver.23 Furthermore, during exercise, skeletal muscles act as endocrine-like organs, producing myokines and exerting a multiorgan effect on contractile and non-contractile tissues, including liver and adipose tissue.24 Several molecular and metabolic mechanisms seem to be involved in the benefic effects of exercise on T2D, but the underlying mechanisms contributing to improvements of microcirculation function remain unclear. A possible role of the AGE-RAGE pathway was recently discussed, but the data are still controversial.25–28
Therefore, we aimed to investigate the effects of aerobic training on hepatic and adipose tissue microcirculation in diabetic C57BL/6 mice. We hypothesize that the underlying mechanism for improving microcirculation by aerobic training involves the modulation of the AGE-RAGE pathway, HSC downregulation and oxidative stress.
Materials and Methods
Study Design and Animals
Male C57BL/6 (8 weeks old) mice were obtained from the central animal care facility of Oswaldo Cruz Foundation (RJ, Brazil) and kept in standard cages at controlled room temperature (22 ± 1 °C) and 12-h light-dark cycle (darkness starting at 6 pm). They were allocated into two groups: control mice (CTL) receiving a commercial grain-based diet (Nuvilab-Quimtia) and diabetic mice (T2D) receiving a high-carbohydrate high-fat diet (HCHF) and 25% fructose in the drinking water ad libitum (Figure 1A). The HCHF diet comprised a modified grain-based diet consisting of 55% fat, 35% carbohydrate.29 After 24 weeks, mice were further divided into four groups based on exercise: CTL (control diet without physical exercise, n=10), CTL EX (control diet and physical exercise, n=10), T2D (HCHF diet plus 25% fructose without physical exercise, n=10), and T2D EX (HCHF diet plus 25% fructose physical exercise, n=10). Mice underwent hepatic ultrasound, echocardiogram and microcirculatory analysis 24h after the last exercise session, whereas systolic blood pressure and oral glucose tolerance test (OGTT) were assessed 48h after the last exercise session. After an overnight fast, hepatic and adipose tissue microcirculation was assessed in anesthetized mice (ketamine hydrochloride 100 mg/kg and xylazine 10 mg/kg, I.P.), blood was collected by cardiac puncture, and the liver, heart, visceral, and subcutaneous WAT depots harvested. Blood serum was obtained by centrifugation (700 × g for 15 min at 4 °C) and aliquots were stored at −80 °C for subsequent analysis. The Animal Welfare Committee of the Oswaldo Cruz Foundation approved all experiments protocols (license L-0012/18 A1), which were performed following the principles for the care and use of laboratory animals.
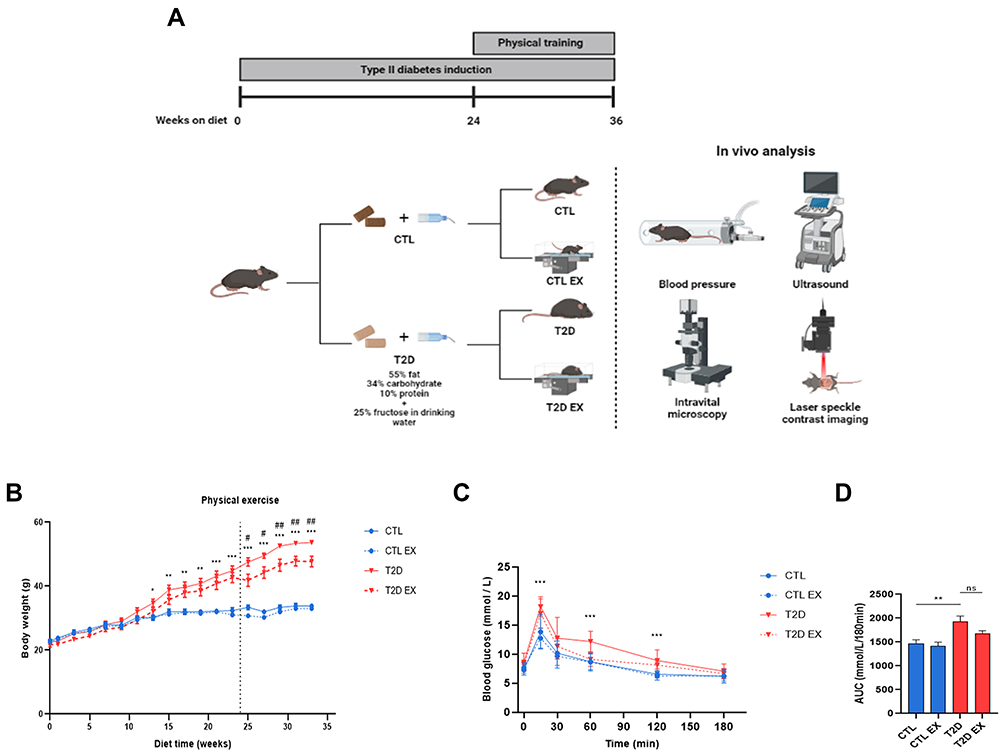 |
Figure 1 Effect of physical exercise on hemodynamic and metabolic parameters in type 2 diabetes (T2D) mice. Study design (A) C57BL/6 mice were randomly divided into 4 groups: sedentary control group (CTL), which received a grain-based diet throughout the experiment; the sedentary type 2 diabetic group, which had access to a high-carbohydrate, high-fat diet throughout the experiment (T2D); the physical exercise control group, which received normal chow and underwent a physical exercise protocol (30 min session, 3 times per week, 12 weeks)(CTL EX); and the physical exercise type 2 diabetic group, which had access to a high-carbohydrate, high-fat diet and underwent the same physical exercise protocol (T2D EX). At the end of the 36-week protocol, mice underwent in vivo analysis, including systolic blood pressure analysis, liver ultrasonography, as well as liver and adipose tissue microcirculation assessments by in vivo microscopy and laser speckle contrast imaging. The following parameters are shown: body weight during experimental protocol (B), serum glucose levels during the oral glucose tolerance test (OGTT) (C) and AUC (D) of the CTL, CTL EX, T2D, and T2D EX groups. *P < 0.05 T2D vs CTL; **P < 0.01 T2D vs CTL; ***P < 0.001 T2D vs CTL; #P < 0.05 T2D vs T2D EX; ##P < 0.01 T2D vs T2D EX. Figure 1A created with BioRender.com. |
Maximal Exercise Capacity
Animals were first acclimated to treadmill walking (Hectron Fitness Equipment, Brazil) through one session of 15 min at 12 m/min for three consecutive days in the 23rd week of study. In the 24th week, the maximal exercise capacity test was performed on a treadmill at progressive speed until exhaustion (10 m/min increased by 3 m/min every 3 min). Exhaustion was determined when the animal could no longer maintain the pace and remained in the shock grid at the end of the mat for at least 5 s. Exercise intensity was determined based on the maximum speed reached during the test.30,31 At the 30th week, mice underwent a second test to adjust the exercise training intensity (data not shown).
Physical Exercise
The physical exercise began in the 24th week of diet feeding and lasted 12 weeks. Animals were exercised in the morning (8 am to 12 am) on a treadmill (Hectron Fitness Equipment, Brazil) with 0% incline, three times per week, with 30 min per session, at 80% of the maximal speed reached in the maximal exercise capacity test (~75 to 80% of maximal oxygen uptake). This intensity has been previously demonstrated as capable in restoring cardiac microvascular rarefaction in obese animals with metabolic syndrome.31
Blood Pressure
Non-invasive blood pressure measurements were performed on the mouse tail by photoplethysmography with automatic data acquisition (Insight, Brazil). Before the first measurement, animals were adapted to the restraint container to minimize stress and blood pressure fluctuations. The measurement protocol began with prior warming the animals to a temperature of 36 °C for 5 min. Mice were then placed in the device to measure systolic blood pressure, and the result was expressed as the average of three measurements.32
Cardiac and Liver Ultrasound
Mice were anesthetized using 2% isoflurane, subjected to abdominal epilation, and placed in the supine position on a heated table. Ultrasonography was performed using a sound-conducting gel (Carbogel, Brazil) applied to the middle abdomen, and the VEVO 770 system (VisualSonics, Canada) connected to a 30 MHz transducer. Ejection fraction, fractional area change, stroke volume, end diastolic and systolic volume were evaluated during the echocardiogram. The liver ultrasound assessed the echogenicity of the liver parenchyma. All measurements were determined by a single observer who was blinded to the study design.33,34
Intravital Microscopy
The left lateral lobe of the liver and epididymal fat pad were exteriorized by laparotomy followed by microcirculation analysis. A monitor displayed the images for analysis using a 10x objective for intravital microscopy (Olympus BX150WI, EUA). To examine the interaction between leukocytes and the endothelium, the number of labeled leukocytes (0.3 mg/kg rhodamine 6G, i.v.) rolling or adhering to the sinusoidal and postsinusoidal venules were counted. Leukocytes were counted for 30s in a 170 μm2 area. Leukocytes with a velocity less than that of blood flow were classified as rolling, and those that remained stationary were classified as adherent cells.35,36
Laser Speckle Contrast Imaging (LSCI)
LSCI (Pericam System PSI, Sweden) assessed liver and epididymal fat microvascular blood flow.37 LSCI provides a microcirculation perfusion index corresponding to the average blood cell concentration and velocity, while assessing microvascular blood flow in real time.10 Mice were kept on a stable platform in a room with a constant temperature of 25 °C and placed under a laser light system with an image contrast wavelength of 785 nm to measure continuous blood perfusion using the surgical technique used for intravital microscopy. Blood perfusion was measured and expressed in arbitrary perfusion units (APUs).
Oral Glucose Tolerance Test (OGTT)
At the end of 36 weeks, glucose (2 g/kg) was administered by orogastric gavage after 6 h of fasting. Tail blood glucose levels were measured using an automated glucose monitor (Roche, Brazil) before glucose and 15, 30, 60, and 120 min after oral glucose administration.38
Insulin Quantification and Homeostasis Model Assessment-Estimated Insulin Resistance (HOMA-IR)
Plasma insulin levels were measured using an enzyme-linked immunosorbent assay (ELISA) kit (Millipore, USA), following the manufacturer’s instructions. HOMA-IR calculations was based on the following equation: fasting blood glucose (mmol/l) × fasting insulin (μU/mL)/ 22.5.7
Histopathology
The left lateral liver lobe sample were collected, fixed (formalin 4% w/v, 0.1 M phosphate buffered, pH 7.2), and processed according to routine histological procedures. The samples were then embedded in paraffin and sectioned at 5 μm thickness. Sections were stained with hematoxylin and eosin (H&E) and observed under a light microscope (Nikon Instruments, USA) to evaluate steatosis. Digital images were analyzed using the stereological method of point counting to estimate volume density (STEPanizer stereology tool, version 1.0, USA).39,40 Masson’s trichrome was used to detect and evaluate fibrosis via collagen quantification using ImageJ (ImageJ, USA).41
Biochemical Evaluation
Serum total cholesterol, HDL, LDL, triglycerides, ALT and AST activity, and hepatic total cholesterol and triglycerides were measured and analyzed spectrophotometrically using commercial kits (Bioclin, Brazil). Liver samples (50 mg) were homogenized in 1 mL of isopropanol and centrifuged at 2000 × g for 10 min for lipid extraction, and cholesterol and triglyceride were determined in the supernatant.42
Advanced Glycation/Lipoxidation End Product (AGE/ALE) Levels
Liver, fat, and serum fluorescent AGEs were quantified using the Nakayama method.8,10,43 Sample fluorescence was measured against blank (0.1N NaOH) at an emission wavelength of 440 nm and an excitation wavelength of 370 nm using a SpectraMax M5 ELISA microplate reader (Molecular Devices, USA). One fluorescence unit was equivalent to the fluorescence intensity of 1 mg/mL of native bovine serum albumin (BSA) and expressed as arbitrary units (AU).
Nitrite (NO2−) Concentration
Nitrite concentration was measured using Griess reagent (Sigma, EUA), according to the manufacturer’s instructions. Samples were homogenized in an ice bath by a buffer solution of 10 mM Tris-HCl, pH 7.4, 2% polyvinylpolypyrrolidone (PVPP) (w/v), and centrifuged at 15,000 × g for 10 min at 4 °C. After, 100 μL of the solution was mixed 1:1 with modified Griess reagent in a 96-well microplate and incubated at room temperature for 15 min in the dark. Absorbance was measured at 540 nm using a microplate reader (Molecular Devices, USA). NO2 concentration was calculated using a standard curve prepared with sodium nitrite (NaNO2) dissolved in 10 mM Tris-HCl (pH 7.4).44
Thiobarbituric Acid Reactive Substance (TBARS)
Liver and fat oxidative damage were determined by quantifying the thiobarbituric acid reactive substance (TBARS), using a spectrophotometric method based on malondialdehyde (MDA) concentration, a product of lipid peroxidation. Tissue was homogenized in butylated hydroxytoluene (BHT) (final concentration 0.2%) in cold phosphate–buffered saline (PBS, pH 7.4). Each tube was sealed and incubated at 96 °C for 30 min after adding an equal volume of 0.67% thiobarbituric acid (Sigma, USA) to the samples (0.5 mL). For spectrophotometric measurements, 200 μL of each sample was measured at 535 nm using a SpectraMax Plus Reader (Molecular Devices, USA). Malondialdehyde values (MDA, ε = 1.56×10⁵ M−1cm−1) were used to calculate the results.45
Superoxide Dismutase (SOD) and Catalase (CAT) Antioxidant Activity
SOD activity was determined by monitoring the inhibition of epinephrine autooxidation (Sigma, USA) using a spectrophotometer (Molecular Devices, USA) at a wavelength of 530 nm.46 CAT activity was measured spectrophotometrically (Molecular Devices, USA) by decreasing the concentration of hydrogen peroxide (H2O2) (Sigma, USA). For this purpose, measurements were performed for 3 min at 30 °C at a wavelength of 230 nm.47
Western Blot
Western blotting assessed the liver and WAT RAGE protein expression. All primary antibodies were purchased from Santa Cruz Biotechnology (Santa Cruz, CA, USA). Liver and WAT samples were homogenized in lysis buffer (20 mM Trizma, 137 mM NaCl, 10% glycerol, 1% Nonidet P-40, 2 mM EDTA) and centrifuged at 14,000 × g for 45 min at 4 °C. Protein content was determined by the bicinchoninic acid method (Thermo Scientific, USA), and BSA (Sigma, USA) as a standard. Next, 30 μg of protein per lane was resolved on a 12% sodium dodecyl sulfate gel and transferred to a PVDF membrane (Bio-Rad Laboratories, Germany). After 5% BSA blocking, membranes were incubated overnight at 4 °C with the primary antibodies (1:500), and a secondary RDye 680RD donkey anti-goat antibody was used for detection. Finally the bounded complex was detected using an Odyssey Infrared Imaging System (Li-Cor, USA). Images were analyzed using Image Studio Lite version 4.0.21 software (Li-Cor, USA) to obtain integrated intensities, which were normalized to GAPDH as the internal control (Fitzgerald Industries International, USA), followed by a secondary IRDye 800CW anti-mouse anti-goat antibody (Li-Cor, USA).
Immunohistochemistry
Immunohistochemistry for liver alpha smooth muscle actin (α-SMA) was performed to determine hepatic stellate cells (HSC) activation. Deparaffinized sections were treated with 3% H2O2 and then blocked with 5% nonfat dry milk and 5% BSA. Sections were then washed with PBS and incubated overnight in a humidified chamber at 4 °C with a primary monoclonal antibody against mouse α-SMA (1:500, sc-32251, Santa Cruz Biotechnology, USA). The slides were washed in PBS and treated with a biotinylated secondary antibody, followed by incubation with streptavidin peroxidase. Diaminobenzidine (DAB) was used as the chromogen. The slides were counterstained with Mayer’s hematoxylin. The ImageJ software was used for immunostaining quantification (ImageJ, USA).
Statistical Analysis
Data are reported as mean ± SEM. The normal distribution of variables was tested using the Shapiro–Wilk test and confirmed by Q-Q plots. Comparisons between groups were made by two-way analysis of variance (ANOVA) and Bonferroni post hoc test (GraphPad InStat 8.0, USA). The Pearson correlation coefficient was used to analyze the association between AGE levels and metabolic, laboratory, cardiac, and microcirculatory parameters (R Studio, version 4.0.2). Statistical significance was set at P < 0.05.
Results
Effect of Physical Exercise on the Metabolic Profile Induced by T2D
Metabolic parameters were assessed in sedentary and trained control (CTL) and T2D mice (Figure 1A). TD2 EX mice exhibited a lower physical capacity than CTL EX (Supplementary Table 1). During the first 24 weeks, T2D mice showed a gradual increase in body weight (BW) compared with CTL (Figure 1B). However, at 36 weeks, T2D mice undergoing physical training showed decreased BW compared to CTL mice (Figure 1B). Furthermore, we observed that T2D mice displayed glucose intolerance assessed by OGTT (Figure 1C and D) and a higher OGTT area under the curve (Figure 1D) than CTL mice. We also observed hyperglycemia, insulin resistance, hepatomegaly, and decreased HDL cholesterol in T2D mice compared to CTL mice, which was not observed in the T2D EX group (Table 1). T2D and T2D EX had increased insulin, total cholesterol, LDL, liver cholesterol, liver triglycerides, AST activity, and subcutaneous and visceral fat depots compared to CTL and CTL EX groups (Table 1). ALT (Table 1) and heart weight (Table 2) were not altered among groups. Increased systolic blood pressure observed in T2D mice was reverted by exercise training (Table 2). Echocardiography showed that T2D mice had a reduced stroke volume and ejection fraction compared to CTL mice, which were not affected by physical training (Table 2).
 |
Table 1 Effect of Physical Training on Metabolic Parameters in T2D Mice |
 |
Table 2 Effect of Physical Training on Cardiac Parameters in T2D Mice |
Effect of Physical Exercise on T2D-Induced Hepatic Steatosis
T2D mice showed expressive liver steatosis (Figure 2A and B), as evidenced by both small and large intracellular lipid vesicles, indicating the presence of mixed microvesicular, and macrovesicular steatosis. Steatosis was accompanied by hepatic fibrosis (Figure 2A and C) and an increase in the echogenicity of hepatic parenchyma compared to CTL mice (Figure 2D). Exercise reduced hepatic steatosis and fibrosis of T2D mice by 4.9% and 691%, respectively (Figure 2A and C).
 |
Figure 2 Effect of physical exercise on liver steatosis and fibrosis in type 2 diabetes (T2D) mice. Representative images of liver samples stained with hematoxylin and eosin and Masson’s trichrome (A) quantitative assessment of liver steatosis (B) and fibrosis (C); ultrasound analysis of the liver (D) in the sedentary/exercised control mice (CTL/CTL EX) and in the sedentary/exercised type 2 diabetic mice (T2D/T2D EX). **P < 0.01; ***P < 0.001. |
Effect of Physical Exercise on Hepatic and Adipose Microcirculatory Disturbances Associated with T2D
T2D mice showed increased leukocyte rolling and adhesion in the liver and adipose tissue microcirculation, as evidenced by intravital microscopy and LSCI (Figure 3A–D). Furthermore, basal hepatic and adipose tissue microvascular blood flow was decreased in T2D mice compared to CTL mice (Figure 3E–H). Increased activation of HSCs was found in T2D mice compared to CTL, as evidenced by the decrease in the number of vitamin A-positive cells and increased expression of α-SMA protein in the liver tissue (Figure 3I–L). Physical training reversed all microcirculatory abnormalities associated with T2D (Figure 3A–L).
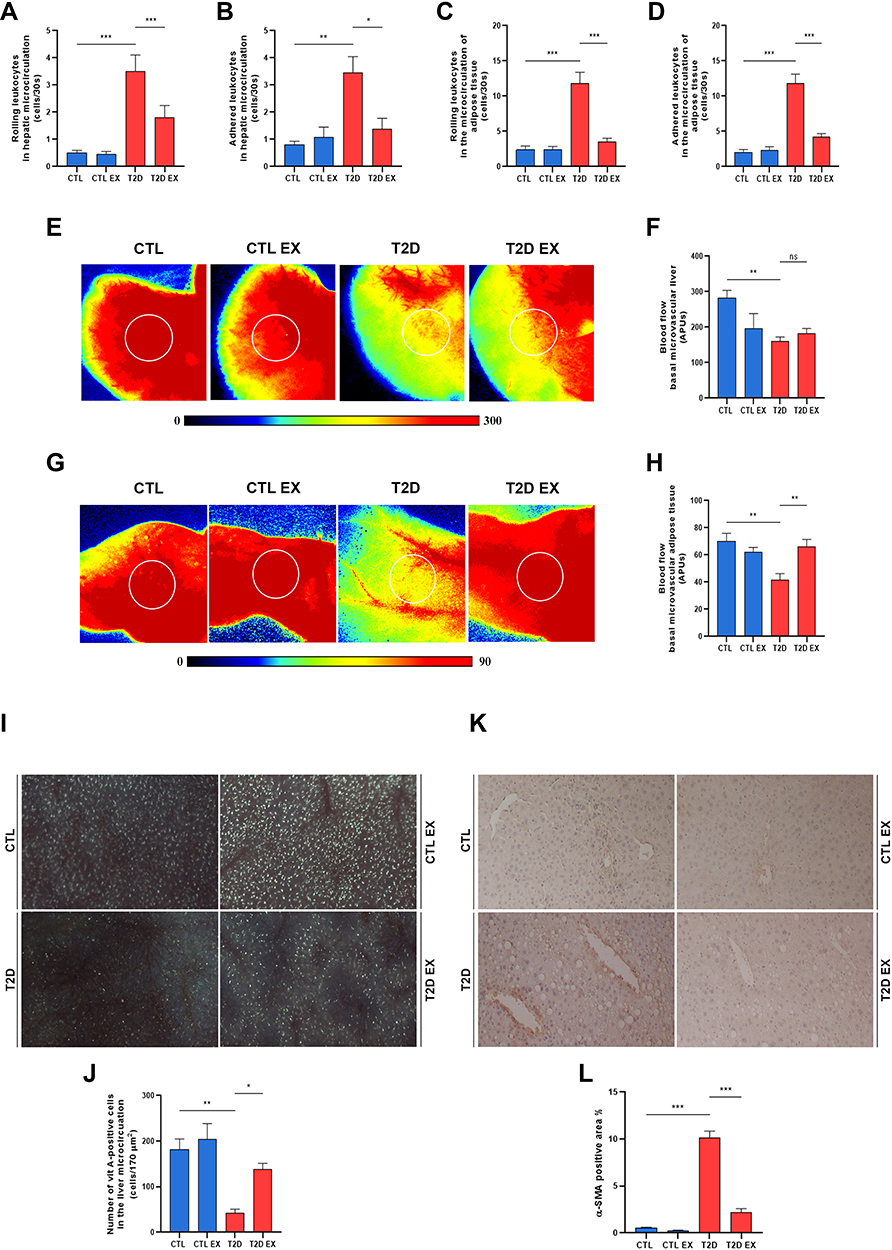 |
Figure 3 Effect of physical exercise on the microcirculatory changes in type 2 diabetes (T2D). Quantification of leukocyte bearing and adhesion in the microcirculation of the liver (A and B) and adipose tissue (C and D). Representative images of hepatic and fat tissue microvascular blood flow evaluated by laser speckle contrast imaging (LSCI) and the setting of the region of interest (ROI, white circle) (E and F). Liver and adipose tissue microcirculatory basal blood flow by LSCI expressed as arbitrary perfusion units- APU (E and H). Representative images and quantification of vitamin A-positive cells (I and J), and the percentage of α-SMA expression in the hepatic tissue (K and L) of sedentary/exercised control (CTL/CTL EX) and sedentary/exercised type 2 diabetic mice (T2D/T2D EX) groups. *P < 0.05; **P < 0.01; ***P < 0.001. |
Role of Physical Exercise on Oxidative Damage and AGE Levels in T2D-Induced Mice
T2D and T2D EX mice showed an increase in hepatic lipid peroxidation, evidence by increased MDA levels (Figure 4A), and increased antioxidant enzyme catalase activity (Figure 4C) and nitrite levels (Figure 4J) compared to those in the CTL mice. Liver and adipose tissue SOD enzyme activity (Figure 4B and E, respectively), adipose tissue MDA (Figure 4D), and serum and adipose tissue AGE levels (Figure 4G and I, respectively) were similar among groups. T2D showed an increase of 68% in hepatic AGE deposition and of 100% in RAGE protein expression compared to CTL group, which was negatively modulated by physical training (Figure 4H and K, respectively). CAT activity in the adipose tissue increased in T2D mice compared to CTL, as well as in T2D EX compared with that in T2D mice (Figure 4F).
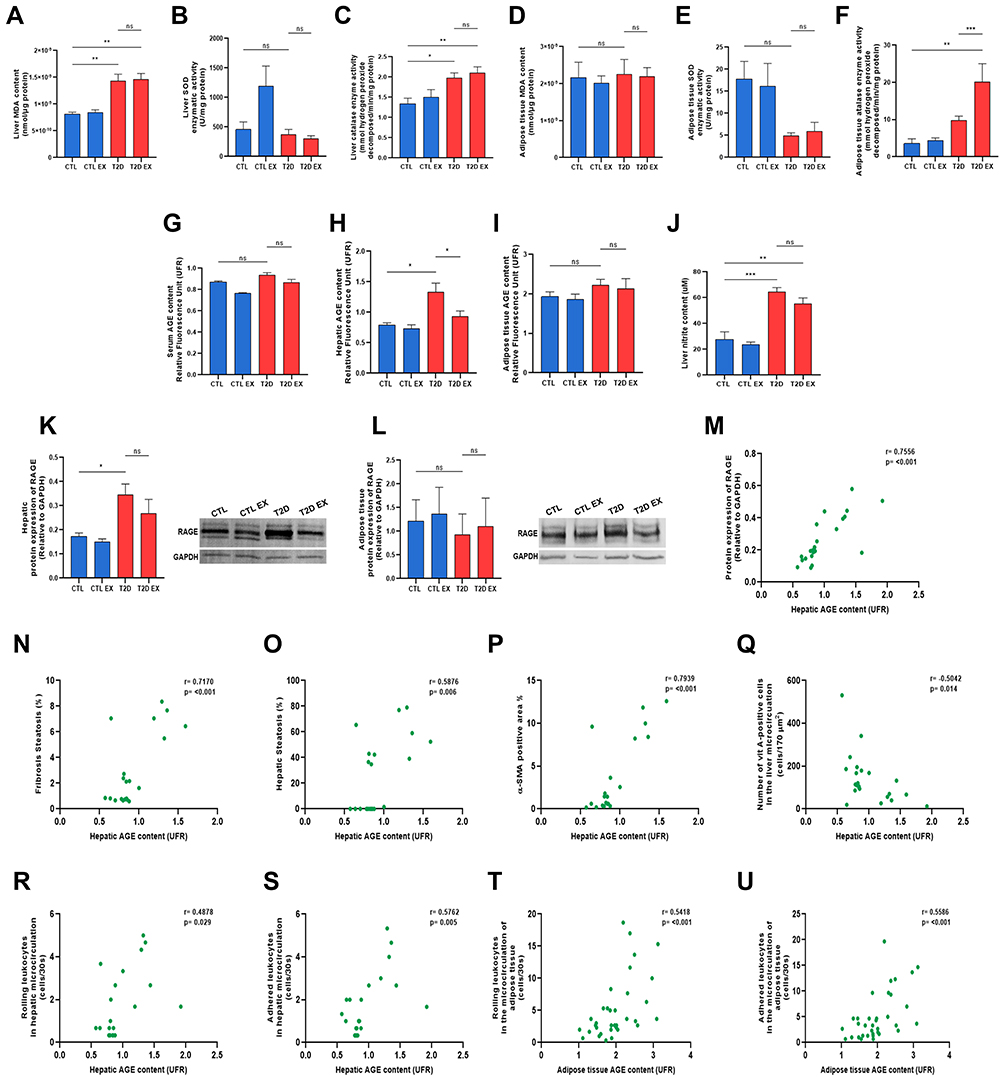 |
Figure 4 Effect of physical exercise on oxidative damage and the AGE-RAGE pathway in T2D mice. Quantification of thiobarbituric acid reactive species, malondialdehyde levels (MDA), the enzymatic activity of superoxide dismutase (SOD), and the enzymatic activity of catalase (CAT) in the liver (A–C) and adipose tissue (D–F). Quantification of fluorescent AGE levels in the serum, liver and adipose tissue (G–I). Levels hepatic nitric oxide (NO) by quantification of nitrite (J), and protein expression of RAGE in the liver and adipose tissue (K and L) of sedentary/exercised control (CTL/CTL EX), sedentary/exercised type 2 diabetic mice (T2D/T2D EX) groups. Pearson´s correlation analyses between hepatic AGEs and protein expression of RAGE, hepatic fibrosis, hepatic steatosis, α-SMA expression in the liver, vitamin A-positive cells and hepatic microcirculatory parameters (M–U). *P < 0.05; **P < 0.01; ***P < 0.001. |
The correlations between hepatic AGE levels and metabolic and microcirculatory parameters was assessed. A strong positive correlation was observed between liver AGE and liver fibrosis, α-SMA-positive area, and RAGE expression (Figure 4N, P, and M). Further, a moderate positive correlation was found between liver AGE, and liver steatosis, leukocyte rolling and adhesion (Figure 4O, R, and S). Finally, a moderate negative correlation was observed between hepatic AGE levels and vitamin A-positive cells (Figure 4Q). In adipose tissue, a moderate positive correlation was observed between AGE levels and microcirculatory parameters (Figure 4T and U).
Discussion
In the present study, we investigated the effect of aerobic exercise on the metabolic and microcirculatory abnormalities in a mouse model of T2D induced by an HCHF diet and fructose, as well as its underlying mechanistic features, including modulation of the AGE-RAGE pathway and oxidative stress. To do so, we developed a preclinical model of T2D reflecting the clinical signs of the disease, as C57BL/6 mice fed a HCHF and fructose for 36 weeks exhibited obesity (increased fat depots and body weight), hypertension, impaired glucose metabolism, insulin resistance, and cardiac dysfunction. In addition, as T2D is closely associated with liver complications,48,49 we examined the liver parameters of mice fed an HCHF diet and observed hepatic steatosis, fibrosis, increased AST, and hepatomegaly. Further, HCHF-fed mice showed increased serum and liver cholesterol and triglyceride levels. The observed metabolic, hemodynamic, and cardiac abnormalities indicate that 36-week HCHF-fed C57BL/6 mice are a reliable preclinical model for studying T2D-associated complications.
Similar to previous studies,50–52 12 weeks of aerobic exercise training reduced body weight, blood pressure, liver steatosis, and fibrosis in T2D mice. However, our exercise training protocol did not affect glucose metabolism, insulin resistance, adiposity, lipid profile, cardiac function and liver enzymes, which may be due to the low volume of the exercise training presently adopted. Some authors argue that the benefits of exercise training on these outcomes mainly depend on exercise training volume, understood as the interaction between frequency and duration of exercise.53,54 For instance, Machado et al demonstrated that unlike training five times per week, training three times a week did not improve insulin resistance and adiposity in rats with metabolic syndrome.31 Furthermore, it is well established that the mainstay of treatment for metabolic diseases remains lifestyle modification associated with diet and physical training.55 Hence, interventions combining diet and physical training are more effective than the same interventions alone.56 Our data corroborate these findings, and suggest that low-volume training without dietary intervention is not able to restore glucose metabolism, insulin resistance, cardiac function and adiposity in T2D mice.
In our preclinical model of T2D, we observed increased leukocyte rolling and adhesion in the endothelium along with decreased hepatic blood flow. Our previous studies have shown that a high-fat diet can impair hepatic microcirculation.8,10 In addition, Rosenstengel et al found a relationship between levels of microvascular blood flow and the degree of steatosis in rats of different strains fed a high-fat diet for three weeks.57 Passarin et al showed that Wistar rats fed a cafeteria diet for one month exhibited hepatic endothelial dysfunction before the onset of fibrosis and inflammation.58 We observed that exercise improved T2D-associated microcirculatory dysfunction including leukocyte recruitment and tissue perfusion. Concurrently, in the liver, increased vitamin A deposition and decreased expression of alpha-SMA induced by exercise were indicative of decreased HSC activation. HSC activation may lead to increased fibrogenesis stimulated by connective tissue growth factors and increased inflammation and matrix degradation, contributing to the development of liver fibrosis. As fat accumulation in hepatocytes is accompanied by an increase in cell volume, the decreases in hepatic sinusoids diameters may lead to partial or complete sinusoidal obstruction. Thus, beneficial effects of exercise may also be attributed to the decrease in visceral adiposity, steatosis, and fibrosis in the liver.59 Further, physical exercise may trigger vasodilatory signals, improve capillary density, and thus improve microcirculatory blood flow.25,60–63
Hyperglycemia, dyslipidemia, inflammation and microcirculation abnormalities may increase the production of reactive oxygen species (ROS), triggering oxidative stress, which is responsible for the oxidation of carbohydrates, lipids, and proteins.64–66 Oxidation of polyunsaturated fatty acids increases the production of malondialdehyde (MDA), 4-hydroxy-nonenal (HNE), and 4-oxy-2-nonenal (ONE), and an increase in these markers correlates with microvascular and macrovascular damage in T2D67. In parallel, the antioxidant defense system responds by reducing oxidative damage. To evaluate the redox status, lipid peroxidation and the activities of the enzymes CAT and SOD were analyzed.68 In the livers of T2D mice, the MDA and CAT levels increased and was not affected by exercise, whereas SOD was not altered among groups. We also observed that exercise training did not affect NO production in the liver, which could be beneficial as several studies have shown increased exercise-related stress in the liver.69 In turn, liver NO metabolites were increased in T2D mice, which could contribute to T2D70 as NO is involved in modulating hepatic microcirculatory perfusion and oxygenation in hepatic steatosis.71 The antioxidant and anti-inflammatory hepatic effects described herein could be attributed to the moderate exercise protocol used.72
The mechanism by which exercise training benefits T2D is not fully understood, as multiple molecular and metabolic pathways may be involved.22,73 Some studies suggest that the AGE-RAGE pathway contributes to chronic stress conditions, injury, and inflammation in T2D.13,74,75 Our group has previously demonstrated an increase in AGE deposition and the expression of RAGE in obese and diabetic rats, which may play an essential role in T2D.7,10 Monitoring serum AGE levels has recently been reported to help in the early diagnosis of T2D and in predicting the severity of its late complications.76 Therefore, the AGE-RAGE signaling pathway was examined in the liver of T2D mice to determine its involvement in the exercise-mediated improvement of microcirculation. T2D mice exhibited increased AGE-RAGE levels, which were negatively affected by aerobic exercise. Further, there was a significant correlation between AGE levels and RAGE expression, microcirculatory abnormalities, the degree of steatosis and fibrosis, and HSC activation, which suggests that downregulation of both AGE-RAGE and HSC activation are molecular and cellular mechanisms involved in exercise-induced amelioration of microvascular damage associated with T2D. We have previously shown that rats with NAFLD and obesity have increased AGE levels and HSC activation, whereas inhibition of AGEs by pyridoxamine negatively modulate these parameters.8 Similar to our results, Lafoz et al showed that exercise-induced attenuation of liver fibrosis is associated with decreased HSC activation.77 Further, Gu et al showed that the activity of key enzymes in AGE formation, concentration of highly reactive intermediates, expression of RAGE, oxidative stress, and inflammation in the aortas of aged rats could be reduced by physical training.78 Further, Gu et al showed that the activity of key enzymes in AGE formation, concentration of highly reactive intermediates, expression of RAGE, oxidative stress, and inflammation in the aortas of aged rats could be reduced by physical training.8 Further, Gu et al showed that the activity of key enzymes in AGE formation, concentration of highly reactive intermediates, expression of RAGE, oxidative stress, and inflammation in the aortas of aged rats could be reduced by physical training.10 Further, Gu et al showed that the activity of key enzymes in AGE formation, concentration of highly reactive intermediates, expression of RAGE, oxidative stress, and inflammation in the aortas of aged rats could be reduced by physical training.76–78
To date, few studies have examined the content of AGEs in WAT; to our knowledge, this is the first study to examine the AGE-RAGE axis in pre-clinical models of T2D.79–81 Although we did not find significant differences in AGE-RAGE axis activation among the groups, we observed a positive correlation between AGE levels and microcirculatory changes in WAT, suggesting that AGEs could be involved in developing adipose tissue microcirculation dysfunction in T2D. Exercise significantly decreased WAT leukocyte recruitment and increased microvascular blood flow in T2D mice. These data are consistent with those of Sousa et al, who demonstrated the important role of exercise in improving femoral artery microvascular dysfunction induced by perivascular adipose tissue in obese mice.82 This effect is thought to be attributed to the ability of exercise to modulate the circulating levels of mediators involved in the inflammatory cascade83 and presently was associated with increased catalase antioxidant activity.25 The increased CAT enzyme activity induced by exercise in T2D mice can be an adaptive response counteracting the increase in other oxidative stress metabolites that were not evaluated in the present study and could be a contributor in the microcirculations parameters improvements described in the present study.84–87
In summary, physical exercise reduced body and fat mass, blood pressure, liver weight, hepatic steatosis, fibrosis, and increased vascular function of liver and WAT in T2D mice. The improvements in hepatic microcirculatory function could be attributed to reductions in hepatomegaly, liver damage, and activation of HSC and AGE-RAGE, while in WAT due to decreased leukocyte recruitment and greater redox status. Thus, physical training may be a potential non-pharmacological treatment for microcirculatory dysfunction and oxidative parameters associated with T2D.
Acknowledgment
BioRender was used to make Figure 1A.
Funding
This research was funded by Conselho Nacional de Desenvolvimento Científico e Tecnológico grant number CNPq 455,384/2014-2 and PAPES/Fiocruz grant number 401,803/2015-5.
Disclosure
The authors declare no conflicts of interest for this work.
References
1. Petersmann A, Muller-Wieland D, Muller UA, et al. Definition, classification and diagnosis of diabetes mellitus. Exp Clin Endocrinol Diabetes. 2019;127(S 01):S1–S7. doi:10.1055/a-1018-9078
2. Hazlehurst JM, Woods C, Marjot T, Cobbold JF, Tomlinson JW. Non-alcoholic fatty liver disease and diabetes. Metabolism. 2016;65(8):1096–1108. doi:10.1016/j.metabol.2016.01.001
3. Eslam M, Sanyal AJ, George J. MAFLD: a consensus-driven proposed nomenclature for metabolic associated fatty liver disease. Gastroenterology. 2020;158(7):1999–2014.e1991. doi:10.1053/j.gastro.2019.11.312
4. Younossi ZM, Golabi P, de Avila L, et al. The global epidemiology of NAFLD and NASH in patients with type 2 diabetes: a systematic review and meta-analysis. J Hepatol. 2019;71(4):793–801. doi:10.1016/j.jhep.2019.06.021
5. Williamson RM, Price JF, Glancy S, et al. Prevalence of and risk factors for hepatic steatosis and nonalcoholic Fatty liver disease in people with type 2 diabetes: the Edinburgh Type 2 Diabetes Study. Diabetes Care. 2011;34(5):1139–1144. doi:10.2337/dc10-2229
6. American Diabetes Association. Diagnosis and classification of diabetes mellitus. Diabetes Care. 2011;34(Suppl 1):S62–69. doi:10.2337/dc11-S062
7. Silvares RR, Pereira EN, Flores EE, et al. Combined therapy with metformin and insulin attenuates systemic and hepatic alterations in a model of high-fat diet-/streptozotocin-induced diabetes. Int J Exp Pathol. 2016;97(3):266–277. doi:10.1111/iep.12184
8. Pereira E, Silvares RR, Flores EEI, Rodrigues KL, Daliry A. Pyridoxamine improves metabolic and microcirculatory complications associated with nonalcoholic fatty liver disease. Microcirculation. 2020;27(3):e12603.
9. Pereira E, Silvares RR, Rodrigues KL, Flores EEI, Daliry A. Pyridoxamine and caloric restriction improve metabolic and microcirculatory abnormalities in rats with non-alcoholic fatty liver disease. J Vasc Res. 2021;1–10. doi:10.1159/000512832
10. Pereira E, Silvares RR, Flores EEI, et al. Hepatic microvascular dysfunction and increased advanced glycation end products are components of non-alcoholic fatty liver disease. PLoS One. 2017;12(6):e0179654. doi:10.1371/journal.pone.0179654
11. Hu D, Remash D, Russell RD, et al. Impairments in adipose tissue microcirculation in type 2 diabetes mellitus assessed by real-time contrast-enhanced ultrasound. Circ Cardiovasc Imaging. 2018;11(4):e007074. doi:10.1161/CIRCIMAGING.117.007074
12. Hu D, Russell RD, Remash D, et al. Are the metabolic benefits of resistance training in type 2 diabetes linked to improvements in adipose tissue microvascular blood flow? Am J Physiol Endocrinol Metab. 2018;315(6):E1242–E1250. doi:10.1152/ajpendo.00234.2018
13. Nowotny K, Jung T, Hohn A, Weber D, Grune T. Advanced glycation end products and oxidative stress in type 2 diabetes mellitus. Biomolecules. 2015;5(1):194–222. doi:10.3390/biom5010194
14. Dariya B, Nagaraju GP. Advanced glycation end products in diabetes, cancer and phytochemical therapy. Drug Discov Today. 2020;25(9):1614–1623. doi:10.1016/j.drudis.2020.07.003
15. Sims TJ, Rasmussen LM, Oxlund H, Bailey AJ. The role of glycation cross-links in diabetic vascular stiffening. Diabetologia. 1996;39(8):946–951. doi:10.1007/BF00403914
16. Goldin A, Beckman JA, Schmidt AM, Creager MA. Advanced glycation end products: sparking the development of diabetic vascular injury. Circulation. 2006;114(6):597–605. doi:10.1161/CIRCULATIONAHA.106.621854
17. Kirwan JP, Sacks J, Nieuwoudt S. The essential role of exercise in the management of type 2 diabetes. Cleve Clin J Med. 2017;84(7 Suppl 1):S15–S21. doi:10.3949/ccjm.84.s1.03
18. Balducci S, Sacchetti M, Haxhi J, et al. Physical exercise as therapy for type 2 diabetes mellitus. Diabetes Metab Res Rev. 2014;30(Suppl 1):13–23. doi:10.1002/dmrr.2514
19. Hamasaki H. Interval exercise therapy for type 2 diabetes. Curr Diabetes Rev. 2018;14(2):129–137. doi:10.2174/1573399812666161101103655
20. Guess ND. Dietary interventions for the prevention of type 2 diabetes in high-risk groups: current state of evidence and future research needs. Nutrients. 2018;10(9):1245. doi:10.3390/nu10091245
21. Poblete-Aro C, Russell-Guzman J, Parra P, et al. Efecto del ejercicio físico sobre marcadores de estrés oxidativo en pacientes con diabetes mellitus tipo 2. [Exercise and oxidative stress in type 2 diabetes mellitus]. Rev Med Chil. 2018;146(3):362–372. Spanish. doi:10.4067/s0034-98872018000300362
22. Amanat S, Ghahri S, Dianatinasab A, Fararouei M, Dianatinasab M. Exercise and Type 2 Diabetes. Adv Exp Med Biol. 2020;1228:91–105.
23. Pereira RM, da Cruz Rodrigues KC, Sant’Ana MR, et al. Short-term combined training reduces hepatic steatosis and improves hepatic insulin signaling. Life Sci. 2021;287:120124. doi:10.1016/j.lfs.2021.120124
24. Stevanović J, Beleza J, Coxito P, Ascensão A, Magalhães J. Physical exercise and liver ”fitness”: role of mitochondrial function and epigenetics-related mechanisms in non-alcoholic fatty liver disease. Mol Metab. 2020;32:1–14. doi:10.1016/j.molmet.2019.11.015
25. Goon JA, Aini AH, Musalmah M, Anum MY, Nazaimoon WM, Ngah WZ. Effect of Tai Chi exercise on DNA damage, antioxidant enzymes, and oxidative stress in middle-age adults. J Phys Act Health. 2009;6(1):43–54. doi:10.1123/jpah.6.1.43
26. Yoshikawa T, Miyazaki A, Fujimoto S. Decrease in serum levels of advanced glycation end-products by short-term lifestyle modification in non-diabetic middle-aged females. Med Sci Monit. 2009;15(6):PH65–73.
27. Maessen MFH, Schalkwijk CG, Verheggen R, Aengevaeren VL, Hopman MTE, Eijsvogels TMH. A comparison of dicarbonyl stress and advanced glycation endproducts in lifelong endurance athletes vs. sedentary controls. J Sci Med Sport. 2017;20(10):921–926. doi:10.1016/j.jsams.2017.03.011
28. Rodrigues KL, Borges JP, Lopes GO, et al. Influence of physical exercise on advanced glycation end products levels in patients living with the human immunodeficiency virus. Front Physiol. 2018;9:1641. doi:10.3389/fphys.2018.01641
29. Panchal SK, Poudyal H, Iyer A, et al. High-carbohydrate, high-fat diet-induced metabolic syndrome and cardiovascular remodeling in rats. J Cardiovasc Pharmacol. 2011;57(5):611–624. doi:10.1097/FJC.0b013e3181feb90a
30. Rodrigues B, Figueroa DM, Mostarda CT, Heeren MV, Irigoyen MC, De Angelis K. Maximal exercise test is a useful method for physical capacity and oxygen consumption determination in streptozotocin-diabetic rats. Cardiovasc Diabetol. 2007;6(1):38. doi:10.1186/1475-2840-6-38
31. Machado MV, Vieira AB, da Conceição FG, Nascimento AR, ACL da Nóbrega, Tibirica E. Exercise training dose differentially alters muscle and heart capillary density and metabolic functions in an obese rat with metabolic syndrome. Exp Physiol. 2017;102(12):1716–1728. doi:10.1113/EP086416
32. Nascimento RA, Mendes G, Possomato-Vieira JS, et al. Metalloproteinase inhibition protects against reductions in circulating adrenomedullin during lead-induced acute hypertension. Basic Clin Pharmacol Toxicol. 2015;116(6):508–515. doi:10.1111/bcpt.12337
33. Dias JV, Paredes BD, Mesquita LF, et al. An ultrasound and histomorphological analysis of experimental liver cirrhosis in rats. Braz J Med Biol Res. 2008;41(11):992–999. doi:10.1590/S0100-879X2008001100008
34. Lessa AS, Paredes BD, Dias JV, et al. Ultrasound imaging in an experimental model of fatty liver disease and cirrhosis in rats. BMC Vet Res. 2010;6(1):6. doi:10.1186/1746-6148-6-6
35. Marques PE, Oliveira AG, Chang L, Paula-Neto HA, Menezes GB. Understanding liver immunology using intravital microscopy. J Hepatol. 2015;63(3):733–742. doi:10.1016/j.jhep.2015.05.027
36. Preston KJ, Rom I, Vrakas C, et al. Postprandial activation of leukocyte-endothelium interaction by fatty acids in the visceral adipose tissue microcirculation. FASEB J. 2019;33(11):11993–12007. doi:10.1096/fj.201802637RR
37. Wu Y, Ren J, Zhou B, et al. Laser speckle contrast imaging for measurement of hepatic microcirculation during the sepsis: a novel tool for early detection of microcirculation dysfunction. Microvasc Res. 2015;97:137–146. doi:10.1016/j.mvr.2014.10.006
38. Andrikopoulos S, Blair AR, Deluca N, Fam BC, Proietto J. Evaluating the glucose tolerance test in mice. Am J Physiol Endocrinol Metab. 2008;295(6):E1323–1332. doi:10.1152/ajpendo.90617.2008
39. Tschanz SA, Burri PH, Weibel ER. A simple tool for stereological assessment of digital images: the STEPanizer. J Microsc. 2011;243(1):47–59. doi:10.1111/j.1365-2818.2010.03481.x
40. Elias H, Hennig A, Schwartz DE. Stereology: applications to biomedical research. Physiol Rev. 1971;51(1):158–200. doi:10.1152/physrev.1971.51.1.158
41. Schneider CA, Rasband WS, Eliceiri KWNIH. Image to ImageJ: 25 years of image analysis. Nat Methods. 2012;9(7):671–675. doi:10.1038/nmeth.2089
42. Graus-Nunes F, Santos FO, Marinho TS, Miranda CS, Barbosa-da-Silva S, Souza-Mello V. Beneficial effects of losartan or telmisartan on the local hepatic renin-angiotensin system to counter obesity in an experimental model. World J Hepatol. 2019;11(4):359–369. doi:10.4254/wjh.v11.i4.359
43. Nakayama H, Mitsuhashi T, Kuwajima S, et al. Immunochemical detection of advanced glycation end products in lens crystallins from streptozocin-induced diabetic rat. Diabetes. 1993;42(2):345–350. doi:10.2337/diab.42.2.345
44. Sumi D, Ignarro LJ. Regulation of inducible nitric oxide synthase expression in advanced glycation end product-stimulated raw 264.7 cells: the role of heme oxygenase-1 and endogenous nitric oxide. Diabetes. 2004;53(7):1841–1850. doi:10.2337/diabetes.53.7.1841
45. Draper HH, Hadley M. Malondialdehyde determination as index of lipid peroxidation. Methods Enzymol. 1990;186:421–431.
46. Sun Y, Oberley LW, Li Y. A simple method for clinical assay of superoxide dismutase. Clin Chem. 1988;34(3):497–500. doi:10.1093/clinchem/34.3.497
47. Aebi H. Catalase in vitro. Methods Enzymol. 1984;105:121–126.
48. Tolman KG, Fonseca V, Dalpiaz A, Tan MH. Spectrum of liver disease in type 2 diabetes and management of patients with diabetes and liver disease. Diabetes Care. 2007;30(3):734–743. doi:10.2337/dc06-1539
49. Nawrot M, Peschard S, Lestavel S, Staels B. Intestine-liver crosstalk in Type 2 Diabetes and non-alcoholic fatty liver disease. Metabolism. 2021;123:154844. doi:10.1016/j.metabol.2021.154844
50. Goncalves IO, Maciel E, Passos E, et al. Exercise alters liver mitochondria phospholipidomic profile and mitochondrial activity in non-alcoholic steatohepatitis. Int J Biochem Cell Biol. 2014;54:163–173. doi:10.1016/j.biocel.2014.07.011
51. Goncalves IO, Passos E, Rocha-Rodrigues S, et al. Physical exercise prevents and mitigates non-alcoholic steatohepatitis-induced liver mitochondrial structural and bioenergetics impairments. Mitochondrion. 2014;15:40–51. doi:10.1016/j.mito.2014.03.012
52. Goncalves IO, Passos E, Rocha-Rodrigues S, et al. Physical exercise antagonizes clinical and anatomical features characterizing Lieber-DeCarli diet-induced obesity and related metabolic disorders. Clin Nutr. 2015;34(2):241–247. doi:10.1016/j.clnu.2014.03.010
53. Lehmann M, Baumgartl P, Wiesenack C, et al. Training-overtraining: influence of a defined increase in training volume vs training intensity on performance, catecholamines and some metabolic parameters in experienced middle- and long-distance runners. Eur J Appl Physiol Occup Physiol. 1992;64(2):169–177. doi:10.1007/BF00717956
54. Marques DL, Neiva HP, Faíl LB, Gil MH, Marques MC. Acute effects of low and high-volume resistance training on hemodynamic, metabolic and neuromuscular parameters in older adults. Exp Gerontol. 2019;125:110685. doi:10.1016/j.exger.2019.110685
55. Chong S, Ding D, Byun R, Comino E, Bauman A, Jalaludin B. Lifestyle changes after a diagnosis of type 2 diabetes. Diabetes Spectr. 2017;30(1):43–50. doi:10.2337/ds15-0044
56. Katsagoni CN, Georgoulis M, Papatheodoridis GV, Panagiotakos DB, Kontogianni MD. Effects of lifestyle interventions on clinical characteristics of patients with non-alcoholic fatty liver disease: a meta-analysis. Metabolism. 2017;68:119–132. doi:10.1016/j.metabol.2016.12.006
57. Rosenstengel S, Stoeppeler S, Bahde R, Spiegel HU, Palmes D. Type of steatosis influences microcirculation and fibrogenesis in different rat strains. J Invest Surg. 2011;24(6):273–282. doi:10.3109/08941939.2011.586094
58. Pasarín M, La Mura V, Gracia-Sancho J, et al. Sinusoidal endothelial dysfunction precedes inflammation and fibrosis in a model of NAFLD. PLoS One. 2012;7(4):e32785. doi:10.1371/journal.pone.0032785
59. Ijaz S, Yang W, Winslet MC, Seifalian AM. Impairment of hepatic microcirculation in fatty liver. Microcirculation. 2003;10(6):447–456. doi:10.1038/sj.mn.7800206
60. Olver TD, Laughlin MH. Endurance, interval sprint, and resistance exercise training: impact on microvascular dysfunction in type 2 diabetes. Am J Physiol Heart Circ Physiol. 2016;310(3):H337–350. doi:10.1152/ajpheart.00440.2015
61. Rafiq A, Aslam K, Malik R, Afroze D. C242T polymorphism of the NADPH oxidase p22PHOX gene and its association with endothelial dysfunction in asymptomatic individuals with essential systemic hypertension. Mol Med Rep. 2014;9(5):1857–1862. doi:10.3892/mmr.2014.1992
62. Touyz RM, Yao G, Schiffrin EL. c-Src induces phosphorylation and translocation of p47phox: role in superoxide generation by angiotensin II in human vascular smooth muscle cells. Arterioscler Thromb Vasc Biol. 2003;23(6):981–987. doi:10.1161/01.ATV.0000069236.27911.68
63. Roque FR, Hernanz R, Salaices M, Briones AM. Exercise training and cardiometabolic diseases: focus on the vascular system. Curr Hypertens Rep. 2013;15(3):204–214. doi:10.1007/s11906-013-0336-5
64. Oguntibeju OO. Type 2 diabetes mellitus, oxidative stress and inflammation: examining the links. Int J Physiol Pathophysiol Pharmacol. 2019;11(3):45–63.
65. Tangvarasittichai S. Oxidative stress, insulin resistance, dyslipidemia and type 2 diabetes mellitus. World J Diabetes. 2015;6(3):456–480. doi:10.4239/wjd.v6.i3.456
66. Valenzuela R, Das UN, Videla LA, Llorente CG. Nutrients and diet: a relationship between oxidative stress, aging, obesity, and related noncommunicable diseases. Oxid Med Cell Longev. 2018;2018:7460453. doi:10.1155/2018/7460453
67. Ayala A, Muñoz MF, Argüelles S. Lipid peroxidation: production, metabolism, and signaling mechanisms of malondialdehyde and 4-hydroxy-2-nonenal. Oxid Med Cell Longev. 2014;2014:360438. doi:10.1155/2014/360438
68. Gaxiola-Robles R, Bitzer-Quintero OK, Mendez-Rodriguez LC, et al. Peroxidación de lípidos y la respuesta del sistema de defensa antioxidante en el diabético tipo 2 obeso en comparación al diabético tipo 2 sin obesidad. [Lipid peroxidation and the response of the antioxidant defense system in the obese type 2 diabetic compared with the non-obese type 2 diabetic]. Nutr Hosp. 2013;28(6):1905–1911. Spanish. doi:10.3305/nutrhosp.v28in06.6946
69. Korivi M, Hou CW, Huang CY, et al. Ginsenoside-Rg1 protects the liver against exhaustive exercise-induced oxidative stress in rats. Evid Based Complement Alternat Med. 2012;2012:932165. doi:10.1155/2012/932165
70. Hamed S, Brenner B, Aharon A, Daoud D, Roguin A. Nitric oxide and superoxide dismutase modulate endothelial progenitor cell function in type 2 diabetes mellitus. Cardiovasc Diabetol. 2009;8(1):56. doi:10.1186/1475-2840-8-56
71. Ijaz S, Yang W, Winslet MC, Seifalian AM. The role of nitric oxide in the modulation of hepatic microcirculation and tissue oxygenation in an experimental model of hepatic steatosis. Microvasc Res. 2005;70(3):129–136. doi:10.1016/j.mvr.2005.08.001
72. Pillon Barcelos R, Freire Royes LF, Gonzalez-Gallego J, Bresciani G. Oxidative stress and inflammation: liver responses and adaptations to acute and regular exercise. Free Radic Res. 2017;51(2):222–236. doi:10.1080/10715762.2017.1291942
73. Stanford KI, Goodyear LJ. Exercise and type 2 diabetes: molecular mechanisms regulating glucose uptake in skeletal muscle. Adv Physiol Educ. 2014;38(4):308–314. doi:10.1152/advan.00080.2014
74. Gugliucci A. Formation of fructose-mediated advanced glycation end products and their roles in metabolic and inflammatory diseases. Adv Nutr. 2017;8(1):54–62. doi:10.3945/an.116.013912
75. Yamamoto M, Sugimoto T. Advanced glycation end products, diabetes, and bone strength. Curr Osteoporos Rep. 2016;14(6):320–326. doi:10.1007/s11914-016-0332-1
76. Nikolov A, Blazhev A, Tzekova M, Kostov K, Popovski N. Serum levels of antibodies to advanced glycation end products in patients with type 2 diabetes mellitus and hypertension. Folia Med (Plovdiv). 2020;62(2):295–301. doi:10.3897/folmed.62.e47788
77. Lafoz E, Camprecios G, Garcia-Caldero H, et al. Impact of lifestyle interventions targeting physical exercise and caloric intake on cirrhosis regression in rats. Am J Physiol Gastrointest Liver Physiol. 2021;321(6):G603–G616. doi:10.1152/ajpgi.00191.2021
78. Gu Q, Wang B, Zhang XF, Ma YP, Liu JD, Wang XZ. Contribution of receptor for advanced glycation end products to vasculature-protecting effects of exercise training in aged rats. Eur J Pharmacol. 2014;741:186–194. doi:10.1016/j.ejphar.2014.08.017
79. Kume S, Kato S, Yamagishi S, et al. Advanced glycation end-products attenuate human mesenchymal stem cells and prevent cognate differentiation into adipose tissue, cartilage, and bone. J Bone Miner Res. 2005;20(9):1647–1658. doi:10.1359/JBMR.050514
80. Rodino-Janeiro BK, Salgado-Somoza A, Teijeira-Fernandez E, Gonzalez-Juanatey JR, Alvarez E, Eiras S. Receptor for advanced glycation end-products expression in subcutaneous adipose tissue is related to coronary artery disease. Eur J Endocrinol. 2011;164(4):529–537. doi:10.1530/EJE-10-0904
81. Ding YS, Malik N, Mendoza S, et al. PET imaging study of brown adipose tissue (BAT) activity in mice devoid of receptor for advanced glycation end products (RAGE). J Biosci. 2019;44(4). doi:10.1007/s12038-019-9900-8.
82. Sousa AS, Sponton ACS, Delbin MA. Perivascular adipose tissue and microvascular endothelial dysfunction in obese mice: beneficial effects of aerobic exercise in adiponectin receptor (AdipoR1) and peNOSSer1177. Clin Exp Pharmacol Physiol. 2021;48(10):1430–1440. doi:10.1111/1440-1681.13550
83. Beavers KM, Brinkley TE, Nicklas BJ. Effect of exercise training on chronic inflammation. Clin Chim Acta. 2010;411(11–12):785–793. doi:10.1016/j.cca.2010.02.069
84. Maritim AC, Sanders RA, Watkins JB
85. Banerjee M, Vats P. Reactive metabolites and antioxidant gene polymorphisms in Type 2 diabetes mellitus. Redox Biol. 2014;2:170–177. doi:10.1016/j.redox.2013.12.001
86. Farzanegi P, Dana A, Ebrahimpoor Z, Asadi M, Azarbayjani MA. Mechanisms of beneficial effects of exercise training on non-alcoholic fatty liver disease (NAFLD): roles of oxidative stress and inflammation. Eur J Sport Sci. 2019;19(7):994–1003. doi:10.1080/17461391.2019.1571114
87. Tsukiyama Y, Ito T, Nagaoka K, Eguchi E, Ogino K. Effects of exercise training on nitric oxide, blood pressure and antioxidant enzymes. J Clin Biochem Nutr. 2017;60(3):180–186. doi:10.3164/jcbn.16-108
 © 2022 The Author(s). This work is published and licensed by Dove Medical Press Limited. The
full terms of this license are available at https://www.dovepress.com/terms
and incorporate the Creative Commons Attribution
- Non Commercial (unported, 3.0) License.
By accessing the work you hereby accept the Terms. Non-commercial uses of the work are permitted
without any further permission from Dove Medical Press Limited, provided the work is properly
attributed. For permission for commercial use of this work, please see paragraphs 4.2 and 5 of our Terms.
© 2022 The Author(s). This work is published and licensed by Dove Medical Press Limited. The
full terms of this license are available at https://www.dovepress.com/terms
and incorporate the Creative Commons Attribution
- Non Commercial (unported, 3.0) License.
By accessing the work you hereby accept the Terms. Non-commercial uses of the work are permitted
without any further permission from Dove Medical Press Limited, provided the work is properly
attributed. For permission for commercial use of this work, please see paragraphs 4.2 and 5 of our Terms.