Back to Journals » Journal of Inflammation Research » Volume 15
Adiponectin Ameliorates Hyperglycemia-Induced Retinal Endothelial Dysfunction, Highlighting Pathways, Regulators, and Networks
Authors Bushra S ![]() , Al-Sadeq DW, Bari R, Sahara A, Fadel A, Rizk N
, Al-Sadeq DW, Bari R, Sahara A, Fadel A, Rizk N ![]()
Received 26 January 2022
Accepted for publication 4 May 2022
Published 27 May 2022 Volume 2022:15 Pages 3135—3166
DOI https://doi.org/10.2147/JIR.S358594
Checked for plagiarism Yes
Review by Single anonymous peer review
Peer reviewer comments 2
Editor who approved publication: Professor Ning Quan
Sumbul Bushra,1,* Duaa W Al-Sadeq,1,* Redwana Bari,1 Afifah Sahara,1 Amina Fadel,1 Nasser Rizk1,2
1Department of Biomedical Sciences, College of Health Sciences, QU-Health, Qatar University, Doha, Qatar; 2Biomedical Research Center (BRC), Qatar University, Doha, Qatar
*These authors contributed equally to this work
Correspondence: Nasser Rizk, Department of Biomedical Sciences, College of Health Sciences, QU-Health, Qatar University, P.O. Box 2713, Doha, Qatar, Tel +974-4403-4786, Email [email protected]
Background: The pathophysiology of diabetic retinopathy (DR) is multifaced. A low level of circulating adiponectin (APN) in type 2 diabetes is associated with microvasculature complications, and its role in the evolution of DR is complex.
Aim: This study is designed to explore the potential impact of APN in the pathogenesis of DR, linking the changes in cellular and biological processes with the pathways, networks, and regulators involved in its actions.
Methods: Human microvascular retinal endothelial cells (HMRECs) were exposed to 30mM glucose (HG) and treated with globular adiponectin (30μg/mL) for 24 hours. The cells were evaluated for reactive oxidative stress (ROS) and apoptosis. RT-PCR profile arrays were utilized to evaluate the profile of genes involved in endothelial functions, angiogenesis, extracellular matrix, and adhesion molecules for hyperglycemic HMRECs treated with adiponectin. In addition, the barrier function, leukocyte migration, and angiogenesis were evaluated. The differential expressed genes (DEGs) were outlined, and bioinformatic analysis was applied.
Results: Adiponectin suppresses ROS production and apoptosis in HMRECs under HG conditions. Adiponectin improved migration and barrier functions in hyperglycemic cells. The bioinformatic analysis highlighted that the signaling pathways of integrin, HMGB1, and p38 AMPK, are mainly involved in the actions of APN on HMRECs. APN significantly affects molecular functions, including the adhesion of cells, chemotaxis, migration of WBCs, and angiogenesis. STAT3, NFKB, IKBKB, and mir-8 are the top upstream regulators, which affect the expressions of the genes of the data set, while TNF and TGFB1 are the top regulators.
Conclusion: Adiponectin significantly counteracts hyperglycemia at various cellular and molecular levels, reducing its impact on the pathophysiological progression towards DR in vitro using HMRECs. Adiponectin ameliorates inflammatory response, oxidative stress, and endothelial barrier dysfunction using a causal network of NFBk complex, TNF, and HMGB1 and integrin pathways.
Keywords: adiponectin, hyperglycemia, human microvascular retinal endothelial cells, diabetic retinopathy, bioinformatic analysis
Introduction
Diabetic retinopathy (DR) is a severe long-term intricacy of diabetes mellitus and the preeminent inducer of blindness around the globe in adults 20–74 years old.1 Specific mediators such as endothelial adhesion molecules, growth factors, inflammatory factors, angiogenic agents, neurotrophic factors, and cytokines/chemokines production are elicited by metabolites such as high glucose and fatty acids in the diabetic retina. These, in turn, cause a change in the blood flow, increased permeability of retinal blood capillaries, apoptosis, and finally, angiogenesis.2–4
Adiponectin (APN) is an adipokine secreted into the circulation from the adipose tissues with various physiologic actions. In plasma, adiponectin circulates at very high concentrations for a hormone, usually in the range of 3 to 30 μg/mL.5 Adiponectin mediates its effects in the endothelial cells through activation of adiponectin receptor type 1 and type 2.6 In addition, adiponectin has anti-inflammatory action, anti-oxidative properties, and anti-atherogenic vascular effects in different target organs and tissues.7 Furthermore, adiponectin was found to counteract the angiogenesis in different microvascular endothelial cell types,8 while on the contrary, it has been reported that APN has an angiogenic effect on HUVEC cells.9
Human studies concerning the level of circulating adiponectin and its association with diabetic retinopathy (DR) have been questionable.10 The adiponectin level in the aqueous humor is elevated in the proliferative type of DR (PDR) patients;11 however, a previous study demonstrated that lower levels of vitreous APN were found in patients with diabetes compared to those in non-diabetic patients.12 In addition, a previous study demonstrated that PDR patients reported that low levels of plasma APN concentrations are associated with the severity of DR.13 A recent study demonstrated that adiponectin level in the serum and the aqueous humor of diabetic subjects are higher than in non-diabetics and is correlated well with DR development and progression.14
The role and actions of adiponectin hormone in the pathogenesis of diabetic retinopathy are insufficient and not limited. Therefore, we commenced this study to investigate the effects of adiponectin and its possible underlying pathomechanisms on cellular and biological processes related to its downstream functional effects such as migration, and adhesion in primary human microvascular retinal endothelial cells (HMRECs) exposed to high glucose (30mM) to mimic the diabetic environment as previously published.15 Therefore, we evaluated the individual cellular and biological processes such as apoptosis, ROS production, RSN, profiling of the most relevant genes involved in endothelial functions utilizing RT-PCR array, and the protein level of inflammatory and adhesion proteins. Furthermore, we employed the bioinformatic analysis to explain the gene ontology and pathways linked to the cellular, molecular and functional changes in response to adiponectin treatment in enhancing the experimental assays and find the details of such relationships as possible underlying mechanisms to understand the actions of adiponectin in vitro using human primary microvascular endothelial cells.
Materials and Methodology
Materials
Cryopreserved Human Retinal Microvascular Endothelial Cells (HMRECs) (ACBRI 181) were purchased from Cell System (Kirkland, WA). Additionally; Complete Classic Medium Kit with Serum and Culture Boost (4Z0-500); Complete Serum-Free Medium Kit with Recombinant RocketFuel (SF-4Z0-500-R); Attachment Factor (4Z0-210); antibiotic: Bac-ff® (4Z0-643); Passage Reagent Group (4Z0-800); PRG-2 Trypsin-EDTA Solution (4Z0-310); were also procured from Cell System. Reagents such as TRIzol™ Reagent (catalog#15596026); CellROX™ Orange Reagent (Catalog# C10443); Tali™ Apoptosis Kit - AnnexinV Alexa Fluor™ 488 and Propidium Iodide (Catalog# A10788); Carboxy-H2DCFDA (Catalog#C400) were purchased from Invitrogen, Life Technologies, USA. Tali ® image-based cytometer (Catalog #T10796) from Invitrogen. High-Capacity RNA-to-cDNA kit and TaqMan Gene Expression Master Mix (catalog# 4369016) were obtained from Applied Biosystems, USA. Pierce® RIPA Buffer (catalog# PF 201994) and Pierce® BCA Protein Assay Kit (catalog# 23227) were purchased from Thermo Scientific, USA. DAF-FM-Diacetate (catalog#D-23842) was purchased from Invitrogen, Life Technologies, USA. Human gAcrp30 (catalog#450-21-500) was purchased from PeproTech EC Ltd, UK. All the TaqMan primers for gene expression were provided by Life Technologies, USA. The electrode array (Catalog#8W10E-PET) for impedance analysis for the barrier function was supplied by Applied Biophysics, 185 Jordan Rd. Troy, NY 12180, USA. Transendothelial Migration Assay-Colorimetric (Catalog# ECM557) and Tube assay for angiogenesis (catalog#ECM625) were provided by Millipore, USA. RT2 SYBR Green ROX qPCR Master Mix for RT profiler PCR array was provided from Qiagen, USA, with catalog number (330523). Human Endothelial Cell Biology RT2 Profiler™ PCR Array (cat# PAHS-015Z), RT2 Profiler™ PCR Array Human Angiogenesis (Cat# PAHS-024Z), and RT2 Profiler™ PCR Array Human Extracellular Matrix and Adhesion Molecules (Cat# PAHS-013Z) was provided from Qiagen, USA. The following TaqMan primers were used; ADR1 (Hs00360422_m1, Catalog number: 4331182); ADR2 (Cat#Hs00226105_m1, Catalog number: 4331182) and B-Actin (Hs 99999903_m1 ACTB, Catalog number: 4331182) were provided as custom assay from Thermo Scientific, USA. Primary antibodies HMGB1 (sc-548457), AdipoR1 (sc-518030), AdipoR2 (sc-514045) from (Santa Cruz Biotechnology, Germany), SOD2 (cst#13141), and Beta-Actin (cst#3700) (purchased from cell signaling, USA). Other materials were purchased from Sigma (USA) unless mentioned elsewhere. The study was ethically approved by Qatar University institutional review board: QU-IRB 837-E/17 following the declaration of Helsinki 2000.
Methods
Cell Culture of Human Microvascular Retinal Endothelial Cells and Treatment
Primary human retinal microvascular endothelial cells (HMRECs) were sub-cultured and maintained as per the recommendation of the supplier on cell culture dishes using attachment factor followed by Complete Classic Media containing Bovine Serum albumin and Culture Boost addition, and passaged using provided passage reagents. Cells were seeded in a cell culture dish and kept in a humidified incubator at 37°C and 5% CO2. The growth of the cells was monitored to reach 80–90% confluency and then serum-starved for 6 hours before starting the treatment. D-glucose was supplemented to the group of hyperglycemia cells (HG) at a concentration of 30 mM to mimic hyperglycemic conditions in diabetic patients, and 5.5mM D-glucose as normoglycemic (NG) control group. To exclude a hyperosmolar effect, mannitol (25.5 mmol/L) was added in control cultures (5.5 mM) to have 30mM, similar to the concentration of D-glucose in the HG group. As per the manufacturer’s instruction, adiponectin (APN) was reconstituted in sterile water and added to the hyperglycemia treated cells at a concentration of 30μg/mL and the normoglycemic control cells as treatment control. Cell culture dishes were then kept in a humidified incubator at 37°C and 5% CO2 for 96 hours, followed by APN treatment for 24 hours. The experiment was terminated after 24 h of APN treatment for further analysis. Conditioned media were used for multiplex assay of various cytokines. Cells incubated under normoxic conditions (95% air and 5% CO2) from the same batch and passage were used as controls. The following groups were obtained; a control (NG) group (5.5 mmol/l glucose), HG group (30 mmol/l glucose), APN+NG group (5.5 mmol/l glucose + 30 μg/mL of APN), APN+HG group (30 mmol/l glucose + 30 μg/mL APN), and mannitol group (5.5 mmol/l glucose + 25.5 mmol/l mannitol).
The adiponectin concentration was chosen based on a pilot study done using two different concentrations of adiponectin that resemble normal physiological concentrations as low (5μg/mL adiponectin) and high physiological levels (30μg/mL adiponectin) for 24 hours as a treatment to HG cells.5,10 The dose of APN used in the current study (30μg/mL) showed that APN supplementation at 30μg/mL was most effective in reducing the percentage of cells positive for H2DCFDA stain used to detect total ROS (Supplementary Figure S1). The pilot study data highlighted that a high dose of APN is superior to low doses in ameliorating ROS production, which is well known to be a significant contributing factor in the pathogenesis of DR.
Assessment of Apoptosis
The apoptotic cell population was assayed using Tali™ Apoptosis Kit-AnnexinV Alexa Fluor™ 488 and Propidium Iodide and analyzed with Tali® Image-Based Cytometer as per the manufacturer’s instructions.
Assessment of Reactive Oxygen Species (Oxidative Stress)
Cells treated with and without APN, HG, and NG were analyzed for the induction of oxidative stress. Cells were incubated with Cell-ROX® and Carboxy-H2-DCFDA to reliably measure total ROS in live cells according to the manufacturer’s instructions. Cell-ROX® positive cells were quantified by a Tali-image-based cytometer, while H2-DCFDA positive cells were visualized by an inverted fluorescent microscope (Olympus X53).
Assessment of Reactive Nitrogen Species (RNS) Using Immunofluorescence
The intracellular reactive nitric oxide production level in HMRECs treated with and without APN, HG, and NG was assessed with DAF-FM diacetate per the manufacturer’s instructions. In addition, intracellular RNS concentration of adherent cells was assessed by taking images with an inverted immunofluorescent microscope (Olympus X53) at Ex/Em wavelength maxima of 495/515nm.
Assessment of Gene (mRNA) Expression
Utilizing TRIZOL® reagent, total RNA was extracted as per the stated manufacturer’s instruction. First-strand cDNA was synthesized using the High-Capacity RNA-to-cDNA kit. The primers for TaqMan gene expression assays for adiponectin receptor 1 and adiponectin receptor 2 were obtained as custom assays from Thermo Fischer Scientific and subjected to real-time PCR quantification. All reactions were performed in triplicate. RT-PCR reaction comprised of incubation hold at 50°C for 2 min with the second hold of 10 min at 95°C for polymerase activation, followed by 40 cycles including 95°C for 15s (denaturation) and 60°C for 60s (Annealing/extension). The relative amounts of mRNAs levels were quantified relative to the expression of the housekeeping gene B-Actin using a comparative Ct (2−ΔΔCt) value method.
Flow Cytometer of the Adhesion Protein Molecules
E-selectin and ICAM-1 are molecules associated with cell-to-cell adhesion and are found on cell surfaces. The expression of these proteins was quantified using BD Accuri TM C6 Flow Cytometer (B.D. Biosciences). Cells were detached with enzyme-free Gibco cell dissociation buffer (Invitrogen) and suspended in cold PBS 200 ul of 1% bovine serum albumin (BSA) at a 1×10⁶ cells concentration. The cells were treated with antibodies against each cell adhesion protein, P.E. Mouse Anti-Human CD62P targeting E-selectin and P.E. Mouse Anti-Human CD54 targeting ICAM-1, Anti-Human/Mouse beta-Catenin Alexa Fluor® 488, and Mouse Anti-Human CD144 were incubated with cells for 30 min on ice. Cells were then washed twice with 1 mL PBS/1% BSA, and fluorescence measurements were detected on an Accuri C6 flow cytometer. Analysis of the data was performed using the Flow Express software (De Novo Software, Los Angeles, CA, USA). The flow cytometry assay provides protein assay using live cells under different conditions.
ELISA of IL-8, TNF-α, and IL-Iβ
Cell supernatant from HMRECs treated with and without APN, HG, and NG were collected and centrifuged at 5000g for 5 min. In addition, an aliquot of each supernatant was assayed in duplicate as per the manufacturer’s instruction for IL-8, TNF-α, and IL-Iβ using the human cytokine multiplex immunoassay kit (HADK2MAG-61) from Millipore (Merck Millipore, Billerica, MA, USA) as published previously.16
Western Blot
Proteins were extracted using RIPA buffer, and the protein concenteration was evaluated using BCA assay then resolved on 10% Bis-Tris gels (NuPAGE, Novex, Thermo Fischer), transferred to PVDF membrane, and immunoblotted using Primary antibodies HMGB1 (sc-548457), AdipoR1 (sc-518030), and AdipoR2 (sc-514045)(purchased from Santa Cruz, Germany), and SOD2 (cst#13141), and Beta-Actin (cst#3700) (purchased from cell signaling, USA). It was followed by incubation with appropriate horseradish peroxidase-conjugated secondary antibodies (Cell signaling), and the signal was detected using a chemiluminescence substrate (Pierce, Rockford, IL). Finally, the signal intensity was quantified with a densitometer (GeneTool software; SynGene, Frederick, MD).
Functional Assays
Leukocytes Migration by Colorimetric Assay
The assay was performed based on the manufacturer’s instructions using the Leukocyte Transendothelial Migration Assay Kit (Cat. No. ECM557) provided by Millipore. In short, on cell culture inserts, HMRECs (1x10⁵ cells) of different treatment groups were grown and cultured until confluency. Next, HL-60 leukocyte cells (2x10⁵ cells) were added to the endothelial layer and allowed to migrate for 18 hours at 37°C. Migrated cells were measured at OD 450 nm per the assay.
The Transcellular Electrical Resistance (TER) Assessment by Electric Cell-Substrate Impedance Sensing (ECIS)
HMRECs were implanted at a density of 5×10⁴ cells/well-containing gold electrodes (8W10E+) in two culture plates. Each well was covered with cysteine, collagen, and fibronectin. The electric currents running through confluent cells in each well were recorded independently by the Electrical Cell–Substrate Impedance Sensing (ECIS) from (Applied Biophysics, Inc., Troy, NY, USA). Cells were starved for 6 hours, and then cells were treated with corresponding glucose with and without APN. Three different groups were evaluated: normoglycemia cells (NG), hyperglycemia cells (HG), and hyperglycemia cells+ adiponectin (HG+APN). TER was recorded for another 24 hrs. Endothelial monolayer integrity was confirmed microscopically and by final TER measurement at the end of each experiment. Normalization of resistance values for each chamber was done and then plotted as a function of time.17
Tube Formation Assay Assessment of APN Treatment in Hyperglycemia Treated HMRECs
Evaluation of tube formation of HMRECs was performed using In Vitro Angiogenesis Assay Kit (ECM625; Millipore, Billerica, CA) based on the manufacturer’s protocol. Briefly, harvested endothelial cells extract was polymerized in a 96-well plate at 37 °C for 30 min before the culture of 1.6 × 10⁴ HMRECs followed by treatment with NG, HG, and APN on top of polymerized EC Matrix overnight at 37°C for five days. Tube formation was monitored every (12–18 hr) during the treatment using an inverted microscope. The central area of each well, which covers the tube length within a field, was measured using ImageJ software.
RT-PCR Arrays Bioinformatic Analysis
Real-time PCR was carried out using Applied Biosystem 7500 Real-Time PCR system to quantitate gene expression in Real-Time. The PCR array assays evaluated the effect of APN+HG group Vs HG group. Gene expression was evaluated using the Human Endothelial Cell Biology RT2 Profiler™ PCR Array (Cat# PAHS-015Z), RT2 Profiler™ PCR Array Human Angiogenesis (Cat# PAHS-024Z), and RT2 Profiler™ PCR Array Human Extracellular Matrix and Adhesion Molecules (Cat# PAHS-013Z). The arrays profile of genes related to angiogenesis, various endothelial functions such as receptors, growth factors, chemokines, proteases, adhesion, extracellular matrix, cell-cell, and cell-matrix were assessed. The expression of these genes is involved in the different biological processes such as permeability and vascular tone, blood vessel morphogenesis, endothelial cell activation, survival, and endothelial cell injury, which was targeted for detection by real-time PCR. RT2 SYBR Green ROX qPCR Master Mix was used with cDNA template and RNase-free water for the RT-PCR profiler array based on the manufacturer’s instructions.
The thermal cycling program recommended by the manufacturer of Applied Biosystem 7500 was as follow: holding stage of 95°C for 10 min., followed by a Cycling stage of 40 cycles of denaturation at 95°C for 15s, with 60s annealing and elongation at 60°C, followed by melting curve analysis. The profiling of the gene arrays was evaluated for differential expression using the Qiagen Gene Globe analysis software available on the Qiagen website (https://geneglobe.qiagen.com) to analyze the results (Qiagen, Germany). The generated global gene expression data were assessed using differential expression analysis and functional classification of differentially expressed genes (DEGs). The list of genes that were either significantly upregulated or underregulated by APN treatment of HG cells compared with HG without APN was analyzed using the Ingenuity Pathway Analysis (IPA) core pathway and upstream regulator analysis (Qiagen Ingenuity Systems). Furthermore, the list of differentially expressed genes was also analyzed using Panther, a web-based (http://pantherdb.org/citePanther.jsp) portal designed to offer a comprehensive gene list annotation and analysis resource. The relevant signaling processes and biological functions were evaluated using the Ingenuity Pathway Analysis software (IPA; Ingenuity Systems). The stringency of the filters for IPA was set to include a p-value of < 0.05. The core analysis platform was selected for data analysis and interpretation. We applied the z-score to predict a cellular process’s directional change, such as activating or inhibiting a cellular pathway. The software also employs Benjamin–Hochberg correction to account for the false discovery rate due to multiple comparisons.
Statistical Analysis
Statistical analysis was performed using GraphPad Prism 8 for Windows (GraphPad Software, San Diego, California USA, www.graphpad.com). One-way ANOVA was used to detect any significant difference between the different treatments of HMRECs followed by the post-hoc test (Tukey’s analysis). For each experiment, treatment groups were prepared in at least 3–5 culture plates and three different biological replicates of HMRECs. Results are depicted as mean ± SEM of at least three independent replicates, and the significance level was chosen at a two-tailed p < 0.05.
Results
Adiponectin Abrogates the Apoptosis and the Oxidative Stress Induced by Hyperglycemia in HMRECs
The impact of APN on apoptosis and oxidative stress showed that high glucose treatment of HMRECs leads to a significant increase in apoptosis by 6.1 folds and oxidative stress by 1.7 folds compared to the control (NG) group, p= <0.0001 (Figures 1A and 1B). However, adiponectin treatment to the high glucose-treated cells significantly reduces apoptosis and oxidative stress by 4.90 folds and 1.65 folds, p= <0.0001, respectively, as shown in (Figures 1A and 1B). Moreover, using H2-DCFDA, the results demonstrated significant reduction of ROS after treatment of HG cells with APN as shown in (Supplementary Figure S1). Of note, the HG group exhibited significantly higher apoptosis and oxidative stress rates than the control, APN, and Mannitol groups.
 |
Figure 1 (A–D) HMRECs subjected to high glucose (30mM) and supplemented with adiponectin (30µg/mL) for 24 hours were analyzed for apoptosis (A) and ROS (B). Data were presented as bars and expressed as mean ± SEM. *p≤0.05; HG is significantly different from the control, APN, and Mannitol groups. Φ p≤0.05; HG is significantly different from the HG+ adiponectin (HG+APN) group. (C) Relative changes in immunofluorescence intensity expressed as Mean Fluorescence Intensity. (D) A representative of RSN protein expression of NO in HMRECs exposed to different treatments: 30mM high glucose and adiponectin treatment (30µg/mL) for 24 hours in HMRECs exposed to 30mM glucose (HG+APN). Data were presented as bars and expressed as mean ± SEM. *p≤0.05; HG is significantly different from the control (NG) group. Φp≤0.05; HG is significantly different from the HG+ APN group. DAF-FM Diacetate (see methods) was utilized to detect RSN. Data represent 3–5 independent experiments. Statistical differences were established using the Student’s t-test with a two-tailed p < 0.05. |
Adiponectin Reduces the Reactive Nitrogen Species (RNS) in Hyperglycemia Treated HMRECs
Immunofluorescence staining with DAF-FM diacetate was performed to assess the RSN Immunofluorescence. The results revealed strong RNS signals in HMRECs treated with HG, which is associated with a significant increase in intensity (4.2 folds) compared to the NG (control) group. Conversely, the RSN intensity decreased significantly by 6.0 folds and yielded weak signals for RNS after treatment with adiponectin (30μg/mL) in HG-treated cells, as shown in Figures 1C and 1D.
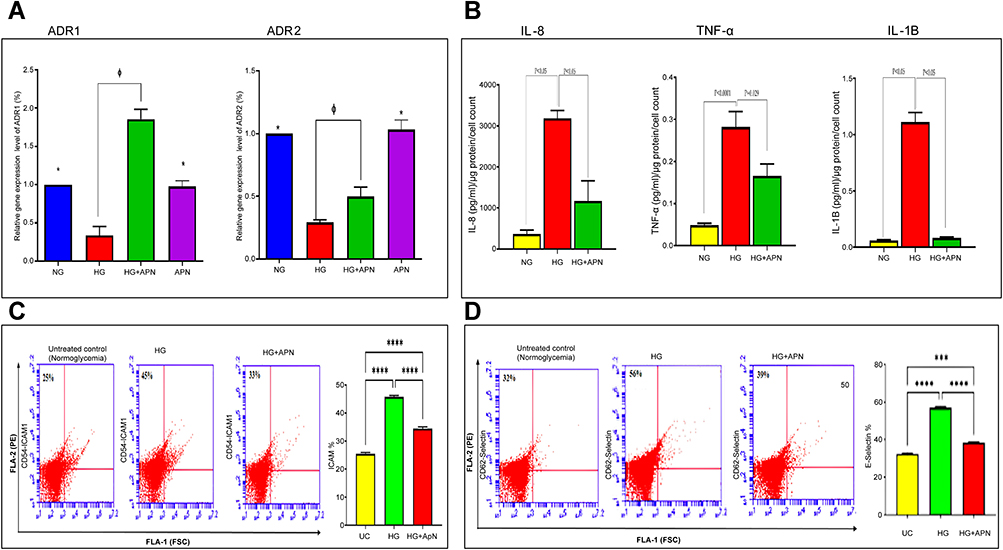 |
Figure 2 (A–D) Quantification of APN receptors, inflammatory mediators and adhesion molecules. (A) Quantification of mRNA level using ADR1 and ADR2 against B-actin by RT-PCR expressed as means ±SEM of 3-5 independent experiments analyzed by one-way ANOVA and post-hoc multiple comparison tests. * p≤0.05; HG is significantly different from the control, and APN groups. Φ p≤0.05; HG is significantly different from the HG+APN group. Two-tailed P value is significant at p≤0.05. (B): Adiponectin dissuades pro-inflammatory cytokines (TNF-alpha and IL-1B) and chemokine (IL-8) proteins. Data represent the Mean and SEM of NG, HG (30mM), and the hyperglycemic group treated with adiponectin (HG+APN). Data represent 3-5 independent experiments. The two-tailed p-value is significant at p <0.05. (C and D): Adiponectin reduces the production of ICAM-1 (C), and E-selectin (D) adhesion molecules. A representative flow cytometry of the protein expression of ICAM-1 (CD 54) and E-selectin (CD 62) in HMRECs exposed to different treatments are displayed in the left panel of Fig C and Fig D, respectively. Bars in Figures C and D show the data presented as Means ±SEM of 2-3 independent experiments analyzed by one-way ANOVA followed by post-hoc multiple comparison tests for ICAM-1 (CD 54), and E-selectin (CD 62), respectively. Two-tailed P value is significant at p≤0.05. *** P≤0.0005 is significant, **** P <0.0001 is significant. |
Adiponectin Upregulates the Gene Expression of Adiponectin Receptors (ADR1 and ADR2) in HMRECs
Guided by the above results, it was imperative to assess the expression of adiponectin receptors to understand how it mediates its effects on HMRECs. The results demonstrated that the HMRECs express the two surface receptors for adiponectin, which demonstrated a significant downregulation of ADR1 and ADR2 mRNA expression (4.8 folds and 3.7 folds, respectively) in response to hyperglycemia, compared to NG. However, treatment with adiponectin resulted in the manifold increased expression level of ADR1 & ADR2 by (5.7 folds and 1.7 folds, respectively), compared to HG, as shown in Figure 2A.
Adiponectin Reduces the Inflammatory Proteins of HMRECs Exposed to Hyperglycemia
To elucidate the possible mechanism of adiponectin-mediated anti-inflammatory and anti-apoptotic effects, the following pro-inflammatory cytokines and chemokine markers; IL-1B, TNF-α, and IL-8, were evaluated for their protein expressions in CM using Multiplex Eliza. It was found that the addition of high glucose to HMRECs significantly increases IL-1B, TNF-α, and IL-8 proteins by 7.0, 5.9, and 18.8 folds, respectively, p<0.0001 compared to cells treated with 5mM glucose (NG). Notably, treatment by adiponectin significantly attenuated the increase of IL-1B, TNF-α, and IL-8 protein expression by 3.7, 1.7, and 11.8 folds, respectively, with p<0.05, compared to the HG group as shown in Figure 2B.
Adiponectin Reduces the ICAM-1 and E-Selectin Adhesion Molecules Production in Hyperglycemia Treated HMRECs
With an effective reduction in the cytokines noticed above, the downstream stimulated cellular adhesion molecules E-selectin and ICAM-1 protein expression was measured by BD® Acuuri Flow cytometry. High glucose significantly upregulated ICAM-1 (CD54) by 1.8 folds, p<0.0001 than cells treated with 5mM glucose, and the addition of adiponectin 30 μg/mL significantly attenuates this increase by 1.3 folds with p<0.0001, as shown in Figure 2C. For E-selectin (CD 62), the present results demonstrated that high glucose significantly upregulates E-slelectin expression by 2.9 folds, p<0.0001 than cells treated with 5mM glucose, and the addition of adiponectin 30 μg/mL significantly decreases the expression of E-selectin in HG cells by 2.6 folds with p<0.0001 as shown in Figure 2D.
Adiponectin Reduces the Leukocyte Migrations in Hyperglycemia Treated HMRECs
The significant influence of adiponectin on inflammatory cytokines supported us to determine whether adiponectin could suppress leukocyte migration. The present results demonstrated that high glucose significantly increases the leukocytes migration compared to normoglycemic cells by 4.4 folds, however after APN treatment of HMRECs exposed to high glucose significantly decreases the leukocyte migration by 1.90 folds (Figure 3A). These data provide evidence that adiponectin tends to decrease leukocyte migration to protect against retinal vessel injury caused by the activated leukocytes’ inflammatory responses.
 |
Figure 3 (A–E) Functional assays. (A) Adiponectin attenuates leukocyte migration. Data presented as Absorbance at 450 nm and a mean ±SEM of 3–4 independent experiments performed by the Endothelial Cell Migration Assay Kit. (B) Characterization of trans-electrical resistance (TER) of HMRECs exposed to different treatment: normoglycemia (NG), high glucose concentration (30mM) (HG), and adiponectin treatment to HG group (HG+APN). (C) Bars show the significance of resistance (barrier function) changes between the different treatment groups presented as mean and SEM. *p <0.05 HG is significantly different from the NG group. Φ p<0.05 HG is significantly different from the HG+APN group. Abbreviations, Normoglycemia cells (NG); High Glucose (HG); and High Glucose +adiponectin (30µg/mL) (HG+APN). Stat analysis was performed by ANOVA (one-way) followed by Dunnett post hoc test for multiple comparison. Data represent 3–4 independent experiments. (D and E) A representative of preventive impact of adiponectin on tube formation of HMRECs exposed to normoglycemia (control), high glucose concentration (30mM) (HG), and adiponectin treatment to HG group (HG+ APN). (E) Bars show the tube formation changes between the different treatment groups presented as mean and SEM. Data represent 3–4 independent experiments.*p <0.05 HG is significantly different from the control group. Φ p<0.05 HG is significantly different from with HG+ APN group. Two talied p value is signficantly less than 0.05. |
Adiponectin Protects HMRECs from Hyperglycemia-Induced Cell Barrier Dysfunction
Based on the striking effects of APN on hyperglycemia-induced HMRECs in vitro, quantification of the adherent cell layers’ cell barrier function was assessed using the ECIS system. The normalized electrical resistance measurement in HMRECs is significantly decreased by hyperglycemia (HG, red line) by ≈60.0% compared to the control group (NG, green line), p<0.05, indicating cell barrier dysfunction. However, hyperglycemic cells treated with adiponectin (HG+APN, black line) demonstrated a significant increase of normalized resistance compared with the HG group by ≈18.0%, p<0.05, exhibiting a partial improvement in the barrier function, as shown in Figures 3B and 3C.
Effect of APN Treatment on Tube Formations in Hyperglycemia Treated HMRECSs
The tube formation assay performed on the cells treated with high glucose for 5 days revealed the length formation of the capillary-like structure increased by≈ 8.0 folds, while APN treatment to hyperglycemic cells revealed an inhibition in tube formation ≈2.8 times, p<0.05. Thus, APN could prevent migration and tube formation in hyperglycemic cells, two fundamental processes for neovascularization, as shown in Figures 3D and 3E.
Effect of Adiponectin Treatment on Proteins Related to Adiponectin Receptors, Anti-Oxidant Enzyme SOD2, and HMGB1 Expressions
Further, to validate the mRNA expression of adiponectin receptors in response to APN treatment of HG cells, we evaluated the protein expression of ADR1 and ADR2 using Western Blot (WB). Adiponectin treatment causes significant upregulation of ADR1 by 5.7 folds (p <0.0001) and ADR2 by 2.1 folds (p 0.019), after HG, as shown in (Supplementary Figure S9A and S9B), which is consistent with gene expression results as shown in Figures 2A. To evaluate the actions of adiponectin on oxidative stress, an antioxidant enzyme was evaluated using WB; Superoxide Dismutase 2 (SOD2), as shown in (Supplementary Figure S9C). APN treatment to hyperglycemic cells causes significant upregulation of SOD2 expression by 5.5 folds (p=0.0001) compared to HG conditions. SOD2 tends to decrease in HG cells compared to NG, without significant changes were detected (P>0.05). Moreover, we evaluated High Mobility Group-B1 (HMGB1), involved in pathways in response to adiponectin treatment after HG exposure of HMRECs. APN treatment causes significant reduction of HMGB1 expression by 1.7 folds (P<0.0001), after exposure to hyperglycemic conditions, as shown in (Supplementary Figure S9D).
RT-PCR Profiler Array, DEGs and GO Analysis
To identify genes or biological pathways, we determined the gene expression profiles of cells exposed to HG (used as a control group) and cells exposed to HG+APN (used as a treatment group). The cut-off value used for significant expression in the present study was set as expressed fold changes of 1.5 and a p-value of < 0.05. The expressed fold changes represent data of the treatment group (HG+APN) versus the control group (HG), as shown in (Supplementary Table S1). The dataset displays 62 differentially expressed genes, with 46 being downregulated and 16 being upregulated with a p-value of < 0.05 corrected. The data representing the differentially expressed dysregulated genes (DEGs) were further evaluated to obtain details of biological processes, cellular, molecular functions, and pathways related to HMRECs exposed to HG and treated with natural hormone adiponectin by application of the bioinformatic analysis.
Panther enrichment pathways analysis demonstrated that the most critical pathways in percentage (Supplementary Figure S2) are Integrin signaling (14.7%), Inflammation mediated by chemokines and cytokines (9.3%), Apoptosis (6.7%), and Angiogenesis (5.3%), in order.
The top upregulated gene and downregulated genes are shown in (Supplementary Table S2A, and S2B.). The top 10 upregulated genes with a rank of expression folds are MMP8, CXCL1, CCL2, ANG, CXCL5, MMP3, NCAM1, TNC, TEK, and PTGS2. On the other hand, the top 10 downregulated genes with a rank of expression folds are COL8A1, OCLN, ECM1, MMP14, ITGB2, IL3, CTNNB1, CD44, ITGA1, and ITGB5. Using the String pathway analysis software (https://string-db.org/), the gene ontology of the top-ranking upregulated genes is GO:0070098; Chemokine-mediated GO:0001525 Angiogenesis, I04668 TNF signaling pathway, and WP4754 IL-18 signaling pathway. On the other hand, the gene ontology of the top-ranking down-regulated genes is GO:0007160 Cell-matrix adhesion, GO:0001525 Angiogenesis, GO:0050839 Cell adhesion molecule binding hsa04512 ECM-receptor interaction, and HSA-216083 Integrin cell surface interactions. Such results highlighted that the upregulated genes are mainly involved in inflammation pathways while the downregulated genes are involved mainly in cellular adhesion, and both share in the biological process of angiogenesis.
Mapping of the DEGs is shown in (Supplementary Table S5) indicating its molecular functions and biological actions. To better understand the detailed mechanisms involved and identify the primary cellular targets that cause endothelial dysfunction of microvascular retinal cells in exposure to hyperglycemia and their changes to APN application, the dataset was integrated into Ingenuity Pathway Analysis (IPA) software using core analysis. However, identifying each gene’s role in the data set is important, but moreover, the interaction of several genes concurrently plays a fundamental role in the outcome of various biological, cellular processes, and molecular functions.
Functional Analysis Using Ingenuity Pathway Analysis (IPA)
Canonical Signaling Pathway Analysis
The most enriched canonical pathways detected in the hyperglycemic microvascular endothelial cells in response to APN, based on Z- Score activity with a ranking of negative values of Z- score of inhibition were the HMGB1 Signaling of Z-core of (−2.21), and [p value=2.41 E−11, with a ratio of 10/157=0.064], Integrin Signaling pathway of Z-core of (−2.83), [p value=1.04 E−7, with a ratio of 8/200=0.04], Neuroinflammation Signaling Pathway of Z-core of (−2.67), [p value=11.5 E−6 with a ratio of 14/200=0.045] followed by p38 MAPK Signaling of Z score (−2.00), [p value=3.37 E−4, with a ratio of 4/115=0.035] as shown in (Supplementary Table S3). Other pathways are shown in (Figure 4A) based on the ratio or number of data set molecules involved, such as agranulocyte and granulocyte adhesion and diapedesis, glucocorticoid receptor signaling, leukocyte extravasation, Il-8, inhibition of matrix metalloproteinase, Apoptosis, Myc Mediated Apoptosis Signaling PI3K/AKT Signaling, LXR/RXR Activation, Renin-Angiotensin Signaling. Among the signaling pathways with a positive Z-score activation value, 0.707 is HIF1α Signaling. Of interest; the Coronavirus pathogenesis pathway was one of the signaling, which is inhibited in HG cells by APN treatment with a Z-score of −0.33, with 9 molecules out of 194 (ratio of 0.046), with a p-value of 4.28 E−9, as shown in (Figure 4A) and (Supplementary Table S3).
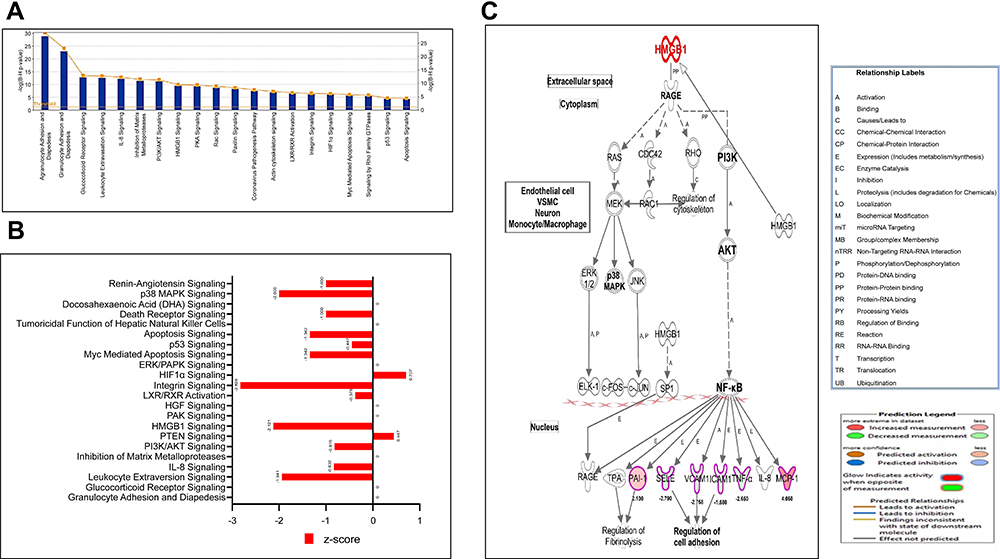 |
Figure 4 (A–C) Canonical pathways by IPA core analysis. (A) Histogram displays the most relevant canonical pathways (p <0.05) involved in the response of HRMECs cells to APN treatment. The rank was based on the log p-value, the ratio of genes of the dataset compared to the knowledge base of IPA. See supplementary tables for details. (B) Bars display the values of Z- activation of the most relevant canonical pathways. (C) Network displays the HMGB1 pathway cascade and involves the downstream genes that are differentially expressed; downregulated as the green color and upregulated as red color, labeled with values of fold changes, and their role in biological process. Abbreviations: A, activation; p, phosphorylation; e, expression; c, causative to; and PP, protein-binding. See legends for details. |
Based on the Z-score value of activation, three pathways with a cut value of ±2 indicating whether the biological activity is stimulated or inhibited are detected, which are HMGB1, Integrin signaling, and p38 MAPK signaling pathways (Figure 4B).
Integrin signaling pathway: integrins are cell surface glycoproteins involved in cell-cell and cell-extracellular matrix (ECM) interactions. These interactions are the basis for several diverse effects, including cell migration and anchorage, cell growth, and differentiation. Key mediators of integrin signaling include Focal adhesion kinase (FAK) and Integrin-linked kinase (ILK). These proteins are essential in forming focal adhesions responsible for signal transduction and assembly of stress fibers. Paxillin is a multidomain, focal contact adapter localizes with integrin-β1, FAK, vinculin, and specific kinases at FA. In addition, it links integrin signaling with p38 MAPK and JNK pathways. APN treatment of HG cells reduces cell adhesion through interaction with integrin signaling pathways, leading to the embarrassment of barrier dysfunction, as shown in (Supplementary Figure S3).
High Mobility Group-B1 (HMGB1) is a DNA-binding protein that constructs nucleoprotein complexes, preserves nucleosome structure, and regulates gene transcription. The HMGB1 pathway is inhibited based on the activation z score (−2.21), indicating that APN has an anti-inflammatory effect via the HMGB1 pathway (Figure 4C). HMGB1 can trigger cell surface receptors through ERK1/2 and JNK and p38; PI3K and Akt; the transcription factors NF-κB and Sp1 as well as Rac1 and CDC42. In addition, HMGB1 communicates through the receptor for advanced glycation end-products (RAGE), a multiligand receptor of the immunoglobulin superfamily, expressed on monocytes and macrophages. The proinflammatory effect of the HMGB1-RAGE axis is significantly linked with the NF-κB pathway, which includes extracellular signal-regulated kinase 1 and 2 (ERK1/2) and p38 MAPK. Then, stimulated NF-κB is translocated to the nucleus and interrelates with DNA as a p65/p50 heterodimer, enhancing proinflammatory cytokine expression as shown in Figure 4C.
p38 MAPK Signaling: p38 mitogen-activated protein family of kinases (p38 MAPK) are activated by different types of stimuli that involve inflammatory cytokines, death ligands (e.g, TNF), transforming growth factor (TGF)-β-related polypeptides, and environmental factors like oxidative stress and UV radiation. Phosphorylation of specific transcription factors is mediated via p38 MAPK activation of MSKs and MAPKAPs. In addition, the activated trans factors trigger transcription of various stress response genes, e.g, those responsible for cytokine production and apoptosis. Adiponectin treatment of HG cells reduces the activity of the p38 MAPK signaling pathway, which could impact apoptosis and cytokine production in treated HG cells, as shown in the (Supplementary Figure S4).
Cellular Process and Molecular Functions
Further, the IPA core analysis provided an in-depth analysis of the crucial cellular process and molecular functions of hyperglycemic HRMECs treated with APN (Figure 5). Details of the top categories of cell process and functions analyzed by IPA based on P values in rank are presented in (Supplementary Table S4). In addition, the following functions are described in the next paragraph as a consequence of adiponectin application to HG HRMECs, which are observed in the present study’s cellular functions and biological processes.
 |
Figure 5 (A-D) Classification of diseases and functions. Figure (A) Bars represent categories are shown in terms of the -log (P-value), as represented by the left y-axis and the diseaes and functions categories represented by the x-axis. A total of 21 representative classifications of diseases and functions of the dataset are differentially expressed genes in HRMECs cells in response to APN. Figure (B) Heatmap represents the classification of diseases and functions. This heatmap was drafted according to its Z-score values, where higher Z-scores represented by Orange indicate activation, while lower Z-scores represented by blue indicate inhibition. Figures (C and D) Network association displays the upregulated (red) and downregulated (green) genes and canonical pathways (CP) involved in apoptosis (C) and production of reactive oxygen species (D) of HRMECs treated with APN. See legends for details, which indicate activation, inhibition, not consistent, and not predicted functions. The yellow arrow indicates increased prediction; the blue arrow indicates decreased prediction, and the gray arrow has no known predicted effects. The lower Z-scores represented by blue indicate inhibition for apoptosis and production of reactive oxygen species. See legends for details. |
Apoptosis Process
One of the cellular functions affected by adiponectin treatment of HG HRMECs is the reduction of apoptosis of the endothelial cells. The IPA core analysis demonstrated inhibition of apoptosis of the endothelial cells by a Z-value of −2.043, with an overlap P value of 7.25 E−15 among the cell death and survival category functions as shown in Figure 5C. In addition, the dataset showed low expressed genes FAS, FASLG, TNF-α, THBS1, BCL2, MMP9, ANGPT1, and IL-B are predicted to inhibit apoptosis, in contrast, the upregulated genes BCL2L1, IGF1, TEK, and VEGFA are predicted to increase apoptosis. Moreover, the figure displays that many canonical signaling pathways are involved in this altered function, such as apoptosis signaling, Myc-mediated apoptosis, P38 MAPK signaling, glucocorticoid receptor signaling, and IL-8 signaling, which support that apoptosis is downregulated in hyperglycemic HMRECs treated with APN via different pathways. Further, such data were validated by the image-based cell cytometer results of decreased apoptosis after APN treatment of the HG group, as shown in Figure 1A.
Production of Reactive Oxygen Species
Reactive oxygen species (ROS) are produced intracellularly via several routes leading to oxidative stress. The present study demonstrated a significant reduction of ROS of HG HRMECs in response to APN treatment. As shown in Figure 5D, ROS production is predicted to be reduced significantly by a value of Z-score (−1.112), with a P-value of 4.10E−27. The genes dataset showed that 25 genes influence ROS production. The upregulated genes such as IGF1, PTGS2, and VEGFA are predicted to increase ROS production, while downregulated genes such as AGT, TNF-α, PECAM1, and ANGPT1 are predicted to decrease the production of ROS. Moreover, Figure 5D displays that this important cellular function involves granulocyte adhesion and diapedesis, glucocorticoid receptor signaling, and HMGB1 signaling pathways. Further, such data were supported by the image-based cell cytometer results of decreased ROS after APN treatment of the HG group, as shown in (Figure 1B and Supplementary Figure S1).
Functions Related to Inflammation and Barrier Function
The chemotactic function is inhibited in HRMECs treated with adiponectin, as shown in Figure 6A. Inhibition is marked with a value of Z-score (−0.786) and the P-value of 5.01E−27. The genes dataset showed that 27 genes influence chemotaxis. Furthermore, the dataset showed that the following upregulated genes, such as CCL2, VEGFA, and PTGS2, are predicted to increase the chemotaxis, while the downregulated set of such genes as AGT, CCL5 IL-1B, TNF-α, CX3CL1, ITGAV, and ANGPT1 gene is predicted to inhibit chemotaxis. The present gene expression data showed comparable findings for the protein biomarker, Interleukin-8 as shown in (Figure 2B).
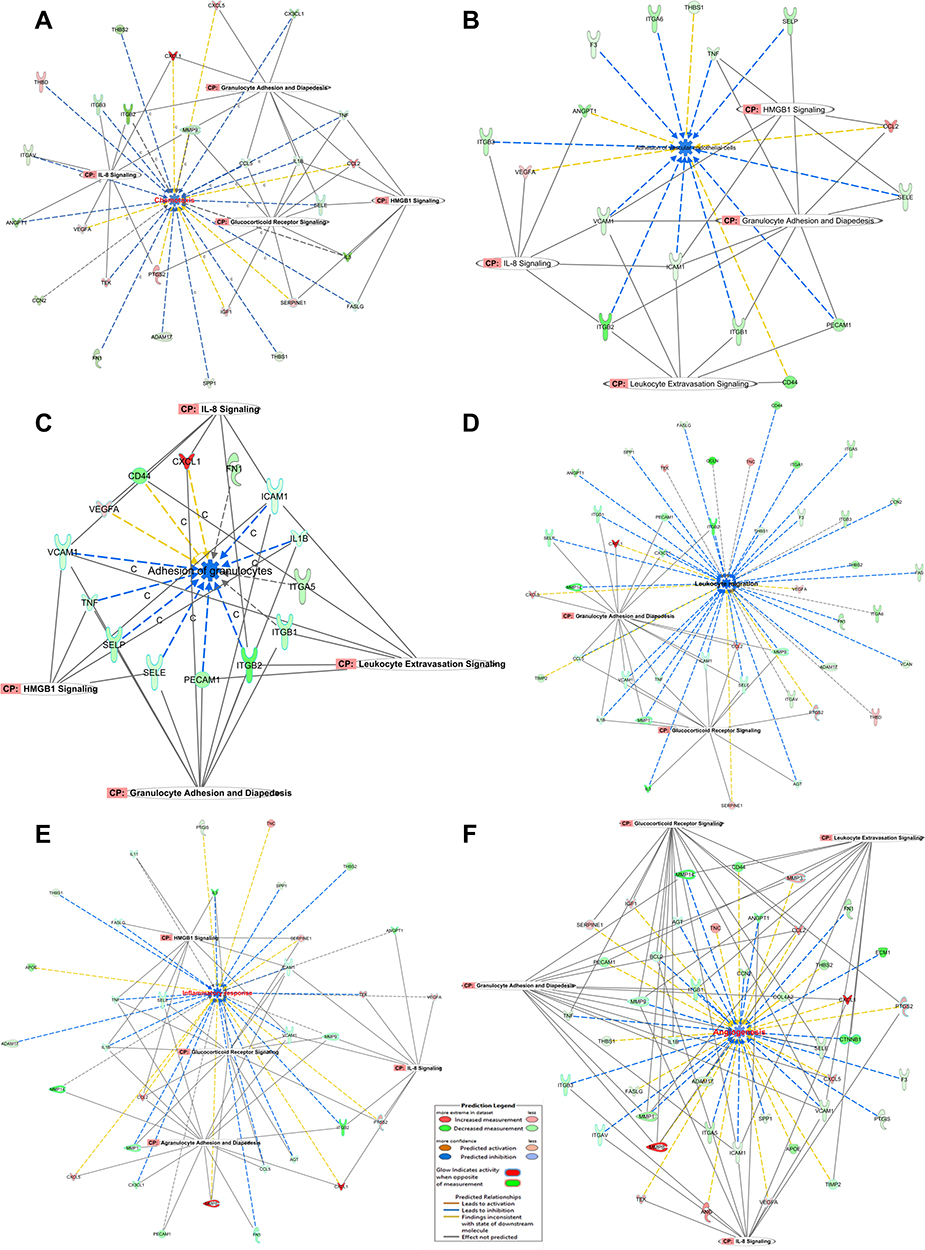 |
Figure 6 (A–F): functions related to pathogenesis. The most important functions are involved in the response of HRMECs to APN treatment. Networks display the upregulated (red) and downregulated (green) genes involved in chemotaxis (A), adhesion of VEC (B), adhesion of granulocytes (C), migration of leukocytes (D), inflammatory response (E), and angiogenesis (F) in HRMECs in response to APN. The Yellow arrow indicates increased prediction, the Blue arrow indicates decreased prediction, and the Gray arrow has no known predicted effects. See legends and results for details. |
Adhesion: Adhesion of vascular endothelial cells is predicted to be reduced after treatment with APN, with a Z-score of (−2.189), with a p-value of 1.01E−24, as shown in Figure 6B. The dataset of the genes showed that 16 genes are involved. F3, VCAM1, and TNF are predicted to decrease the adhesion, while upregulated genes VEGFA and CCL2 increase the adhesion, but ANGPT1 and SELE have no predicted effect. Several pathways are involved, like granulocyte adhesion and diapedesis, leukocyte extravasation, HMGB, and IL-8 Signaling.
Furthermore, as shown in Figure 6C, granulocytes adhesion is predicted to be reduced with a Z-score of −1.806, and p 5.31E−20. The dataset of the genes showed that 14 genes are involved. The downregulated genes: VCAM1, ICAM1, IL1B, SELE, SELP, PECAM1, ITGB2, and TNF are predicted to decrease the adhesion, while the upregulated genes CD44, CXCL1, VEGFA are predicted to increase the adhesion, but ITAG5, ITGB1, and FN1 genes affect the adhesion without a definitive outcome. Decreased adhesion supports the findings of the adhesion assays, as shown in Figures 2C and 2D. Several pathways are involved, like granulocyte adhesion and diapedesis, leukocyte extravasation, HMGB, and IL-8 Signaling.
The migration of leukocytes is predicted to be inhibited. APN treatment of HMRECs causes marked migration inhibition with a Z-score of −3.454, with an overlap p-value of 7.66E−47, as shown in Figure 6D. The dataset of the genes demonstrated that 44 genes are involved. Genes such as IL-1B, SELL, F3, ICAM1, FAS, and TNF are predicted to decrease the migration, while genes such as CXCL1, CXCL5, VEGFA, PTGS2, and CCL2, are predicted to increase the migration. Other genes such as TNC, TEK, and THBD could affect the process without a definitive outcome. Several pathways are involved, like granulocyte adhesion and diapedesis, leukocyte extravasation, glucocorticoid receptor, HMGB1, and IL-8 Signaling. Decreased migration supports the findings of the functional assays regarding the migration assays, as shown in Figure 3A.
Inflammatory Response
APN treatment of hyperglycemic cells of HMRECs causes a predicted inhibition of the inflammatory response indicated by a negative Z- score of −1.610, and p=2.31E−31. The dataset of the genes demonstrated that 33 genes are involved. Genes such as that IL-1B, SPP1, ICAM1, THBS1, AGT, and TNF are predicted to decrease inflammation. In contrast, CXCL1, CXCL5, TNC, PTGS2, and CCL2 are predicted to increase the inflammatory response, as shown in Figure 6E. Several pathways are involved like agranulocyte and granulocyte adhesion and diapedesis, glucocorticoid receptor, HMGB1, and IL-8 Signaling. The present gene expression data showed comparable findings for the protein biomarkers; IL-1B and TNF-α performed as shown in (Figure 2B).
Angiogenesis
Further, APN treatment of hyperglycemic cells of HMRECs causes inhibition of the angiogenesis process indicated by a negative Z-score of −0.450, and p=8.50E−44. The dataset of the genes demonstrated that 43 genes are involved. Genes such as that IL-1B, SPP1, ICAM1, ANGPT1, AGT, and TNF are predicted to decrease angiogenesis. In contrast, CXCL1, CXCL5, ANG, PTGS2, VEGFA, and CCL2 are predicted to increase the angiogenesis response, as shown in Figure 6F and in (Supplementary Table S6). Several pathways are involved in angiogenesis, such as agranulocyte and granulocyte adhesion and diapedesis, glucocorticoid receptor, leukocyte extravasation, and IL-8 Signaling. Decreased angiogenesis supports the findings of the functional assays regarding the angiogenesis assays, as shown in Figures 3D and 3E. In short, this section of results answered the following questions: how cellular processes are predicted to change based on the current dataset’s gene expression and what genes are driving these directional changes.
Further, we investigated the most important regulators and causal networks affected by APN treatment to HMRECs exposed to HG. To reveal the epigenetic factors involved in the response of HMRECs to APN after exposure to HG, we detected the top transcription factors (TFs) and kinases that have the most significant effects on the downstream gene expression in the dataset. Further, we predicted miRNAs, which regulate the current data’s mRNA or gene expression, as shown in Tables 1–3.
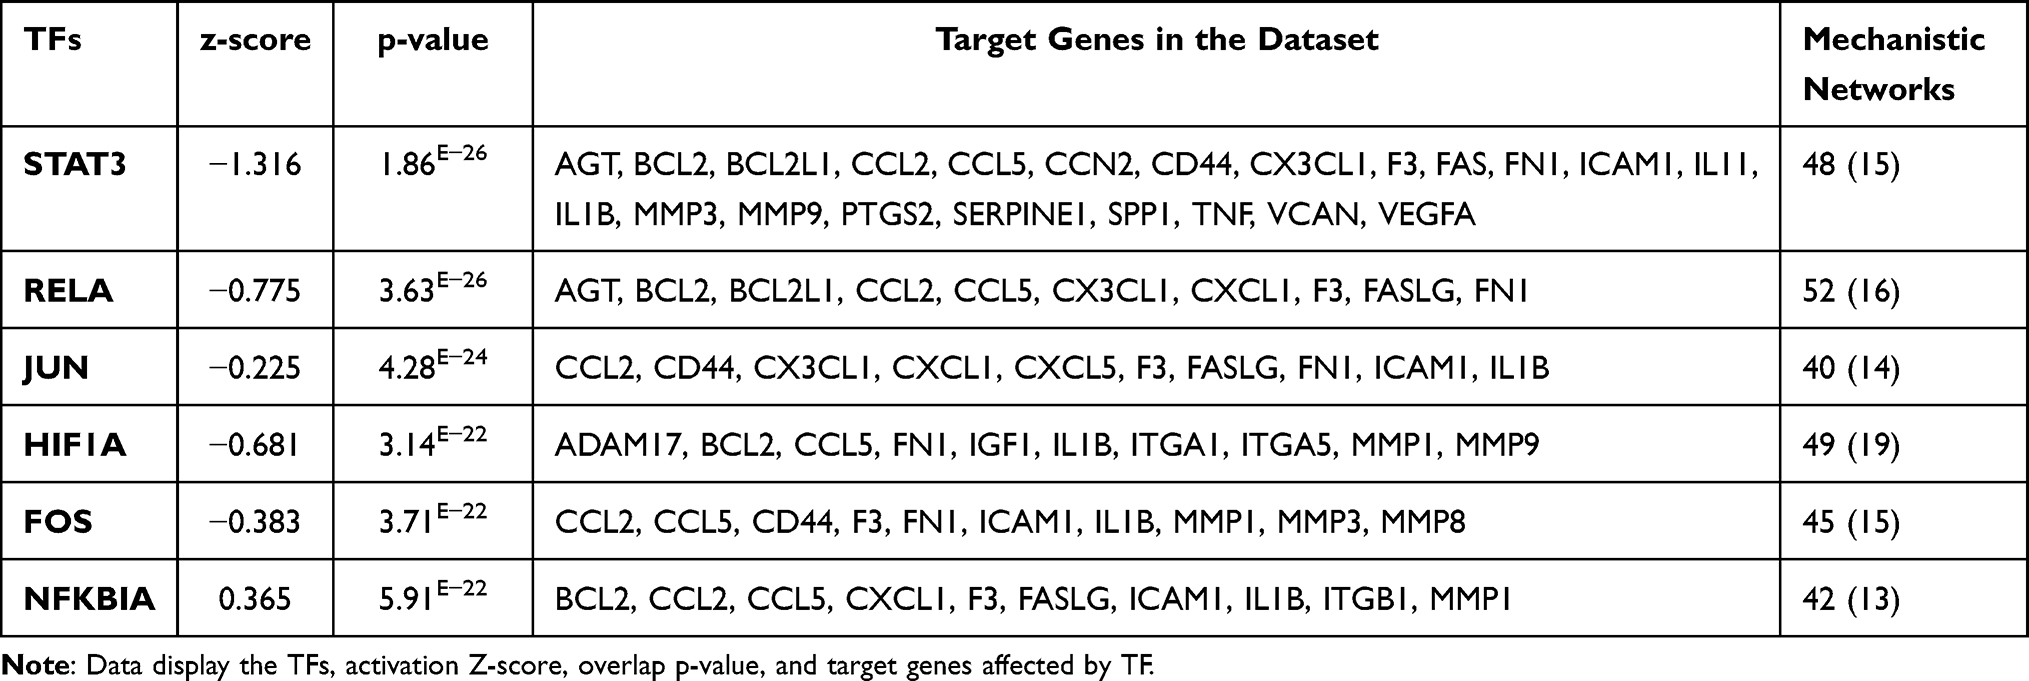 |
Table 1 Master Regulator Transcription Regulators in HMRECs in Response to APN That Affect the Expression of the Genes of the Present Study’s Data Set with Their p-values, Z-Score, and Target Molecule. (Based on Core Analysis in Ingenuity Pathway Analysis (IPA) |
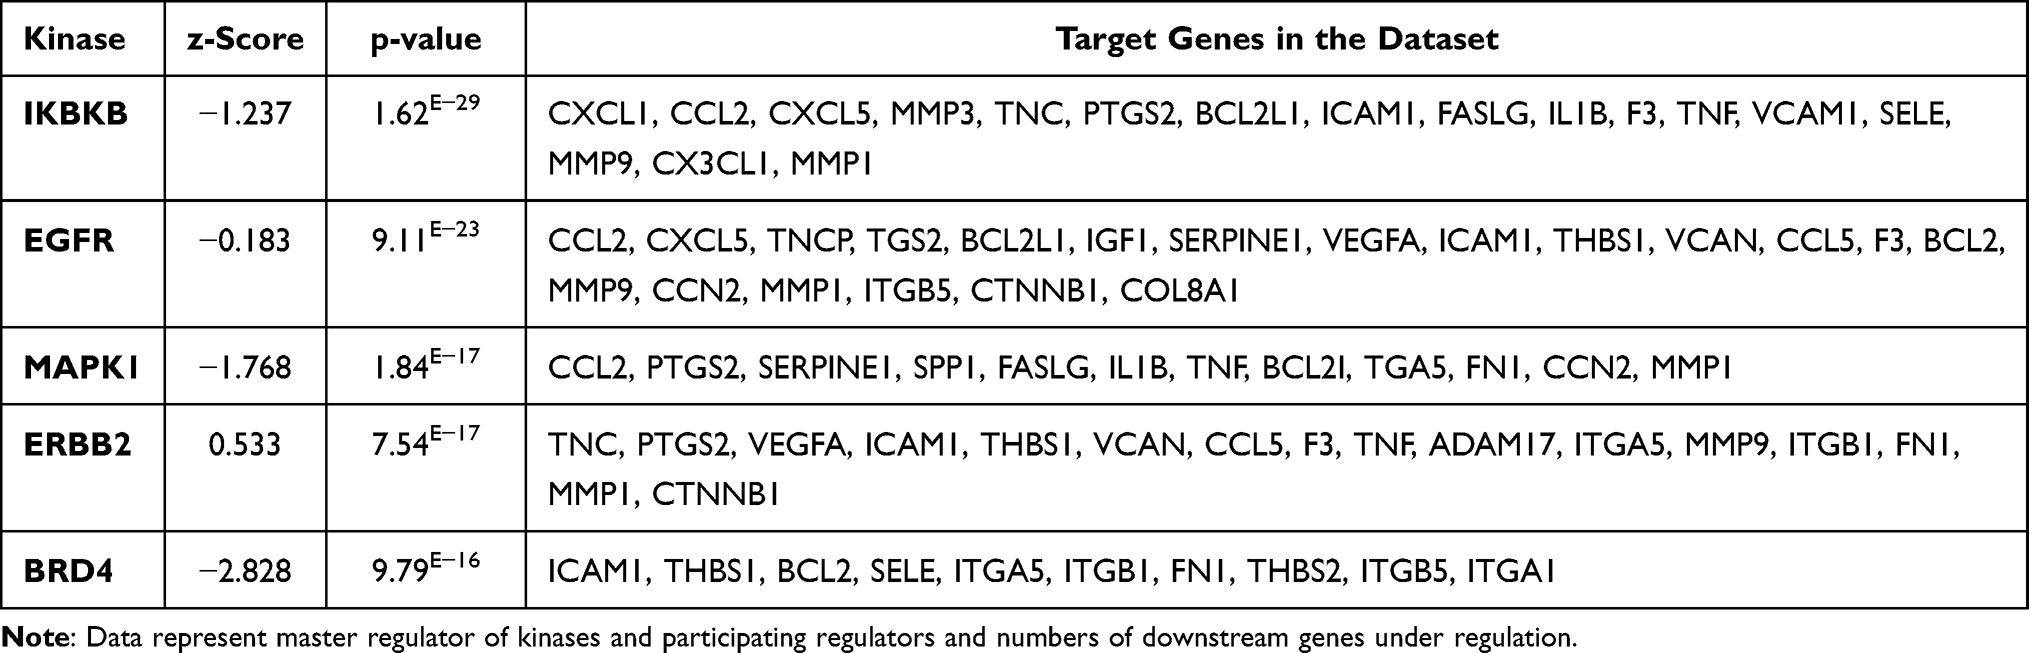 |
Table 2 Master Regulator Kinases in HMRECs in Response to APN Affect the Expression of the Genes of the Present Study’s Data Set with Their p-values, Z-Score, and Target Molecule. (Based on Core Analysis in Ingenuity Pathway Analysis (IPA) |
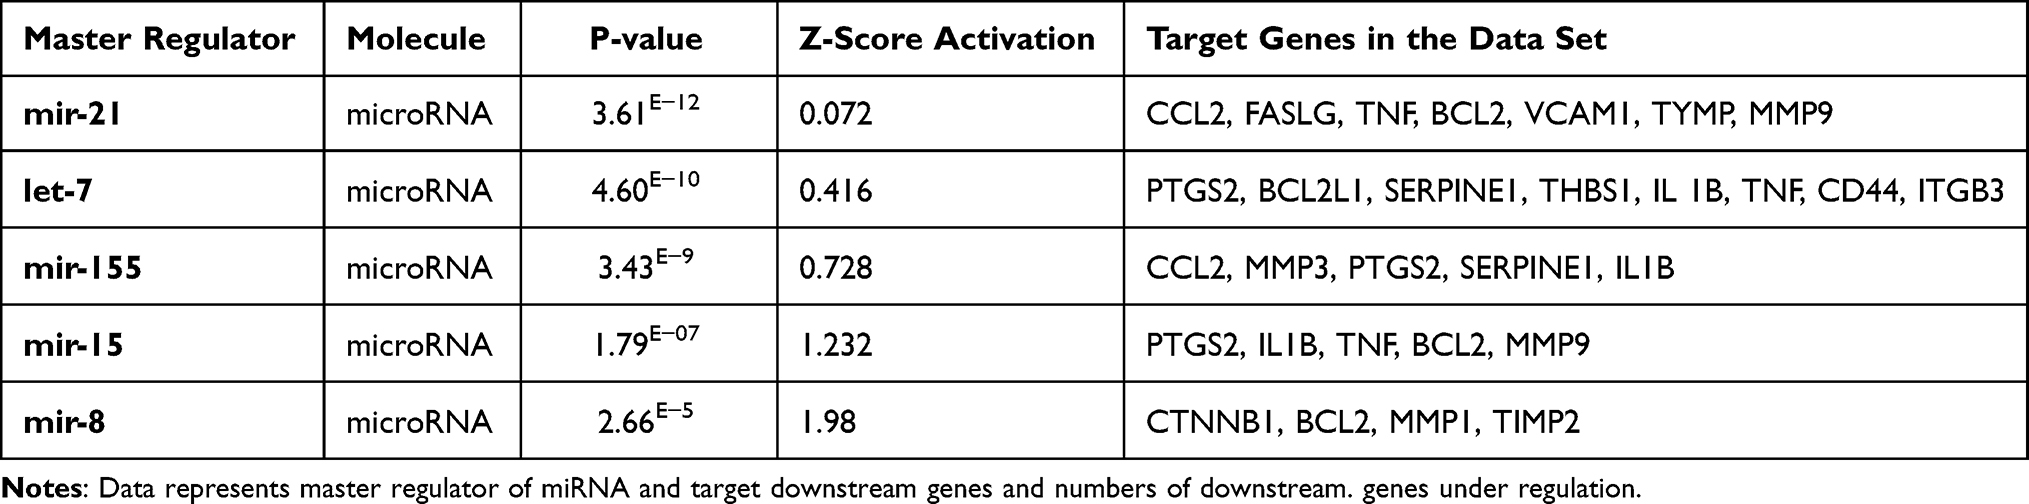 |
Table 3 Master Regulator of miRNA in HMRECs in Response to APN That Affects the Expression of the Genes of the Data Set of the Present Study with Their p-values, Z-Score, and Target Molecule. (Based on Core Analysis in Ingenuity Pathway Analysis (IPA) |
Upstream Regulators Involved in Response to APN
Adiponectin and Transcription Regulators or Factors (TFs)
The following top TFs are detected, STAT3 is Signal Transducers, and Activators of Transcription 3 in the cytoplasm of unstimulated cells become activated by recruitment to phosphoserine motifs within complexes of growth factor receptors, cytokine receptors, or non-receptor tyrosine kinases. STA3 activates 48 mechanistic networks, of which 15 directly affect the downstream genes observed in the current study, as shown in Table 1. JUN is a Jun proto-oncogene, which interacts directly with specific target DNA sequences to regulate gene expression, apoptosis, proliferation, transformation, angiogenesis, and growth. NFKBIA, a gene encodes a member of the NF-kappa-B inhibitor family involved in inflammatory responses that play a role in regulating cell proliferation, apoptosis, and cell survival. Other TFs involved are a hypoxia-inducible factor, Rel-like domain-containing proteins (RELA), a part of the NF-kB subunit, and Fos Proto-Oncogene, AP-1 Transcription Factor Subunit.
The mechanistic network aims to explore plausible sets of connected upstream regulators that can work together to provoke the gene expression changes observed in a dataset. The crosstalk and complexity between different TFs regulating downstream signals, as evident in the following example (Figure 7A) in regulating downstream genes, such as IL-1B and ICAM1. As shown, STAT3 activates ERK, FOS, and NFkB (complex), while it affects RELA, NFKKB1, and ICAM1 directly and indirectly.
 |
Figure 7 Upstream regulators network. (A) STAT3 TF and mechanistic NW: Network displays STAT3 as a direct upstream regulator targeting two important genes: ICAM-1 and IL1B, downregulated (green). The mechanistic network displays the other TFs interconnected with STAT3 as an indirect mechanism affecting ICM-1 and IL1B gene expression, including JUN, JUNB, NFKB1, and NFKBIA RELA, ERK1/2, FOS, Ap1, SP1, TP53, and CEBPB. The lower Z-scores represented by blue indicate inhibition, while higher Z-scores represented by Orange indicate activation. The yellow arrow indicates increased prediction, the blue arrow indicates decreased prediction, and the gray arrow has no known predicted effects. See legends for details, for the relationship label and prediction legend. (B) IKBKB kinase and mechanistic NW: The network displays IKBKB kinase as a direct upstream regulator that targets two important genes: VCAM-1 and TNF, which are downregulated (green). The mechanistic network displays the other TFs interconnected with IKBKB as an indirect mechanism affecting the gene expression of VCAM-1 and TNF, including JUN, JUNB, NFKB1, NFKBIA, RELA, ERK1/2, FOS, Ap1, SP1, ERK1/2, andIRF1. The lower Z-scores represented by blue indicate inhibition, while higher Z-scores represented by Orange indicate activation. The yellow arrow indicates increase prediction, the blue arrow indicates decreased prediction, and the gray arrow has no known predicted effects. See legends for details, for the relationship label and prediction legend. (C) miRNA8 and mechanistic NW: Network displays mir8 as a direct upstream regulator, which targets four important genes, which are CTNNB1, BCL2, MMP1, TIMP2, which are downregulated (green). The mechanistic network displays that mir8 like other TFs such as Wnt receptor and AKT kinase, which through the indirect mechanism affecting other gene expressions of CD44, TNF, SPP1, MMP-9, VEGFA, PTGS2, CCL2, FN1, BCL2L1which include JUN, JUNB, NFKB1, NFKBIA, RELA, ERK1/2, FOS, Ap1, SP1, ERK1/2, and IRF1. Other genes affect Akt, such as F3, FASLG, THBS2, MMP14, and VACM1. The lower Z-scores represented by blue indicate inhibition, while higher Z-scores represented by orange indicate activation. The yellow arrow indicates increase prediction, the blue arrow indicates decreased prediction, and the gray arrow has no known predicted effects. See legends for details, for the relationship label and prediction legend. |
Adiponectin and Kinases
IKBKB is an inhibitor of nuclear factor-kappa B kinase subunit beta, which in turn changes the expression of downstream 17 genes of the dataset. APN causes a significant effect on IKBKB kinases, which are predicted to be inhibited with a Z-score of −1.237. The protein encoded by this gene phosphorylates the inhibitor in the inhibitor/NF-kappa-B complex, causing dissociation of the inhibitor and activation of NF-kappa-B. As shown in Figure 7B, IKBKB kinase regulates NFkB (complex), conserved helix-loop-helix ubiquitous kinase (CHUK), ERK1/2 members who crosstalk. These either activate or inhibit directly or indirectly several transcription regulators (TFs) such as RELA proto-oncogene, NF-kB subunit, IRF-1 interferon regulatory factor 1S homeolog, PPARG; peroxisome proliferator-activated receptor gamma as shown in Figure 7B, which ultimately affects downstream target genes such as TNF and VCAM1. This is an example of a mechanistic network where kinases upstream regulate the gene expression of downstream target genes in response to APN treatment of HG cells, which helps to predict indirect pathways of regulations and novel pathways of IKBKB.
The crosstalk between APN and IKBKB is demonstrated through several pathways mainly via TFs such as AKT, Stat3, NFKB1, NFKB1A, P38MPAK, and PI3 complex, which affect the expression, localization, phosphorylation, and activation of IKBKB kinase, which in turn affects the data set of the expressed genes as shown in (Supplementary Figure S5).
The epidermal growth factor receptor (EGFR) is the tyrosine kinase binding ligands of the EGF family and activates several signaling cascades to convert extracellular cues into appropriate cellular responses. APN treatment causes a significant effect that is predicted to inhibit the kinase activity with a Z score of −0.183. In response to APN, the inhibited EGRF affects the gene expression of 20 genes of the data set (Table 2). APN causes inhibition of the Mitogen activated protein kinase 1 (MAPK1 kinase), which is predicted to be inhibited with a Z score of −1.768, which affects the downstream expression of 12 genes of the data set (Table 2).
Moreover, BRD4, bromodomain-containing 4 is a kinase present in the nucleus, which is predicted to be inhibited with a Z-score of −2.828 and overlap P value of 1.89 E−13. Furthermore, it affects the expression of the following downstream 10 genes of the data set ICAM1, THBS1, BCL2, SELE, ITGA5, ITGB1, FN1, THBS2, ITGB5, and ITGA1. These genes participate in two biological processes related to inflammation: cellular infiltration and chemotaxis, and the agranulocyte adhesion and diapedesis is the canonical pathway, as shown in (Supplementary Figure S6), which is an example of a causal network.
APN and miRNA
Table 3 demonstrates the top miRNA based on their p values changes in the response of HG cells to APN treatment with a predicted Z score of activation and the target genes affected by these miRNAs. miRNAs are non-coding RNAs involved in the post-transcriptional regulation of gene expression in multicellular organisms by affecting the stability and translation of mRNAs. Table 3 demonstrates the miRNA, target genes, P-value, and Z-score of activation. For example, miRNA-8 with the highest z-score value in the table As shown in Figure 7C, miRNA-8 affects 4 master genes; catenin beta 1 (CTNNB1), which is a part of a complex of proteins that constitute adherent junctions, and BCL2 (apoptosis regulator) gene, TIMP2 (tissue inhibitor of metalloproteinase 2), and MMP1 (matrix metalloproteinase 1). The figure demonstrates a casual, mechanistic network of the ultimate functions regulated by the upstream regulator (mir-8) and its pathways relationship via AKT (Protein kinase B (PKB) and Wnt (Wingless and Int-1) activation that affect a subset of downstream genes involved in angiogenesis, as shown in Figure 7C.
Functional Network Analysis
This analysis aims to reveal as many interactions as possible among user-identified molecules in the present dataset and how they could work out collectively at the molecular level, and highly interconnected networks are possible to suggest critical biological functions. For example, genes/molecules from the Knowledge Base may be added to the network to pile up or join spots lacking connectivity. The resulting networks are scored and then categorized based on the score. As shown, several NWs are detected, as in Figure 8A.
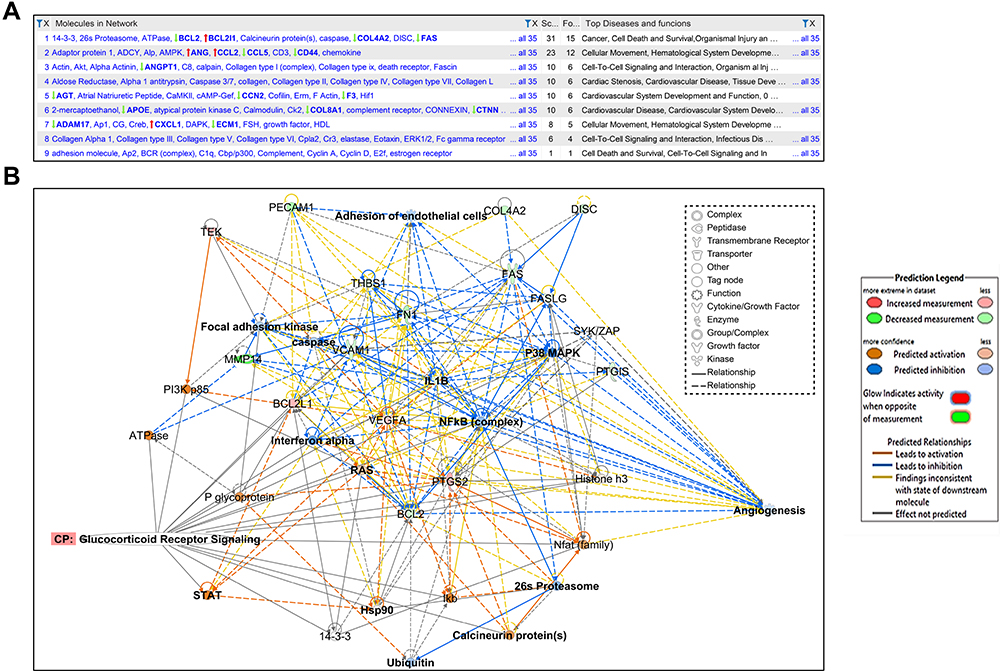 |
Figure 8 Biological network. (A) The figure displays 9 molecular networks which are ranked based on the score, number of molecules involved whether the DEGs of the data set (focus), and other molecules provided by the IP knowledge base (non-focus) to complete the biological process and molecular function and demonstrates the top functions and diseases of each network. (B) Network shows interactions between dysregulated genes, functions, and upstream regulators in response of HRMECs cells to APN treatment. The figure illustrated the molecules and pathways involved in suppressing angiogenesis and adhesion of EC functions in response to APN treatment to HG cells. The network analysis displayed that the following focus (BCL2L1, BCL2, COL4A2, FAS, FASLG, FN1, IL1B, MMP14, PECAM1, PTGIS, PTGS2, TEK, THBS1, VCAM1, VEGFA) and non-focus molecules which added by IPA knowledge base, (DISC or CASP8, FAK, NFkB complex, PI3k p85, STAT, Ubiquitin, 26s Proteasome, Calcineurin protein, Histone h3, IFN-α, P glycoprotein, SYK/ZAP, ATPase, 14-3-3 “CBP,” caspase, Hsp90, P38 MAPK, Ikb, Nfat, RAS). The top annotated diseases and functions are cancer, cell death, survival, and organismal injury and development. In addition, the network displays the canonical pathway involved in angiogenesis and adhesion of EC related to the glucocorticoid receptor signaling pathway. The upregulated (red) and downregulated (green) are illustrated. See legends for details, for the relationship label and prediction legend. |
Network1 (NW1)
NW1 has the highest score of 31 (Figure 8A), and contains the highest number of focus molecules in the dataset of DEGs (n=15). Figure 8B, illustrated the molecules and pathways involved in suppressing angiogenesis and adhesion of EC functions in response to APN treatment to HG cells. The network analysis displayed that the following focus (BCL2L1, BCL2, COL4A2, FAS, FASLG, FN1, IL1B, MMP14, PECAM1, PTGIS, PTGS2, TEK, THBS1, VCAM1, VEGFA) and non-focus molecules, which added by IPA knowledge base (DISC or CASP8, FAK, NFkB complex, PI3k p85, STAT, Ubiquitin, 26s Proteasome, Calcineurin protein, Histone h3, IFN-α, P glycoprotein, SYK/ZAP, ATPase, 14-3-3 “CBP,” caspase, Hsp90, P38 MAPK, Ikb, Nfat, RAS). As shown in Figure 8B, many genes are involved in angiogenesis and adhesion of EC related to the glucocorticoid receptor signaling pathway. The top annotated diseases and functions are cancer, cell death, survival, and organismal injury and development. Furthermore, Table 4, shows the annotated functions related to network 1 and the (Supplementary Table S10) demonstrates the focus and other molecules (non-focus) that act as TF (eg, NAFT, STAT), kinase (eg, P38 MAPK), enzymes (eg, 26s Proteasome), and receptors involved in the network. The following functions are involved in the pathogenesis of biological processes related to diabetic retinopathy, as shown in Table 4.
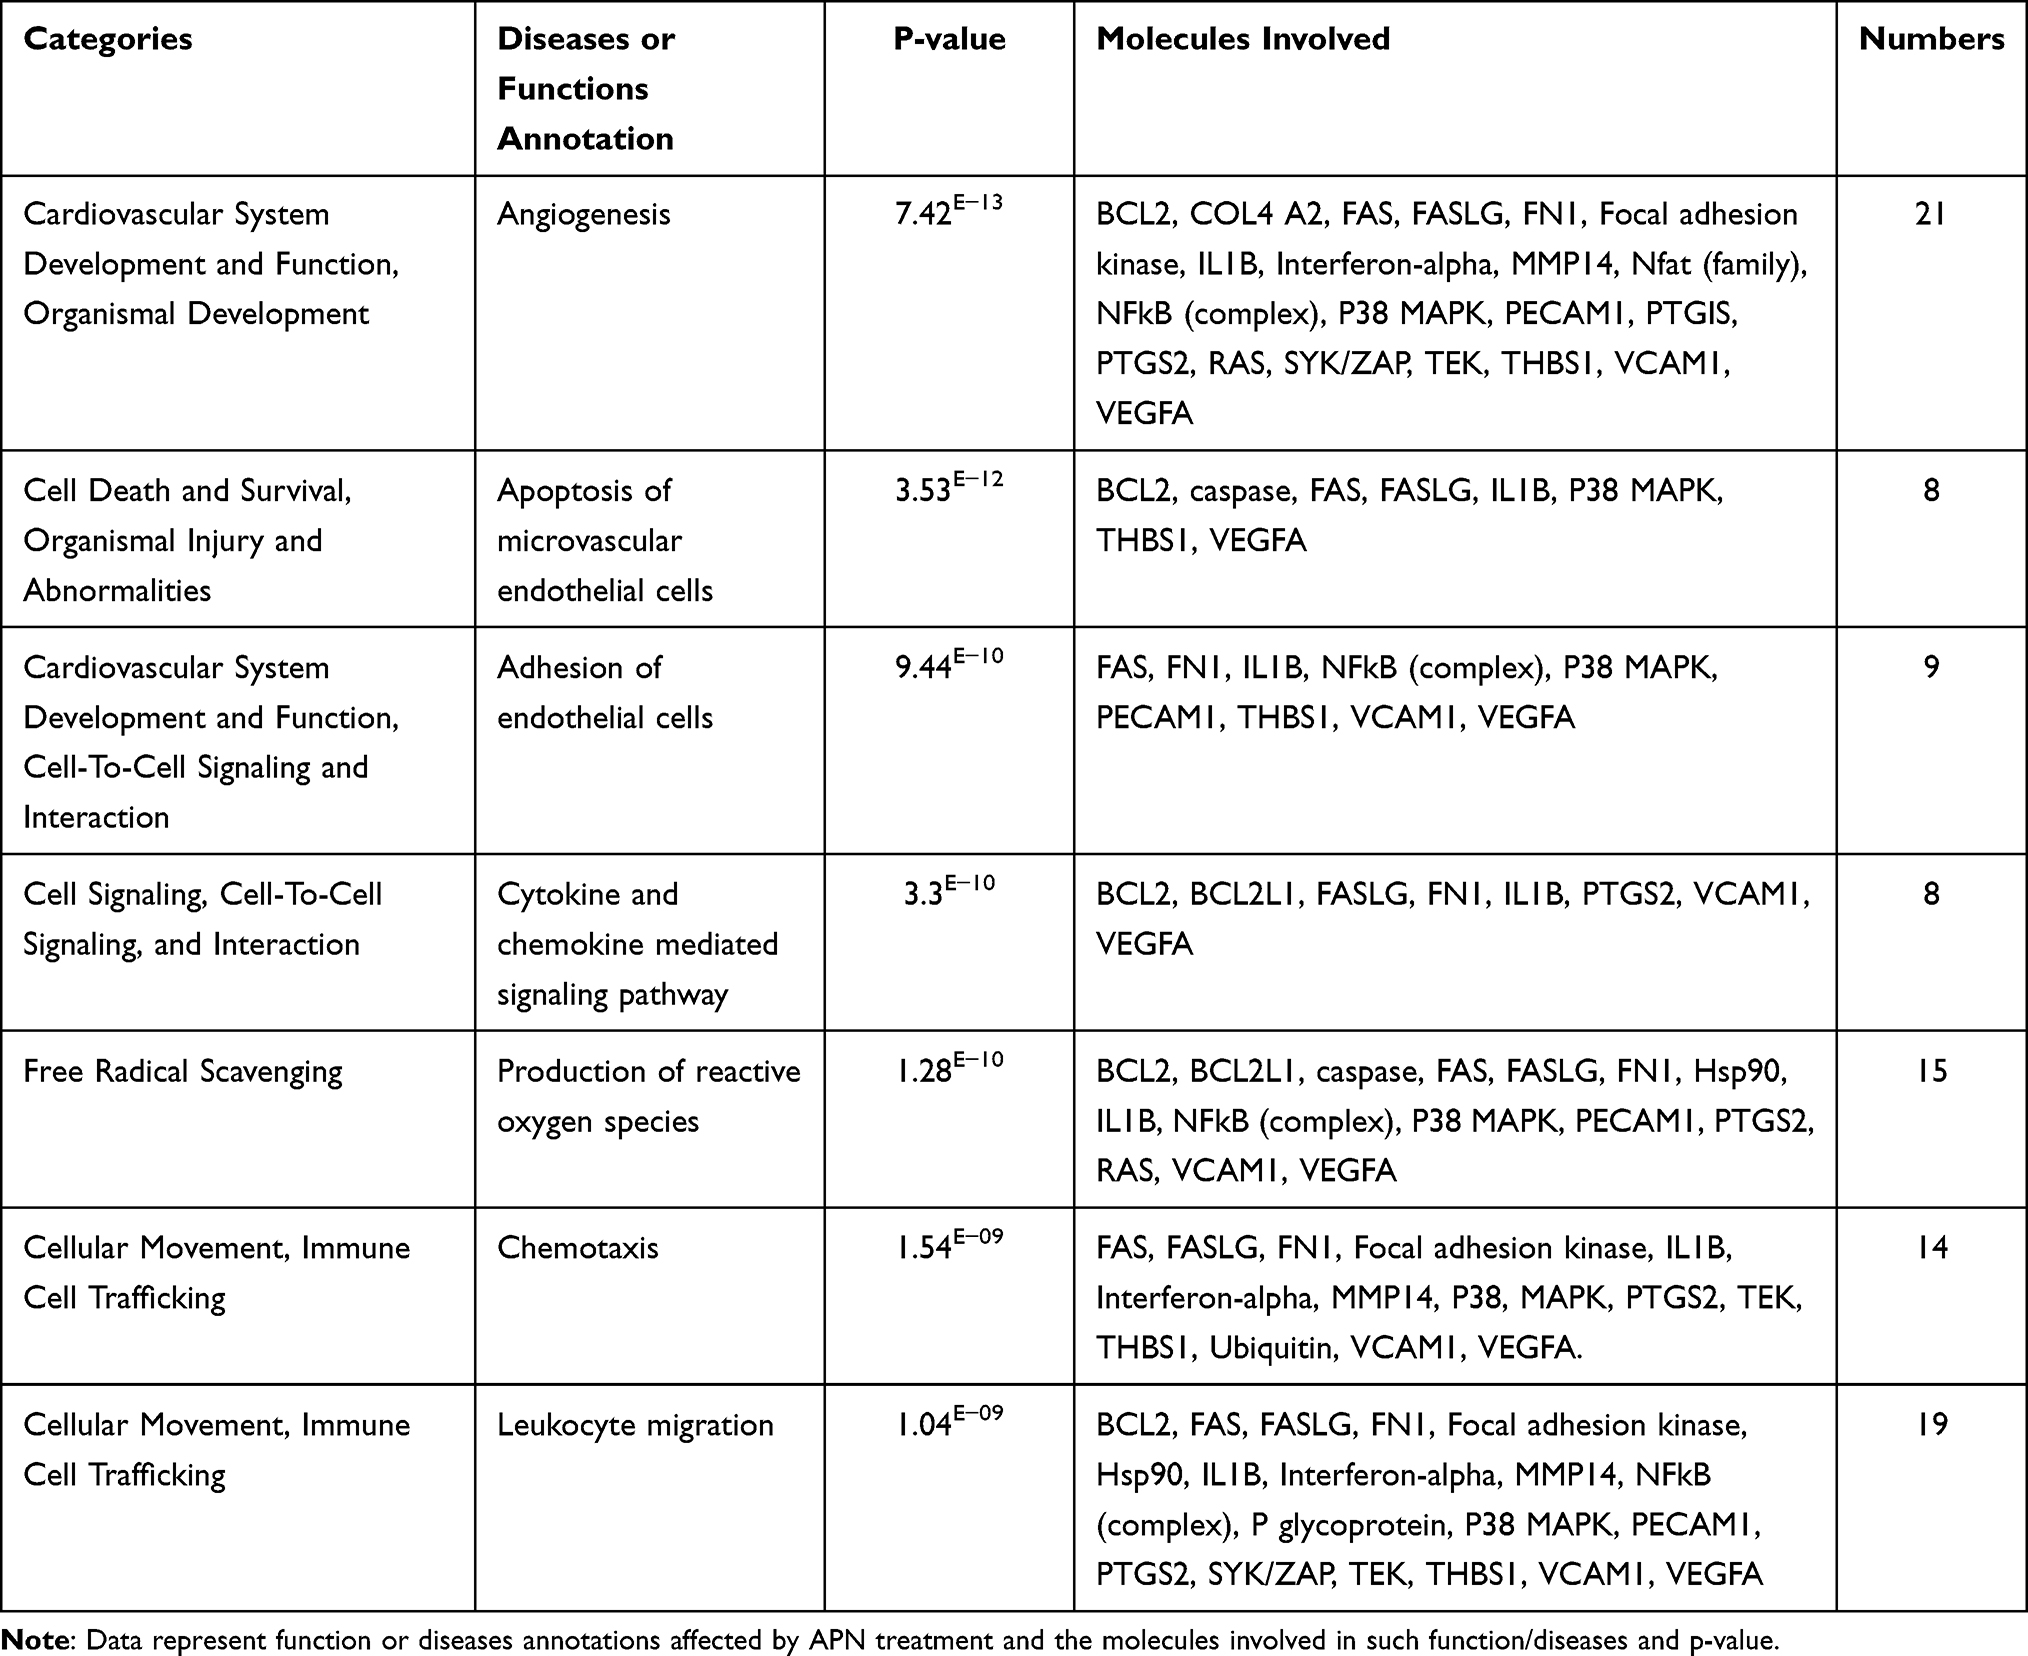 |
Table 4 Categories of Functions and Diseases in Network 1, Indicating p-value, and Molecules Involved and Their Numbers/Each Function or Disease |
Network2 (NW2)
The second proposed functional network demonstrates a score of 23 (Figure 8A), with three primary functions of cellular movements, hematological system and development, and immune cell trafficking and their annotations, as shown in Table 5. It involved 23 molecules, of which are 12 in focus which are ANG, CCL2, CD44, ITB2, TNC, SELP, VACN, CCL5, Cx3CL1, SPP1, CxCl5, ITGB1, and 11 non-focus, which are Adaptor protein 1, Cytokines, G protein alpha, Ped4, Rac, ADCY, chemokine, Dynamin, Gpcr, MAPK, Pdgfr, Alp, ERK, IKK complex, metalloproteases, PLC, Via-4, CD3, G protein, PLC-gamma, and TCR. The top functions of NW2 are Cellular movements, Hematological system development and function, and Immune cell trafficking (Supplementary Figure S7A).
 |
Table 5 Categories of Functions and Diseases Annotations in Network 2, Indicating p-value, and Molecules Involved and Their Numbers/Each Function or Disease |
Network3 (NW3)
The third proposed functional network in order demonstrates a score of 10 (Figure 8A). It involves 35 molecules, of which are 6 in focus, which are ITGB5, ITGA1, ITGA5, THBS2, ITGA6, ANGPT1, and 29 non-focus, which are Actin, Cytokines, AKT, Alpha Actinin, C8, calpain, Collagen type I (complex), Collagen type ix, death receptor, Fascine, Fgf, Fgfr, Filamin Abp, Glycoprotein 1B, Hspg, ICAM, Integrin, Integrinα3β1, Integrinα4β1, Integrinα5β, Integrinβ, ITGα5-ITGβ1/2, Lfa-1, Lymphotoxin, MAC, N-Cadherin, secreted MMP, Smad2/3-Smad4, TMSB4, and VLDL. The annonated top functions of NW3 are Cell to cell signaling and interaction, Organismal Injury and Abnormalities, and Tissue development as shown in Table 6 and (Supplementary Figure S7B). As shown in the networks, the functions are related mainly to inflammatory pathways and the development of angiogenesis. The results demonstrated that APN mainly affects biological functions related to inflammation pathogenesis, such as migration, adhesion of VEC, leukocytes, chemotaxis, recruitment of leukocytes, then angiogenesis, ROS, and apoptosis.
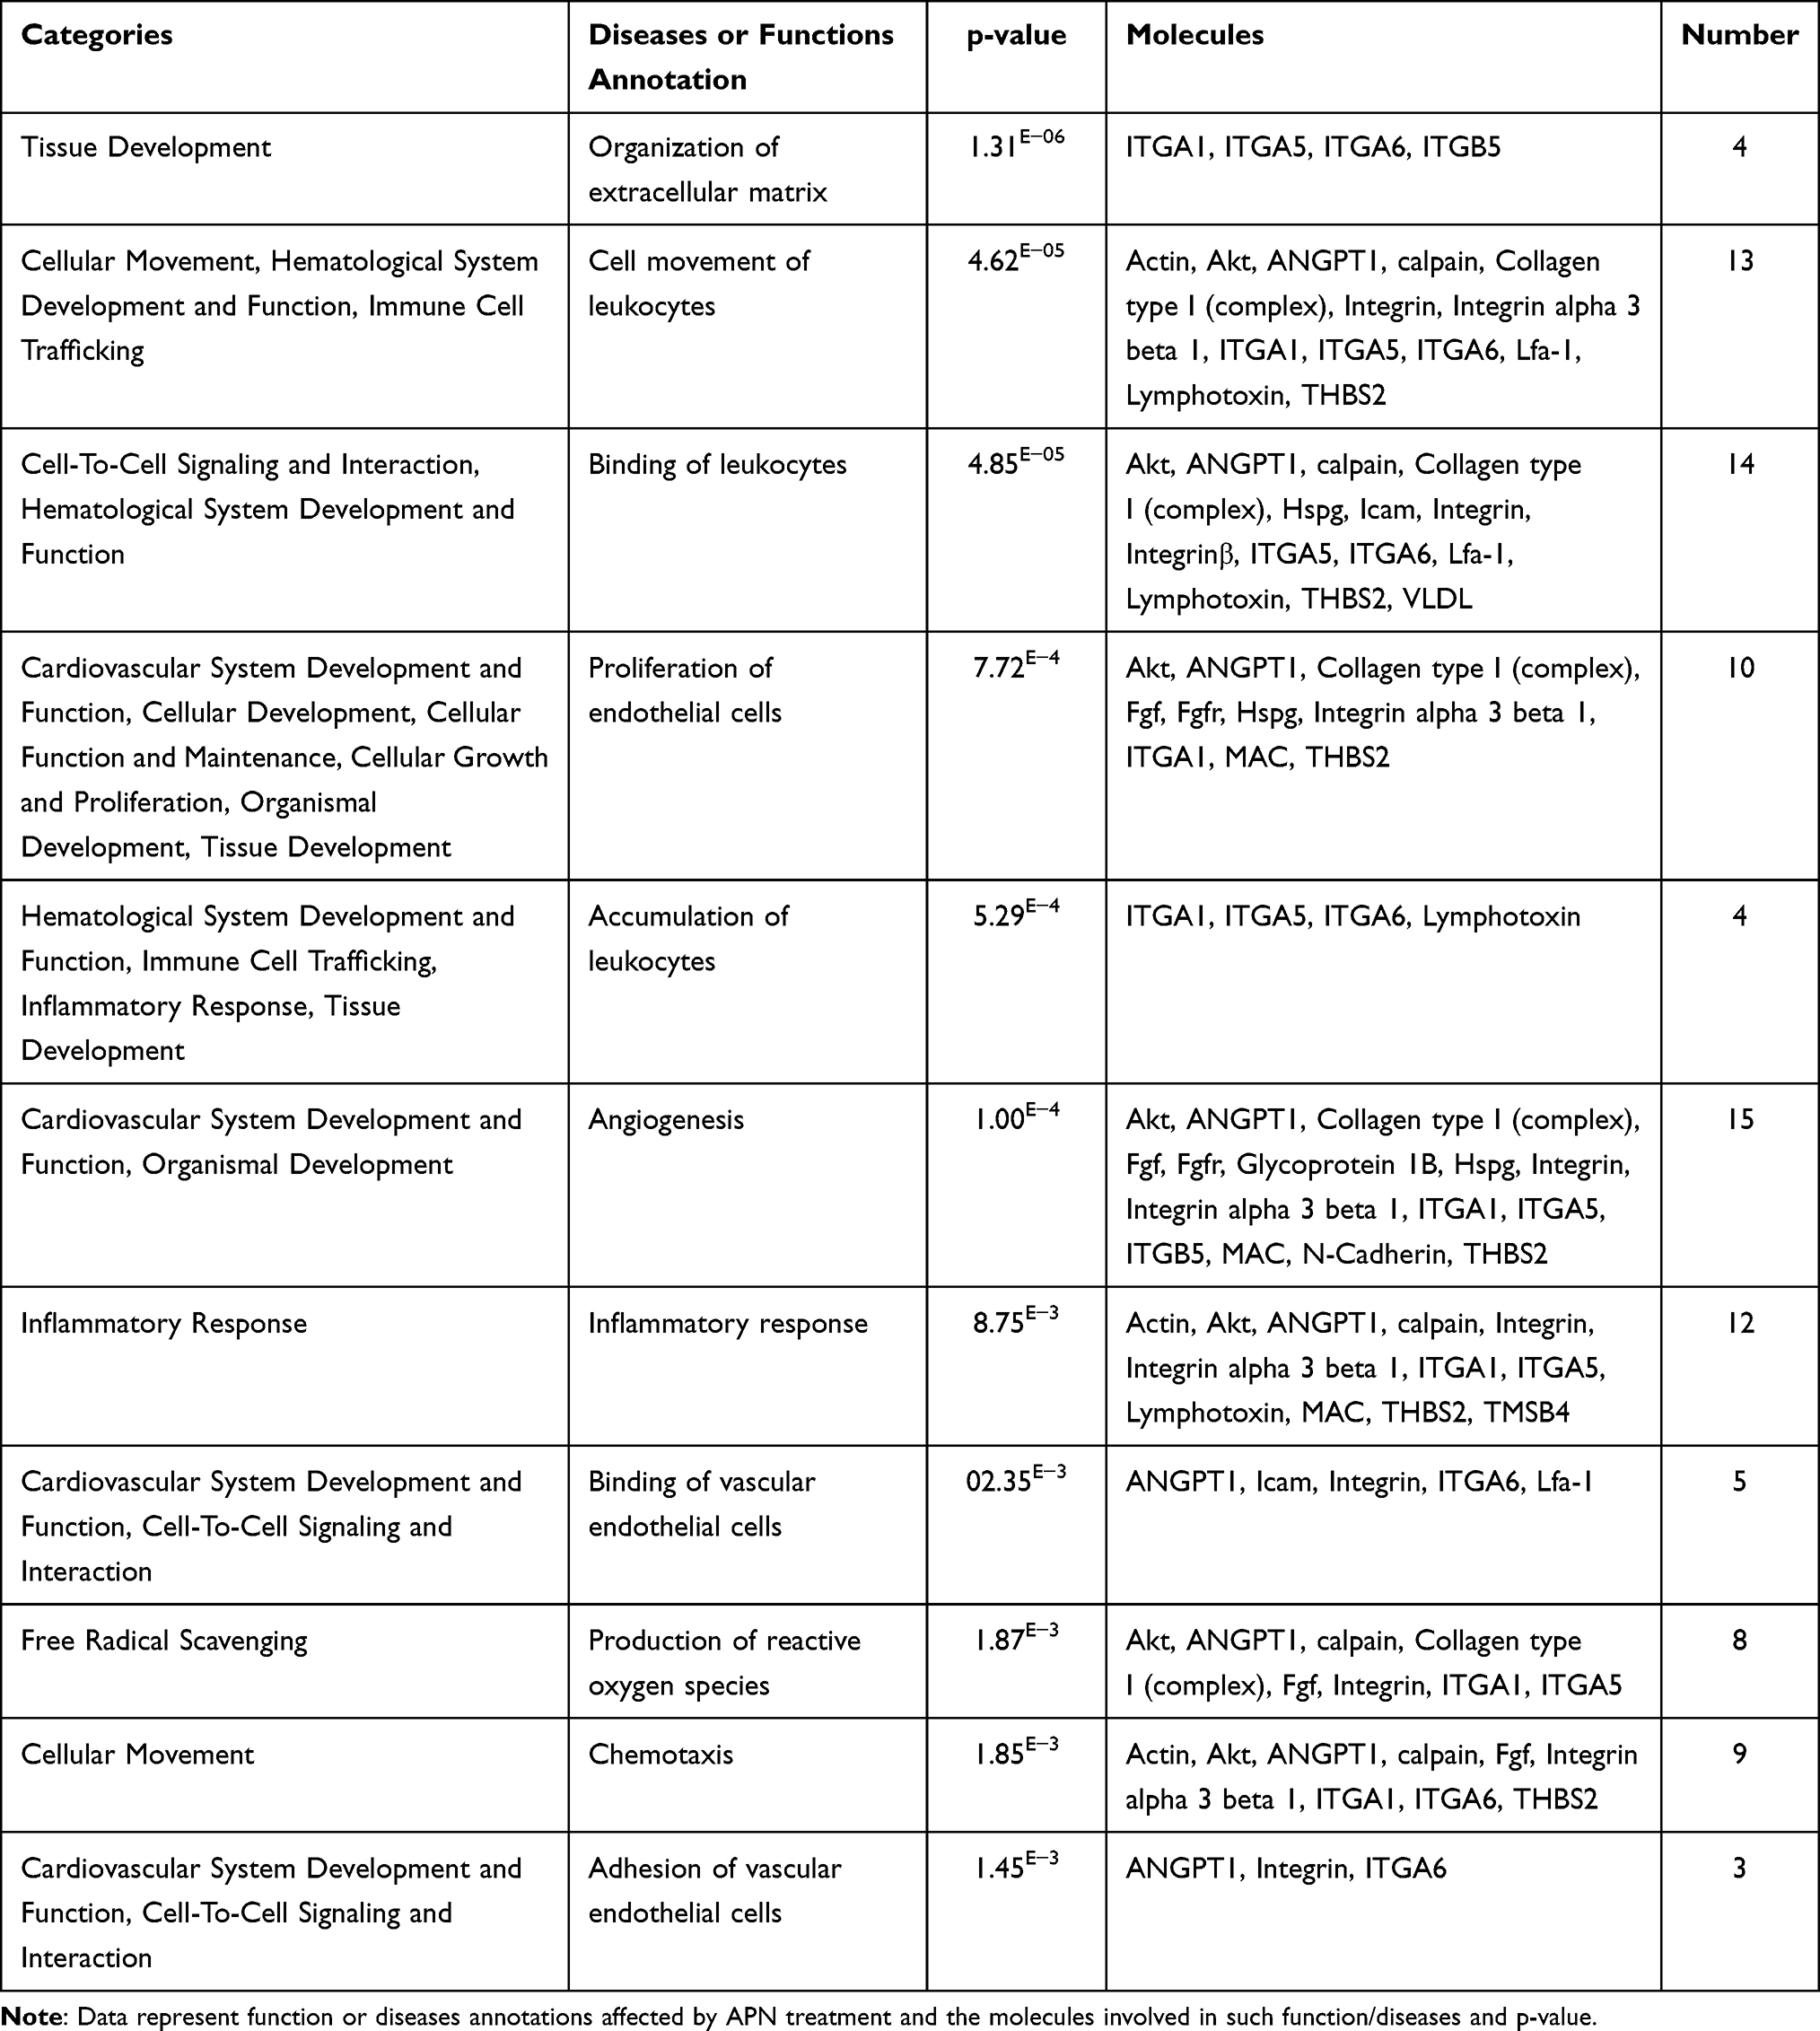 |
Table 6 Categories of Functions and Diseases Annotations in Network 3, Indicating p-value, and Molecules Involved and Their Numbers/Each Function or Disease |
Discussion
The present study assessed cellular and biological processes involved in the pathogenesis of the DR. Furthermore, the study explored the actions of APN on functional assays such as the migration, the retinal endothelial barrier function, and angiogenesis in primary human microvascular retinal endothelial cells (HMRECs) treated with APN under hyperglycemic conditions (30mM). Furthermore, the gene ontology and core pathway analysis identified biological processes and canonical pathways. They detected key regulators of such pathways and causal networks involved in the phenotype of cellular and biological processes in responses to APN application to HMRECs under high glucose conditions.
The main findings of this study are: 1) adiponectin significantly reduces the rate of ROS and RSN production and the apoptosis rate in hyperglycemic HMRECs; 2) adiponectin upregulates the expression of ADR1 and ADR2 significantly in HMRECs exposed to hyperglycemia; 3) adiponectin downregulates the expression of inflammatory proteins of TNF-α, Il-8 and Il-1B; and adhesion molecules ICAM-1 and E-selectin; 4) adiponectin ameliorates the barrier dysfunction in hyperglycemic cells with inhibition of the leukocyte and endothelial cell migrations; and 5) adiponectin ameliorate basal tube formation and leukocyte migration. Furthermore, one of the most critical canonical pathways altered by APN of HG cells is inhibiting the Integrin Signaling pathway, HMGB1 Signaling pathway, and p38 MAPK Signaling. In addition, APN affects upstream regulates of transcription factors such as STAT3; signal transduction and activator of transcription, NFKB; nuclear factor-kappa B, kinases such as IKBKB; inhibitor of nuclear factor-kappa B kinase subunit beta and miRNAs such as mir-8. Overall, adiponectin improved the barrier function and decreased the permeability in retinal endothelial cells exposed to hyperglycemia, thus ameliorating the inflammation and angiogenesis. These findings echo the potential role of APN as a promising tool in the management of DR.
Previous studies reported the anti-angiogenic effect of APN on various cells and diseases.8,10,18 However, a recent study by Palanisamy, K. et al (2019) demonstrated the anti-angiogenic effect of adiponectin in human retinal microvascular endothelial cells,19 which is consistent with the present data that globular adiponectin application ameliorated the angiogenesis as evident by the functional assay of tube formation and bioinformatics analysis where angiogenesis process is inhibited.
Arbitrated by its two receptors APN is engaged in different biological processes. AdipoR1 is signaling via activated protein kinase (AMPK) phosphorylation, and AdipoR2 has engaged in peroxisome proliferator-activated receptor α (PPARα) activation.20 Furthermore, we demonstrated that the HMRECs express the two types of adiponectin receptors (ADR1 and ADR2) in the present data. These findings are consistent with a study by Liu et al, 2013 which demonstrated that APN, AdipoR1, and AdipoR2 are expressed in both human and mouse retinas.21 Furthermore, the current results demonstrated that hyperglycemia downregulates the expression of both ADR1 and ADR2 receptors in HMRECs, and adiponectin restores its expression (mRNA and protein) after treatment. This finding is inconsistent with a previous study that demonstrated a significant increment in the mice retina AdipoR1 mRNA levels in the diabetic mice model type 1 using streptozotocin, compared to control but without significant change of ADR2.21 The difference in our data could be due to tissue specificity as we only assessed the human primary microvascular endothelial cells in vitro. In contrast, Lin et al, 2013 assessed the whole retina of mice in vivo, which contains various tissues exposed to various mediators and hormones, affecting its expression. The impact of the present data is evident after APN application, the upregulation of ADR1 and ADR2 receptors could provide a path to the action of therapeutic APN as a starting point of APN pathway to counteract the angiogenic, metabolic, and functional defects caused by hyperglycemia as will be discussed in subsequent paragraphs.
Previous studies demonstrated that exposure to high glucose increases the ROS and apoptosis in BRECs and mice RECs exposed to 30mM glucose for five days, which is consistent with the present results.22 The current study revealed that adiponectin treatment significantly reduces the ROS production in HMRECs exposed to high glucose, and our data showed upregulation of the significant antioxidant protein enzyme SOD2, which is consistent with previous findings using other endothelial cell lines such as HUVEC cells.23 Another study demonstrated that released globular APN suppressed extra ROS production in endothelial cell culture in the presence of high-glucose conditions via the cAMP/PKA pathway.24
Also, the current results demonstrated that adiponectin treatment of HMRECs under high glucose conditions resulted in a significant reduction of the apoptosis rate. Previous studies supported these data, which showed that globular adiponectin significantly decreased the apoptosis and oxidative stress in HUVEC cells exposed to high glucose.25 The current results demonstrated that adiponectin treatment results in downregulation of reactive nitrogen species production by the HMRECs under high glucose conditions. The bioinformatic analysis demonstrated a data set of genes that are downregulated, such as AGT, TNF-α, PECAM1, and ANGPT1, which are predicted to decrease the production of ROS and that low expressed genes of FAS, FASLG, TNF-α, THBS1, BCL2, MMP9, ANGPT1, and IL-B are predicted to decrease the rate of apoptosis. The core analysis by IPA demonstrated the dataset of genes involved in inhibition of the apoptosis, and the production of ROS in HMRECs. Adiponectin affects several canonical pathways related to apoptosis, such as apoptosis, MYC-mediated apoptosis, glucocorticoid receptor signaling, Il-8 signaling, and p38 MAPK signaling. The ROS and RSN observed in HG cells could induce the rate of apoptosis, and adiponectin treatment reduces both ROS and apoptosis, as reported.26
Meanwhile, the current study using bioinformatic analysis demonstrated that several pathways, such as HMGB1 and glucocorticoids, could affect granulocyte adhesion and diapedesis signaling pathways that affect the DEGs. For example, HMGB1 activates vascular endothelial cells for expression and the secretion of intercellular adhesion molecule 1 (ICAM-1), vascular cell adhesion molecule 1 (VCAM-1), RAGE, TNF-α, IL-8, monocyte chemotactic protein-1 (MCP-1), plasminogen activator inhibitor 1 (PAI-1), and tissue plasminogen activator (tPA). Furthermore, as shown in Figure 4C, APN treatment causes inhibition of the HMGB1 pathway, and the protein expression of HMGB1, which reduces the ROS production and antioxidant enzyme SOD2, through inhibition of PI3K-Akt/mTOR pathway, leading to suppression of inflammation, ROS production, and apoptosis, as demonstrated in a previous study.27 The reciprocal regulation between SOD2, and HMGB1 is crucial for explicating the feedback mechanism of oxidative stress, which need further studies.
The inflammatory protein markers IL-1B, TNF-α, and IL-8, were upregulated in the condition media of HMRECs exposed to high-glucose conditions, and adiponectin treatment attenuates it. Furthermore, high glucose activates the TNF-α in the endothelial cells, causing increased release of Il-8 and adhesion molecules and activation of endothelial cells, inhibited by adiponectin,28 which is consistent with our finding. These data support the role of the anti-inflammatory effect of adiponectin in HMRECs exposed to hyperglycemia which counteracts inflammatory markers, mainly TNF-α.
Incepted by hyperglycemia, disruption of the blood-retinal barrier leads to retinal vessel structural modifications and retinal revelation to the inner luminal vessels. The current study also assessed barrier function via real dynamic trans-electrical impedance (ECIS), enabling continuous auditing of HMRECs amid proliferation and treatment. The current study of ECIS recorded a significant reduction of HMRECs cell resistance (barrier quality) in the monolayer cells treated with hyperglycemia compared to normoglycemic control cells and increased after APN application. Inflammation causes the retraction of endothelial cells, increased vascular permeability, and thus more leukocytes adhere to the vessel wall. As shown in the current results, hyperglycemia caused an increase in transendothelial leukocyte migration and inflammation. Furthermore, in the present study, treating HMRECs with adiponectin significantly decreased inflammation and migration of leukocytes. For instance, a previous study demonstrated that adiponectin deficiency suppresses the leukocyte–endothelium interactions and leads to a primary state of endothelial dysfunction with increased leukocyte-endothelium adhesion.29 The results of the bioinformatic analysis supported the inhibitory effect of adiponectin on migration, adhesion, and inflammatory response, as shown in Figure 5 and 6. For example, the following DEGs (CCL2, CCL5, CD44, CX3CL1, CXCL1, CXCL5, F3, FN1, ICAM1, IL1B, IL3, ITGB2, MMP1, MMP9, PECAM1, SELE, SELP, SPP1, THBS1, TNC, TNF, and VCAM1) are related to the recruitment of WBCs to the endothelial cells as part of the inflammatory pathway as indicated with gene ontology and pathways such as GO:0045123 Cellular extravasation, GO:0007159 Leukocyte cell-cell adhesion, GO:0050900 Leukocyte migration, GO:0006954 Inflammatory response, hsa04933 AGE-RAGE signaling pathway in diabetic complications, and hsa04668 TNF signaling pathway. Another example of adhesion of VEC includes the following DEGs of the data set (CCL2, VEGFA, ICAM1, THBS1, F3, TNF, VCAM1, SELE, ITGB3, ITGB1, SELP, ITGA6, PECAM1, ANGPT1, CD44, and ITGB2) with the following gene ontology and pathways, GO:1904996 Positive regulation of leukocyte adhesion to vascular endothelium, GO:0045123 Cellular extravasation, GO:0007159 Leukocyte cell-cell adhesion, GO:0030155 Regulation of cell adhesion, hsa04514 Cell adhesion molecules, and HSA-202733 Cell surface interactions at the vascular wall. Details of the biological categorization of the DEGs molecules involved in various biological cations in response to APN are provided in the (Supplementary data).
One of the remarkable features of the current study is the functional impact of adiponectin treatment on endothelial cell permeability. The current data demonstrated two significant findings; adiponectin inhibits transendothelial leukocyte migration and the permeability in the injured endothelial cells by hyperglycemia. In addition, a previous study demonstrated that adiponectin opposes IL-18-mediated endothelial cell apoptosis via the AMPK pathway, thus decreasing vascular injury and inflammation.30
Furthermore, the IPA core analysis demonstrated that APN treatment mainly involved 78 canonical pathways, affecting several functions related to inflammation, oxidative stress, metabolism, apoptosis, cell survival, cell adhesion, vascular remodeling, and angiogenesis. Most of these pathways are related to inflammation such as Agranulocyte Adhesion and Diapedesis, Granulocyte Adhesion and Diapedesis, Glucocorticoid Receptor Signaling, Leukocyte Extravasation Signaling, IL-8 Signaling, HMGB1, Acute Phase Response Signaling, p38 MAPK Signaling, Chemokine Signaling, Toll-like receptor, STAT3 signaling, TNFr2, and TNFr1 signaling, Coronavirus Signaling, Inflammasome Signaling, JAK/Stat Signaling, and NF-κB Signaling. Other pathways, for example, are related to metabolic pathways such as PPAR Signaling, FXR/RXR Activation, Fatty Acid α-oxidation, PXR/RXR Activation, and Sirtuin Signaling Pathway. Of interest, three canonical pathways with a Z score of ±2 are involved in several pathways, which are HMGB1 and Integrin signaling, and p38 MAPK Signaling.
Integrins are cell surface glycoproteins comprised of non-covalently associated α and β subunits tangled in cell-cell and cell-extracellular matrix (ECM) connect angled in cell-cell cell-extracellular matrix (ECM) connecting the intracellular cytoskeleton and the pericellular ECM. The thickened capillary basement membrane in DR leads to an increase in integrin expression, and αvβ3 and αvβ5 integrins may play critical roles in the pathogenesis of angiogenesis in DR.31 One of the crucial mediators of integrin signaling is Focal adhesion kinase (FAK) and Integrin-linked kinase (ILK). These proteins are important in the formation of focal adhesions, which are responsible for signal transduction and assembly of stress fibers. There as several integrin activated kinases; activation of PAK leads to the phosphorylation and activation of MAPK kinase MEK1 (one of the primary kinases in response to APN in this study), which leads to the activation of MEK1 leads to the downstream activation of Extracellular signal-regulated kinase (ERK) which in turn activates MLCK promoting stress fiber formation. Inhibition of the following integrins ITGA1, ITGA5, ITGA6, ITGAV, ITGB1, ITGB2, ITGB3, and ITGB5 in the current study are involved in various biological processes; GO:0007229: integrin-mediated signaling pathway, GO:0033627: cell adhesion mediated by integrin, GO:0007160: cell-matrix adhesion; GO:0050900: leukocyte migration; and GO:0030198: extracellular matrix organization (Supplementary Figure S3). We explored the impact of APN with integrin pathway, and our data showed inhibition of cell adhesion through various connections like activations of AMPK, P38 MAPK, or affects the expressions of AMPK, CXCL8, D-glucose, FN1, ICAM1, IFNG, IL1B, IL6, PPARG, TGFB1, TNF, and VCAM1. These molecules affect cell adhesions via different mechanisms (Supplementary Figure S3). In the initial stages of endothelial dysfunction, there is an increase in endothelial cell expression of various adhesion molecules on the luminal surface, including selectins and ICAMs, all of which act as receptors for glycoconjugates and integrins present on the circulating leukocytes and administration of globular adiponectin effectively preserves endothelial function in both acute inflammation and states of chronic adiponectin deficiency.29 Endothelial adhesion is a crucial biological process for inflammatory development, and the integrin signaling pathway is essential for ECM organization and adhesion of EC and other functions related to the Il-8 signaling pathway.
APN treatment of HG cells caused inhibition of the High Mobility Group-B1 (HMGB1) pathway with a Z- score of −2.12. and included several genes of the data set: CCL2, FASLG, ICAM1, IL11, IL1B, IL3, SELE, SERPINE1, TNF, VCAM1. HMGB1 is a DNA binding protein that constructs and maintains nucleoprotein complexes and nucleosome structures. It is also involved in the regulation of gene transcription. HMGB1 can activate cell surface receptors on various cell types and mediates its effects via ERK1/2, JNK, and p38; PI3K and Akt; the transcription factors NF-κB and Sp1 as well which trigger transcription of several stress response genes such as cytokines production and involved in the different biologic process32 (Figure 4). The DEGs of the data set involved in the HMGB1 pathway are downregulated genes: FASLG, ICAM1, IL11, IL1B, IL3, SELE, TNF, VCAM1, and upregulated genes are CCL2 and SERPINE1, in the current study. These genes are involved in the various biological process such as; GO:0007229: integrin-mediated signaling pathway, GO:0061756: leukocyte adhesion to vascular endothelial cell, GO:0050901: leukocyte tethering or rolling; GO:2000351: regulation of endothelial cell apoptotic process; GO:0050900: leukocyte migration; GO:1903037: regulation of leukocyte cell-cell adhesion; regulation of ERK1 and ERK2 cascade; GO:0043123: positive regulation of kinase/NF-kappa B signaling; GO:0042531: positive regulation of tyrosine phosphorylation of STAT protein; GO:0000165: MAPK cascade; GO:0006954: inflammatory response; and GO:0001525: angiogenesis. DM upregulates the expression of HMGB1, leading to the triggering of inflammatory signaling pathways such as the RAGE-facilitated activation of ERK1/2-NF-κB. Intravitreal injection of HMGB1 mimics the effects of diabetes and increases RAGE, ERK1/2, NF-κB, and proinflammatory biomarkers such as ICAM-1 and soluble ICAM-1.33 The binding of RAGEs enhances the transcriptional activity of NF-κB, induces the significant upregulation of IL-1β and ROS in HRMECs increases retinal vascular permeability, and disrupts the stability of tight junction complex between adjacent retinal microvascular EC via decreased TLR-2 and occludin expression.34 These studies demonstrate the critical role of HMGB1 in the pathogenesis of diabetic retinopathy. Moreover, several studies demonstrated the role of HMGB1 in angiogenesis, whether direct effect via RAGEs and TLR-4 with EC activation, proliferation, and migration or indirect via the production of proangiogenic cytokines, such as VEGF, TNF-, and IL-8 from EC and activated macrophages.35 APN treatment’s effects on HG cells inhibit the inflammatory process and adhesion using the HMGB1 pathway and support the phenotype findings of inhibiting pro-inflammatory cytokines and chemokines such as TNF-α, IL-1B, and IL-8, and functions such as migration as shown in (Figures 2 and 3). A recent study demonstrated that HMGB1 is a late inflammatory mediator released from inflammatory cells when stimulated, and treatment of RAW264 macrophage cells with HMGB1 significantly up-regulated the mRNA expression of TNF-α, IL-1B, and C-X-C motif chemokine 10. Then, the treatment with full-length or globular adiponectin dose-dependently suppressed all types of HMGB1-induced cytokine expression, including TNF.36 These findings support the current study results as adiponectin suppresses the HMGB1 pathway and the pro-inflammatory cytokines as mediators of inflammation, adhesion, and pro-angiogenetic factors.
Furthermore, APN affects the p38 mitogen-activated protein family of kinases (p38 MAPK) pathway with inhibition of a z-score of −2.0. p38 MAPK Pathway is triggered by numerous stimuli such as inflammatory cytokines, transforming growth factor (TGF)-β, and oxidative stress.37 The DEGs of the data set in the current study are FAS, FASLG, IL1B, and TNF, which are downregulated after APN treatment. In addition, they are involved in the various biological process such as GO: 1903140: regulation of establishment of endothelial barrier; GO:0016525: negative regulation of angiogenesis; GO:0007159: Leukocyte cell-cell adhesion; GO:1901224: Positive regulation of nik/nf-kappa-B signaling; GO:0000187: Activation of mapk activity; GO:0019221: Cytokine-mediated signaling pathway; and hsa04210: Apoptosis.
Other pathways involved in response to APN treatment to HG cells are the granulocytes and agranulocyte adhesion, diapedesis, and Il-8. One of the pathways, such as Leukocyte Extravasation Signaling from the blood into tissues, is vital for inflammation.37 In addition, interleukin 8 (IL-8) is a member of the C-X-C family of chemokines that plays a central role in angiogenesis and inflammation by promoting inflammatory mediators in DR and stimulating the activation of p38 MAPK/ERK-NF-κB pathway.38 Many signaling pathways were found to be enriched in the present study, which can potentially provide a resource for exploring an intervention approach for diabetic retinopathy using adiponectin as a molecular target.
Further, we explored the functions and diseases associated with the dysregulated genes in response to APN and assessed their activity whether the function is inhibited or activated. APN treatment to HG cells affects endothelial dysfunctions, mainly cellular movements such as chemotaxis, migration, adhesion of leukocytes, rolling and recruitment of leucocytes, and adhesion of VEC and granulocytes under the category of cell-to-cell interaction and signaling and inflammatory response, as shown in Figures 5 and 6, and Tables 4–6. In addition, the data indicated that adiponectin treatment ameliorates many functions related to the pathogenesis of DR modeling in vitro, as indicated in the methods. These functions are related to inflammation, apoptosis and production of reactive oxygen species, and angiogenesis.
The data presented in the current study revealed the epigenetic factors such as the transcription factors and their state of activity (whether activated or inhibited) involved in APN effects on the downstream genes, which are differentially dysregulated. Moreover, we detected several transcription factors (TF) as upstream regulators, including Signal transducer and activator of transcription 3 (STAT3), RELA, JUN, HIF1A, FOS, and NFKBIA. STAT3 signaling pathway plays an important role in normal development, regulating the expression of genes that are critical to cell survival, cell proliferation, invasion, and angiogenesis. JUN is a Jun proto-oncogene, which interacts directly with specific target DNA sequences to regulate gene expression, apoptosis, proliferation, transformation, angiogenesis, and growth. NFKBIA, a gene encodes a member of the NF-kappa-B inhibitor family involved in inflammatory responses that play a role in regulating cell proliferation, apoptosis, and cell survival. All these TFs are related to inflammation pathogenesis and its consequences.39
Numerous studies link STAT3 activity with DR disease development. For example, retinal STAT3 mRNA and protein levels are elevated in diabetic rat retinas, and inhibition of STAT3 decreases retinal inflammation in a mouse model of Type I diabetes.40 The downstream genes differentially expressed under the regulation of STAT3 in response to APN treatment of HG cells are presented in Table 1, and its gene ontology is mainly linked to GO:0002685 Regulation of leukocyte migration, GO:0001525 angiogenesis, GO:0050900 Leukocyte migration, GO:0019221 Cytokine-mediated signaling pathway, and GO:0006954 Inflammatory response. Furthermore, adiponectin application reduces C-reactive protein expression and downregulates STAT3 phosphorylation induced by IL-6 in HepG2 cells,41 which support our finding of the inhibitory effect of adiponectin in HG HMRECs. Furthermore, we displayed a mechanistic network of STAT3 with other TFs causing downregulation of downstream genes such as ICAM-1 and Il-B, as shown in Figure 7A. The network indicates direct (number of 15) and indirect (number of 33) networks through crosstalk of such complex networks involving other TFs such as FOS, NFkB complex, RELA, Jun, CEBPB, and API, which highlighted the complexity of interlacing network to produce changes in gene expressions under hyperglycemic conditions in response to APN. The nuclear transcription factor NF-κB is a significant component involved in the transcriptional regulation of several genes such as CCN2, CSF2, CXCL1, CXCL8, IL1A, IL1B, IL6, MMP2, TNF, VCAM-1, and ICAM-1, either directly or indirectly effect via other TFs such as RELA, SMAD3, TP53, HIFA1, IKBKB, and IL6. In addition, NFkB (complex) is under regulation by TNF via different mechanisms such as expression, activation, localization, phosphorylation, transcription, and regulation of binding by TNF-α. The data presented demonstrated the effect of adiponectin on several genes and TFs, such as inhibition of TNF, Il-1B, NFkB (complex), and how different TFs and genes interact to inhibit the angiogenesis process. Previous studies demonstrated the role of the NF-κB complex in the pathogenesis of DR via several mechanisms such as increased expression of different cytokines such as IL-1β, IL-6, and IL-8 and pro-apoptotic molecule caspase-3 in vitreous fluid and serum leading to inflammation.42 The current study’s data extended previous studies and demonstrated that adiponectin inhibits NF-κB activation and could ameliorate the deleterious effects of hyperglycemia on human microvascular retinal endothelial cells.
Further, as upstream regulators that affect the dataset’s gene expression, we identified several kinases (Table 2), targeting several genes of the data set. IKBKB or inhibitor of nuclear factor-kappa B kinase subunit beta (EG:3551), the protein encoded by this gene phosphorylates the inhibitor in the inhibitor/NF-kappa-B complex, causing dissociation of the inhibitor and activation of NF-kappa-B. IKBKB kinase is significantly involved in the transcriptional regulation of several genes such as CXCL1, CCL2, CXCL5, MMP3, TNC, PTGS2, BCL2L1, ICAM1, FASLG, IL1B, F3, TNF, VCAM1, SELE, MMP9, CX3CL1, MMP1 under APN treatment to HG cells causes inhibition of the Z-activation score. The downstream genes differentially expressed under the regulation of IKBKB in response to APN treatment of HG cells are presented in Table 2. Its gene ontology and pathways are mainly linked to GO:0002544 Chronic inflammatory response, GO:0030593 Neutrophil chemotaxis, GO:0001816 Cytokine production, GO:0005125 Cytokine activity, GO:0008009 Chemokine activity, hsa04064 NF-kappa B signaling pathway, hsa04062 Chemokine signaling pathway, hsa04668 TNF signaling pathway, HSA-449147 Signaling by Interleukins, and WP129 Matrix metalloproteinases. IKBKB kinase, directly and indirectly, affects the expression of these genes via its effects on NFkB, RELA, and ERK1/2 via different mechanisms such as expression, activation, localization, phosphorylation, transcription, and under the regulation by TNF, as shown in Figure 7B. IKBKB or inhibitor of nuclear factor-kappa-B kinase subunit beta, the protein encoded by this gene phosphorylates the inhibitor in the inhibitor/NF-kappa-B complex, causing dissociation of the inhibitor and activation of NF-kappa-B. Serine kinase plays an essential role in the NF-kappa-B signaling pathway, which is activated by multiple stimuli such as inflammatory cytokines and acts as part of the canonical IKK complex in the conventional pathway of NF-kappa-B activation leading to the stimulation of an inflammatory signaling cascade closely associated with endothelial dysfunction.43 A previous study demonstrated that the globular domain of adiponectin effectively represses the activation of IKKbeta by either TNF-α or high glucose in human umbilical vein endothelial cells.44 This is consistent with our results that APN suppresses the activation of IKBKB through different connections such as inhibition of AKT1, STAT3, NFKB, P38 MAPK, PI3K (complex), and activation of NFKBIA as shown in the (Supplementary Figure S5).
Moreover, in the current study, APN treatment is predicted to inhibit epidermal growth factor receptor (EGFR) kinase activity with a Z score of −0.183, which affects the gene expression of 20 genes of the data set (Table 2). The gene ontology and pathways are mainly linked to GO:0002688 Regulation of leukocyte chemotaxis, GO:0030198 Extracellular matrix organization, GO:0030155 Regulation of cell adhesion, hsa04064 NF-kappa B signaling pathway, hsa04370 VEGF signaling pathway, hsa04151 PI3K-Akt signaling pathway, WP1539 Angiogenesis, and HSA-216083 Integrin cell surface interactions. A previous study in STZ- diabetic mice, demonstrated that inhibition of EGF signaling may be a practical therapeutic approach in combination with insulin to prevent retinal vascular leakage.45 These data are consistent with our finding that APN suppresses the EGFR kinase activity and thus inhibits the inflammatory process and angiogenesis via different pathways connections such as NF-kappa B signaling pathway and VEGF signaling pathway. Mitogen-activated protein kinase 1 (MAPK1), also known as extracellular signal-regulated kinases (ERKs), integrates multiple biochemical signals. The interaction of AGEs and RAGE endorses the expressions of growth factors, proinflammatory cytokines and chemokines, and adhesion molecules through the mitogen-activated protein kinase (MAPK) pathway, causing ROS generation mediated by NADPH oxidase and translocation of NF-κB in diabetic vascular complications.46 The present data demonstrated that APN caused inhibition of the MAPK1 kinase, which is predicted to be inhibited with an activation Z score of −1.768, affecting the downstream expression of 12 genes of the data set (Table 2). The gene ontology and pathways are mainly linked to GO:0001525 Angiogenesis, GO:0019221 Cytokine-mediated signaling pathway, GO:0030155 Regulation of cell adhesion, hsa04933 AGE-RAGE signaling pathway in diabetic complications, hsa04064 NF-kappa B signaling pathway, hsa04668 TNF signaling pathway, HSA-6783783 Interleukin-10 signaling, and WP254 Apoptosis. Adiponectin binds to its membrane receptors, AdipoR1 and AdipoR2, which leads to the activation of two main signal pathways, the AMP-activated protein kinase (AMPK) and the p38 mitogen-activated protein kinase (MAPK) pathways.47 The present results demonstrated that APN inhibits the p38 mitogen-activated protein family of kinases (p38 MAPK) pathway, which is associated with inhibition of MAPK1 kinase, followed by changes in the expression of the downstream genes (as shown in Table 4). These in turn lead to inhibition of various biological actions such as apoptosis, cell adhesion, inflammation, and angiogenesis; all of which are pathophysiological changes in endothelial functions associated with DR. BRD4, bromodomain-containing 4 is a kinase present in the nucleus, which is predicted to be inhibited by APN treatment to HG cells with an activation Z-score of −2.828. BRD4 affects the expression of the following downstream 8 genes of the data set: ICAM1, THBS1, BCL2, SELE, ITGA5, ITGB1, FN1, THBS2, ITGB5, and ITGA1 (Table 2). As shown in Supplementary Figure S6, these genes are involved in two biological processes related to inflammation: cellular infiltration, and chemotaxis and showed that agranulocyte adhesion and diapedesis is the canonical pathway, which is an example of a causal network. The gene ontology and pathways are related to BRD4 kinase are GO: 0033631 Cell-cell adhesion mediated by integrin, GO:0023035 CD40 signaling pathway, GO:0007155 Cell adhesion, GO:0050900 Leukocyte migration, GO:0006954 Inflammatory response, hsa04151PI3K-Akt signaling pathway, and WP3888 VEGFA-VEGFR2 signaling pathway. A previous study in diabetic mice showed that BRD4 induces retinal inflammation and plays a role in retinal degeneration.48 Adiponectin downregulates BRD4 kinase activity, which could suppress the inflammatory process and angiogenesis functions.
Furthermore, we investigated the most significant miRNAs predicted in response to adiponectin treatment of HG cells. MicroRNAs (miRs) are small non-coding RNAs that post-transcriptionally repress multiple target genes and are implicated in numerous diseases, including vascular diseases. The top of the most significant microRNA is miR-21, which downregulates the gene expression of the following target genes of the data set in response to APN; CCL2, FASLG, TNF, BCL2, VCAM1, TYMP, MMP9 (Table 3). The gene ontology and pathways of these DEGs are GO:0071345 Cellular response to cytokine stimulus, HSA-6785807 Interleukin-4 and Interleukin-13 signaling, WP4754 IL-18 signaling pathway, WP2036 TNF related weak inducer of apoptosis (TWEAK) Signaling Pathway, and WP129 Matrix metalloproteinases, all of which affect the inflammatory response, apoptosis and ECM organization and cellular proliferation of VEC. A previous study demonstrated that Knockout of miR-21 alleviated microvascular damage, ameliorated inflammation, and reduced cell apoptosis in the retina of db/db mice via targeting of PPARα translation.49 The other miRNAs detected are let-7, mir155, mir15, and mir 8. let-7 family members are expressed in retinal and choroidal endothelial cells (ECs) and let-7 family genes are the founding members of miRs consisting of 12 gene loci that resolve into nine unique but highly homologous mature miR sequences. The downregulated target genes in response to let-7 are PTGS2, BCL2L1, SERPINE1, THBS1, IL 1B, TNF, CD44, and ITGB3. These DEGs’ gene ontology and pathways are GO: 2001243 Negative regulation of intrinsic apoptotic signaling pathway, GO:0007160 Cell-matrix adhesion, GO:0010594 Regulation of endothelial cell migration hsa04064 NF-kappa B signaling pathway, and hsa04668 TNF signaling pathway. A previous study demonstrated the downregulation of let-7a in exosomal plasma of poor diabetic control, which improved after glycemic control. In contrast, the levels of let-7a are significantly increased via the adiponectin pathway,50 which supports our findings on the implications of adiponectin treatment to HMRECs under hyperglycemic conditions. In DR disorders, miR-155 is associated with microvascular protection in DR patients with type 1 DM targeting retinal inflammation.51 The downregulated target genes in response to miR-155 are CCL2, MMP3, PTGS2, SERPINE1, IL1B, and their GO and pathways are GO:0006954 Inflammatory response, GO:0019221 Cytokine-mediated signaling pathway, hsa04064 NF-kappa B signaling pathway, hsa04668 TNF signaling pathway, and WP4754 IL-18 signaling pathway. Moreover, a previous study demonstrated that globular adiponectin induces an increase in miR-155 expression, which plays an essential role in the inflammatory response, in RAW 264.7 macrophages, which supports our findings.52 The miR-15 microRNA precursor family is made up of small non-coding RNA genes that regulate gene expression. The family includes the related mir-15a and mir-15b sequences and miR-16-1, miR-16-2, miR-195, and miR-497. In the current study, the target downregulated genes in response to mir-15 are PTGS2, IL1B, TNF, BCL2, MMP9. These DEGs’ gene ontology and pathways are mainly: GO: 0001816 Cytokine production, GO:0097190 Apoptotic signaling pathway, HSA-622312 Inflammasomes, and HSA-449147 Signaling by Interleukins. A previous study demonstrated in vitro that high glucose conditions (25mM) for three days reduced the expression of miR-15a/16 in cultured HMRECs. Furthermore, overexpression of miR-15a/16 with the mimic significantly diminished pro-inflammatory signaling of IL-1β, TNFα, and NF-κB in HMREC. The data indicate that miR-15a/16 plays a significant role in reducing retinal leukostasis, potentially inhibiting inflammatory cellular signaling,53 supporting the present findings. The miR-8 microRNA precursor family (homologous to miR-141, miR-200, miR-236) is a short non-coding RNA gene involved in gene regulation, wherase miR-8 acts as a regulator of growth, apoptosis, and neuronal survival by targeting multiple mRNAs. A recent study showed that miR-141-3p inhibited the proliferation of retinal vascular epithelial cells and inhibited angiogenesis and promoted apoptosis of RGCs.54 A recent study using Wistar male rats demonstrated that miR-200b might alleviate DR development by downregulating its target gene, VEGFA.55 In the current study, the target downregulated genes are linked mainly to gene ontology and pathways: WP129 Matrix metalloproteinases (GO: 0022617), Extracellular matrix disassembly, and (R-HSA-449147) Signaling by Interleukins.Other predicted mature miRNA detected in this study are: mir-3974 and mir-4666a-5p, which are linked to apoptosis of VEC as it downregulates the expression of the following genes BCL2, FASGL, FAS, and ANGPT1. Further studies are needed to investigate the effects of adiponectin on miRNA based on experimental data.
The present study revealed that TNF is one of the masters of upstream regulators, which regulates the 84-dataset gene, and it exerts its effects on the observed gene expression via 23 regulatory mechanisms with activation of Z-score (3.175). TNF is interacting directly and indirectly through NFKB complex, NfKB1-RelA, RELA, ERK1/2, IKK complex, P38MAPK, Jun, NFKB1A, IL17A, and affects TNF gene expression and Il1B, ICAM1, Vcam1, MMP9, and suppress adiponectin expression as shown in (Supplementary Tables S7 S8, and S11) and (Supplementary Figure S8). TNF-α is a cytokine and member of the TNF superfamily, transmembrane protein. A previous study showed that “Adiponectin suppresses pathological microvessel formation in the retina through modulation of tumor necrosis factor-α expression”.56 Moreover, the current study revealed that TGFβ 1 kinase could inhibit TFs involved in the secretion of pro-inflammatory cytokines such as NFKB, STAT3, and IGNG (Supplementary Table S9), which is consistent with a previous study that demonstrated that TGFβ signaling might protect against rapid retinopathy progression.57
The molecular network analysis of the current study indicates their annotations of diseases and functions, which highlight their categories, are displayed in (Tables 4–6, Figure 8, and Figure S7) in response to adiponectin treatment of HG cells. The principal functions in the three network systems are related mainly to inflammatory pathogenesis, angiogenesis, production of reactive oxygen species, and EMG organization. In addition, these variations in cell functions highlighted the pleiotropic effects of adiponectin on biological processes and functions related to the pathophysiology of DR. The results suggested the most critical pathways related to the focus molecules as shown in functional networks involve mainly signaling pathways such as glucocorticoid receptor signaling, Il-8, HMGB1, neuroinflammation signaling pathway, and integrin signaling pathways. Therefore, the basis of diabetic retinopathy is multifactorial, and an optimum therapy would stop various inflammatory processes, reduce VEGF production, cease endothelial dysfunction, and ablate vascular adhesions.
Furthermore, APN application to HG cells caused a substantial decrease in the inflammatory response, chemotaxis of WBCs, extravasation, adhesion of neutrophils, and adhesion of vascular endothelial cells, decreased reactive oxygen production, and ameliorated retinal vasculopathy. Moreover, we suggested based on IPA core analysis that adiponectin could ameliorate the pathogenesis of DR as a consequence of its metabolic actions on glucose and lipid metabolism via activation of the PPARα ligand pathway as shown in the (Supplementary Figure S8, and Supplementary Tables S11 and S12). Peroxisome proliferator-activator receptor alpha (PPARα) agonists in which experimental evidence suggests PPARα activation may be closely related to the attenuation of vascular damages, including lipid-induced toxicity, inflammation, excess of free radical generation, endothelial dysfunction, and angiogenesis.58 Furthermore, suppression of PPARα partially reduces adiponectin-stimulated fatty-acid oxidation and glucose homeostasis.6 These data support the results that adiponectin can ameliorate the pathogenesis of DR through several mechanisms, including metabolic functions as well. Therefore, we can hypothesize that adiponectin in the retinal vasculature could function as a negative regulator of angiogenesis, which is beneficial in preventing DR’s pathogenesis and could be considered a therapeutic tool for treating and preventing this severe disorder as APN has pleiotropic actions against the pathogenesis of diabetic retinopathy, as shown in the (Supplementary Figure S8, and Supplementary Tables S11 and S12). The current study acknowledged the fundamental functions of adiponectin in suppressing inflammatory reactions and neovascularization; thus, adiponectin in the vasculature of diabetic subjects might imply an adaptive mechanism that protects and repairs the vascular endothelial injury previously published.59,60
In conclusion, molecular mechanisms of adiponectin may directly affect inflammatory HMRECs and the inflammatory white blood cells, suppressing reactive oxygen species, apoptosis, suppression of the NF-κB inflammatory signaling pathway, and downregulation of inflammatory responses involving TNF-α. Adiponectin suppresses the adhesion of EC and modulates the ECM organization, with a parallel improvement in the barrier function, thereby ameliorating the hyperglycemic effects on HMRECs.
Further, we demonstrated that critical pathways respond to adiponectin such as HMGB1, integrin, p38AMPK, glucocorticoid, granulocyte, and agranulocyte adhesion and diapedesis extravasation of white blood cells. In addition, adiponectin can modulate upstream regulators such as transcription factors such as STAT3, RELA, Jun, HIFA-alpha, FOS, and kinases such as IKBKB, BDR4, EGFR, MAPK, and affects miRNA as well such as let-7, mir-21, mir-15, mir155, and mir-8.
The study has several limitations, such as the lack of in vivo studies using diabetic animal models and transcriptome analysis such as RNA seq and other retinal cell lines like Muller and retinal pigmented cell layers.
Further studies are needed to clarify the other actions of adiponectin on glucose, lipid metabolism of the retinal cells, and mitochondrial functions. Assessment of the signaling pathways and role of each ADR in mediating these effects are necessary to be studied in detail. In vivo animal models are recommended to explore adiponectin’s role in the pathogenesis of DR in detail.
Acknowledgments
We are grateful to the Biomedical Science Department, College of Health Sciences, and Biomedical Research Center, Qatar University. This study was made possible by a Qatar National Research Fund grant under its Undergraduate Research Experience Program UREP# 17-069-3-018. However, its contents are solely the authors’ responsibility and do not necessarily represent the official views of the Qatar National Research Fund. The data is available under request, and part of this work is presented in the ARVO meeting 2017, published as an abstract in Investigative Ophthalmology & Visual Science, volume 58, issue 8, pages 5225–5225.
Author Contributions
All authors made substantial contributions to conception and design, acquisition of data, or analysis and interpretation of data; took part in drafting the article or revising it critically for important intellectual content; agreed to submit to the current journal; gave final approval of the version to be published; and agree to be accountable for all aspects of the work.
Disclosure
The authors declare that the research was conducted in the absence of any commercial or financial relationships that could be construed as a potential conflict of interest.
References
1. Cheung N, Mitchell P, Wong TY. Diabetic retinopathy. Lancet. 2010;376(9735):124–136. doi:10.1016/S0140-6736(09)62124-3
2. Roy S, Kern TS, Song B, Stuebe C. Mechanistic insights into pathological changes in the diabetic retina: implications for targeting diabetic retinopathy. Am J Pathol. 2017;187(1):9–19. doi:10.1016/j.ajpath.2016.08.022
3. Ola MS, Nawaz MI, Siddiquei MM, Al-Amro S, Abu El-Asrar AM. Recent advances in understanding the biochemical and molecular mechanism of diabetic retinopathy. J Diabetes Complications. 2012;26(1):56–64. doi:10.1016/j.jdiacomp.2011.11.004
4. Semeraro F, Cancarini A, dell’Omo R, Rezzola S, Romano MR, Costagliola C. Diabetic retinopathy: vascular and inflammatory disease. J Diabetes Res. 2015;2015:582060. doi:10.1155/2015/582060
5. Rosman N, Froemming G, Effat O, Nawawi H, Singh H. Effects of adiponectin on markers of endothelial activation and markers of inflammation in human coronary artery endothelial cells. J Fundam Appl Sci. 2017;9(6S):1102–1115. doi:10.4314/jfas.v9i6s.81
6. Yamauchi T, Kamon J, Ito Y, et al. Cloning of adiponectin receptors that mediate antidiabetic metabolic effects. Nature. 2003;423(6941):762–769. doi:10.1038/nature01705
7. Ohashi K, Ouchi N, Matsuzawa Y. Anti-inflammatory and anti-atherogenic properties of adiponectin. Biochimie. 2012;94(10):2137–2142. doi:10.1016/j.biochi.2012.06.008
8. Brakenhielm E, Veitonmaki N, Cao R, et al. Adiponectin-induced antiangiogenesis and antitumor activity involve caspase-mediated endothelial cell apoptosis. Proc Natl Acad Sci U S A. 2004;101(8):2476–2481. doi:10.1073/pnas.0308671100
9. Ouchi N, Kobayashi H, Kihara S, et al. Adiponectin stimulates angiogenesis by promoting cross-talk between AMP-activated protein kinase and Akt signaling in endothelial cells. J Biol Chem. 2004;279(2):1304–1309. doi:10.1074/jbc.M310389200
10. Fu Z, Gong Y, Lofqvist C, Hellstrom A, Smith LE. Review: adiponectin in retinopathy. Biochim Biophys Acta. 2016;1862(8):1392–1400. doi:10.1016/j.bbadis.2016.05.002
11. Klaassen I, de Vries EW, Vogels IMC, et al. Identification of proteins associated with clinical and pathological features of proliferative diabetic retinopathy in vitreous and fibrovascular membranes. PLoS One. 2017;12(11):e0187304–e0187304. doi:10.1371/journal.pone.0187304
12. Ucgun NI, Zeki-Fikret C, Yildirim Z. Inflammation, and diabetic retinopathy. Mol Vis. 2020;26:718–721.
13. Yilmaz MI, Sonmez A, Acikel C, et al. Adiponectin may play a part in the pathogenesis of diabetic retinopathy. Eur J Endocrinol. 2004;151(1):135–140. doi:10.1530/eje.0.1510135
14. Yang HS, Choi YJ, Han HY, et al. Serum, and aqueous humor adiponectin levels correlate with diabetic retinopathy development and progression. PLoS One. 2021;16(11):e0259683. doi:10.1371/journal.pone.0259683
15. Tien T, Zhang J, Muto T, Kim D, Sarthy VP, Roy S. High glucose induces mitochondrial dysfunction in retinal Muller cells: implications for diabetic retinopathy. Invest Ophthalmol Vis Sci. 2017;58(7):2915–2921. doi:10.1167/iovs.16-21355
16. Rizk NM, Fadel A, AlShammari W, Younes N, Bashah M. The immunophenotyping changes of peripheral CD4+ T lymphocytes and inflammatory markers of class III obesity subjects after laparoscopic gastric sleeve surgery - A follow-up study. J Inflamm Res. 2021;14:1743–1757.
17. Sharma I, Rizk N, Falel AS, Al-Shabrawey MA-S. Docosahexaenoic acid (DHA)-a novel therapeutic intervention for mitigating hypoxia induced retinal endothelial dysfunction. Invest Ophthalmol Vis Sci. 2015;56(7):21.
18. Srinivasan V, Sulochana KN. Effect of adiponectin on expression of vascular endothelial growth factor and pigment epithelium-derived factor: an in vitro study. Indian J Pharmacol. 2015;47(1):117–120. doi:10.4103/0253-7613.150376
19. Palanisamy K, Nareshkumar RN, Sivagurunathan S, Raman R, Sulochana KN, Chidambaram S. Anti-angiogenic effect of adiponectin in human primary microvascular and macrovascular endothelial cells. Microvasc Res. 2019;122:136–145. doi:10.1016/j.mvr.2018.08.002
20. Ding G, Qin Q, He N, et al. Adiponectin and its receptors are expressed in adult ventricular cardiomyocytes and upregulated by activation of peroxisome proliferator-activated receptor gamma. J Mol Cell Cardiol. 2007;43(1):73–84. doi:10.1016/j.yjmcc.2007.04.014
21. Lin T, Qiu Y, Liu Y, Mohan R, Li Q, Lei B. Expression of adiponectin and its receptors in type 1 diabetes mellitus in human and mouse retinas. Mol Vis. 2013;2013(19):1769–1778.
22. Ouedraogo R, Wu X, Xu SQ, et al. Adiponectin suppression of high-glucose-induced reactive oxygen species in vascular endothelial cells: evidence for involvement of a cAMP signaling pathway. Diabetes. 2006;55(6):1840–1846. doi:10.2337/db05-1174
23. Singh LP. Thioredoxin Interacting Protein (TXNIP) and Pathogenesis of Diabetic Retinopathy. J Clin Exp Ophthalmol. 2013;2013:4.
24. Mossalam M, Jeong JH, Abel ED, Kim SW, Kim YH. Reversal of oxidative stress in endothelial cells by controlled release of adiponectin. J Control Release. 2008;130(3):234–237. doi:10.1016/j.jconrel.2008.06.009
25. Xiao X, Dong Y, Zhong J, et al. Adiponectin protects endothelial cells from the damages induced by the intermittent high level of glucose. Endocrine. 2011;40(3):386–393. doi:10.1007/s12020-011-9531-9
26. Akifusa S, Kamio N, Shimazaki Y, Yamaguchi N, Yamashita Y. Regulation of globular adiponectin-induced apoptosis by reactive oxygen/nitrogen species in RAW264 macrophages. Free Radic Biol Med. 2008;45(9):1326–1339. doi:10.1016/j.freeradbiomed.2008.08.005
27. Wang F-P, Li L, Li J, Wang J-Y, Wang L-Y, Jiang W. High mobility group box-1 promotes the proliferation and migration of hepatic stellate cells via TLR4-dependent signal pathways of PI3K/Akt and JNK. PLoS One. 2013;8(5):e64373. doi:10.1371/journal.pone.0064373
28. Baptista FI, Aveleira CA, Castilho AF, Ambrosio AF. Elevated Glucose and Interleukin-1beta differentially affect retinal microglial cell proliferation. Mediators Inflamm. 2017;2017:4316316. doi:10.1155/2017/4316316
29. Ouedraogo R, Gong Y, Berzins B, et al. Adiponectin deficiency increases leukocyte-endothelium interactions via upregulation of endothelial cell adhesion molecules in vivo. J Clin Invest. 2007;117(6):1718–1726. doi:10.1172/JCI29623
30. Chandrasekar B, Boylston WH, Venkatachalam K, Webster NJ, Prabhu SD, Valente AJ. Adiponectin blocks interleukin-18-mediated endothelial cell death via APPL1-dependent AMP-activated protein kinase (AMPK) activation and IKK/NF-kappaB/PTEN suppression. J Biol Chem. 2008;283(36):24889–24898. doi:10.1074/jbc.M804236200
31. Friedlander M, Brooks PC, Shaffer RW, Kincaid CM, Varner JA, Cheresh DA. Definition of two angiogenic pathways by distinct αv integrins. Science. 1995;270(5241):1500–1502. doi:10.1126/science.270.5241.1500
32. Gong H, Zuliani P, Komuravelli A, Faeder JR, Clarke EM. Analysis and verification of the HMGB1 signaling pathway. BMC Bioinform. 2010;11(7):S10. doi:10.1186/1471-2105-11-S7-S10
33. Nebbioso M, Lambiase A, Armentano M, et al. The complex relationship between diabetic retinopathy and high-mobility group box: a review of molecular pathways and therapeutic strategies. Antioxidants. 2020;9(8):666. doi:10.3390/antiox9080666
34. Mohammad G, Alam K, Nawaz MI, Siddiquei MM, Mousa A, El-Asrar AMA. Mutual enhancement between high-mobility group box-1 and NADPH oxidase-derived reactive oxygen species mediates diabetes-induced upregulation of retinal apoptotic markers. J Physiol Biochem. 2015;71(3):359–372. doi:10.1007/s13105-015-0416-x
35. Santos ARC, Dvoriantchikova G, Li Y, et al. Cellular mechanisms of high mobility group 1 (HMGB-1) protein action in the diabetic retinopathy. PLoS One. 2014;9(1):e87574. doi:10.1371/journal.pone.0087574
36. Elfeky M, Yoneshiro T, Okamatsu-Ogura Y, Kimura K. Adiponectin suppression of late inflammatory mediator, HMGB1-induced cytokine expression in RAW264 macrophage cells. J Biochem. 2018;163(2):143–153. doi:10.1093/jb/mvx069
37. Cuenda A, Rousseau S. p38 MAP-Kinases pathway regulation, function and role in human diseases. Mol Cell Res. 2007;1773(8):1358–1375.
38. Chan L-P, Liu C, Chiang F-Y, et al. IL-8 promotes inflammatory mediators and stimulates activation of p38 MAPK/ERK-NF-κB pathway and reduction of JNK in HNSCC. Oncotarget. 2017;8(34):56375–56388. doi:10.18632/oncotarget.16914
39. O’Brown ZK, Van Nostrand EL, Higgins JP, Kim SK, Copenhaver GP. The inflammatory transcription factors NFκB, STAT1 and STAT3 drive age-associated transcriptional changes in the human kidney. PLoS Genet. 2015;11(12):e1005734. doi:10.1371/journal.pgen.1005734
40. Chen Y, Wang J, Li J, et al. Activating transcription factor 4 mediates hyperglycaemia-induced endothelial inflammation and retinal vascular leakage through activation of STAT3 in a mouse model of type 1 diabetes. Diabetologia. 2012;55(9):2533–2545. doi:10.1007/s00125-012-2594-1
41. Sun H, Zhang Y, Gao P, et al. Adiponectin reduces C-reactive protein expression and downregulates STAT3 phosphorylation induced by IL-6 in HepG2 cells. Mol Cell Biochem. 2011;347(1):183–189. doi:10.1007/s11010-010-0627-y
42. Yuuki T, Kanda T, Kimura Y, et al. Inflammatory cytokines in vitreous fluid and serum of patients with diabetic vitreoretinopathy. J Diabetes Complications. 2001;15(5):257–259. doi:10.1016/S1056-8727(01)00155-6
43. Cardinez C, Miraghazadeh B, Tanita K, et al. Gain-of-function IKBKB mutation causes human combined immune deficiency. J Exp Med. 2018;215(11):2715–2724. doi:10.1084/jem.20180639
44. Wu X, Mahadev K, Fuchsel L, Ouedraogo R, Xu SQ, Goldstein BJ. Adiponectin suppresses IkappaB kinase activation induced by tumor necrosis factor-alpha or high glucose in endothelial cells: role of cAMP and AMP kinase signaling. Am J Physiol Endocrinol Metab. 2007;293(6):E1836–E1844. doi:10.1152/ajpendo.00115.2007
45. Sugimoto M, Cutler A, Shen B, et al. Inhibition of EGF signaling protects the diabetic retina from insulin-induced vascular leakage. Am J Pathol. 2013;183(3):987–995. doi:10.1016/j.ajpath.2013.05.017
46. Yamamoto Y, Yamamoto H. Receptor for advanced glycation end‐products‐mediated inflammation and diabetic vascular complications. J Diabetes Investig. 2011;2(3):155. doi:10.1111/j.2040-1124.2011.00125.x
47. Mao X, Kikani CK, Riojas RA, et al. APPL1 binds to adiponectin receptors and mediates adiponectin signaling and function. Nat Cell Biol. 2006;8(5):516–523. doi:10.1038/ncb1404
48. Howell SJ, Lee CA, Batoki JC, et al. Retinal inflammation, oxidative stress, and vascular impairment is ablated in diabetic mice receiving XMD8-92 treatment. Front Pharmacol. 2021;12:732630. doi:10.3389/fphar.2021.732630
49. Chen Q, Qiu F, Zhou K, et al. Pathogenic role of microRNA-21 in diabetic retinopathy through downregulation of PPARα. Diabetes. 2017;66(6):1671–1682. doi:10.2337/db16-1246
50. Santovito D, De Nardis V, Marcantonio P, et al. Plasma exosome microRNA profiling unravels a new potential modulator of adiponectin pathway in diabetes: effect of glycemic control. J Clin Endocrinol Metab. 2014;99(9):E1681–E1685. doi:10.1210/jc.2013-3843
51. Jiang C, Qin B, Liu G, et al. MicroRNA-184 promotes differentiation of the retinal pigment epithelium by targeting the AKT2/mTOR signaling pathway. Oncotarget. 2016;7(32):52340. doi:10.18632/oncotarget.10566
52. Subedi A, Park P-H. Autocrine and paracrine modulation of microRNA-155 expression by globular adiponectin in RAW 264.7 macrophages: involvement of MAPK/NF-κB pathway. Cytokine. 2013;64(3):638–641. doi:10.1016/j.cyto.2013.09.011
53. Ye E-A, Liu L, Jiang Y, et al. miR-15a/16 reduces retinal leukostasis through decreased pro-inflammatory signaling. J Neuroinflammation. 2016;13(1):305. doi:10.1186/s12974-016-0771-8
54. Zhang L-Q, Cui H, Yu Y-B, Shi H-Q, Zhou Y, Liu M-J. MicroRNA-141-3p inhibits retinal neovascularization and retinal ganglion cell apoptosis in glaucoma mice through the inactivation of docking protein 5-dependent mitogen-activated protein kinase signaling pathway. J Cell Physiol. 2019;234(6):8873–8887. doi:10.1002/jcp.27549
55. Li EH, Huang QZ, Li GC, Xiang ZY, Zhang X. Effects of miRNA-200b on the development of diabetic retinopathy by targeting VEGFA gene. Biosci Rep. 2017;37(2). doi:10.1042/BSR20160572
56. Higuchi A, Ohashi K, Kihara S, Walsh K, Ouchi N. Adiponectin suppresses pathological microvessel formation in retina through modulation of tumor necrosis factor-α expression. Circ Res. 2009;104(9):1058–1065. doi:10.1161/CIRCRESAHA.109.194506
57. Dagher Z, Gerhardinger C, Vaz J, Goodridge M, Tecilazich F, Lorenzi M. The increased transforming growth factor-β signaling induced by diabetes protects retinal vessels. Am J Pathol. 2017;187(3):627–638. doi:10.1016/j.ajpath.2016.11.007
58. Tomita Y, Lee D, Tsubota K, Kurihara T. PPARα agonist oral therapy in diabetic retinopathy. Biomedicines. 2020;8(10):433. doi:10.3390/biomedicines8100433
59. Ouchi N, Ohishi M, Kihara S, et al. Association of hypoadiponectinemia with impaired vasoreactivity. Hypertension. 2003;42(3):231–234. doi:10.1161/01.HYP.0000083488.67550.B8
60. Teoh H, Quan A, Bang KW, et al. Adiponectin deficiency promotes endothelial activation and profoundly exacerbates sepsis-related mortality. Am J Physiol Endocrinol Metab. 2008;295(3):E658–E664. doi:10.1152/ajpendo.90384.2008
 © 2022 The Author(s). This work is published by Dove Medical Press Limited, and licensed under a
Creative Commons Attribution License.
The full terms of the License are available at http://creativecommons.org/licenses/by/4.0/.
The license permits unrestricted use, distribution, and reproduction in any medium, provided the
original author and source are credited.
© 2022 The Author(s). This work is published by Dove Medical Press Limited, and licensed under a
Creative Commons Attribution License.
The full terms of the License are available at http://creativecommons.org/licenses/by/4.0/.
The license permits unrestricted use, distribution, and reproduction in any medium, provided the
original author and source are credited.