Back to Journals » Diabetes, Metabolic Syndrome and Obesity » Volume 15
ADAR1 Inhibits HBV DNA Replication via Regulating miR-122-5p in Palmitic Acid Treated HepG2.2.15 Cells
Authors Yang H, Rui F, Li R, Yin S, Xue Q, Hu X, Xu Y, Wu C, Shi J, Li J
Received 7 June 2022
Accepted for publication 1 November 2022
Published 23 December 2022 Volume 2022:15 Pages 4035—4047
DOI https://doi.org/10.2147/DMSO.S373385
Checked for plagiarism Yes
Review by Single anonymous peer review
Peer reviewer comments 2
Editor who approved publication: Professor Gian Paolo Fadini
Hongli Yang,1,* Fajuan Rui,2,* Rui Li,3,* Shengxia Yin,4 Qi Xue,1 Xinyu Hu,5 Yayun Xu,5 Chao Wu,4 Junping Shi,6 Jie Li2,4
1Department of Gastroenterology, Shandong Provincial Hospital Affiliated to Shandong First Medical University, Ji’nan, People’s Republic of China; 2Department of Infectious Diseases, Nanjing Drum Tower Hospital Clinical College of Traditional Chinese and Western Medicine, Nanjing, People’s Republic of China; 3Department of Gastroenterology, Binzhou Medical University Hospital, Binzhou, People’s Republic of China; 4Department of Infectious Diseases, Nanjing Drum Tower Hospital, The Affiliated Hospital of Nanjing University Medical School, Nanjing, People’s Republic of China; 5Department of Gastroenterology, Shandong Provincial Hospital, Cheeloo College of Medicine, Shandong University, Ji’nan, People’s Republic of China; 6Department of Infectious Disease, The Affiliated Hospital of Hangzhou Normal University, Wenzhou Road, Hangzhou, People’s Republic of China
*These authors contributed equally to this work
Correspondence: Jie Li, Department of Infectious Diseases, Nanjing Drum Tower Hospital, The Affiliated Hospital of Nanjing University Medical School, Nanjing, Jiangsu, People’s Republic of China, Email [email protected] Junping Shi, Department of Infectious Disease, The Affiliated Hospital of Hangzhou Normal University, Wenzhou Road, Hangzhou, Zhejiang, People’s Republic of China, Email [email protected]
Abstract:
Background and Aims: Changes in living standards and diet structure, non-alcoholic fatty liver disease (NAFLD) is prevalent globally, including in Asia, where chronic hepatitis B (CHB) is endemic. As such, cooccurrence of NAFLD with CHB is common in Asia. However, the pathogenesis underlying the onset of fatty liver in CHB prognosis has not been fully elucidated. Therefore, we aimed to investigate the effects and mechanisms of lipotoxicity on hepatitis B virus (HBV) DNA replication.
Methods: The expression of adenosine deaminase acting on RNA-1 (ADAR1) and miR-122 was evaluated in liver tissues from patients with CHB concurrent NAFLD. Palmitic acid-treated HepG2.2.15 cells were used as the cell model. The effect of lipotoxicity on HBV DNA replication was evaluated in vitro by transfecting the ADAR1 overexpression or knockdown lentiviral vector into HepG2.2.15 cells, respectively. qRT-PCR, western blotting and immunofluorescence were performed to determine ADAR1 expression.
Results: The expression of ADAR1 in the liver tissues of CHB patients with concurrent NAFLD was significantly down-regulated compared with that in CHB patients. Enforced expression of ADAR1 inhibited the HBV DNA replication, whereas ADAR1 knockdown resulted in increased HBV DNA expression in palmitic acid - treated HepG2.2.15 cells. Additionally, ADAR1 inhibited the HBV DNA replication by upregulating miR-122, which is most abundant in the liver and mainly inhibits HBV DNA replication.
Conclusions: ADAR1 may act as a suppressor of HBV replication in palmitic acid -treated HepG2.2.15 cells by increasing miR-122 levels. Thus, ADAR1 may serve as a potential biomarker and therapeutic target for CHB with concurrent NAFLD.
Keywords: chronic hepatitis B, non-alcoholic fatty liver disease, ADAR1, miR-122, HBV DNA
Graphical Abstract:

Introduction
NAFLD is one of the most common causes of chronic liver disease (CLD) and the leading cause globally of cirrhosis and hepatocellular carcinoma (HCC).1 Nowadays, due to global changes in diet and lifestyle, the prevalence of NAFLD has increased at an alarming rate with an epidemic of obesity and metabolic syndrome. In our recent meta-analysis of 237 studies, data of 13,044,518 participants showed NAFLD to affect 29.81% of the Asian population.2 CHB is also one of the most frequent causes of CLD in Asia, especially in China.3 The incidence of Hepatic steatosis (HS) in HBV-infected patients varies widely, ranging from 14% to 70%. In a recent meta-analysis, Zheng et al noted that the pooled prevalence of HS in CHB was 32.8% (95% CI, 28.9–37.0).4 Both CHB and NAFLD are associated with a high risk of developing cirrhosis, hepatic decompensation, HCC, and liver-related mortality.5 Further studies on clinical outcomes are warranted in CHB patients with concurrent NAFLD.
Although the exact incidence of fatty liver is unknown in patients with HBV infection, the concurrent occurrence of NAFLD and CHB is on the rise.6 However, past clinical studies on the effect of HS on of hepatitis B progression have conflicting results. Some studies suggest that HS promotes progression of liver disease in CHB, due to necrotising inflammation and fibrosis being significantly increased in CHB patients with HS compared to CHB patients. CHB concurrent NAFLD also has a higher risk of cirrhosis and intrahepatic malignancy than in patients with CHB alone.7–9 In contrast, NAFLD patients with chronic HBV infection have reduced HBV replication and a lower risk of cirrhosis and HCC. In addition, HBsAg clearance is higher among treated CHB concurrent NAFLD patients than in CHB patients.10–12 Additionally, many clinical studies did not observe a correlation between HS and disease severity in CHB patients.13–15 However, no specific molecular mechanism on the effect of CHB concurrent NAFLD on liver disease has been studied. Understanding the underlying molecular mechanisms will help to identify effective molecular diagnostic markers and therapeutic targets.
Post-transcriptional RNA modification is a well-known mechanism that extends the functional range of transcriptome and RNA transcripts. Among the various forms of post-transcriptional modification, the deamination of adenosine to inosine (A-to-I), is catalysed by a family of enzymes named Adenosine Deaminases Acting on RNA (ADAR). There are three known ADAR genes, ADAR1, ADAR2 and ADAR3. Only ADAR1 and ADAR2 ADAR1 and ADAR2 encode catalytically active adenosine deaminases. ADAR3 is specifically expressed in the brain and has no clear function. Although ADAR2 is catalytic, it is highly expressed mainly in the brain and is present in the cytoplasm of immature neurons. This suggests a developmental regulatory role and a low extent of RNA editing. ADAR1, is the most prevalent form of ADAR, and is known to be involved in the replication of various viruses.16–18 Like all other RNAs, miRNAs are subject to modifications, some of which are sequence editing catalysed by ADAR1, which may alter their function.19 MiR-122-5p, the most abundant miRNA in the human liver, has been detected in circulation and shown to be a biomarker of liver damage in CHB. Previous research has shown that miR-122 has an inhibitory effect on HBV expression.20 Hence, we hypothesized that ADAR1 might affect miR-122 expression and thus be involved in the regulation of HBV DNA replication.
In our study, we aimed to determine whether ADAR1 inhibits HBV expression through miR-122 under lipotoxic conditions. Towards this aim, we transfected the ADAR1 overexpression or knockdown lentiviral vector into HepG2.2.15 cells and treated them with palmitic acid to verify the critical role of ADAR1 in miR-122 regulation and HBV DNA replication.
Materials and Methods
Human Studies
A total of 36 individuals were included in this study, including 18 patients with CHB and 18 patients with CHB concurrent NAFLD. The inclusion criteria were as follows: (1) age ≥ 18 years; (2) NAFLD indicated by hepatic biopsy; (3) BMI: 18–28; (4) CHB: hepatitis B virus surface antigen (HBsAg) and/or HBV DNA positivity for more than 6 months. The exclusion criteria were as follows: (1) excessive alcohol consumption (male ≥20 g/day, female ≥10 g/day); (2) other liver diseases that may cause hepatic steatosis, such as CHC, autoimmune liver disease, drug-induced liver disease, primary biliary cholangitis, etc; (3) other viral hepatitis and HBV+HIV co-infection; (4) metabolic diseases for instance type 2 diabetes and hyperthyroidism; (5) malignant tumor; and (6) pregnancy or lactation. All the participants written informed consent. The study was approved by the ethics committee of Shandong Provincial Hospital, and conducted in conformance with the Helsinki Declaration.
Cell Culture and Treatment
The human hepatoblastoma cells (HepG2.2.15) were donated by liver disease laboratory of the Zhejiang University Medical Center (Zhejiang, China). HepG2.2.15 cells are derived from HepG2 cells, which are transfected with two complete HBV genes segments and can stably express HBV DNA. The medium of HepG2.2.15 cells contains all of the virus particles (spherical and filamentous HBsAg particles and empty and full Dane particles) and HepG2.2.15 cells are the typical cell type used for hepatitis B virus infection. HepG2.2.15 cells were cultured in Dulbecco’s modified Eagle’s medium (DMEM) supplemented with 10% fetal bovine serum (FBS) and 1% penicillin/streptomycin. Cells were maintained at 37 °C and 5% CO2. Palmitic acid (Sigma-Aldrich) was dissolved in 10% fatty acid-free bovine serum albumin (BSA) at a stock concentration of 5mM and stored at −20°C. HepG2.2.15 cells were incubated with various concentrations of palmitic acid (0–1 mM) or the BSA control and FBS was not added to the medium. After 24 hours, we measured cell viability using a Cell Counting Kit-8 (CCK-8 Kit) assay in accordance with the manufacturer’s instructions The cells or supernatants were used for the assays. HepG2.2.15 cells were incubated with palmitic acid (0.5mM) to stimulate lipid accumulation.
Proliferation Assay Gene Cluster Analysis
CCK-8 Kit assay was used to assess cell viability. Briefly, HepG2.2.15 cells were seeded in 96-well plates and cultured overnight. The culture medium was then replaced with fresh medium containing different concentrations of palmitic acid (0, 0.125, 0.25, 0.5, and 1 mM; BSA was used as a control) without FBS. After incubation for 24 hours, the cells were washed with phosphate-buffered saline (PBS), and 10 μL of CCK-8 solution (Dojindo, Kumamoto, Japan) was then added to each well and placed in the 37 °C incubator. Optical density (OD) values were measured at 450 nm every 15 minutes using a spectrophotometer (Thermo Fisher, Finland). The OD values at 1 hour were chosen for analysis. All of the experiments were repeated three times in triplicate.
Oil Red O Staining
HepG2.2.15 cells were seeded in 24-well plates and cultured overnight. The culture medium was then replaced with fresh medium containing different concentrations of palmitic acid (0, 0.25, 0.5, and 1 mM) without FBS. After incubation for 24 hours, the cells were washed with PBS, and stained with an oil-red O solution from Sigma-Aldrich (MO, USA) and the aggregation of lipid droplets was observed under a light microscope. The experiment was performed in strict accordance with the reagent instructions.
Transfection
A green fluorescent protein (GFP) tag was designed to the C terminus of ADAR1 to express a GFP-ADAR1 fusion protein. This fusion protein was constructed using the PGMLV-CMV-MCS-3xFlag-T2A-Puro vector. ADAR1 sh1RNA (GGATGGGCCACGGAATGAATT) and sh2 (GCCCAAGTTCGTTTACCAAGC) were inserted into the PGMLV-hU6-MCS-CMV-Puro vector. The GFP-ADAR1 lentivirus, ADAR1-shRNA lentivirus and vector control were transfected into HepG2.2.15 cells using Lipofectamine RNAiMax (Invitrogen USA) transfection reagent, which were constructed by Genomeditech Co., Ltd. (Shanghai, China). To construct the ADAR1 mRNA stably overexpressing cell line, we selected cells with puromycin (3 μg/ml) (Sigma, USA) for 2–3 weeks until ADAR1 mRNA was stably overexpressed in HepG2.2.15. Cell lines stably knocked down for ADAR1 mRNA were the same. miR-122 mimics, inhibitors and negative control miRNAs were purchased from GenePharma (Shanghai, China). Cell transfection was conducted with Lipofectamine 3000 (Invitrogen, USA) according to the manufacturer’s instructions.
RNA Isolation, Reverse Transcription, and Quantitative Real‑time Polymerase Chain Reaction (qRT-PCR)
Total RNA was isolated from HepG2.2.15 and palmitic acid - treated HepG2.2.15 cells using TRIzol reagent. The RNA purity and concentration were determined using a NanoDrop ND-1000 (NanoDrop Thermo), and cDNA was then synthesized with a reverse transcription kit (Takara, Japan). qRT-PCR was performed using the SYBR Green Premix Pro Taq HS qPCR Kit (Accurate Biotechnology (Hunan) Co.,Ltd, China) on Roche 480 Real Time PCR System instrument according to the manufacturer’s instructions. Primers for mRNAs and miRNA were synthesized by GenePharma (Shanghai, China). The relative RNA expression levels were analyzed using the 2−ΔΔCt method. Each experiment was performed three times independently.
Western Blot Analysis
Total proteins from HepG2.2.15 cells were extracted with RIPA lysis buffer containing proteinase inhibitor (Roche Diagnostics, Mannheim, Germany). After determining the protein concentration by a bicinchoninic acid (BCA) protein assay kit (Solarbio, Beijing, China), the proteins were separated by 8% sodium dodecyl sulfate-polyacrylamide gel electrophoresis (SDS-PAGE) gels and transferred onto polyvinylidene fluoride (PVDF) membranes (Millipore, USA), which were blocked in 5% nonfat milk for 1 hour at room temperature and then incubated with the indicated primary antibodies against ADAR1 (1:1000, Cell Signaling Technology, #81284, USA) and GAPDH (1:1000, Abcam, ab8245, UK) overnight at 4 °C. The next day, the membranes were incubated with anti-rabbit horseradish peroxidase-conjugated secondary antibodies for 1 hour at room temperature. Protein bands were visualized using enhanced chemiluminescence (Millipore, USA) with an Amersham Imager 680 (GE Healthcare, USA), and quantified with Image-Pro Plus 6.0 software. GAPDH served as an internal control.
Immunofluorescence Assay
HepG2.2.15 cells seeded on a glass coverslip were subjected to the treatments as mentioned previously and then fixed in 4% paraformaldehyde for 15 minutes. After washing three times, the cells were permeabilized in 0.3% Triton-X100 for 15 minutes and blocked with 5% BSA for 1 hour at room temperature. Afterwards, the cells were incubated with primary antibody (anti-ADAR1: 1:800, #81284, Cell Signaling Technology, USA) at 4 °C overnight and then incubated with a fluorescence-conjugated secondary antibody (Invitrogen) for 1 hour at room temperature. Subsequently, to identify intracellular lipid droplets, the cells were stained with fluorescent labeled Nile red (1:1000) for 15 minutes. Finally, the samples were incubated with DAPI for 5 minutes, and images were obtained using a laser confocal microscope (Leica TCS SP8, Germany).
Immunohistochemistry and Histopathological Staining
Liver biopsy tissues were fixed with 4% paraformaldehyde, embedded in paraffin, and sliced into 5-μm-thick sections. After deparaffinization and hydration, the sections were incubated with citrate and blocked with 3% H2O2. The slides were confined with 5% goat serum and incubated with primary antibody (anti-ADAR1: 1:300, #81284, Cell Signaling Technology, USA), overnight at 4 °C. After washing in PBS, the sections were incubated with appropriate biotinylated secondary antibodies (goat anti-rabbit IgG, Origene Technologies, Beijing, China), stained with diaminobenzidine (DAB) and counterstained with haematoxylin. The positively stained areas were determined by microscope (Olympus, Japan). HBeAg antibody staining was performed at the Shandong Provincial Hospital (Jinan, China). Haematoxylin-eosin (HE) and Masson’s trichrome staining were used to visualize histopathological structures (Servicebio, Wuhan, China).
Detection of Cell Supernatant Markers
Transaminase (aspartate aminotransferase, AST; alanine aminotransferase, ALT) and viral serological markers (HBV DNA, HBeAg) in the cell supernatant were detected by the clinical laboratory of Shandong Provincial Hospital (Jinan China) using an Architect-i2000 system (Abbott Laboratories, USA). The quantitative determination of biomarkers was considered positive according to the criteria set by the manufacturer.
Statistical Analysis
All statistical analyses were analyzed with GraphPad Prism 8.0 software (GraphPad Software, La Jolla, CA, USA). Data are presented as the means ± standard deviations (SDs). Differences were analyzed with Student’s t-test for the comparison of two groups and by one-way analysis of variance for the comparison of multiple groups. Experiments were repeated at least three independent times. For all analyses, the p-values reported were two-tailed, and p-values < 0.05 were considered statistically significant.
Results
Characteristics of the Study Subjects
The characteristics of the study subjects are summarized in Table 1. The two groups were comparable in terms of age and sex. The CHB concurrent NAFLD group displayed a significantly higher BMI than that of the CHB groups. There were no significant differences in ALT and AST levels between the CHB concurrent NAFLD and CHB groups. Moreover, HBsAg and HBV DNA levels were also not statistically significant in CHB concurrent NAFLD group compared to the CHB group.
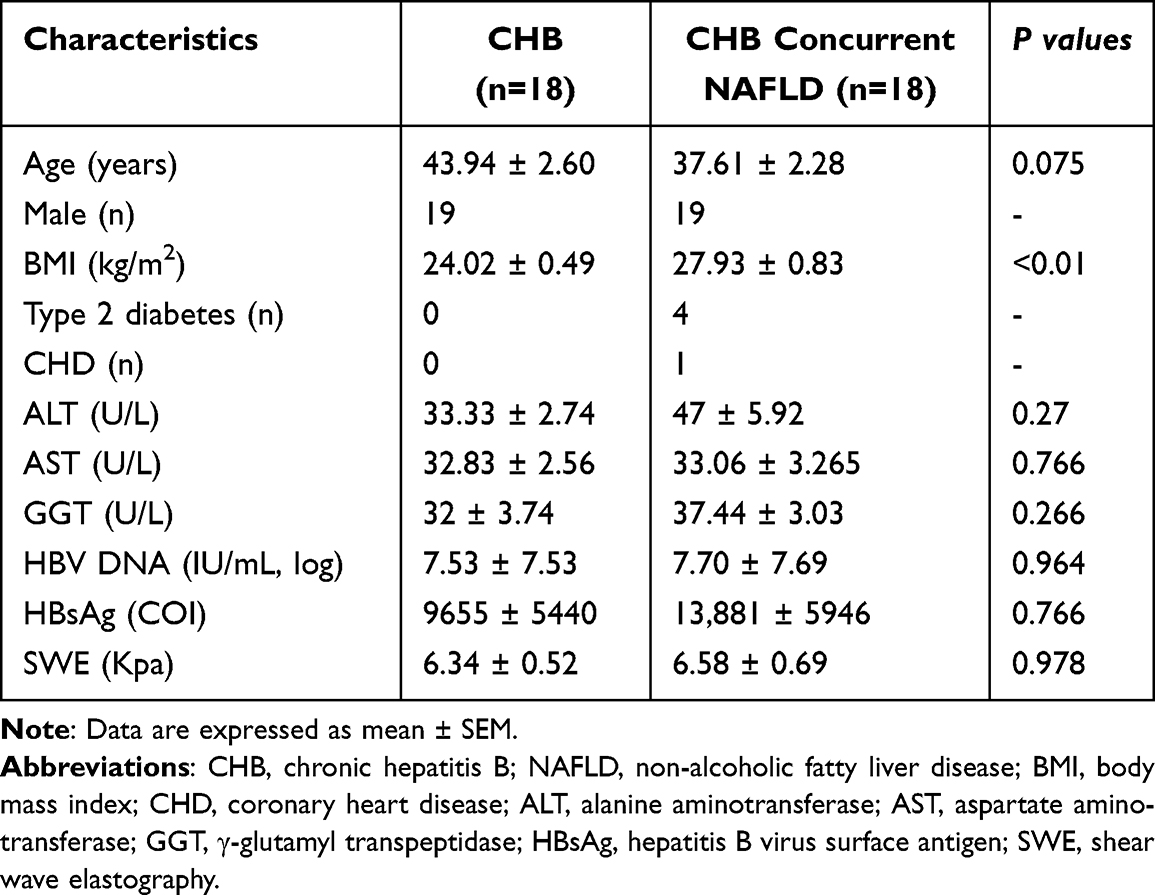 |
Table 1 Clinical and Demographic Characteristics of CHB and CHB Concurrent NAFLD |
Expression Levels of ADAR1, miR-122 in Liver of CHB Concurrent NAFLD Patients
As shown in Figure 1A and C, the expression of ADAR1 protein and mRNA in the liver tissues of CHB concurrent NAFLD patients was significantly downregulated compared with CHB patients, and miR-122 showed the same expression trend in Figure 1B. The expression of HBeAg protein was markedly increased, and significant fat vacuoles were observed in CHB concurrent NAFLD patients (Figure 1C).
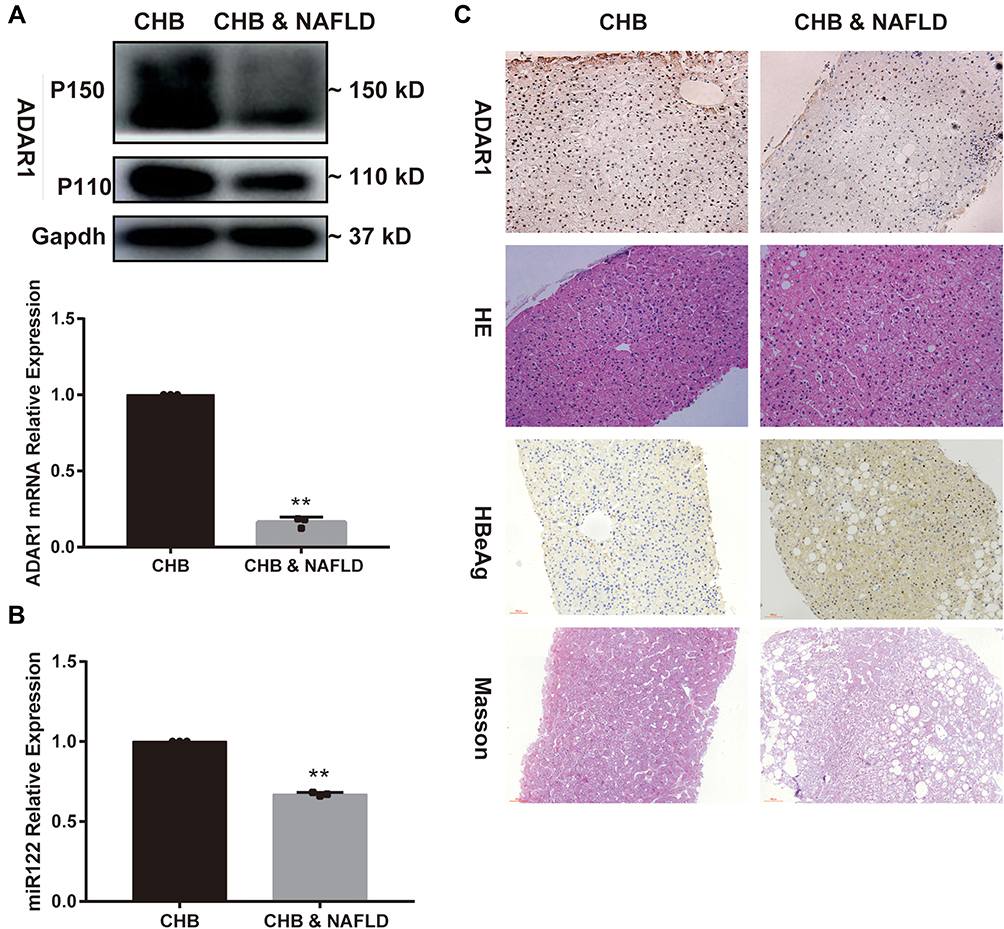 |
Figure 1 Expression levels of ADAR1, miR-122 in livers of CHB concurrent NAFLD patients. (A) The mRNA and protein levels of ADAR1 in liver tissues, (B) The miR-122 level in liver tissues, (C) HE, Masson, and immunohistochemical staining of ADAR1 and HBeAg in liver tissues (magnification × 200). Bars represent the mean ± SD of triplicate repetitions. **P < 0.01. Abbreviations: ADAR1, adenosine deaminase acting on RNA 1; CHB, chronic hepatitis B; NAFLD, non-alcoholic fatty liver disease; HE, hematoxylin-eosin. |
HBV Related Markers Elevated in Palmitic Acid -Treated HepG2.2.15 Cells
To study the molecular mechanism of CHB concurrent NAFLD in the pathological state, we used palmitic acid -treated HepG2.2.15 as the cell model. To explore the optimal concentration of palmitic acid, the cytotoxicity of the palmitic acid at different concentrations (0.125, 0.25, 0.5,1 mM) was investigated after 24 hours of treatment. The results showed that the various concentrations of palmitic acid produced different cytotoxic effects. Namely, CCK8 assay results showed that the viability of HepG2.2.15 cells was significantly reduced. As shown in Figure 2A, no cytotoxic effect was observed in HepG2.2.15 at 0.125mM, whereas a strong cytotoxic effect was shown at 1mM. Interestingly, cell viability was approximately 70% at 0.5 mM. To study the extent of lipid accumulation, we stained HepG2.2.15 cells with oil red O. HepG2.2.15 cells exposed to the palmitic acid showed a significant increase in cytosolic lipid accumulation (Figure 2B). Palmitic acid at 0.5 and 1 mM induced similar levels of intracellular lipid accumulation. However, cells treated with palmitic acid at 1mM had a lower cell number and decreased viability (Figure 1A and B), indicating toxicity of palmitic acid at such a concentration. Therefore, to achieve maximal lipid accumulation with minimal cytotoxicity, we chose a palmitic acid concentration of 0.5mM for further experiments. In addition, both AST and ALT levels in the medium increased (Figure 2C) significantly after adding palmitic acid to HepG2.2.15 cells in a dose-dependent manner. As shown in Figure 2D, the concentrations of HBV DNA and HBeAg increased in a dose-dependent manner with different concentrations of palmitic acid. The palmitic acid -treated HepG2.2.15 group showed higher HBV DNA expression and more severe hepatocyte damage than the HepG2.2.15 group.
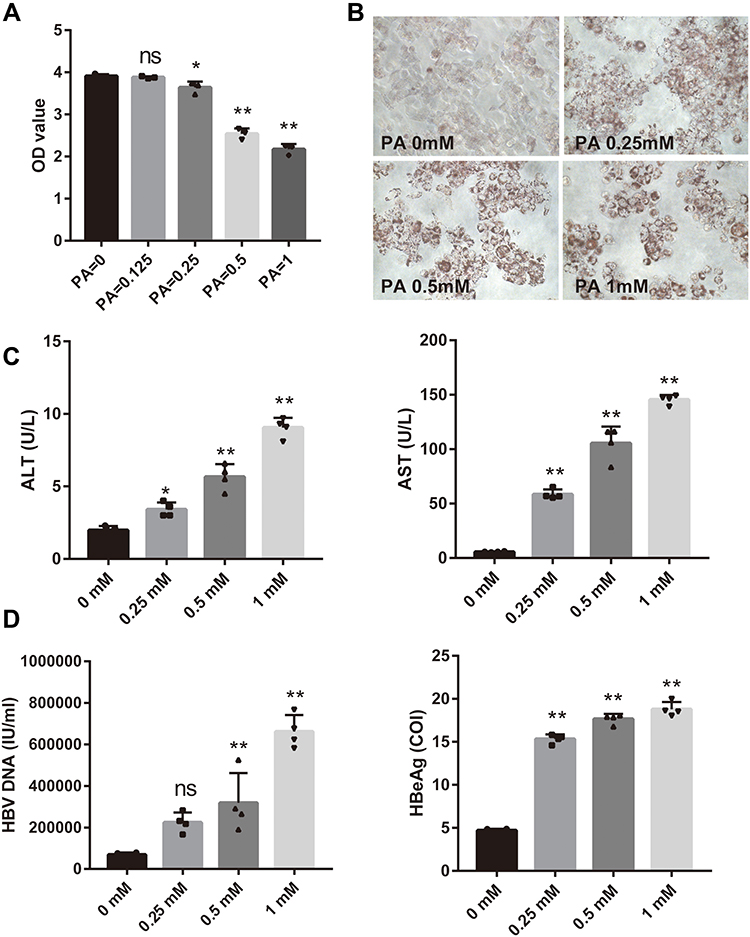 |
Figure 2 HBV related markers elevated in palmitic acid -treated HepG2.2.15 cells. (A–C) The most appropriate palmitic acid concentration in vitro was determined by detecting ALT, AST and cell viability and doing oil red O staining (magnification × 400). The concentrations of palmitic acid used are indicated below each picture. (D) Expression levels of HBV DNA and HBeAg in cells treated with different palmitic acid concentrations. Bars represent the mean ± SD of triplicate repetitions. *P < 0.05, **P < 0.01. Abbreviations: ALT, alanine aminotransferase; AST, aspartate aminotransferase; PA, palmitic acid; ns, no significance. |
ADAR1 is Downregulated in Palmitic Acid - Treated HepG2.2.15 Cells
As shown in Figure 1, ADAR1 was down-regulated in the liver tissues of patients with CHB concurrent with NAFLD. Hence, in this study, we investigated whether ADAR1 could affect the progression of hepatitis B in lipotoxic hepatocytes in vitro. qRT-PCR and western blot analysis were used to detect the expression of ADAR1 in palmitic acid -treated HepG2.2.15 cells. The results indicated that the relative expression levels of ADAR1 mRNA and protein were significantly reduced in the treatment group compared with the control group (P<0.05) (Figure 3A). Similar results were observed with regard to ADAR1 protein expression (red fluorescence) in immunofluorescence results (Figure 3B), and obvious lipid droplet accumulation (green fluorescence) was observed in the experimental group. These results were consistent with those of the liver tissues of CHB concurrent with NAFLD patients.
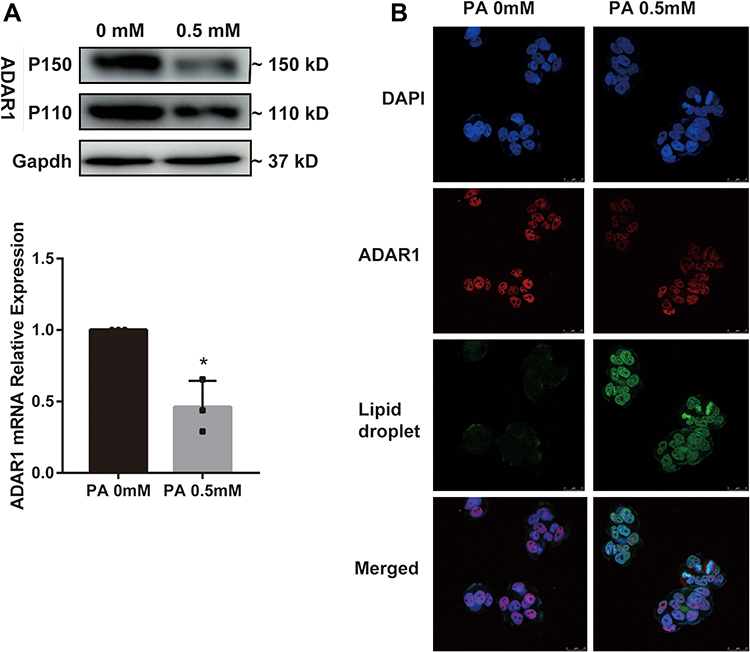 |
Figure 3 ADAR1 is downregulated in palmitic acid -treated HepG2.2.15 cells. (A) The mRNA and protein levels of ADAR1 in the control group and palmitic acid group. (B) After 24 h of palmitic acid treatment, cells were stained with antibody ADAR1 and fluorescent labeled Nile red, and then observed under a fluorescence microscope. (Scale bar: 25μm) *P < 0.05. Abbreviations: PA, palmitic acid; CHB, chronic hepatitis B; NAFLD, non-alcoholic fatty liver disease. |
miR-122 Inhibits HBV Replication Levels in Palmitic Acid - Treated HepG2.2.15 Cells
To assess the role of miR-122 in HBV expression, a miR-122 knockdown/overexpression system was established. The cells were transfected with miR-122 mimic, miR-122 inhibitor, or their negative controls (NC) for 24 hour, followed by incubation with palmitic acid (0.5mM) for 24 hour. The expression level of miRNA‑122 mimics in the transfected cells was significantly higher (P<0.05) than that observed in cells transfected with the negative control vector group, and the expression of the miR-122 inhibitor group was decreased (Figure 4A). In accordance with previous reports,21 transfection of a miR-122 mimic resulted in a reduction in HBV DNA levels (Figure 4B, left panel) while HBeAg showed the same trend (Figure 4C, left panel). Conversely, transfection with a miR-122 inhibitor increased the HBV DNA and HBeAg levels (P<0.05) (right panel of Figure 4B and C). These results suggest that miR-122 negatively regulates HBV replication.
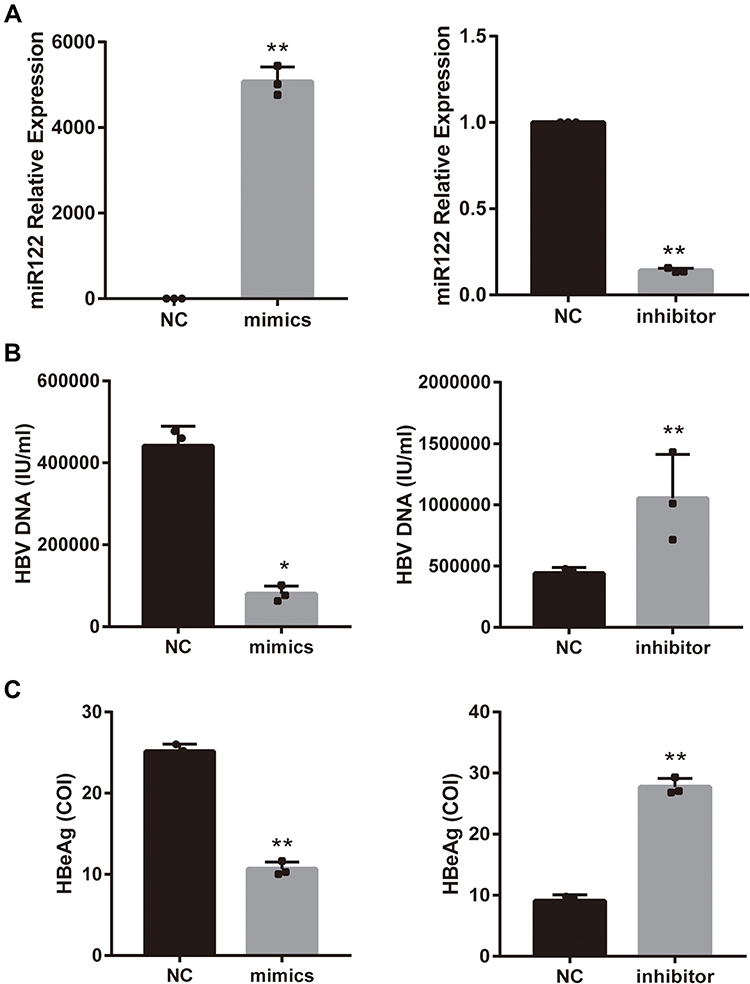 |
Figure 4 miR-122 inhibits HBV replication levels in palmitic acid -treated HepG2.2.15 cells. (A) qRT-PCR analysis of the expression of miR-122 in palmitic acid -treated HepG2.2.15 cells exposed to miR-122 mimic/inhibitor or negative control (NC). (B and C) After 48 h of miR-122 mimic/inhibitor or NC transfection, then 24 h of palmitic acid treatment, expression of HBV DNA and HBeAg levels in cell supernatant. Bars represent the mean ± SD of triplicate repetitions. *P < 0.05, **P < 0.01. Abbreviation: PA, palmitic acid. |
ADAR1 Downregulates HBV DNA Levels and Increases miR-122 Expression
As shown in Figures 2D and 3A, the expression of ADAR1 in palmitic acid -treated HepG2.2.15 cells was found to be decreased with concomitant increases in HBV DNA levels; therefore, we speculated that ADAR1 might negatively regulate the expression of HBV DNA. To investigate the biological role of ADAR1 in hepatocytes, we constructed the ADAR1 overexpression (OE) vector PGMLV-ADAR1 or the negative control (NC-OE) and under-expression vector ADAR1-shRNA (sh1 and sh2) transfected them or the negative control (NC-LD) vector into HepG2.2.15. They were then treated with palmitic acid. The transfection efficiency was validated by qRT-PCR, western blotting and fluorescence microscopy (Figure 5A, B and F). The expression of miR-122 was then quantified. PCR results showed a positive correlation between miR-122 and ADAR1 (Figure 5C). Functionally, hepatitis B related markers in the cell supernatant were also assayed. The results showed that enforced expression of ADAR1 significantly suppressed both HBV DNA (Figure 5D left panel) and HBeAg (Figure 5E left panel), while knockdown of ADAR1 resulted in opposite results (P<0.05) (right panel of Figure 5D and E). Collectively, these results suggest that ADAR1 negatively regulates HBV DNA in hepatocytes, and this inhibitory effect may be achieved by increasing miR-122 levels.
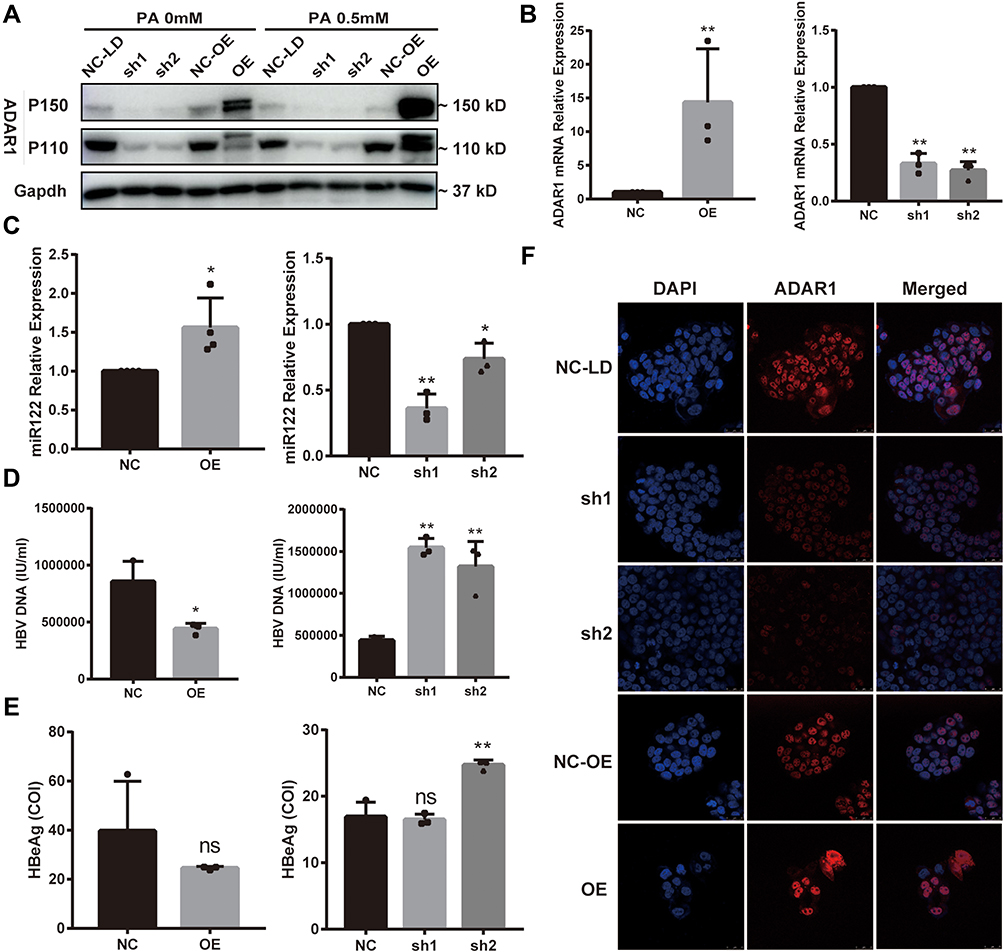 |
Figure 5 ADAR1 downregulates HBV DNA levels and increases miR-122 expression. HepG2.2.15 cells were transfected with GFP-ADAR1 lentivirus (OE) and ADAR1-shRNA lentivirus (LD) or the negative control (NC) and then treated with palmitic acid for 24 h. (A and B) mRNA and protein expression levels of ADAR1. (C) qRT-PCR analysis of miR-122 levels. (D–E) Expression levels of HBV DNA and HBeAg. (F) Cell localization and expression of ADAR1 were observed by immunofluorescence. (Scale bar: 25μm) All datas’ bars represent the mean ± SD of triplicate repetitions. *P < 0.05, **P < 0.01. Abbreviations: GFP, green fluorescent protein; ADAR1, adenosine deaminase acting on RNA 1; shRNA, short hairpin RNA; ns, no significance. |
Discussion
In this study we evaluated the clinical and functional association of low expression of ADAR1 and liver-specific miR-122 in CHB concurrent with NAFLD. We showed that the expression of ADAR1 and miR-122 was lower in the liver tissues of CHB concurrent with NAFLD patients. We then demonstrated that, as a HBV suppressor miRNA, miR-122, its lower expression of induced by lipotoxicity may facilitate HBV DNA replication. In addition, as an RNA editing enzyme, ADAR1 may inhibit HBV DNA replication by promoting the expression of miR-122.
Although the coexistence of HBV infection and NAFLD is clinically common, their relationship remains controversial. Studies have shown that NAFLD inhibits HBV DNA and HBV-related antigen secretion in HBV-immunocompetent or HBV transgenic mice.22,23 Interestingly, some studies suggested that lipid metabolism, such as cholesterol metabolism, increases HBV gene expression and viral promoter or enhancer activity. This subsequently enhances HBV replication by bile-acid-mediated repression of some interferon-stimulated genes,24–26 and can increase the risk of cirrhosis in patients with CHB.27 The discrepancy may reflect the complexity of HBV infection combined with NAFLD in clinical practice and basic research. Therefore, more studies are needed to further explore the effect of HS on HBV infection.
RNA editing is an important step in generating the diversity and plasticity of cellular RNA signals.28–30 ADAR1, the most prevalent form of ADAR, mainly encodes two proteins: constitutively expressed protein P110 and interferon (IFN)-induced protein P150. Accumulating evidence has revealed that ADAR1 plays an important role in HBV DNA replication in patients with CHB. Li et al reported that ADAR1 stimulated by IFN-α downregulates the MAVS expression via RNA editing its 3’-UTR to enhance the anti-HBV response.17 On the contrary, Wang et al showed that HBV X protein transcription promotes ADAR1 expression. This inhibits IFN response and increases HBV replication in hepatocytes;18 however the specific effect of ADAR1 on HBV replication needs to be further determined, especially in CHB concurrent NAFLD. One study showed that ADAR1 can inhibit HBV replication by enhancing miRNA122;31 however, the underlying expression of ADAR1 in palmitic acid -treated HepG2.2.15 cells, and its relationship with HBV DNA is unknown. In the present study, we observed an inverse trend in ADAR1 expression against HBV DNA levels in palmitic acid -treated HepG2.2.15 cells, and confirmed that ADAR1 inhibits HBV expression in the liver, probably through miR-122. It is possible that the pronounced inhibitory effects of ADAR1 on HBV may shape the virus-host interactions. These results suggest that the ADAR1 and liver-specific microRNA miR-122, may act as inhibitory host factor during HBV replication. Our data also suggests that the upregulation of ADAR1 may be an effective strategy to limit HBV infection. Similar results have been observed in another study. Ben-Shoshan et. al confirmed that ADAR1 restrains the development of liver inflammation and fibrosis.32 In addition, ADAR1 also plays a regulatory role in other liver diseases. Overexpression of ADAR1 in cell culture and mouse models enhances cancerous characteristics such as cell proliferation, migration and invasion.29,33,34 In liver transplantation and hepatic resection, ADAR1 suppresses the activation of cytosolic RNA-sensing signaling pathways to protect the liver from ischemia/reperfusion Injury.35 Furthermore, we also revealed that the over-expression of miR-122 resulted in restricted HBV expression, whereas the depletion of endogenous miR-122 resulted in enhanced HBV expression in lipotoxic hepatocyte cells in vitro.
This study is innovative in two aspects: firstly, the current research is still at the basic research level, on both NAFLD and CHB alone. Moreover, studies on the combination of NAFLD and CHB are limited to clinical research, thus an understanding of molecular mechanisms is lacking; secondly, the effect of ADAR1 on HBV replication is unclear. We believe that the present study effectively bridges these gaps and provides insights into the molecular mechanisms underling the influence of fatty liver on the progression of hepatitis B. Our study had some limitations. Firstly, HepG2.2.15 is a stable HBV-producing cell line that produces HBV, and was first chosen as a model cell line containing integrated HBV genomes. During the culture process, the cells may be more vulnerable to aging and readily undergo differentiation. We can use HepG2-NTCP36 to validate our results. Sodium taurocholate co-transporting polypeptide (NTCP) is a HBV receptor that enables researchers to create hepatoma cell lines susceptible to HBV infection. However, infections requires large quantities of virus. What’s more, they failed to recapitulate the complete HBV life cycle. Thus, we selected HepG2.2.15 as the cell model for this study. We have shown that miR-122 can suppress the HBV replication, inhibit HBV DNA, and increase miR-122 expression after overexpression of ADAR1. However, we did not show that ADAR1 suppresses HBV replication or protects hepatocytes via miR-122. As such, in the future, we will conduct relevant studies to further explore the specific mechanism of ADAR1 regulating miR-122. Our conclusions were based on the responses of the cell line and may not reflect processes in the intact body. We are currently confirming our results in an animal model system using mice.
In summary, we demonstrated that ADAR1 may play a vital role in inhibiting HBV replication and HBeAg expression through the overexpression of miR-122 in lipotoxic hepatitis B cells. These findings support the proposition that ADAR1 is a promising biomarker and drug target for CHB concurrent with NAFLD.
Abbreviations
CHB, chronic hepatitis B; NAFLD, non-alcoholic fatty liver disease; ADAR1, adenosine deaminase acting on RNA-1; HCC, hepatocellular carcinoma; HBV, hepatitis B virus; CLD, chronic liver disease; CHC, chronic hepatitis C; ADAR, Adenosine Deaminases Acting on RNA; HBsAg, hepatitis B virus surface antigen; DMEM, Dulbecco’s modified Eagle’s medium; FBS, fetal bovine serum; BSA, bovine serum albumin; CCK-8 Kit, The Cell Counting Kit-8; PBS, phosphate-buffered saline; OD, optical density; GFP, green fluorescent protein; shRNA, short hairpin RN; HE, hematoxylin-eosin; qRT-PCR, quantitative real‑time polymerase chain reaction; BCA, bicinchoninic acid; SDS-PAGE, sodium dodecyl sulfate-polyacrylamide gel electrophoresis; PVDF, polyvinylidene fluoride; TBST, Tris-buffered saline plus Tween-20; DAB, diaminobenzidine; AST, aspartate aminotransferase; ALT, alanine aminotransferase; SDs, standard deviations; A-to-I, adenosine to inosine; EPO, erythropoietin; NTCP, sodium taurocholate cotransporting polypeptide.
Acknowledgment
Dr. Jie Li wishes to acknowledge the support from the National Natural Science Fund (No. 82170609, 81970545), Natural Science Foundation of Shandong Province (Major Project) (No. ZR2020KH006) and Ji’nan Science and Technology Development Project (No.202019079).
Disclosure
The authors report no conflicts of interest in this work.
References
1. Cotter TG, Rinella M. Nonalcoholic fatty liver disease 2020: the state of the disease. Gastroenterology. 2020;158(7):1851–1864. doi:10.1053/j.gastro.2020.01.052
2. Li J, Zou B, Yeo YH, et al. Prevalence, incidence, and outcome of non-alcoholic fatty liver disease in Asia, 1999–2019: a systematic review and meta-analysis. Lancet Gastroenterol Hepatol. 2019;4(5):389–398. doi:10.1016/S2468-1253(19)30039-1
3. Razavi-Shearer D, Gamkrelidze I, Nguyen MH, et al. Global prevalence, treatment, and prevention of hepatitis B virus infection in 2016: a modelling study. Lancet Gastroenterol Hepatol. 2018;3(6):383–403. doi:10.1016/S2468-1253(18)30056-6
4. Zheng Q, Zou B, Wu Y, et al. Systematic review with meta-analysis: prevalence of hepatic steatosis, fibrosis and associated factors in chronic hepatitis B. Aliment Pharmacol Ther. 2021;54(9):1100–1109. doi:10.1111/apt.16595
5. Butler EK, Gersch J, McNamara A, et al. Hepatitis B virus serum DNA andRNA levels in nucleos(t)ide analog-treated or untreated patients during chronic and acute infection. Hepatology. 2018;68(6):2106–2117. doi:10.1002/hep.30082
6. Joo E-J, Chang Y, Yeom J-S, Ryu S. Hepatitis B virus infection and decreased risk of nonalcoholic fatty liver disease: a cohort study. Hepatology. 2017;65(3):828–835. doi:10.1002/hep.28917
7. Peleg N, Issachar A, Sneh Arbib O, et al. Liver steatosis is a strong predictor of mortality and cancer in chronic hepatitis B regardless of viral load. JHEP Rep. 2019;1(1):9–16. doi:10.1016/j.jhepr.2019.02.002
8. Machado MV, Oliveira AG, Cortez-Pinto H. Hepatic steatosis in hepatitis B virus infected patients: meta-analysis of risk factors and comparison with hepatitis C infected patients. J Gastroenterol Hepatol. 2011;26(9):1361–1367. doi:10.1111/j.1440-1746.2011.06801.x
9. Karacaer Z, Okur G, Cermik H, Altun D. Is there an influence of hepatic steatosis on fibrosis and necroinflammation in young patients with chronic viral hepatitis B?. Postgrad Med. 2016;128(7):697–700. doi:10.1080/00325481.2016.1221733
10. Li J, Le AK, Chaung KT, et al. Fatty liver is not independently associated with the rates of complete response to oral antiviral therapy in chronic hepatitis B patients. Liver Int. 2020;40(5):1052–1061. doi:10.1111/liv.14415
11. Ceylan B, Arslan F, Batirel A, et al. Impact of fatty liver on hepatitis B virus replication and virologic response to tenofovir and entecavir. Turk J Gastroenterol. 2016;27(1):42–46. doi:10.5152/tjg.2015.150348
12. Li J, Yang HI, Yeh ML, et al. Association between fatty liver and cirrhosis, hepatocellular carcinoma, and hepatitis B surface antigen seroclearance in chronic hepatitis B. J Infect Dis. 2021;224(2):294–302. doi:10.1093/infdis/jiaa739
13. Chen Y, Fan C, Chen Y, et al. Effect of hepatic steatosis on the progression of chronic hepatitis B: a prospective cohort and in vitro study. Oncotarget. 2017;8(35):58601–58610. doi:10.18632/oncotarget.17380
14. Tomar A, Bhardwaj A, Choudhary A, Bhattacharyya D. Association of obstructive sleep apnea with nocturnal hypoxemia in metabolic-associated fatty liver disease patients: a cross-sectional analysis of record-based data. J Family Med Prim Care. 2021;10(8):3105–3110. doi:10.4103/jfmpc.jfmpc_412_21
15. Pais R, Rusu E, Zilisteanu D, et al. Prevalence of steatosis and insulin resistance in patients with chronic hepatitis B compared with chronic hepatitis C and non-alcoholic fatty liver disease. Eur J Intern Med. 2015;26(1):30–36. doi:10.1016/j.ejim.2014.12.001
16. Pujantell M, Franco S, Galvan-Femenia I, et al. ADAR1 affects HCV infection by modulating innate immune response. Antiviral Res. 2018;156:116–127. doi:10.1016/j.antiviral.2018.05.012
17. Li T, Yang X, Li W, et al. ADAR1 stimulation by ifn-alpha downregulates the expression of MAVS via RNA editing to regulate the Anti-HBV response. Mol Ther. 2021;29(3):1335–1348. doi:10.1016/j.ymthe.2020.11.031
18. Wang L, Sun Y, Song X, et al. Hepatitis B virus evades immune recognition via RNA adenosine deaminase ADAR1-mediated viral RNA editing in hepatocytes. Cell Mol Immunol. 2021;18(8):1871–1882. doi:10.1038/s41423-021-00729-1
19. van der Kwast R, van Ingen E, Parma L, Peters HAB, Quax PHA, Nossent AY. Adenosine-to-inosine editing of MicroRNA-487b alters target gene selection after ischemia and promotes neovascularization. Circ Res. 2018;122(3):444–456. doi:10.1161/CIRCRESAHA.117.312345
20. Qiu L, Fan H, Jin W, et al. miR-122-induced down-regulation of HO-1 negatively affects miR-122-mediated suppression of HBV. Biochem Biophys Res Commun. 2010;398(4):771–777. doi:10.1016/j.bbrc.2010.07.021
21. Wang S, Qiu L, Yan X, et al. Loss of microRNA 122 expression in patients with hepatitis B enhances hepatitis B virus replication through cyclin G(1) -modulated P53 activity. Hepatology. 2012;55(3):730–741. doi:10.1002/hep.24809
22. Hu D, Wang H, Wang H, et al. Non-alcoholic hepatic steatosis attenuates hepatitis B virus replication in an HBV-immunocompetent mouse model. Hepatol Int. 2018;12(5):438–446. doi:10.1007/s12072-018-9877-7
23. Zhang Z, Pan Q, Duan XY, et al. Fatty liver reduces hepatitis B virus replication in a genotype B hepatitis B virus transgenic mice model. J Gastroenterol Hepatol. 2012;27(12):1858–1864. doi:10.1111/j.1440-1746.2012.07268.x
24. Eller C, Heydmann L, Colpitts CC, Verrier ER, Schuster C, Baumert TF. The functional role of sodium taurocholate cotransporting polypeptide NTCP in the life cycle of hepatitis B, C and D viruses. Cell Mol Life Sci. 2018;75(21):3895–3905. doi:10.1007/s00018-018-2892-y
25. Ramiere C, Scholtes C, Diaz O, et al. Transactivation of the hepatitis B virus core promoter by the nuclear receptor FXRalpha. J Virol. 2008;82(21):10832–10840. doi:10.1128/JVI.00883-08
26. Zhao K, Liu S, Chen Y, et al. Upregulation of HBV transcription by sodium taurocholate cotransporting polypeptide at the postentry step is inhibited by the entry inhibitor Myrcludex B. Emerg Microbes Infect. 2018;7(1):186. doi:10.1038/s41426-018-0189-8
27. Wang QX, Xue J, Shi MJ, et al. Association between metabolic dysfunction-associated fatty liver disease and the risk of cirrhosis in patients with chronic hepatitis B-A retrospective cohort study. Diabetes Metab Syndr Obes. 2022;15:2311–2322. doi:10.2147/DMSO.S369824
28. Fritzell K, Xu LD, Lagergren J, Ohman M. ADARs and editing: the role of A-to-I RNA modification in cancer progression. Semin Cell Dev Biol. 2018;79:123–130. doi:10.1016/j.semcdb.2017.11.018
29. Chan TH, Lin CH, Qi L, et al. A disrupted RNA editing balance mediated by ADARs (Adenosine DeAminases that act on RNA) in human hepatocellular carcinoma. Gut. 2014;63(5):832–843. doi:10.1136/gutjnl-2012-304037
30. Wang Q, Li X, Qi R, Billiar T, Editing RNA. ADAR1, and the innate immune response. Genes. 2017;8(1):41. doi:10.3390/genes8010041
31. Liu G, Ma X, Wang Z, et al. Adenosine deaminase acting on RNA-1 (ADAR1) inhibits hepatitis B virus (HBV) replication by enhancing microRNA-122 processing. J Biol Chem. 2019;294(38):14043–14054 doi:10.1074/jbc.RA119.007970
32. Ben-Shoshan SO, Kagan P, Sultan M, et al. ADAR1 deletion induces NFkappaB and interferon signaling dependent liver inflammation and fibrosis. RNA Biol. 2017;14(5):587–602. doi:10.1080/15476286.2016.1203501
33. Anadon C, Guil S, Simo-Riudalbas L, et al. Gene amplification-associated overexpression of the RNA editing enzyme ADAR1 enhances human lung tumorigenesis. Oncogene. 2016;35(33):4422. doi:10.1038/onc.2016.27
34. Chan TH, Qamra A, Tan KT, et al. ADAR-Mediated RNA editing predicts progression and prognosis of gastric cancer. Gastroenterology. 2016;151(4):637–50 e10. doi:10.1053/j.gastro.2016.06.043
35. Wang H, Wang G, Zhang L, et al. ADAR1 suppresses the activation of cytosolic RNA-sensing signaling pathways to protect the liver from ischemia/reperfusion injury. Sci Rep. 2016;6:20248. doi:10.1038/srep20248
36. Michailidis E, Pabon J, Xiang K, et al. A robust cell culture system supporting the complete life cycle of hepatitis B virus. Sci Rep. 2017;7(1):16616. doi:10.1038/s41598-017-16882-5
 © 2022 The Author(s). This work is published and licensed by Dove Medical Press Limited. The
full terms of this license are available at https://www.dovepress.com/terms
and incorporate the Creative Commons Attribution
- Non Commercial (unported, 3.0) License.
By accessing the work you hereby accept the Terms. Non-commercial uses of the work are permitted
without any further permission from Dove Medical Press Limited, provided the work is properly
attributed. For permission for commercial use of this work, please see paragraphs 4.2 and 5 of our Terms.
© 2022 The Author(s). This work is published and licensed by Dove Medical Press Limited. The
full terms of this license are available at https://www.dovepress.com/terms
and incorporate the Creative Commons Attribution
- Non Commercial (unported, 3.0) License.
By accessing the work you hereby accept the Terms. Non-commercial uses of the work are permitted
without any further permission from Dove Medical Press Limited, provided the work is properly
attributed. For permission for commercial use of this work, please see paragraphs 4.2 and 5 of our Terms.
Recommended articles
The Levels of Serum HBV Pre-Genomic RNA and Its Associated Factors Among HBV-Infected Patients: A Retrospective Cohort Study in Hangzhou, Zhejiang, China
Zuo Z, Wu J, Wang M, Wu R, Zhang X, Hu L, Cui H, Feng T, Xu A, Liu S
International Journal of General Medicine 2024, 17:4669-4680
Published Date: 15 October 2024