Back to Journals » Clinical Epidemiology » Volume 15
Adaptability of High Dimensional Propensity Score Procedure in the Transition from ICD-9 to ICD-10 in the US Healthcare System
Authors Sarayani A, Brown JD, Hampp C ![]() , Donahoo WT, Winterstein AG
, Donahoo WT, Winterstein AG ![]()
Received 14 February 2023
Accepted for publication 20 April 2023
Published 29 May 2023 Volume 2023:15 Pages 645—660
DOI https://doi.org/10.2147/CLEP.S405165
Checked for plagiarism Yes
Review by Single anonymous peer review
Peer reviewer comments 2
Editor who approved publication: Professor Henrik Toft Sørensen
Amir Sarayani,1,2 Joshua D Brown,1,2 Christian Hampp,1,3 William T Donahoo,4,5 Almut G Winterstein1,2
1Department of Pharmaceutical Outcomes and Policy, College of Pharmacy, University of Florida, Gainesville, FL, USA; 2Center for Drug Safety and Evaluation, University of Florida, Gainesville, FL, USA; 3Regeneron Pharmaceuticals Inc., Tarrytown, NY, USA; 4Division of Endocrinology, Diabetes, & Metabolism, College of Medicine, University of Florida, Gainesville, FL, USA; 5Department of Health Outcomes and Biomedical Informatics, College of Medicine, University of Florida, Gainesville, FL, USA
Correspondence: Amir Sarayani, University of Florida College of Pharmacy, 1225 Center Drive, HPNP Bldg, Room 3334, Gainesville, FL, 32610, USA, Email [email protected]; [email protected]
Background: High-Dimensional Propensity Score procedure (HDPS) is a data-driven approach to assist control for confounding in pharmacoepidemiologic research. The transition to the International Classification of Disease (ICD-9/10) in the US health system may pose uncertainty in applying the HDPS procedure.
Methods: We assembled a base cohort of patients in MarketScan® Commercial Claims Database who had newly initiated celecoxib or traditional NSAIDs to compare gastrointestinal bleeding risk. We then created bootstrapped hypothetical cohorts from the base cohort with predefined patient selection patterns from the ICD eras. Three strategies for HDPS deployment were tested: 1) split the cohort by ICD era, deploy HDPS twice, and pool the relative risks (pooled RR), 2) consider codes from each ICD era as a separate data dimension and deploy HDPS in the entire cohort (data dimensions) and 3) map ICD codes from both eras to Clinical Classifications Software (CCS) concepts before deploying HDPS in the entire cohort (CCS mapping). We calculated percent bias and root-mean-squared error to compare the strategies.
Results: A similar bias reduction was observed in cohorts where patient selection pattern from each ICD era was comparable between the exposure groups. In the presence of considerable disparity in patient selection, we observed a bimodal distribution of propensity scores in the data dimensions strategy, indicating instrument-like covariates. Moreover, the CCS mapping strategy resulted in at least 30% less bias than pooled RR and data dimensions strategies (RMSE: 0.14, 0.19, 0.21, respectively) in this scenario.
Conclusion: Mapping ICD codes to a stable terminology like CCS serves as a helpful strategy to reduce residual bias when deploying HDPS in pharmacoepidemiologic studies spanning both ICD eras.
Keywords: propensity score, confounding, real-world evidence, comparative effectiveness research, ICD-10, ICD-9, HDPS algorithm
Background
Pharmacoepidemiologic studies often use electronic healthcare databases to evaluate a potential causal relationship between therapeutics and health outcomes.1,2 In these studies, researchers use available data elements to define study eligibility criteria, exposure, outcome, and potential confounding factors. While providing large sample sizes, healthcare databases are not designed for epidemiological research purposes,2 and appropriate measurement of all necessary study variables may not be possible, especially for potential confounders. Therefore, unmeasured or residual confounding can be more concerning in pharmacoepidemiologic studies than in traditional observational studies that use primary data collection.1,3
Based on the principal idea of proxy adjustment,4–9 Schneeweiss et al 2009 proposed a semi-automated algorithm to consider all recorded data for study patients and create an extensive set of variables found empirically to contribute to confounding.10 This approach is called High-Dimensional Propensity Score (HDPS) and has been tested and employed in several case examples encompassing different databases, healthcare settings, and clinical questions.11 To date, the literature suggests that the HDPS algorithm can reduce confounding when supplementing investigator-defined covariates. It can also generate comparable estimates or even less biased estimates in some cases when used without investigator-defined covariates.11
The HDPS algorithm hinges on standard medical terminologies encoding clinical data in healthcare databases.12 An issue arises when study cohorts are assembled from databases with a significant change in medical terminologies during a study period. For instance, the current version of the ICD terminology in the US healthcare system is ICD-10-CM for medical conditions and ICD-10-Procedures (PCS).13 This version went into effect in October 2015 and exhibited significant changes compared to its predecessor. The ICD-9-CM includes approximately ~14,000 diagnosis concept codes and ~3800 medical procedure codes, while the ICD-10-CM/PCS includes ~70,000 medical diagnoses and ~71,000 medical procedure codes. The concepts have become significantly more granular in the ICD-10-CM/PCS, and the alphanumeric structure of the codes was completely overhauled (Supplementary Information; Comparison of ICD-9-CM and ICD-10-CM/PCS Terminologies).13 As a result, patients in a single study cohort could have medical information coded in two incompatible terminologies, potentially impairing the HDPS algorithm function.
The HDPS developers and expert users have proposed a few strategies to handle this inconsistency.14 One strategy would be to consider codes from each ICD era as separate data dimensions regardless of cohort composition and run the algorithm as usual. With this approach, using a fixed look-back period before a study index date, a patient could have two different measures for the same confounder represented by variables from each ICD era. Another strategy would be to conduct a separate study in each ICD era and construct a pooled effect estimate. We proposed a third strategy to harmonize ICD-9 and ICD-10 codes across the transition period via a unifying and consistent medical terminology. To do so, one could consider Systematized Nomenclature of Medicine Clinical Terms (SNOMED-CT®) or even an aggregated medical terminology like the Clinical Classifications Software (CCS) developed by the Agency for Healthcare Research and Quality (AHRQ).15–17
The present study aimed to assess the HDPS algorithm’s performance in a well-established confounding by indication scenario and tested these three adaptation strategies in cohorts with varying patient selection patterns across ICD eras.
Methods
Data Source
We used the MarketScan® Commercial Claims Research Databases (2012–2019) to conduct this study. The database includes billing records for a nationwide sample of the privately insured population in the United States. Data on medical encounters in outpatient and inpatient settings and pharmacy dispensing events are available in the database. Medical diagnoses and procedures are encoded using the ICD (revisions 9 and 10), Current Procedural Terminology (CPT), and Healthcare Common Procedure Coding System (HCPCS) terminologies. The MarketScan® databases are certified as de-identified data, and the Institutional Review Board at the University of Florida exempted this study from review.
Study Design
We conducted a retrospective cohort study to compare the risk of gastrointestinal bleeding with celecoxib, a selective COX-2 inhibitor, with a conventional non-steroidal anti-inflammatory drug (cNSAID). Based on clinical trials, celecoxib is expected to have a moderate protective effect against gastrointestinal bleeding compared to cNSAID.18–20 However, observational studies without appropriate adjustment for confounding have shown a null effect or even higher gastrointestinal bleeding risk among COX-2 inhibitor users because clinicians often channel patients toward COX-2 inhibitors when a higher risk for gastrointestinal bleeding is present. This clinical scenario has been used in several studies to evaluate the HDPS algorithm, and we considered it an appropriate pragmatic example with established benchmarks to contrast our study findings.
Eligibility Criteria
We identified adult patients aged 18–65 who entered the study cohort on the initiation day of the study drugs (index date) with at least two prescription fills to indicate chronic use. Before cohort entry, all patients had at least 365 days of continuous insurance benefits (both medical and pharmacy) to determine new study drug use and prepare datasets for the HDPS algorithm. We refer to this cohort as the parent cohort hereafter.
Drug Exposure
We ascertained drug exposure using pharmacy claims data and National Drug Codes for celecoxib or cNSAID of interest (diclofenac, indomethacin, or piroxicam). These agents were selected because they were not available as over-the-counter oral products in the US.
Follow-Up and Outcome
We followed patients from the index date up to six months (intention-to-treat analysis). This analytic approach is consistent with previous studies on HDPS performance.5,10,17 The study outcome was the first gastrointestinal bleeding event after cohort entry and measured by an ICD9/ICD10 code algorithm proposed by the Sentinel Initiative, which has shown reasonable consistency across the ICD transition era.21 This algorithm is expected to have a high positive predictive value (>90%) when ascertained as the principal discharge diagnosis in an inpatient setting.22 The code set is provided in the Supplementary Information (Definition of Gastrointestinal Bleeding section). We captured gastrointestinal bleeding in either inpatient or outpatient settings when coded as a primary diagnosis to achieve adequate power to detect the risk of bleeding in the parent cohort.
Data Scenarios and Resampled Cohorts
For efficiency purposes and to create possible data scenarios in pharmacoepidemiologic studies, we constructed the following cohorts by random sampling with replacement (ie, bootstrapping) from the parent cohort (Table 1):
 |
Table 1 Composition of Resampled Cohorts in Each Data Scenario |
Scenario B (Base). We randomly sampled 100,000 patients from the parent cohort without stratifying them according to the ICD era to represent the parent cohort composition. We should note that this cohort includes patients indexed early in the ICD-10 era with a look-back period starting in the ICD-9 era.
For the following four scenarios, we limited sampling to those with all look-back information available in either ICD-9 or ICD-10. An illustration for these scenarios is provided in Figure 1.
 |
Figure 1 Visualization of data scenarios in resampled cohorts. |
Scenario C1. For celecoxib users, we randomly sampled 25,000 patients from the ICD-9 era and 25,000 from the ICD-10 era. For the cNSAID users, we sampled 25,000 from the ICD-9 era and 25,000 from the ICD-10 era. This scenario represents an equal distribution of information across ICD eras (Balanced Pattern).
Scenario C2. For celecoxib users, we randomly sampled 40,000 patients from the ICD-9 era and 10,000 from the ICD-10 era. For the cNSAID users, we sampled 40,000 from the ICD-9 era and 10,000 from the ICD-10 era. This scenario represents a skewed distribution of information across ICD eras where most patients are selected from the ICD-9 era, but the pattern is similar for both cohorts (Uniform skewness).
Scenario C3. For celecoxib users, we randomly sampled 40,000 patients from the ICD-9 era and 10,000 from the ICD-10 era. For the cNSAID users, we sampled 10,000 from the ICD-9 era and 40,000 from the ICD-10 era. This scenario represents a skewed distribution of information across ICD eras where the skewness is in the opposite direction for study cohorts (Nonuniform skewness).
Scenario C4. For celecoxib users, we randomly sampled 20,000 patients from the ICD-9 era and 5,000 from the ICD-10 era. For the cNSAID users, we sampled 5,000 from the ICD-9 era and 20,000 from the ICD-10 era. This scenario is similar to C3, but the sample size is smaller and fewer patients have the outcome of interest (Nonuniform skewness).
HDPS Algorithm Configurations
We used 3-digit ICD codes, CPT/HCPCS codes, and drug names (therapeutic detail variable in RedBook®) in our data dimensions for medical diagnoses, procedures, and pharmacy claims datasets, respectively. We set the algorithm to require a minimum frequency of 100 in the prevalence filter, select 200 variables per data dimension, create service intensity variables by computing the quartile of the number of codes per patient and the number of unique codes per patient within each dimension, and apply a correction for cells with zero in the confounder/outcome 2 × 2 table. We chose the ranking method based on the Bross bias formula to rank variable importance across data dimensions and selected up to 400 variables into the propensity score model.
For each data scenario (B, C1-C4), we applied three strategies to deploy the HDPS:
S1. Conduct separate studies in each ICD era and pool effect estimates (pooled RR).
S2. Consider codes from each ICD era as a separate data dimension in the HDPS algorithm (data dimensions).
S3. Map ICD codes to single-level CCS concepts before HDPS deployment (CCS mapping).
The CCS terminology has been developed and maintained by Healthcare Cost and Utilization Program (HCUP), AHRQ. The single-level CCS for diagnoses aggregates all ICD diagnosis codes into 285 illnesses and conditions.
Outcome Modeling and Bias Evaluation
Using a log-binomial model, we estimated the gastrointestinal bleeding risk ratio (RR). We considered two confounding adjustment conditions for each combination of cohort composition and PS estimation strategy: 1) crude (no adjustment), 2) demographics + empirical variables. We obtained the propensity score from the HDPS algorithm after trimming (2.5% asymmetric trimming – default setting in HDPS). We constructed stabilized inverse probability of treatment weights (S-IPTW) for patients with propensity scores within the common support region of distributions and incorporated the weights in the outcome models. To evaluate which strategy resulted in a less biased apparent RR, we assumed 0.80 to be the gold standard RR based on clinical trial data.10,17
We created 50 bootstrapped datasets for each data scenario and conducted HDPS/outcome modeling on each resampled cohort to capture variability in RR estimates due to sampling error. We summarized apparent RRs as geometric mean (2.5 and 97.5 percentiles) and calculated %bias and root-mean-squared-error (RMSE) to contrast different strategies. We used the first sample in the bootstrapped datasets to investigate each data scenario’s patient characteristics and propensity score distributions.
The HDPS software is available as part of Pharmacoepidemiology Toolbox 2.20.18 (https://www.drugepi.org/dope/software). We used SAS/STAT 15.2 (Cary, NC) for bootstrapping, HDPS implementation, and outcome modeling. We used the %metaanal SAS macro to pool RRs using the DerSimonian-Laird estimator for random effects (https://www.hsph.harvard.edu/donna-spiegelman/software/metaanal/). We utilized the Forester package (https://github.com/rdboyes/forester) and RStudio 2021.09.2–382 (Boston, MA) to create forest plots.
Results
Our parent cohort included 90,037 celecoxib initiators and 253,845 cNSAID initiators who met all eligibility criteria. The celecoxib group included more females (58% versus 48%), older patients (median age: 54 versus 51), and more chronic conditions (Table 2). Patients’ index era was comparable in exposure groups (ICD-9: 60% versus 62%). The crude incidence of gastrointestinal bleeding was 1.15% in the cNSAID group and 1.41% in the celecoxib group. As expected, we observed similar characteristics to the parent cohort in scenario B. The demographic and clinical characteristics in scenarios C1-C4 were like scenario B and differed in index calendar years by design (Table 2).
 |
Table 2 Characteristics of Patients in the Parent and Resampled Study Cohorts |
In scenario B, the apparent RR was 1.22 (1.12–1.42) in the crude analysis, and all three strategies to adjust for confounding via HDPS moved the apparent RR equally toward the gold RR. In scenarios C1 and C2, representing a balanced or uniform skewness pattern, we observed a similar trend for the apparent RR in the crude and adjusted analyses. In scenarios C3 and C4, which represented a nonuniform skewness pattern, all three strategies moved the apparent RR toward the gold RR; however, the magnitude of bias reduction was more significant in the CCS mapping strategy (Figure 2).
 |
Figure 2 Summary of relative risk estimates using three different adaptation strategy for HDPS in each data scenario. |
Both bias metrics confirmed the observation in the apparent RRs. The crude RR had a 188% bias in scenario B. All three strategies reduced bias by approximately half to 93% in the pooled RR strategy, 99% in the data dimensions strategy, and 100% in the CCS mapping strategy. Similar efficacy in bias reduction was observed in scenarios C1 and C2. However, in scenario C3, the CCS mapping strategy resulted in 43% and 30% less residual bias in the apparent RR than the pooled RR and data dimensions strategies, respectively. Our findings in scenario C4 were similar to C3. Evaluation of RMSEs showed similar findings across all data scenarios. Figures 3 and 4 summarize the bias metrics in all assessments.
 |
Figure 3 Residual bias in log relative risk using three different adaptation strategies for HDPS in each data scenario. |
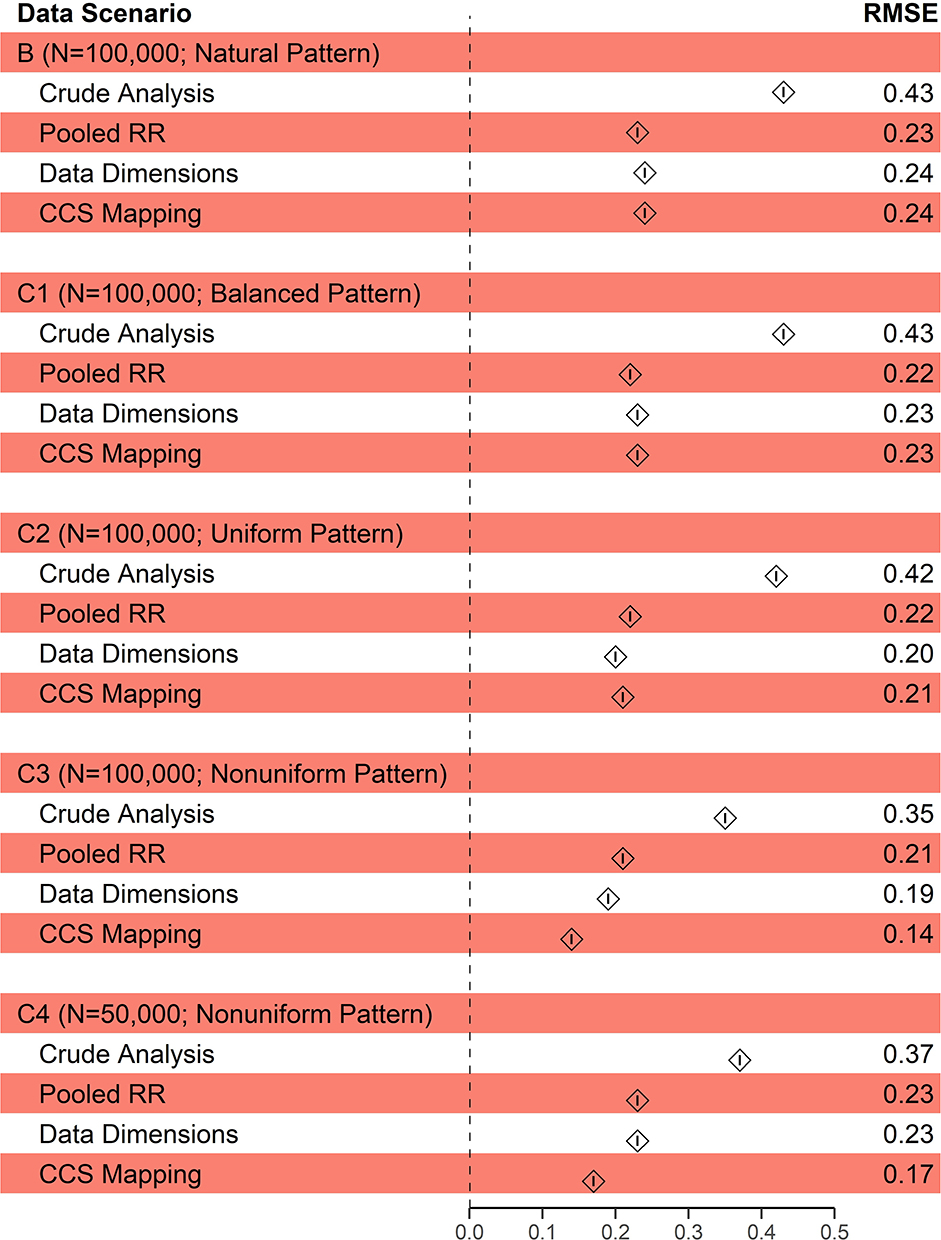 |
Figure 4 Root-mean-squared-error (RMSE) in log relative risk using three different adaptation strategies for HDPS in each data scenario. |
Across five scenarios and three strategies, the density plots for propensity score in exposure groups showed reasonable overlap in most instances (Supplementary Information; Density and Histogram Plots for Propensity Scores After Trimming in Various Data scenarios section) except for the nonuniform skewness scenario and data dimensions strategy (Figure 5), where we observed a distinct bimodal distribution in the treatment probability. When comparing the pooled RR strategy across data scenarios B and C1-C3, which all had similar sample sizes, we observed that the bootstrapped confidence interval ratio (ie, upper bound divided by the lower bound) was larger in scenario C3 compared with B, C1, and C2, respectively (1.46 versus 1.26, 1.29, 1.32), implying more instability in effect estimation.
 |
Figure 5 Propensity score density and histogram plots in data scenario C3 (nonuniform skewness data scenario). |
Discussion
Our study showed that all three adaptation strategies (pooled RR, data dimensions, or CCS mapping) performed comparably if the cohorts’ data had either a balanced pattern or uniform skewness (ie, selecting a similar proportion of patients from each ICD era). In the presence of nonuniform skewness (ie, selecting a different proportion of patients from each ICD era), we observed that the CCS mapping strategy resulted in at least 30% less residual bias than the other strategies. Of note, the data dimensions strategy resulted in having instrument-like covariates in the propensity score model.
We used a well-established clinical scenario (ie, NSAIDs and gastrointestinal bleeding) as an empirical example and assumed a gold standard RR. We assessed the adaptability of HDPS to data inputs with inconsistent medical terminology, a common issue in recent US-based pharmacoepidemiology studies. We noticed a bimodal distribution of the propensity scores when applying the data dimensions strategy in the nonuniform skewness data scenario. This observation implies that covariates strongly associated with the exposure were in the models. Intuitively, ICD-9 or ICD-10 codes acted merely as instrument-like variables, and HDPS selected them into the propensity score model likely because of differential prevalence in the study cohorts, a component of the Bross bias formula.23 Previous simulation and empirical studies have shown that having instrument variables in the propensity score model may increase bias and variance in effect estimates.24,25 Therefore, we recommend avoiding this strategy if nonuniform skewness is present in a given study.
Furthermore, in the nonuniform skewness scenario, the pooled RR strategy reduced bias less effectively (ie, more residual bias and imprecision) than the CCS mapping strategy. We observed a reasonable overlap in the propensity score density plots for each ICD era study which would typically imply adequate confounding adjustment for measured covariates. One possible explanation could be the impact of information aggregation into CCS concepts compared to 3-digit ICD codes that sometimes do not have clinical relevance. However, a previous study has shown that employing terminologies that aggregate drug names and diagnosis codes can minimally improve confounding control via HDPS.17 We also did not observe such improvement in C1 or C2 scenarios; thus, this explanation seems implausible.
On the other hand, we should note that the composition of C1 or C2 scenarios differed from C3 and C4 as the exposure groups did not have equal shares in the study cohort when we analyzed the data separately per ICD era (1:4 shares). A previous study on HDPS performance that had a significant difference in exposure group sizes (1:10 shares) also reported poor performance of this approach when relying on only empirical covariates, and the authors could not justify this observation.26 We think that exposure groups with drastically different sizes may interfere with HDPS’s prevalence filter that selects a subset of codes in each data dimension to create empirical covariates. HDPS calculates the prevalence for each code, within a given data dimension, as the proportion of patients with the code in the entire cohort. Then, the algorithm creates a ranking metric by retaining prevalence values less than 0.5 and subtracting values larger than 0.5 from 1.0. After sorting codes by this metric, a pre-defined number (200 in our study) of codes with the highest rank in each dimension will enter the next stage to create empirical covariates.10,12 Intuitively, when the cohort is not a 1:1 split between exposure groups, the prevalence of a code in the entire cohort will be closer to the observed prevalence in the larger exposure group. Thus, the prevalence filter will be biased toward the characteristics of the larger exposure group and potentially leave out codes with high prevalence in the smaller group and low prevalence in the larger group. This issue with the prevalence filter could affect all data dimensions. We anticipate that the overall HDPS confounding adjustment approach may become less effective in such data scenarios and possibly include instrument-like covariates, leading to less precision and more residual bias.
In our study, the CCS mapping strategy allowed us to run the HDPS procedure in the entire study cohort for scenarios C3 and C4, where the exposure group sizes were equal. Therefore, the prevalence filter has likely selected an unbiased subset of codes from each data dimension to create the empirical covariates. To illustrate the role of the prevalence filter, we have provided a preliminary analysis in the Supplementary Information (Role of Prevalence Filter in High-Dimensional Propensity Score Procedure section) that investigated three data scenarios (cNSAID vs COXIB; 1:1, 9:1, 1:9 shares in a cohort with only ICD-9 data). We incrementally increased the predefined number in the prevalence filter from 50 to 400. The estimated RR remained stable in the 1:1 scenario but varied significantly in the 9:1 and 1:9 scenarios. A comprehensive study is essential to evaluate the role of HDPS’s prevalence filter in various data and clinical scenarios and possibly optimize the algorithm logic.
One may argue that researchers should consider methods like disease risk score27 or calendar-time-specific propensity score28,29 in skewed data scenarios. The utility of the disease risk score approach is often unclear in pharmacoepidemiologic studies because of the rare incidence of study outcomes. Moreover, the diagnostics for the disease risk score approach are more complex than covariate balance checks in the propensity score approach.27 Therefore, fewer studies could potentially benefit from this method. Nevertheless, a high-dimensional disease risk score (available in the Pharmacoepidemiology Toolbox) would intuitively face trouble in nonuniform skewness scenarios and could be an area of future research. The calendar-time-specific propensity score approach will be helpful if researchers believe calendar time would be a proxy for clinically relevant confounding factors associated with the outcome of interest or when the confounding structure changes over time. However, bias reduction in this approach seems modest compared to a conventional propensity score.28 The pooled RR strategy was compliant with the calendar-time-specific propensity score approach since it divided the study period into two eras; however, we observed that the CCS mapping strategy resulted in a more robust bias reduction. Future research could compare multiple calendar-time blocks in each ICD era and potentially combine this approach with the CCS mapping strategy.
The CCS terminology we used in our proposed strategy has been developed and maintained by Healthcare Cost and Utilization Program (HCUP), AHRQ. We used the single-level CCS in the present study, which was more straightforward to apply in our specific use case than the multi-level CCS. However, as previously reported in the literature, multi-level CCS may also be harmonized and applied for confounding adjustment.17 We should note that the HCUP had preserved the original terminology structure after transitioning from ICD-9 to ICD-10. In 2019, HCUP introduced Clinical Classifications Software Refined (CCSR), which summarizes ICD-10-CM codes into 530 clinically meaningful concepts.30 Introduction of numerous novel concept codes and inconsistencies in mapping ICD-9 to ICD-10 led the agency to revise the CCS structure. Despite these possible caveats in CCS, we observed a more robust bias reduction in the CCS mapping strategy. Future studies are needed to assess whether other unifying vocabularies, eg, SNOMED-CT, could result in similar bias reduction, given that the CCS/CCSR goal is to create condensed and clinically meaningful concepts.
Limitations and Future Directions
Our study used a pre-defined gold standard RR of 0.8 based on the literature, and the magnitude of bias reduction was relative to this anchor point. Therefore, bias improvements may vary in contrast to the true RR. Our choice of 1:4 proportion in data scenarios C2-C4 was arbitrary but purposive to create a significant difference in the amount of information available from each ICD era in the study cohorts. Such skewness in the data might not be typical for database studies, and defining maximum tolerable disproportionality could be a topic for future investigations. The number of bootstrapped samples per data scenario and adaptation strategy was relatively small to accommodate computational capacity, but it provides a reasonable estimate of variance in sampling error. We tested the adaptation strategies in one clinical scenario and one data source. Thus, our findings must be replicated to reach robust and generalizable recommendations. Our focus in the present study was on the impact of inconsistency in ICD terminology; therefore, we did not include pre-defined variables based on expert knowledge. It is worth evaluating the HDPS performance in various data scenarios when a complete set of expert-defined covariates is available. Future studies may use the plasmode simulation approach31 to expand our study by assigning desired effect size and outcome prevalence while varying HDPS configurations and the sample size between exposure groups and ICD eras.
Conclusions
Our study showed that researchers need to be cautious when using the HDPS algorithm in their pharmacoepidemiologic studies crossing both ICD-9 and ICD-10 eras. Researchers may benefit from curating the ICD data with a unifying terminology like CCS if there is a disproportionate patient selection from each ICD era. HDPS developers may consider adding a new feature to the software to facilitate ICD data harmonization as a preliminary step in the algorithm.
Data Sharing Statement
Access to data is contingent on establishing the required data agreement with the vendor. The programming code may be requested from the corresponding author.
Funding
This project did not have any external funding source and was conducted as part of first author’s doctoral dissertation.
Disclosure
Almut Winterstein has received funding from the FDA, NIH, PCORI, AHRQ, the Bill and Melinda Gates Foundation, Merck & Co. and the state of Florida. She has received consulting honoraria from Arbor Pharmaceuticals and Genentech. She is a special government employee of the FDA and has served as the Chair of the Drug Safety and Risk Management (DSaRM) Advisory Committee from 2012 to 2018. None is related to this project or poses a conflict of interest. Christian Hampp is employed by Regeneron Pharmaceuticals, Inc., and owns company stock. Regeneron did not provide study funding, does not hold a marketing license for any of the study drugs, and had no role in manuscript development and decision to publish. Amir Sarayani is currently affiliated with Janssen Research & Development LLC. The study conceptualization, conduct, and manuscript writing were part of his doctoral dissertation and completed before his new role. Dr Joshua D Brown reports employment from Pfizer, outside the submitted work. The authors report no other conflicts of interest in this work.
References
1. Prada-Ramallal G, Takkouche B, Figueiras A. Bias in pharmacoepidemiologic studies using secondary health care databases: a scoping review. BMC Med Res Methodol. 2019;19(1):53. doi:10.1186/s12874-019-0695-y
2. Schneeweiss S, Avorn J. A review of uses of health care utilization databases for epidemiologic research on therapeutics. J Clin Epidemiol. 2005;58(4):323–337. doi:10.1016/j.jclinepi.2004.10.012
3. Connolly JG, Glynn RJ, Schneeweiss S, Gagne JJ. Improving measurement of binary covariates in claims data: a simulation study. Pharmacoepidemiol Drug Saf. 2020;29(9):1093–1100. doi:10.1002/pds.4961
4. Cuthbertson CC, Kucharska-Newton A, Faurot KR, et al. Controlling for frailty in pharmacoepidemiologic studies of older adults: validation of an existing medicare claims-based algorithm. Epidemiology. 2018;29(4):556–561. doi:10.1097/EDE.0000000000000833
5. Patorno E, Gopalakrishnan C, Franklin JM, et al. Claims-based studies of oral glucose-lowering medications can achieve balance in critical clinical variables only observed in electronic health records. Diabetes Obes Metab. 2018;20(4):974–984. doi:10.1111/dom.13184
6. Mayer SE, Tan HJ, Hinton SP, et al. Comparison of medicare claims-based proxy measures of poor function and associations with treatment receipt and mortality in older colon cancer patients. Med Care. 2019;57(4):286–294. doi:10.1097/MLR.0000000000001073
7. Kuroki M, Pearl J. Measurement bias and effect restoration in causal inference. Biometrika. 2014;101(2):423–437. doi:10.1093/biomet/ast066
8. Miao W, Geng Z, Tchetgen Tchetgen EJ. Identifying causal effects with proxy variables of an unmeasured confounder. Biometrika. 2018;105(4):987–993. doi:10.1093/biomet/asy038
9. VanderWeele TJ. Principles of confounder selection. Eur J Epidemiol. 2019;34(3):211–219. doi:10.1007/s10654-019-00494-6
10. Schneeweiss S, Rassen JA, Glynn RJ, Avorn J, Mogun H, Brookhart MA. High-dimensional propensity score adjustment in studies of treatment effects using health care claims data. Epidemiology. 2009;20(4):512–522. doi:10.1097/EDE.0b013e3181a663cc
11. Schneeweiss S. Automated data-adaptive analytics for electronic healthcare data to study causal treatment effects. Clin Epidemiol. 2018;10:771–788. doi:10.2147/CLEP.S166545
12. Rassen JA, Schneeweiss S. Using high-dimensional propensity scores to automate confounding control in a distributed medical product safety surveillance system. Pharmacoepidemiol Drug Saf. 2012;21 Suppl 1:41–49. doi:10.1002/pds.2328
13. Center for Disease Prevention and Control. The ICD-10 transition and public health surveillance - what you need to know; 2013. Available from: https://www.cdc.gov/nchs/icd/icd10cm_pcs_background.htm.
14. Rassen JA, Seeger J. Propensity scores in pharmacoepidemiology workshop.
15. National Library of Medicine. Systematized Nomenclature of Medicine–Clinical Terms (SNOMED CT). Available from: https://www.nlm.nih.gov/healthit/snomedct/index.html.
16. Agency for Healthcare Research and Quality. Clinical classifications software (CCS) for ICD-9-CM - healthcare cost and utilization project (HCUP); 2017. Available from: https://www.hcup-us.ahrq.gov/toolssoftware/ccs/ccs.jsp.
17. Le HV, Poole C, Brookhart A, et al. Effects of aggregation of drug and diagnostic codes on the performance of the high-dimensional propensity score algorithm: an empirical example. BMC Med Res Methodol. 2013;13(1). doi:10.1186/1471-2288-13-142
18. Mallen SR, Essex MN, Zhang R. Gastrointestinal tolerability of NSAIDs in elderly patients: a pooled analysis of 21 randomized clinical trials with celecoxib and nonselective NSAIDs. Curr Med Res Opin. 2011;27(7):1359–1366. doi:10.1185/03007995.2011.581274
19. Eisen GM, Goldstein JL, Hanna DB, Rublee DA. Meta-analysis: upper gastrointestinal tolerability of valdecoxib, a cyclooxygenase-2-specific inhibitor, compared with nonspecific nonsteroidal anti-inflammatory drugs among patients with osteoarthritis and rheumatoid arthritis. Aliment Pharmacol Ther. 2005;21(5):591–598. doi:10.1111/j.1365-2036.2005.02383.x
20. Watson DJ, Harper SE, Zhao PL, Quan H, Bolognese JA, Simon TJ. Gastrointestinal tolerability of the selective cyclooxygenase-2 (COX-2) inhibitor rofecoxib compared with nonselective COX-1 and COX-2 inhibitors in osteoarthritis. Arch Intern Med. 2000;160(19):2998–3003. doi:10.1001/archinte.160.19.2998
21. U.S. Food and Drug Administration - Sentinel Initiative. Gastrointestinal bleeding algorithm defined in “thromboembolic stroke, intracranial hemorrhage, gastrointestinal bleeding, and major extracranial bleeding following dabigatran, rivaroxaban, and apixaban use in patients with atrial fibrillation: a propensity score matched analysis; 2020 https://www.sentinelinitiative.org/methods-data-tools/health-outcomes-interest/gastrointestinal-bleeding-algorithm-defined.
22. Raiford DS, Pérez Gutthann S, García Rodríguez LA. Positive predictive value of ICD-9 codes in the identification of cases of complicated peptic ulcer disease in the Saskatchewan hospital automated database. Epidemiology. 1996;7(1):101–104. doi:10.1097/00001648-199601000-00018
23. Wyss R, Fireman B, Rassen JA, Schneeweiss S. Erratum: high-dimensional propensity score adjustment in studies of treatment effects using health care claims data. Epidemiology. 2018;29(6):e63–e64. doi:10.1097/EDE.0000000000000886
24. Brookhart MA, Schneeweiss S, Rothman KJ, Glynn RJ, Avorn J, Stürmer T. Variable selection for propensity score models. Am J Epidemiol. 2006;163(12):1149–1156. doi:10.1093/AJE/KWJ149
25. Patrick AR, Schneeweiss S, Brookhart MA, et al. The implications of propensity score variable selection strategies in pharmacoepidemiology: an empirical illustration. Pharmacoepidemiol Drug Saf. 2011;20(6):551–559. doi:10.1002/PDS.2098
26. Patorno E, Glynn RJ, Hernández-Díaz S, Liu J, Schneeweiss S. Studies with many covariates and few outcomes: selecting covariates and implementing propensity-score-based confounding adjustments. Epidemiology. 2014;25(2):268–278. doi:10.1097/EDE.0000000000000069
27. Wyss R, Glynn RJ, Gagne JJ. A review of disease risk scores and their application in pharmacoepidemiology. Curr Epidemiol Reports. 2016;3(4):277–284. doi:10.1007/S40471-016-0088-2
28. Mack CD, Glynn RJ, Brookhart MA, et al. Calendar time-specific propensity scores and comparative effectiveness research for stage III colon cancer chemotherapy. Pharmacoepidemiol Drug Saf. 2013;22(8):810–818. doi:10.1002/PDS.3386
29. Seeger JD, Kurth T, Walker AM, Use of propensity score technique to account for exposure-related covariates: an example and lesson. Med Care. 2007;45(10):S143–S148. doi:10.1097/MLR.0b013e318074ce79
30. Agency for Healthcare Research and Quality. Clinical Classifications Software Refined (CCSR) - healthcare cost and utilization program (HCUP). Available from: https://www.hcup-us.ahrq.gov/toolssoftware/ccsr/ccs_refined.jsp.
31. Franklin JM, Schneeweiss S, Polinski JM, Rassen JA. Plasmode simulation for the evaluation of pharmacoepidemiologic methods in complex healthcare databases. Comput Stat Data Anal. 2014;72:219–226. doi:10.1016/j.csda.2013.10.018
 © 2023 The Author(s). This work is published and licensed by Dove Medical Press Limited. The
full terms of this license are available at https://www.dovepress.com/terms
and incorporate the Creative Commons Attribution
- Non Commercial (unported, 3.0) License.
By accessing the work you hereby accept the Terms. Non-commercial uses of the work are permitted
without any further permission from Dove Medical Press Limited, provided the work is properly
attributed. For permission for commercial use of this work, please see paragraphs 4.2 and 5 of our Terms.
© 2023 The Author(s). This work is published and licensed by Dove Medical Press Limited. The
full terms of this license are available at https://www.dovepress.com/terms
and incorporate the Creative Commons Attribution
- Non Commercial (unported, 3.0) License.
By accessing the work you hereby accept the Terms. Non-commercial uses of the work are permitted
without any further permission from Dove Medical Press Limited, provided the work is properly
attributed. For permission for commercial use of this work, please see paragraphs 4.2 and 5 of our Terms.
Recommended articles
Oncology Drug Effectiveness from Electronic Health Record Data Calibrated Against RCT Evidence: The PARSIFAL Trial Emulation
Merola D, Young J, Schrag D, Lin KJ, Robert N, Schneeweiss S
Clinical Epidemiology 2022, 14:1135-1144
Published Date: 10 October 2022