")
Back to Journals » Neuropsychiatric Disease and Treatment » Volume 19
Acute Phase Blood Glucose Levels and Functional Outcomes in Patients with Spontaneous Intracerebral Hemorrhage
Authors Zhou Y , Luo Z, Yu M, Zhan C, Xu H, Lin R, Bian S, Yang Y , Jiang Z, Tao X, Ye Z, Wang M, Zhu D
Received 2 August 2023
Accepted for publication 16 November 2023
Published 5 December 2023 Volume 2023:19 Pages 2697—2707
DOI https://doi.org/10.2147/NDT.S433488
Checked for plagiarism Yes
Review by Single anonymous peer review
Peer reviewer comments 2
Editor who approved publication: Dr Yuping Ning
Ying Zhou,1 Zhixian Luo,1 Mengying Yu,1 Chenyi Zhan,1 Haoli Xu,1 Ru Lin,1 Shuying Bian,1 Yunjun Yang,2,3 Zhenghao Jiang,4 Xinyi Tao,4 Zusen Ye,5 Meihao Wang,1 Dongqin Zhu2
1Department of Radiology, The First Affiliated Hospital of Wenzhou Medical University, Wenzhou, People’s Republic of China; 2Department of Nuclear, The First Affiliated Hospital of Wenzhou Medical University, Wenzhou, People’s Republic of China; 3Key Laboratory of Novel Nuclide Technologies on Precision Diagnosis and Treatment & Clinical Transformation of Wenzhou, Wenzhou, People’s Republic of China; 4The First School of Medicine, Wenzhou Medical University, Wenzhou, People’s Republic of China; 5Department of Neurology, The First Affiliated Hospital of Wenzhou Medical University, Wenzhou, People’s Republic of China
Correspondence: Dongqin Zhu, Department of Nuclear, The First Affiliated Hospital of Wenzhou Medical University, Wenzhou, 325000, People’s Republic of China, Tel +86 0577 55579667, Email [email protected]
Objective: Post-stroke hyperglycemia as a common phenomenon is associated with unfavorable outcomes. Focusing on admission hyperglycemia, other markers of dysglycemia were overlooked. This study aimed to explore the contribution of acute phase blood glucose levels in combination with other radiological signs to the prognostication of functional outcomes in patients with spontaneous intracerebral hemorrhage (sICH).
Methods: Consecutive patients with sICH with at least five random plasma glucose measurements and complete radiological data during hospitalization were included. We calculated the average, maximum, minimum, standard deviation, and coefficient of variation of blood glucose levels for each patient. Radiological data, including island, black hole, blend, and satellite signs were collected. Functional outcomes were evaluated using the Barthel index. Unfavorable outcomes were defined as a Barthel index score ≤ 60. Univariate and multivariate analyses were performed to identify independent predictors of unfavorable outcomes.
Results: Two hundred and thirty-eight patients (mean age 58.5, 163 men and 75 women) were included, and 71 had a history of diabetes. Unfavorable outcomes occurred in 107 patients (45.0%) at 3 months. Multivariate logistic regression analysis demonstrated that maximum blood glucose levels (odds ratio, 1.256; 95% confidence interval, 1.124‒1.404; p < 0.001) and island sign (odds ratio, 2.701; 95% confidence interval, 1.322‒5.521; p = 0.006) were independent predictors of unfavorable outcomes in the nondiabetic group. Meanwhile, patients without diabetes who experienced hematoma expansion had higher average (p = 0.036) and maximum blood glucose levels (p = 0.014).
Interpretation: Maximum blood glucose levels and island sign were independently associated with unfavorable outcomes in patients without diabetes, whereas no glycemic variability indices were associated with unfavorable outcomes. Glucose levels influenced hematoma expansion and functional outcomes, particularly in patients without diabetes with sICH. Thus, clinical management of blood glucose levels should be strengthened for patients with sICH with or without a history of diabetes.
Keywords: spontaneous intracerebral hemorrhage, glycemic variability, functional outcomes, island sign, diabetes
Introduction
Spontaneous intracerebral hemorrhage (sICH) accounts for 10–15% of all stroke cases. sICH is associated with higher mortality and worse functional outcomes than other subtypes of stroke.1–3 In contrast to the acute management of subarachnoid hemorrhage and ischemic stroke, effective treatments for sICH are unavailable and outcomes remain poor.4 Hematoma expansion (HE) is known to occur in about 30% patients and associated with poor outcomes after sICH.5 However, adequate treatment and management are still important to improve outcomes and reduce mortality.6 Thus, evaluating the factors impacting clinical outcomes in patients with sICH is important.7
Post-stroke hyperglycemia is a common phenomenon in the acute stroke setting and is associated with unfavorable clinical outcomes.8–10 Moreover, a high random plasma glucose (RPG) level is a potential risk factor for cardiovascular diseases, cardiovascular death, major occlusive vascular disease, major coronary events, ischemic stroke, and intracerebral hemorrhage.11 It has been reported that hyperglycemia after sICH has strong associations with HE and poor functional recovery and high mortality.12 Thus, hyperglycemia management is an important step in the intensive treatment of patients with sICH. However, when strictly focusing on admission hyperglycemia, we might overlook other independent markers of dysglycemia, such as glycemic variability (GV).13–15 GV is defined as the degree of fluctuation in blood glucose levels and correlated with high mortality risk in critically ill patients.13,16 However, the association between GV and unfavorable outcomes in patients with sICH remains unclear.
Computed tomography (CT) is a routine examination for patients with sICH. Previous studies demonstrated that radiological signs are easy tools for predicting hematoma expansion17,18 and unfavorable outcomes.5,19 For example, the island sign (IS), a radiological sign for early HE prediction, was proposed to reflect multifocal small bleeding sites surrounding the main hematoma position.20 A previous study found that elevated blood glucose levels are associated with IS and can be used to predict early HE.21 However, the associations between blood glucose fluctuations, radiological signs, and functional outcomes remain unclear. This study aimed to explore the contribution of acute phase blood glucose levels in combination with other radiological signs to the prognostication of functional outcomes in patients with sICH.
Methods
Study Population
This study was approved by the Medical Ethics Committee of the First Affiliated Hospital of Wenzhou Medical University and was conducted in accordance with the 1964 Helsinki Declaration and its later amendments or comparable ethical standards. This study of patient data is confidential. Informed consent was waived by our Institutional Review Board because of the retrospective nature of our study.
We scanned the clinical and radiological data of patients with sICH at our hospital between July 2018 and December 2020. Patients (>18 years old) with baseline CT scans within 6 h of sICH symptom onset, follow-up CT images within 72 h, and at least five RPG measurements during hospitalization were included (Figure 1).
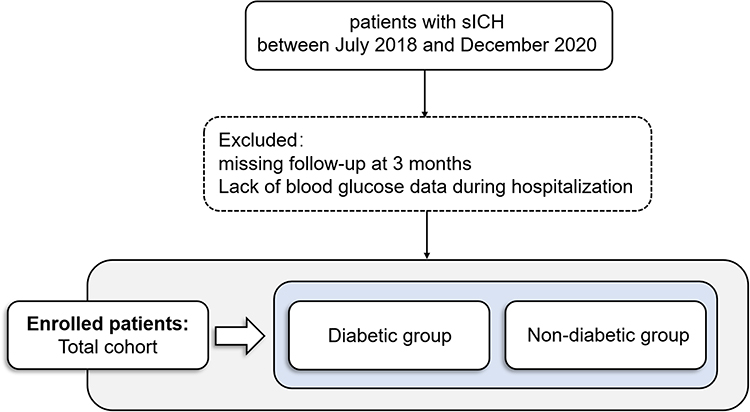 |
Figure 1 Patient selection flowchart. |
The exclusion criteria were as follows: (a) secondary sICH due to aneurysm rupture, arteriovenous malformation, neoplasm, hemorrhagic infarction, or traumatic brain injury; (b) primary intraventricular hemorrhage; (c) surgery or interventional therapy before follow-up CT; (d) lack of hospitalization or blood glucose data during hospitalization; and (e) missing follow-up at 3 months.
Clinical data such as age, sex, history of hypertension (a diagnosis of hypertension previously made by another physician or use of antihypertensive drugs), history of hyperlipidemia (a diagnosis of hyperlipidemia previously made by another physician or use of cholesterol-lowering drugs), cigarette smoking (previous smoker or current smoker), and drinking (previous smoker or current smoker) were collected.22,23
Radiology Analysis
The images were acquired through the picture archiving and communication system and saved in digital imaging and communications in medicine format for further analysis. Hematoma volume was calculated using three-dimensional reconstructions of the hematoma in multiple consecutive sections (hematoma volume was measured using 3D Slicer software, version 4.10.2; http://www.slicer.org).24 HE was defined as an absolute increase in hematoma volume > 6 mL or a proportional growth of hematoma volume > 33% between the initial and follow-up CT scans.25,26
CT markers, including IS, black hole sign (BHS), blend sign (BS), and satellite sign (SS), were collected according to definitions from previous studies (Figure 2). The IS was defined as (a) ≥ 3 scattered small hematomas that were separated from the main hematoma or (b) ≥ 4 small hematomas, some or all of which may connect with the main hematoma.20 The BHS was defined as a well-defined and relatively hypoattenuating area (black hole) encapsulated within the hyperattenuating hematoma area. The black hole could be round, oval, or rod-like but could not connect with the adjacent brain tissue. A hematoma should have at least 28 Hounsfield unit (HU) differences between the two density regions.27 The BS was defined as the presence of both relatively hyperattenuating and hypoattenuating areas in the hematoma, with a clear boundary between them and a CT value difference of > 18 HU.28 The SS was defined as a minor hemorrhage (maximal transverse diameter < 10 mm) that was completely separated from the main hemorrhage in at least a single slice. The shortest distance between the satellite and main hemorrhage was 1–20 mm.29 All CT markers were manually counted and independently evaluated by two radiologists who were blinded to the patients’ clinical information. Disagreements were resolved through consensus.
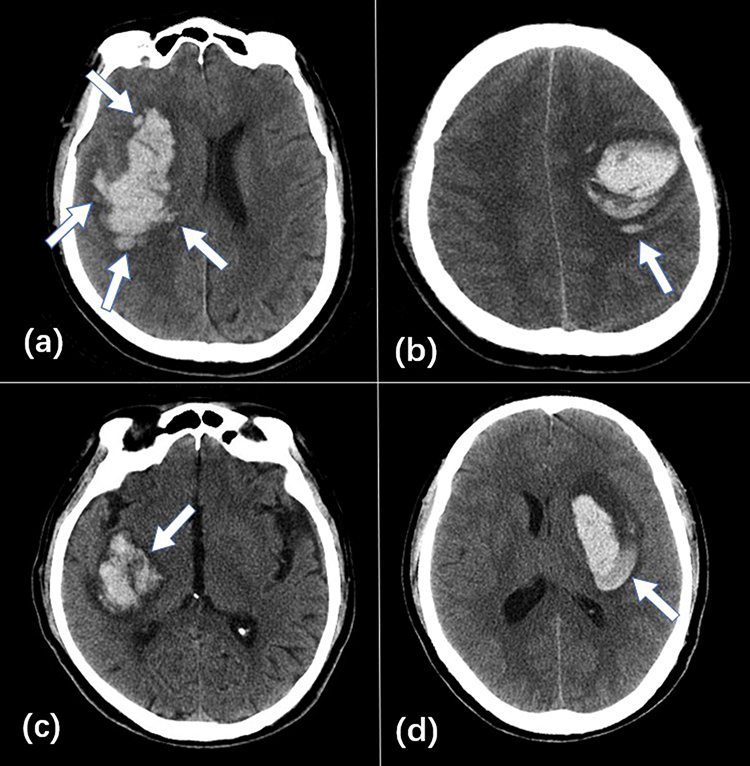 |
Figure 2 Illustrations of CT with island sign (a), satellite sign (b), black hole sign (c), and blend sign (d) from different patients. |
Hyperglycemia and Diabetes Definition
During interviews, all patients were asked whether they had diabetes mellitus (DM). The presence of DM was extracted from the medical chart. Patients without indication for an existing DM either during the interview or in the medical chart were classified as the nondiabetic group. All other patients were classified as the diabetic group.30
All blood glucose data were acquired by daily bedside fingertip and/or venous collection during hospitalization. Every patient underwent at least five blood glucose measurements. During hospitalization, 78.72 and 41.39 blood glucose measurements were taken on average per patient in the diabetic and nondiabetic groups, respectively.
Average blood glucose levels (GluAve), maximum blood glucose levels (GluMax), and minimum blood glucose levels (GluMin) were calculated from the RPG measurements collected during hospitalization. The standard deviation of blood glucose levels (GluSD), coefficient of variation of blood glucose levels (GluCV; GluCV = GluSD / GluAve × 100%), and range of glycemic fluctuation (GluRF; GluRF = GluMax − GluMin) were used to reflect the variability of each patient’s glucose level.31 We categorized the GV indices into groups by median to investigate the association between GV and functional outcome.
Outcomes Assessment
The functional outcomes were activities of daily living at 3 months based on telephone assessments. A previous study reported that the Barthel Index (BI) is reliable during telephone assessments.32 Therefore, we applied the BI to assess activities of daily living. The BI includes 10 items: bathing, toilet action, bowel continence, bladder continence, dressing, feeding, grooming, walking on a surface, going up and down stairs, and moving from a chair to a bed or from a bed to a chair.33 The BI score ranges from 0 (total dependence or death) to 100 points (complete independence). According to previous definitions,33,34 a BI score of ≤ 60 was considered an unfavorable outcome.
Statistical Analysis
Continuous variables are presented as mean ± standard deviation (normal distribution) and median with interquartile range (skewed distribution). Categorical variables are presented as counts with percentages. Continuous variables were compared using the Student’s t-test or Mann–Whitney U-test. Categorical variables were compared using the chi-squared (χ2) test. Statistically significant GV indices and radiological signs were then introduced into a logistic regression analysis. The optimal independent variables of unfavorable outcomes were selected using a logistic regression analysis with forward stepwise selection. Model performance was assessed using the area under the receiver operating characteristic (ROC) curve (AUC) with 95% CI, sensitivity, and specificity. Delong’s test was performed to compare the differences between the ROC curves.35 Statistical analyses were conducted using SPSS (version 25.0; IBM Corp., Armonk, NY, USA). Statistical significance was set at p < 0.05. A nomogram was formulated based on the optimal prediction model. A calibration curve was plotted to graphically measure the calibration of the nomogram. The consistency of CT markers was evaluated by Kappa statistics after a re-evaluation of 50 cases by a third rater.
Result
Study Population
A total of 238 patients (163 [68.5%] men and 75 [31.5%] women) were included in our study, and 71 (29.8%) had a history of DM. Among the 238 patients, 45 (18.9%) experienced early HE. At 3 months, 131 (55.0%) patients were functionally independent (BI score > 60) and 107 (45.0%) patients presented functional dependence (BI score ≤ 60). The main clinical characteristics and radiological findings are presented in Table 1. Regarding the consistency of CT markers, we observed excellent agreement with kappa values of 0.77 for IS, 0.80 for SS, 0.92 for BHS, and 0.90 for BS (all p < 0.001).
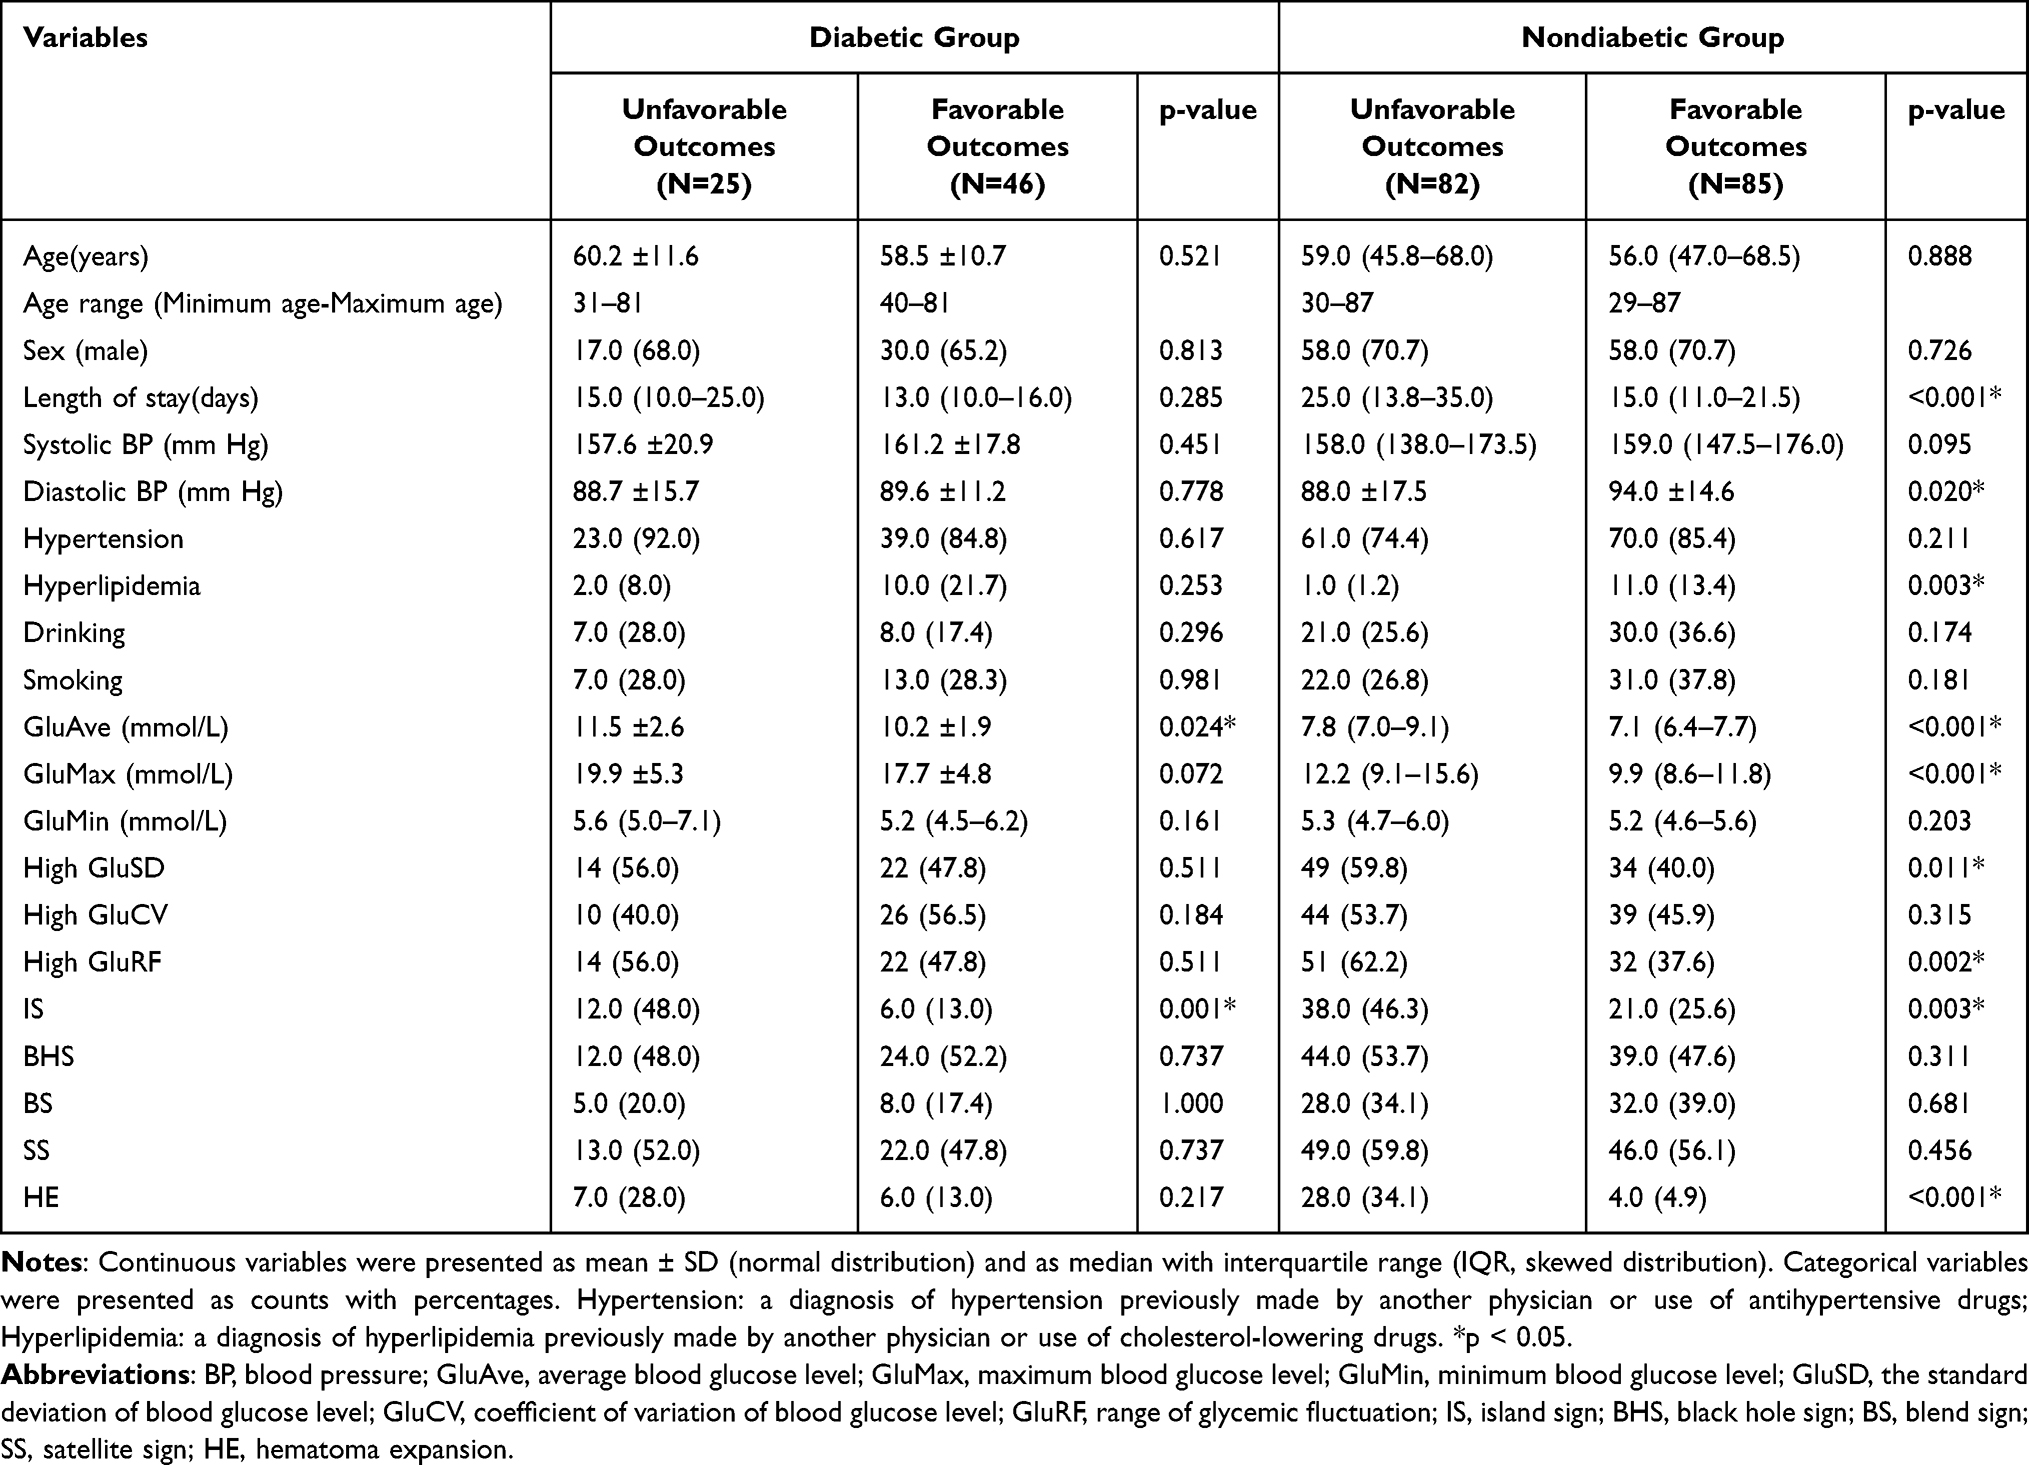 |
Table 1 Comparison of Clinical Characteristics Between Unfavorable and Favorable Outcomes Groups |
Patient Clinical Characteristics
In the nondiabetic group, patients without hyperlipidemia with longer hospital stays, higher GluAve, higher GluMax, higher GluRF, higher GluSD, and IS were more likely to have unfavorable outcomes (all p < 0.05; Table 1). Multivariate logistic regression analysis showed that GluMax (odds ratio [OR], 1.256; 95% confidence interval [95% CI], 1.124‒1.404; p < 0.001) and IS (OR, 2.701; 95% CI, 1.322‒5.521; p = 0.006) were independent predictors of unfavorable outcomes. Additionally, patients who experienced HE had higher GluAve (p = 0.036) and GluMax (p = 0.014; Figure 3).
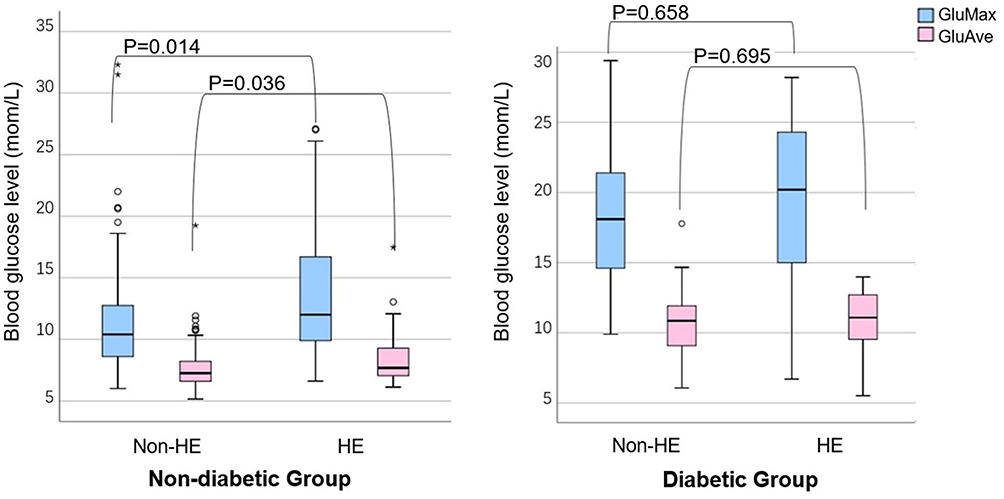 |
Figure 3 Box plots of blood glucose levels between the non-HE and HE. *In the figure is the extreme value in the data set. Abbreviations: HE, hematoma expansion; GluMax, maximum blood glucose level; GluAve, average blood glucose level. |
In the diabetic group, IS (OR, 5.999; 95% CI, 1.795‒20.047; p = 0.004) and GluAve (OR, 1.294; 95% CI, 1.001‒1.673; p = 0.049) were independent predictors of unfavorable functional outcomes (Table 2). Moreover, GluAve and GluMax levels were not significantly different between patients with and without HE (all p > 0.05; Figure 3).
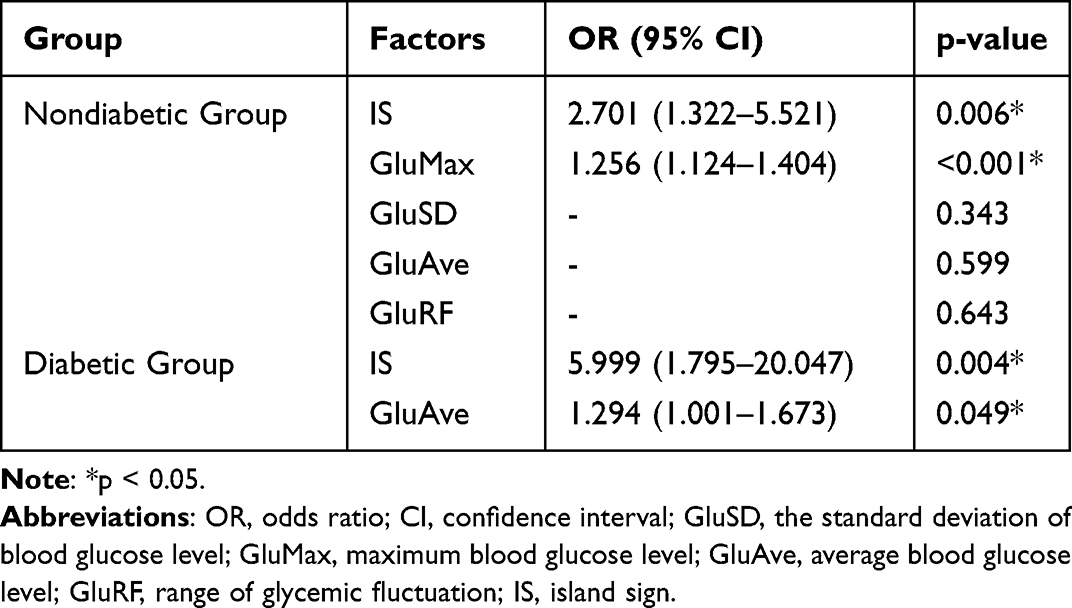 |
Table 2 Multivariate Logistic Regression Analysis of Predicting Poor Functional Outcomes |
Model Performance
In the nondiabetic group, GluMax and IS were independent risk factors for unfavorable functional outcomes. Therefore, we combined IS and GluMax as a new biomarker (named IS–GluMax) to predict 3-month unfavorable functional outcomes of patients with sICH. IS–GluMax showed an AUC of 0.731, sensitivity of 0.600, and specificity of 0.798 for predicting unfavorable functional outcomes. IS–GluMax had a higher predictive power than IS alone (AUC [95% CI], IS–GluMax vs IS: 0.731 [0.653‒0.809] vs 0.613 [0.526‒0.699]; p = 0.001; Table 3 and Figure 4).
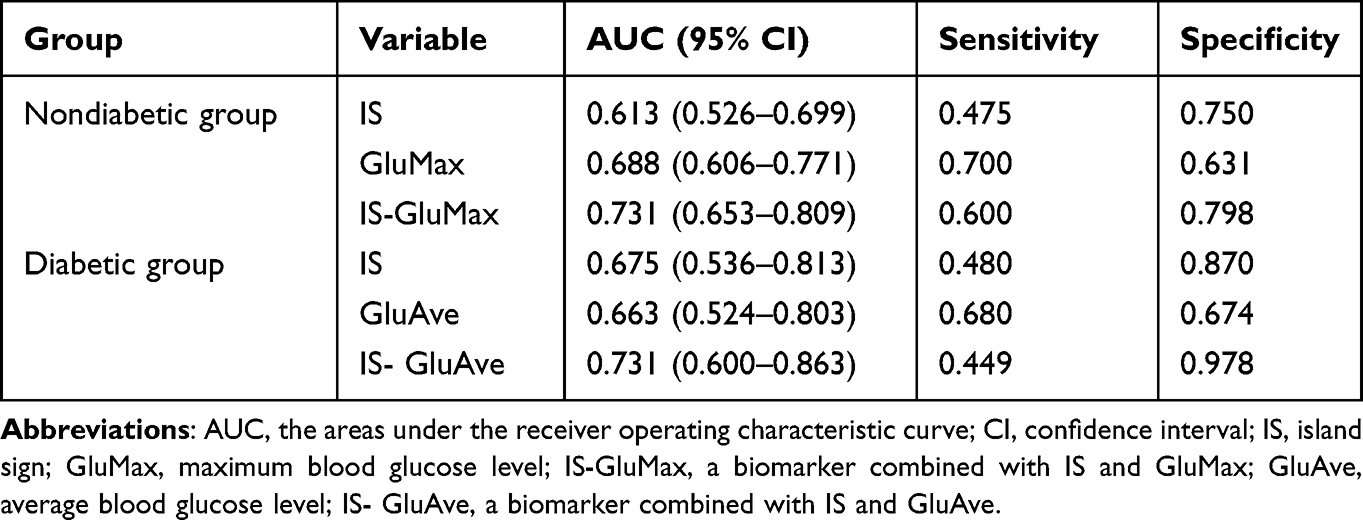 |
Table 3 Predictive Performance of the Different Predictors |
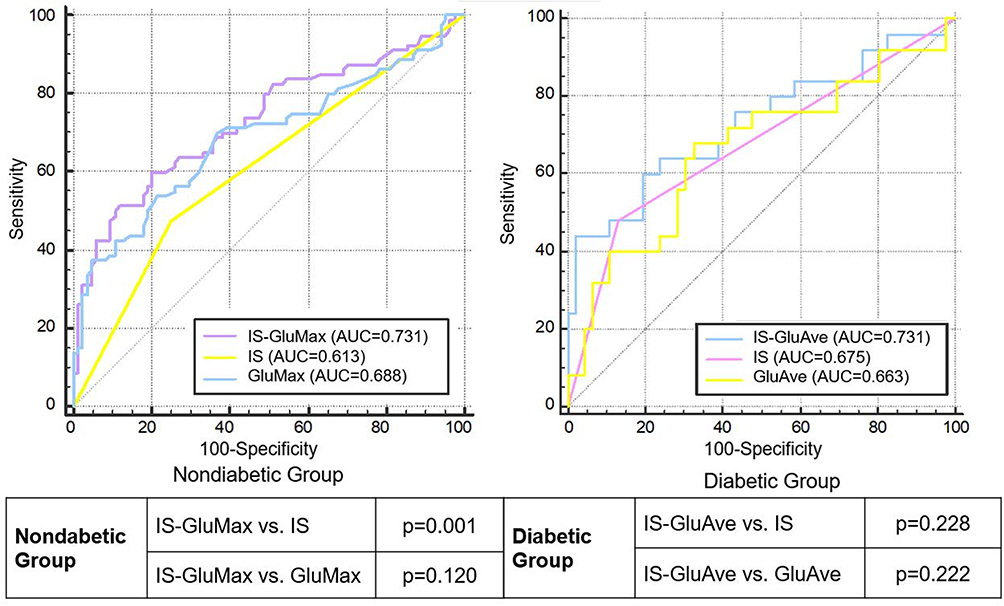 |
Figure 4 Comparisons of the receiver operating characteristic curve (ROC) between the different predictors in predicting 3-month unfavorable functional outcomes. Abbreviations: IS, island sign; GluMax, maximum blood glucose level; IS–GluMax, a biomarker combined with IS and GluMax; GluAve, average blood glucose level; IS–GluAve, a biomarker combined with IS and GluAve. |
In the diabetic group, IS and GluAve levels were introduced into the logistic regression model. We combined IS and GluAve as a new biomarker to predict 3-month unfavorable functional outcomes. IS–GluAve did not show a significantly higher predictive power than other single predictors (AUC [95% CI], IS–GluAve vs IS: 0.731 [0.600‒0.863] vs 0.675 [0.536‒0.813], p = 0.228; IS–GluAve vs GluAve: 0.731 [0.600‒0.863] vs 0.663 [0.524‒0.803], p = 0.222; Table 3 and Figure 4).
Based on the logistic regression model, a visualization nomogram was established for the risk estimation of unfavorable functional outcomes in the nondiabetic group (Figure 5a). As demonstrated in the nomogram, in comparison with IS, GluMax comprised most of the scoring system. This suggests a predominant role of GluMax in the prediction of unfavorable outcomes. The calibration curves graphically showed a favorable agreement on the probability of unfavorable outcomes between the nomogram estimation and actual observation (Figure 5b).
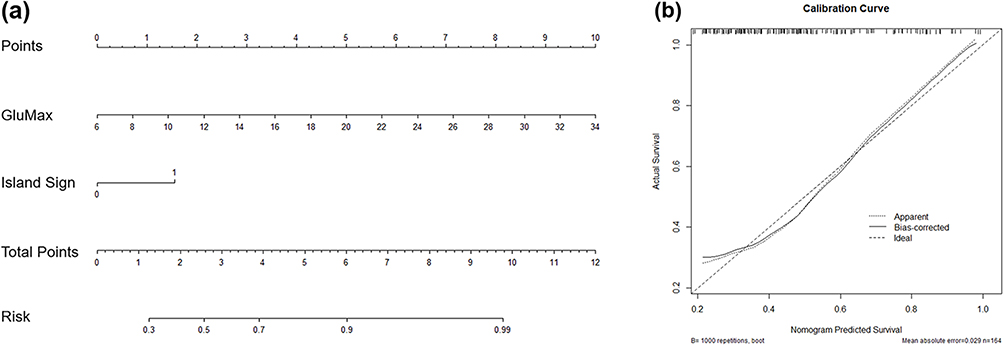 |
Figure 5 (a) A IS–GluMax nomogram predicting the probability of unfavorable functional outcomes based on the logistic regression model. Two variables were incorporated into the nomogram, namely IS and GluMax. To use this nomogram, we should first find the position of each variable on the corresponding axis, and then draw a vertical line to the point axis according to the actual value of each variable. Afterwards, add the value of points from all of the variables and draw a vertical line from the total point axis to determine the risk of unfavorable functional outcome at the lowest line of the nomogram. (b) Calibration of the nomogram for unfavorable functional outcome prediction. The dashed line was a reference line indicating an optimal nomogram. The dotted line represented the actual performance of the IS–GluMax. The dashed and dotted lines exhibited good coincidence degree. Abbreviations: IS, island sign; GluMax, maximum blood glucose level. |
Discussion
In this study, we describe an association between GV and functional outcomes in patients with sICH. Patients without higher GluAve, higher GluMax, higher GluRF, higher GluSD, and IS were more likely to have unfavorable outcomes in the nondiabetic group. This study demonstrates that GluMax was an independent predictor of unfavorable outcomes in patients without a history of DM. Furthermore, GluAve was an independent predictor of unfavorable outcomes in patients with diabetes. However, no GV indices (including GluSD, GluCV, and GluRF) were independent predictors of unfavorable outcomes in the whole study population (regardless of with and without a history of DM). Moreover, IS was an independent predictor of unfavorable functional outcomes in the entire study population. To the best of our knowledge, this study is the first to describe the association between GV, radiological signs, and functional outcomes in patients with sICH.
In the nondiabetic group, patients with a higher GluMax level were more likely to have unfavorable functional outcomes. This might be because nondiabetic patients are more sensitive to sudden stress-induced hyperglycemia (SIH). SIH is defined as hyperglycemia that resolves spontaneously after the dissipation of an acute illness, such as stroke. Hyperglycemia in nondiabetic patients is more likely to be caused by changes in homeostasis and neuroendocrine derangements.36 Previous studies showed that SIH can result in unfavorable outcomes and higher mortality.36,37 Compared to patients with diabetes, those without diabetes may be exposed to greater stress. A previous study indicated that SIH confers higher mortality than diabetic hyperglycemia.38 Recent reports have shown that either moderate or severe hyperglycemia increases the risk of mortality or disability in patients without diabetes with intracerebral hemorrhage,39,40 which is in accordance with our results.
GluSD was also associated with functional improvement; however, after adjusting for confounders, including other blood glucose indies like GluMax, GluAve, etc., this association was not statistically significant. A previous study showed that no GV index was related to 3-month clinical outcomes, pointing to a more short-term impact of GV on the early post-stroke neurological status.41
In addition, IS was proposed to reflect multifocal small bleeding around the main hematoma, and a previous study considered this symptom to be a novel and useful imaging feature to predict early HE and unfavorable outcomes in patients with sICH.20 We also found that patients with HE may have higher blood glucose levels. Results of animal models indicated that hyperglycemia can accelerate blood–brain barrier damage, impair microvascular integrity of adjacent vessels surrounding the initial bleeding, and promote continuous bleeding and HE.42 Similar study in ischemic stroke has also conducted to investigate GV and other outcomes, such as mortality.43 A previous study has also shown that the SIH ratio is a reliable predictor of early HE.33 Both hyperglycemia and IS can lead to HE and have similar progressions.
Thus, we further combined IS and GluMax to predict 3-month unfavorable functional outcomes in patients with sICH without DM. We found that the predictive power of IS–GluMax was better than that of the single radiological predictors. The IS–GluMax can identify patients with a high risk of unfavorable outcomes using a noninvasive method. Accordingly, it can help clinicians evaluate a patient’s condition and adjust treatments over time.
In the diabetic group, a high GluAve level was a risk factor for unfavorable outcomes. A relevant study has shown that hyperglycemia substantially affects neurological functional recovery and prognosis in sICH, regardless of whether hyperglycemia is caused by diabetes or not.44 GluAve was more likely to have persistent chronic blood glucose levels than GluMax. A relevant study also showed that DM can be characterized by chronic sustained hyperglycemia, and that the influence of a stress reaction may not be severe.36 A possible reason for this is the different pathophysiological mechanisms of hyperglycemia in patients with and without diabetes. In patients without diabetes, SIH is the body’s stress response. This stress response may induce an inflammatory response, impair the integrity of blood vessels, and damage neuronal mitochondria leading to secondary brain injury and HE.37 With timely and appropriate treatment of the primary disease, the effects of stress reactions, such as the release of catecholamines, glucagon, and cortisol, may be effectively reduced; thus, possibly decreasing the SIH level.45 By contrast, hyperglycemia in patients with diabetes mainly results from a combination of insulin resistance and/or B-cell secretory defects and may take years to develop.46 Evidence suggests that chronic hyperglycemia in patients with diabetes causes the body to form a self--protection mechanism, preferentially down--regulating glucose transporters (GLUT--1 and GLUT--3), allowing glucose to enter cells independently of insulin, thus reducing the acute fluctuation of glucose concentration and reducing endothelial cell apoptosis.47 This phenomenon may be a potential reason for the better outcomes in patients with diabetes than in patients without diabetes.
This study has several limitations. First, it was a retrospective study. Glucose measurements were collected from routine daily clinical practice rather than hourly continuous glucose monitoring data. Hence, a future study with continuous glucose monitoring is required. Second, due to the retrospective data collection, the type of DM and its treatment could not be considered in our study. Recently, insulin has been reported to have a neuroprotective effect in acute neurological damage.48 Insulin is often used to control the blood glucose levels in patients with diabetes and may directly influence the outcomes. Therefore, further studies are required to confirm the correlation between treatment, GV, the type of DM, and unfavorable outcomes. Third, the primary outcome of this study was functional outcomes. However, mortality, survival rate and recurrence rate are equally important for patients with sICH. It should be further analyzed in future larger prospective studies.
Conclusions
In patients without diabetes, GluMax was an independent predictor of unfavorable functional outcomes. In patients with diabetes, GluAve was independently associated with unfavorable functional outcomes. Moreover, IS was an independent predictor of unfavorable functional outcomes in the whole study population (regardless of with and without a history of DM). Patients without diabetes with HE may have higher blood glucose levels on admission.
In conclusion, exposure to hyperglycemia was associated with HE and may result in unfavorable outcomes in patients with sICH, particularly in those without diabetes. Thus, clinical management of blood glucose levels should be strengthened for patients with sICH with or without a history of DM. How acute phase blood glucose contributes to unfavorable outcomes is needed to be understood in patients with sICH. Further studies will be needed to explore the association between blood glucose mechanisms and management programs on the outcomes of patients with sICH.
Acknowledgments
This study was supported by the Wenzhou Major Program of Science and Technology Innovation (Grant No. ZY2020012), the Key Laboratory of Intelligent Medical Imaging of Wenzhou (No. 2021HZSY0057) and the Key Laboratory of Novel Nuclide Technologies on Precision Diagnosis and Treatment & clinical Transformation of Wenzhou City (No. 2023HZSY0012).
Disclosure
The authors declare that the research was conducted in the absence of any commercial or financial relationships that could be construed as a potential conflict of interest.
References
1. Qureshi AI, Mendelow AD, Hanley DF. Intracerebral haemorrhage. Lancet. 2009;373(9675):1632–1644. doi:10.1016/S0140-6736(09)60371-8
2. Gross BA, Jankowitz BT, Friedlander RM. Cerebral Intraparenchymal Hemorrhage: a Review. JAMA. 2019;321(13):1295–1303. doi:10.1001/jama.2019.2413
3. Qureshi AI, Tuhrim S, Broderick JP, Batjer HH, Hondo H, Hanley DF. Spontaneous intracerebral hemorrhage. N Engl J Med. 2001;344(19):1450–1460. doi:10.1056/NEJM200105103441907
4. Mayer SA. Ultra-early hemostatic therapy for intracerebral hemorrhage. Stroke. 2003;34(1):224–229. doi:10.1161/01.str.0000046458.67968.e4
5. Chang GY, Davis SM, Broderick J, et al. Hematoma growth is a determinant of mortality and poor outcome after intracerebral hemorrhage. Neurology. 2007;68(6):471–472. doi:10.1212/01.wnl.0000256290.15120.37
6. Morgenstern LB, Zahuranec DB, Sanchez BN, et al. Full medical support for intracerebral hemorrhage. Neurology. 2015;84(17):1739–1744. doi:10.1212/wnl.0000000000001525
7. Serrano E, Lopez-Rueda A, Moreno J, et al. The new hematoma maturity score is highly associated with poor clinical outcome in spontaneous intracerebral hemorrhage. Eur Radiol. 2022;32(1):290–299. doi:10.1007/s00330-021-08085-4
8. Kimura K, Iguchi Y, Inoue T, et al. Hyperglycemia independently increases the risk of early death in acute spontaneous intracerebral hemorrhage. J Neurol Sci. 2007;255(1–2):90–94. doi:10.1016/j.jns.2007.02.005
9. Capes SE, Hunt D, Malmberg K, Pathak P, Gerstein HC. Stress hyperglycemia and prognosis of stroke in nondiabetic and diabetic patients: a systematic overview. Stroke. 2001;32(10):2426–2432. doi:10.1161/hs1001.096194
10. Fogelholm R, Murros K, Rissanen A, Avikainen S. Admission blood glucose and short term survival in primary intracerebral haemorrhage: a population based study. J Neurol Neurosurg Psychiatry. 2005;76(3):349–353. doi:10.1136/jnnp.2003.034819
11. Bragg F, Li L, Bennett D, et al. Association of random plasma glucose levels with the risk for cardiovascular disease among Chinese adults without known diabetes. JAMA Cardiol. 2016;1(7):813–823. doi:10.1001/jamacardio.2016.1702
12. Saxena A, Anderson CS, Wang X, et al. Prognostic significance of hyperglycemia in acute intracerebral hemorrhage: the INTERACT2 study. Stroke. 2016;47(3):682–688. doi:10.1161/strokeaha.115.011627
13. Krinsley JS. Glycemic variability: a strong independent predictor of mortality in critically ill patients. Crit Care Med. 2008;36(11):3008–3013. doi:10.1097/CCM.0b013e31818b38d2
14. Monnier L, Colette C, Owens DR. Glycemic variability: the third component of the dysglycemia in diabetes. Is it important? How to measure it? J Diabetes Sci Technol. 2008;2(6):1094–1100. doi:10.1177/193229680800200618
15. Kim YS, Kim C, Jung KH, et al. Range of glucose as a glycemic variability and 3-month outcome in diabetic patients with acute ischemic stroke. PLoS One. 2017;12(9):e0183894. doi:10.1371/journal.pone.0183894
16. Wada S, Yoshimura S, Inoue M, et al. Outcome prediction in acute stroke patients by continuous glucose monitoring. J Am Heart Assoc. 2018;7(8). doi:10.1161/JAHA.118.008744
17. Boulouis G, Morotti A, Charidimou A, Dowlatshahi D, Goldstein JN. Noncontrast computed tomography markers of intracerebral hemorrhage expansion. Stroke. 2017;48(4):1120–1125. doi:10.1161/STROKEAHA.116.015062
18. Yang WS, Zhang SQ, Shen YQ, et al. Noncontrast computed tomography markers as predictors of revised hematoma expansion in acute intracerebral hemorrhage. J Am Heart Assoc. 2021;10(3):e018248. doi:10.1161/JAHA.120.018248
19. Davis SM, Broderick J, Hennerici M, et al. Hematoma growth is a determinant of mortality and poor outcome after intracerebral hemorrhage. Neurology. 2006;66(8):1175–1181. doi:10.1212/01.wnl.0000208408.98482.99
20. Li Q, Liu QJ, Yang WS, et al. Island sign: an imaging predictor for early hematoma expansion and poor outcome in patients with intracerebral hemorrhage. Stroke. 2017;48(11):3019–3025. doi:10.1161/STROKEAHA.117.017985
21. Zhang F, Li H, Qian J, et al. hyperglycemia is associated with island sign in patients with intracerebral hemorrhage. World Neurosurg. 2018;119:e703–e709. doi:10.1016/j.wneu.2018.07.251
22. Mahemuti N, Jing X, Zhang N, et al. Association between systemic immunity-inflammation index and hyperlipidemia: a population-based study from the NHANES (2015–2020). Nutrients. 2023;15(5). doi:10.3390/nu15051177
23. Zhu D, Chen Y, Zheng K, et al. Classifying ruptured middle cerebral artery aneurysms with a machine learning based, radiomics-morphological model: a multicentral study. Frontiers in Neuroscience. 2021;15. doi:10.3389/fnins.2021.721268
24. Zhu D, Zhang M, Li Q, et al. Can perihaematomal radiomics features predict haematoma expansion? Clin Radiol. 2021;76(8):629e1–629 e9. doi:10.1016/j.crad.2021.03.003
25. Dowlatshahi D, Demchuk AM, Flaherty ML, et al. Defining hematoma expansion in intracerebral hemorrhage: relationship with patient outcomes. Neurology. 2011;76(14):1238–1244. doi:10.1212/WNL.0b013e3182143317
26. Brouwers HB, Greenberg SM. Hematoma expansion following acute intracerebral hemorrhage. Cerebrovasc Dis. 2013;35(3):195–201. doi:10.1159/000346599
27. Li Q, Zhang G, Xiong X, et al. Black hole sign: novel imaging marker that predicts hematoma growth in patients with intracerebral hemorrhage. Stroke. 2016;47(7):1777–1781. doi:10.1161/STROKEAHA.116.013186
28. Li Q, Zhang G, Huang YJ, et al. Blend sign on computed tomography: novel and reliable predictor for early hematoma growth in patients with intracerebral hemorrhage. Stroke. 2015;46(8):2119–2123. doi:10.1161/STROKEAHA.115.009185
29. Shimoda Y, Ohtomo S, Arai H, Okada K, Tominaga T. Satellite sign: a poor outcome predictor in intracerebral hemorrhage. Cerebrovasc Dis. 2017;44(3–4):105–112. doi:10.1159/000477179
30. Schmitz T, Freuer D, Harmel E, et al. Prognostic value of stress hyperglycemia ratio on short- and long-term mortality after acute myocardial infarction. Acta Diabetol. 2022;59(8):1019–1029. doi:10.1007/s00592-022-01893-0
31. Okazaki T, Hifumi T, Kawakita K, et al. Blood glucose variability: a strong independent predictor of neurological outcomes in aneurysmal subarachnoid hemorrhage. J Intensive Care Med. 2018;33(3):189–195. doi:10.1177/0885066616669328
32. Kasner SE. Clinical interpretation and use of stroke scales. Lancet Neurol. 2006;5(7):603–612. doi:10.1016/S1474-4422(06)70495-1
33. Mahoney FI, Barthel DW. Functional evaluation: the Barthel index. Md State Med J. 1965;14:61–65.
34. Jing X, Tan L, Fu H, Yang L, Yang M. Associations of ADL disability with trunk muscle mass and muscle quality indicators measured by opportunistic chest computed tomography imaging among older inpatients. Front Med (Lausanne). 2021;8:743698. doi:10.3389/fmed.2021.743698
35. DeLong ER, DeLong DM, Clarke-Pearson DL. Comparing the areas under two or more correlated receiver operating characteristic curves: a nonparametric approach. Biometrics. 1988;44(3):837–845. doi:10.2307/2531595
36. Wu YC, Ding Z, Wu J, et al. Increased glycemic variability associated with a poor 30-day functional outcome in acute intracerebral hemorrhage. J Neurosurg. 2018;129(4):861–869. doi:10.3171/2017.4.JNS162238
37. Chu H, Huang C, Tang Y, Dong Q, Guo Q. The stress hyperglycemia ratio predicts early hematoma expansion and poor outcomes in patients with spontaneous intracerebral hemorrhage. Ther Adv Neurol Disord. 2022;15:17562864211070681. doi:10.1177/17562864211070681
38. Kerby JD, Griffin RL, MacLennan P, Rue LW. Stress-induced hyperglycemia, not diabetic hyperglycemia, is associated with higher mortality in trauma. Ann Surg. 2012;256(3):446–452. doi:10.1097/SLA.0b013e3182654549
39. Qureshi AI, Huang W, Lobanova I, et al. Effect of moderate and severe persistent hyperglycemia on outcomes in patients with intracerebral hemorrhage. Stroke. 2022;53(4):1226–1234. doi:10.1161/STROKEAHA.121.034928
40. Jin C, Li G, Rexrode KM, et al. Prospective study of fasting blood glucose and intracerebral hemorrhagic risk. Stroke. 2018;49(1):27–33. doi:10.1161/STROKEAHA.117.019189
41. Palaiodimou L, Lioutas VA, Lambadiari V, et al. Glycemic variability of acute stroke patients and clinical outcomes: a continuous glucose monitoring study. Ther Adv Neurol Disord. 2021;14:17562864211045876. doi:10.1177/17562864211045876
42. Liu J, Gao BB, Clermont AC, et al. Hyperglycemia-induced cerebral hematoma expansion is mediated by plasma kallikrein. Nat Med. 2011;17(2):206–210. doi:10.1038/nm.2295
43. Chen Y, Zhou S, Yang S, et al. Developing and predicting of early mortality after endovascular thrombectomy in patients with acute ischemic stroke. Frontiers in Neuroscience. 2022;16. doi:10.3389/fnins.2022.1034472
44. Freire AX, Bridges L, Umpierrez GE, Kuhl D, Kitabchi AE. Admission hyperglycemia and other risk factors as predictors of hospital mortality in a medical ICU population. Chest. 2005;128(5):3109–3116. doi:10.1378/chest.128.5.3109
45. Dungan KM, Braithwaite SS, Preiser JC. Stress hyperglycaemia. Lancet. 2009;373(9677):1798–1807. doi:10.1016/S0140-6736(09)60553-5
46. Brownlee M. The pathobiology of diabetic complications: a unifying mechanism. Diabetes. 2005;54(6):1615–1625. doi:10.2337/diabetes.54.6.1615
47. Chen S, Wan Y, Guo H, et al. Diabetic and stress-induced hyperglycemia in spontaneous intracerebral hemorrhage: a multicenter prospective cohort (CHEERY) study. CNS Neuroscience & Therapeutics. 2022. doi:10.1111/cns.14033
48. Duarte AI, Moreira PI, Oliveira CR. Insulin in central nervous system: more than just a peripheral hormone. J Aging Res. 2012;2012:384017. doi:10.1155/2012/384017
 © 2023 The Author(s). This work is published and licensed by Dove Medical Press Limited. The full terms of this license are available at https://www.dovepress.com/terms.php and incorporate the Creative Commons Attribution - Non Commercial (unported, v3.0) License.
By accessing the work you hereby accept the Terms. Non-commercial uses of the work are permitted without any further permission from Dove Medical Press Limited, provided the work is properly attributed. For permission for commercial use of this work, please see paragraphs 4.2 and 5 of our Terms.
© 2023 The Author(s). This work is published and licensed by Dove Medical Press Limited. The full terms of this license are available at https://www.dovepress.com/terms.php and incorporate the Creative Commons Attribution - Non Commercial (unported, v3.0) License.
By accessing the work you hereby accept the Terms. Non-commercial uses of the work are permitted without any further permission from Dove Medical Press Limited, provided the work is properly attributed. For permission for commercial use of this work, please see paragraphs 4.2 and 5 of our Terms.