Back to Journals » Clinical Optometry » Volume 15
Acuity Comparison Methods via Timed Test-Retest Precision of Matching-Card e-ETDRS Compared to PDI Check in Treated Amblyopes and Superb Normals
Authors Hepler LE, Martin SJ, Fuglseth K, Cuddihee L, Giannulis P ![]() , Arnold RW
, Arnold RW ![]()
Received 20 February 2023
Accepted for publication 26 April 2023
Published 2 May 2023 Volume 2023:15 Pages 81—95
DOI https://doi.org/10.2147/OPTO.S409358
Checked for plagiarism Yes
Review by Single anonymous peer review
Peer reviewer comments 2
Editor who approved publication: Mr Simon Berry
Video abstract of "eETDRS and PDI Check acuity comparison" [ID 409358].
Views: 121
Lucas E Hepler,1 Samuel J Martin,2 Kennedy Fuglseth,1 Laney Cuddihee,3 Peter Giannulis,3 Robert W Arnold3
1College of Osteopathic Medicine, Pacific Northwest University, Yakima, WA, USA; 2School of Medicine, Loma Linda University, Loma Linda, CA, USA; 3Alaska Blind Child Discovery, Alaska Children’s EYE & Strabismus, Anchorage, AK, USA
Correspondence: Robert W Arnold, Alaska Blind Child Discovery, Alaska Children’s EYE & Strabismus, 3500 Latouche #280, Anchorage, AK, 99508, USA, Tel +1907561-1917, Fax +1907563-5373, Email [email protected]
Purpose: Existing and emerging visual acuity methods like dynamic and dichoptic presentation, preferential looking and eye tracking promise to afford better and earlier assessment in children with and without amblyopia so we propose methods needed to easily evaluate and compare their metrics.
Subjects and Methods: Patients older than 8 years with treated amblyopia and superb vision (logMAR − 0.1 to − 0.3) normals performed timed, patched eETDRS with Sloan matching card at 3.00 m and PDI Check dichoptic near rivalry dynamic test to demonstrate test re-Test and compared disparate acuity with intraclass correlation (ICC) and Bland Altman 95% limits of agreement (LOA) to generate a simple method of qualifying acuity test matching.
Results: 26 amblyopic patients and 11 superb-vision normals performed eETDRS retest, PDI Check retest and combined ICC of 0.98, 0.60 and 0.27, respectively, and Bland Altman LOA of 0.24, 2.06 and 2.28 logMAR. The time to test one eye with eETDRS had median (interquartile range; IQR) duration of 280 (205 to 346) seconds, while the PDI Check autostereoscopic dichoptic for both eyes only took 39 (30 to 47) seconds. Optimum ICC and LOA for visual acuity comparison should be > 0.95 and < 0.3 logMAR, whereas “good” ICC and should be 0.75– 0.89 ICC and 1.0– 1.49 logMAR LOA.
Conclusion: Superb vision subjects (logMAR < − 0.1) and treated amblyopic patients confirmed optimum comparable eETDRS, and fair test re-Test PDI Check but suppression on near dichoptic testing confirmed disparity compared to optimized eETDRS distance acuity.
Keywords: visual acuity, Bland Altman, amblyopia, suppression, superior, optimum, correlation, dichoptic
Plain Language Summary
Patients with amblyopia, a pediatric brain-vision disorder, and other superb normal subjects performed two very different visual acuity tests to derive a simple measure of acuity test comparison. Distance, patched state-of-the-art eETDRS acuity with a matching card was compared to near, dynamic, touch screen autostereoscopic dichoptic rivalry visual acuity on the PDI Check game. Test retest showed optimum comparison with eETDRS and fair with PDI Check due to residual suppression in the treated amblyopic patients.
Introduction
This paper does two things: 1) it presents a simple method for comparing visual acuity tests and 2) it reports two very different visual acuity tests on subjects with a wide range of visual acuity. The performance of our comparison method is then used with prominent examples from the literature.
We propose a simple method to compare two different visual acuity tests. Do the visual acuity tests have similar or different median visual acuity scores (ie, the accuracy)? Do the tests perform similarly on individuals with poor visual acuity and also for those with extremely keen visual acuity? How tight is the comparability over a wide range of visual acuity (ie, the precision)? What is the tightest increment of visual acuity level tested? Does one or the other test have a floor or a ceiling? Do the visual acuity tests take the same amount of time? Is the visual acuity different near or far? Can the tests be performed reliably by patients who are very young or suffer from developmental delays?
Why is it important to compare different visual acuity tests? Two tests that lack accuracy yielding very different levels of visual acuity should not be used for defining levels of disease diagnosis or occupational limitations. Tests that lack precision may yield far different results on a subsequent evaluation merely by chance. The other reason for updating methods of acuity test comparison is the emerging technology that can address a critical deficiency in our knowledge of vision. The new technology provides a valid measurement of visual acuity in very young children, especially as it relates to screening, assessment, and treatment of amblyopia. The preeminent study group regarding amblyopia is the Pediatric Eye Disease Investigator Group (PEDIG)1 that currently refuses to perform randomized, controlled studies of amblyopia treatment in children less than age 3 since those younger children cannot reliably perform the enrollment computerized Electronic Visual Acuity (EVA) test.
Amblyopia is a unique brain-vision disorder with respect to the interaction between both eyes. Amblyopia and particularly those cases with a strabismic component are characterized by diminished visual acuity and suppression.2 Certain visual acuity tests capitalize on this combination of visual deficits and may provide practical screening methods, particularly if very young children can reliably participate. Dense forms of amblyopia are also associated with fixation instability.3 Visual acuity binocularly may exceed each eye individually, particularly with nystagmus and high astigmatism.4 Successful treatment of strabismic amblyopia by spectacles,5 patching6 and/or dichoptic therapy7 often results in marked and persistent improvement in the monocular visual acuity of the amblyopic eye, but often with residual central suppression. Surrounding or crowding optotypes tends to make amblyopia screening more sensitive.8 The disparity between vision assessment patched and dichoptic, particularly in patients with suppression, might highlight the physiologic differences in best corrected visual acuity,9 and dichoptic screening may also be very sensitive to the detection of mild-to-moderate strabismic amblyopia.10 Instead of critical line visual acuity screening, such as driver’s license qualification, actual best threshold visual acuity after optimized refraction in some individuals can yield visual acuity far better than 20/20 (logMAR 0.0). Certain prior visual acuity comparisons failed to challenge normal, or superb visual acuity patients to their optimum levels, and indeed, many visual acuity tests have a floor, and ceiling threshold that does not allow optimized performance testing. We sought patients older than 8 years with treated mixed strabismic amblyopia as well as scholar-athlete adults known to have superb visual acuity of logMAR −0.1 or better to provide a wide range for our acuity test comparison.
We need an easy way to compare visual acuity tests – whether they are very similar or vastly disparate such as our choice of two acuity tests. Evidence for our study will come from two markedly different means of testing visual acuity: the gold standard randomized, computer-presented eETDRS compared to a novel near-dynamic forced-choice touch screen near test with monocularity assured by an autostereoscopic screen. We optimized the eETDRS by adding an adhesive patch over the untested eye, and a laminated matching card of the ten Sloan letters to familiarize each subject each time they were tested.
The precise and accurate measurement of visual acuity in children has been challenging,11 with some novel technologies offering hope for improvement. Typically, conventional visual acuity utilizes fixed, determined sized optotypes viewed from a specified distance so they subtend a given angle from the eye, and then the subject conveys their impressions usually by talking, or pointing to a matching card with large, representative optotype figures. Eye tracking can enhance vision assessment in very young children performing forced preferential looking12 as well as vision13 and reading performance in older children.13 Outside of the eye clinic, parents can now screen their children’s vision with printed charts, websites or smartphones14 at home.15 The PEDIG protocol utilizes the surround HOTV optotypes in a computer presentation (EVA; electronic vision assessment) for children under the age of 7 years16 and the electronic ETDRS (Early Treatment of Diabetic Retinopathy Study) electronically presented Sloan optotypes for children aged 7 years and older.17 Children with amblyopia often lose attention with prolonged tests and therefore a balance between time and precision must be chosen; this is partly why PEDIG uses EVA instead of eETDRS for children under age 7.
It is important that various methods of determining visual acuity be uniformly compared.18 Current techniques of comparing visual acuity assessment include correlation to confirm accuracy, such that worse vision on one test matches worse vision on the other. Bland Altman analysis then quantifies the precision or the spread of matched determinations as well as the separation between their average values.19 Once correlation and Bland Altman are done, direct evidence and literature review will result in a simplified grading system for visual acuity test qualitative comparison. The time of testing is often inversely related to the precision. Speed of testing is of the essence of very young children with limited attention span.20
ETDRS tests a range of visual acuity. The initial eETDRS tested fine visual acuity to a level of 20/12.5 (logMAR −0.2),21 while the newer M&S system tests to a level of 20/10 (logMAR −0.3). The poorest level of acuity tested by eETDRS is 20/800 or logMAR 1.6.
We sought to compare acuity testing readings under updated, ideal conditions with state-of-the-art, precise Pediatric Eye Disease Investigator Group (PEDIG) methods and then compare them to markedly different dichoptic acuity in subjects with super vision and those older than 7 years with treated amblyopia but residual suppression. The eETDRS has a reputation for being very slow, while the dynamic presentation and user touch screen of PDI Check can be very quick. Utilizing these examples, we then propose simple methods to quantify visual acuity test comparison.
Methods
This clinical evaluation of a test and literature review was performed by the Alaska Blind Child Discovery (ABCD) with institutional review by Providence Alaska Medical Center in compliance with the Declaration of Helsinki and the Health Insurance Portability and Accountability Act. Written informed consent and assent were obtained. Data (de-identified) can be viewed https://www.abcd-vision.org/references/eETDRS%20PDI%20check%20de-ID.pdf.
Subjects were recruited from two sets of otherwise healthy patients undergoing pediatric ophthalmic examination. One set had treated amblyopia representing the lower range of visual acuity, and the other were student/athletes known to have superb distance visual acuity. A range of best corrected visual acuity from optimum to severe residual strabismic amblyopia was sought; due to the amount of time to perform test retest of eETDRS in pediatric eye clinic, only the vision from the worst eye of the amblyopic patients was included. An exclusion criterion was age less than 7 years which is the traditional cut-off for PEDIG between eETDRS and EVA. Additional exclusion criteria were organic ocular and/or brain disease other than amblyopia or refractive error.
To detect a 0.25 logMAR difference given a mean visual acuity of 0.2 and a standard deviation of 0.3, a sample size of 12 is needed. Bland Altman prefers a sample size between 50 and 100 or more, so we included both eyes from the scholar-athletes with superb, best-corrected distance visual acuity.
Best-corrected visual acuity was determined by spectacles or phoropter. The state-of-the-art ETDRS was optimized to assure monocularity and improve optotype identification. Monocular acuity was insured with an ABCD “No Peeking” patch applied over the non-tested eye. All co-authors participated in clinical testing of some of the patients and normal subjects. A matching card for eETDRS with each of the ten Sloan optotypes in alphabetical order was printed on a laminated sheet of paper and used by each subject. Visual acuity was tested in two different manners: 1) calibrated e-ETDRS (electronic Early Treatment of Diabetic Retinopathy Study) using the Clinical Trial Suite on an M&S device (Miles, Illinois) and 2) near, dynamic rivalry autostereoscopic Landolt-C, 4-way self-selected, forced choice visual acuity on the PDI Check (version 2.1.7 Anchorage, Alaska) game on a Nintendo 3DS development kit. Both devices present random-ordered optotypes so memorization bias is eliminated. The order of testing was randomized between eETDRS and PDI Check, with less than one minute between test and retest. For the treated amblyopic patients, the amblyopic eye had two sequential efforts at eETDRS visual acuity compared to that same amblyopic eye result on PDI Check. The protocol is demonstrated on the video abstract (https://vimeo.com/775417951).
Each subject performed the e-ETDRS in an examination room at 300 cm distance with moderately bright lighting and the computer monitor light meter-adjusted for luminance and millimeter rule optotype size adjusted each time according to manufacturer guidelines. The testing on PDI Check including stereopsis, monocular near visual acuity of each eye, and monocular 3-cone color testing each eye was performed best corrected with bright room lighting with the device 30 cm from the subject’s eyes. For visual acuity, PDI Check presents identical, binocular tiny Landolt C in a “C” configuration in each quadrant of the autostereoscopic upper screen, then the optotype viewed by one eye in one quadrant flips to a “U” configuration and all the optotypes gradually increase uniformly in size from 20/20 to 20/400 over ten seconds. As soon as the subject detects a difference in one quadrant, such as the flipped “U” shape and/or impression of rivalry, then that corresponding quadrant is scored by touching in the lower touch screen on the Nintendo 3DS. The actual detection time is calculated by subtracting a pre-determined lag-time obtained from gross presentation during an orientation phase from the actual time during the testing phase. The time to perform the testing of an eye was recorded. The superior visual acuity of student/athletes was tested in both eyes, while the amblyopic patients had just their amblyopic eye tested.
Visual acuity was converted to logMAR (logarithm of the minimum angle of resolution) format and then analyzed by intraclass Correlation Coefficient (ICC), the Pearson product moment correlation coefficient and Bland Altman analysis. The primary outcome was the 95% limit of agreement (LOA) derived from the lower-limit and upper-limit (range) of the deviation of the difference on Bland Altman with test re-Test for e-ETDRS and for PDI Check near rivalry acuity.
Secondary analyses included time to test, as well as responses for stereopsis, 3-cone color reported as medians and inter-quartile ranges (IQR). In addition, visual acuity by e-ETDRS (3-m distance) and PDI Check (30 cm) acuity are compared utilizing ICC and facilitated by Bland Altman analysis.
We sought a collection of various studies that compare the performance and timing of state-of-the-art PEDIG, other conventional, and emerging pediatric and adult acuity testing, and these are listed with reported or derived correlation and Bland Altman analysis. For this review of compared acuity studies, cycles per degree (CPD) on grating acuity preferential looking can be converted into fractional visual acuity;22 fraction = 0.35 (CPD).
Results
Compared eETDRS distance and PDI Check near visual acuity was performed by 11 normal subjects known for superior athletic vision and 26 patients with treated amblyopia. Ages ranged from 8 years to 64 years (mean ± SD 17 ± 11 years). The racial/ethnic mix was 5 Asian, 2 Black, 19 White, 8 Hispanic, 2 Middle-Eastern, 2 Alaska Native, and 3 Pacific Islanders. Visual acuity ranged from an optimized eETDRS ceiling score of 100 letters (logMAR −0.30) to eETDRS 15 (logMAR 1.40). Table 1 shows median and interquartile ranges for visual acuity and time for monocular eETDRS and bilateral PDI Check in addition to stereopsis and 3-cone color on the PDI Check.
 |
Table 1 The Median and Lower Quartile (IQR1) and Upper Quartile (IQR3) for Visual Acuity, Time of Testing and Stereo and Three-Color Cone on PDI Check Compared to Optimized eETDRS on Calibrated M&S Clinical Trials Suite. 26 Patients Over the Age of 7 Years with Treated Amblyopia and 11 Patients with Super-Vision Were Tested. R Is Right Eye and L Is Left Eye with R1 Indicating First Test Right Eye and L2 Indicating Re-Test Left Eye |
Test re-test analysis was performed between eETDRS at 3.00 m and also PDI Check monocular rivalry dynamic visual acuity at 30 cm. Intra-class Correlation (ICC) between paired monocular assessment is demonstrated in Figure 1 with test-retest eETDRS scoring 0.98, test-retest PDI check scoring 0.60 and PDI Check correlated with eETDRS scoring 0.27.
 |
Figure 1 Regressions for visual acuity in logMAR. Patients with treated amblyopia and scholar athletes with superb vision have first test compared to second. Blue diamonds represent test re-Test for optimized eETDRS with optimal performance and intraclass correlation coefficient (ICC) of 0.98. Green circles represent PDI Check near dynamic rivalry autostereoscopic monocular visual acuity/suppression test re-Test with ICC 0.65. The Orange squares show PDI Check near compared to eETDRS distance markedly different visual acuity tests with much poorer ICC of 0.32. |
A Bland-Altman analysis showing the 95% limits of agreement for visual acuity comparisons is shown in Figure 2. The test-retest with distance optimized eETDRS of our amblyopic patients and scholar athletes had optimal performance and a 95% level of agreement of 0.4 logMAR. The test retest for PDI Check had limits of agreement of 2.06, while PDI Check matched against eETDRS had a wide 95% limit of agreement of 2.26 logMAR due to the vast difference by which each test estimates visual acuity in the presence of suppression.
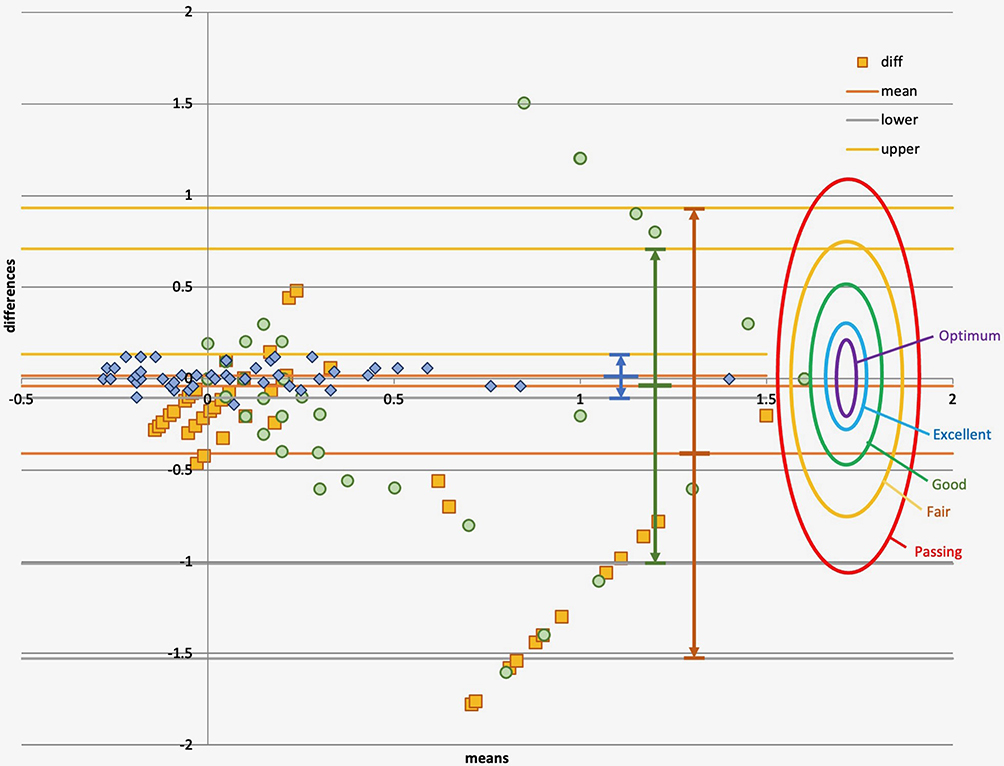 |
Figure 2 Bland Altman Analysis for logMAR visual acuity. Subjects were 26 treated amblyopic patients with suppression and 11 student athletes with superior vision. Blue diamonds represent “Optimum” test re-Test of eETDRS 3.00 meter patched, matching card Visual acuity. Green circles represent test re-Test of PDI Check near dynamic autostereoscopic rivalry visual acuity/suppression. Orange squares compare performance on the distance and near tests (eETDRS minus PDI Check). Proposed performance levels on Bland Altman visual acuity show 95% Level of Agreement for “Optimum” purple, “Excellent” blue, “Good” green, “Fair” yellow and “Passing” red. |
Figure 3 shows a comparison of the intra-class correlation coefficient and 95% Bland-Altman limits of agreement for our three compared visual acuity tests as well as for prominent and recent studies including those on children. Figure 4 compares intraclass correlation coefficients for reported example data sets and their associated other correlation statistics Pearson’s, Spearman, Kendall and the r2 typically found on and Excel spreadsheet linear regression. In Figure 4, from our experience and review of the literature, we propose relationships between ICC and 95% limits of agreement which would constitute a passing level of comparison, a fair level, a good level, and an excellent level and is the case with our distance eETDRS test retest, also an optimum level with ICC greater than 0.95.
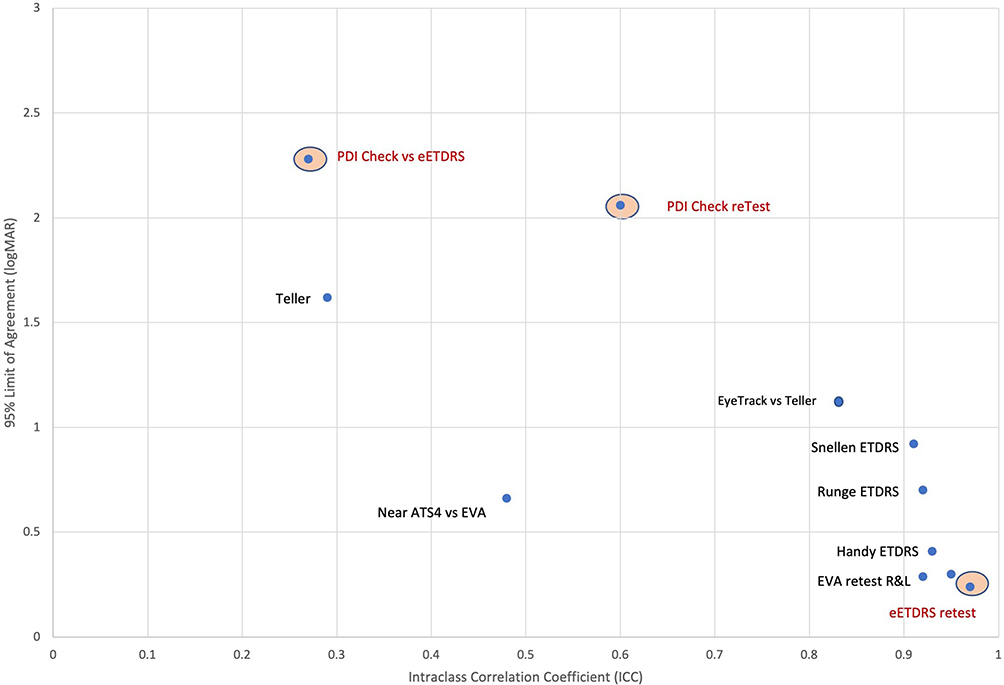 |
Figure 3 Relationship between intraclass correlation coefficient (ICC) on the abscissa and the 95% Limit of Agreement of the Bland Altman plots on the ordinate for various comparative visual acuity studies. Our experience in Orange ovals includes test retest for eETDRS and also for PDI /Check as well as direct compared PDI Check versus eETDRS. Other studies include Moke’s test retest with EVA,16 Toner’s Handy versus ETDRS,32 Cooke’s Runge versus ETDRS46 and Snellen versus ETDRS,46 Christoff’s near ATS4 versus EVA,50 Kushner’s Teller versus Snellen,38 and Wen’s Eye tracking grating acuity.12. |
 |
Figure 4 Intraclass Correlation Coefficient (ICC) levels of excellence. From prior studies24 and example data ranges with compared 95% Limit of agreement for Bland Altman (y-axis) and other measures of correlation including Pearson, Spearman, Kendall and r2. |
The normally distributed time to test both eyes with PDI check was much quicker than the time to test one eye with eETDRS (t(37) = 5, p < 0.001). The time to test one eye compared to the 95% Limits of Agreement for various test-retest studies in adults and children is shown in Figure 5.
 |
Figure 5 The interaction between time of testing visual acuity one eye and 95% Limit of Agreement from Bland Altman showing current study test re-Test and some comparable adult studies with logarithmic regression by Bastawrous (B),14 Chaikitmongkol (C),24 Koenig (K)27 and Lim (L)43 and two studies on very young children by Jones (J)40 and Wen (W).12 ETDRS # are LEA number optotypes. |
Discussion
It remains important to report visual acuity correctly.23 Huurnemann and Boonstra have published a summary of important aspects for pediatric visual acuity assessment.11 We confirmed an optimum test retest with state-of-the-art, calibrated optimized eETDRS. We describe “optimized by enhancing with patching of the non-tested eye and full-time utilization of a Sloan optotype matching card”. On a very different near, dynamic, touch screened, forced-choice autostereoscopic game, we showed good test-retest over a range of near rivalry visual acuity, but poorer correlation between monocular distance static and near, dichoptic dynamic acuity in patients with suppression.
ETDRS different optotypes were studied for normal subjects and eye patients in Thailand; Landolt C had high repeatability but 7 letter offset, whereas ETDRS numbers had fairly good repeatability with Landolt C slowest, alphabet next and number ETDRS fastest.24 In patients with poor vision due to cataract and macular degeneration, Landolt C scored 4 lines worse than eETDRS.25 Becker in patients with acuity worse than 0.3 logMAR found the Landolt C about 1 line worse than ETDRS.26 Koenig found a similar endpoint acuity between Landolt C and ETDRS presented in a similar manner starting from pre-guessed sizes.27 A timed, automated keyboard selected Landolt C and chart ETDRS performed similarly.28 From test re-test reliability in preschoolers, the HOTV was best followed by LEA, Frisby and Titmus compared to Tumbling E.29 When the eETDRS was compared to EVA on older treated amblyopic patients in the PEDIG trials, the EVA yielded 0.68 lines better mean visual acuity than truncated eETDRS in amblyopic children and the average intraocular difference was 0.42 lines greater for eETDRS.17
Repeatability in visual acuity is an important concept.30 We proposed our comparison criteria after a thorough review of other reports. Concordance correlation coefficient can be estimated31 and are calculated from intraclass correlation (ICC) and have been designated “excellent” if 0.75–1.00, “good” if 0.60–0.74, “fair” if 0.40–0.59, and “poor” if less than 0.40.24 A different range of Pearson correlation coefficients from “very strong” (0.8 to 1.00), “strong” 0.60 to 0.79, “moderate” 0.40 to 0.59, “weak” 0.20–0.39, and “very weak” 0.00 to 0.19 have been published.24 The standard error of measurement is also a helpful metric.32 KW (Weighted kappa) and Cohen’s kappa provide levels of agreement between categorical and continuous data like visual acuity:33
Despite being state-of-the-art for many amblyopia clinical trials, there are still limitations to eETDRS including how much time it takes. The electronic version seeks an endpoint with the smallest row of five optotypes which the patient can get 100% all the way down to the largest row of five the patient scores 0%. This test still has a human ceiling and floor; the worst acuity testable is 20/800 and the best is 20/10, whereas some individuals may have acuity as good as 20/6.34 The ETDRS protocol is typically done with the ten Sloan letters but can be done with four Lea numbers or even Landolt C. When there is concern about language unfamiliarity with optotypes, numbers have been substituted.24 To improve language unfamiliarity, but also keeping consistent from the start with the full spectrum of optotype alternatives, we have generated a simple Sloan matching card to improve eETDRS repeatability. In general, ETDRS is used in children older than 7 years and adults; we did not test our matching-card technique to determine if it might allow even younger children to complete eETDRS reliably.
Rather than validating several individuals at nearly identical levels of acuity, such as normal logMAR 0.0 ± 0.1, it is helpful to analyze a range of visual acuities. Such a range should cover normal and low vision. It is also helpful to recognize visual acuity tests capable of including the “floor” and “ceiling” range of human visual acuity. The optimum human BCVA is probably encompassed by logMAR −0.5 (20/6.3), and the lowest would be no light perception (NLP, logMAR ≥2.6). A full range of human logMAR visual acuity and methods to adapt them to electronic medical records have been published.35
The European LEA number utilized by some ETDRS tests has only has 4 optotypes giving a 25% chance of correct guessing with five opportunities per line so it may take 2–3 extra lines to achieve a “no pass line” and terminate the laborious task.
For an ICC of 0.75, Bland Altman LOA runs from −0.51 to 0.51. For an ICC of 0.60, limits of agreement run from −0.72 to 0.72. For ICC of 0.4, limits of agreement run from −1.1 to 1.1 logMAR.
Individual optotypes: Tumbling E and Landolt C are identical optotypes, whereas different letters or especially picture optotypes like Kay yield a wide range of visual acuities.36 Despite the optotype difference, recent test-re-test with Kay yielded an optimum comparison.37
Correlations and Limits of Agreement from Bland Altman for various other studies of visual acuity are compared to ours in Table 2. Other paradigms are used to estimate static, monocular visual acuity. Kushner et al studied the forced preferential looking using Teller cards compared to Snellen Visual acuity in patients with amblyopia and other organic ocular diseases.38 Our repeat analysis of their data showed an intraclass correlation of 0.29 (poor) and Bland Altman with 95% of limits of agreement of 1.62 logMar (Figure 3). On the other hand, the dynamic, rotating segmented rings of the Dyop (dynamic optotype) system yielded an ICC of 0.88 and a 95% Limit of Agreement of 0.24 logMAR.39 Eye-tracking based versus Keeler forced preferential looking in infants yielded early comparison for which we re-analyzed and calculated ICC 0.27 and Bland Altman 95% Limits of Agreement 0.64 logMAR.40
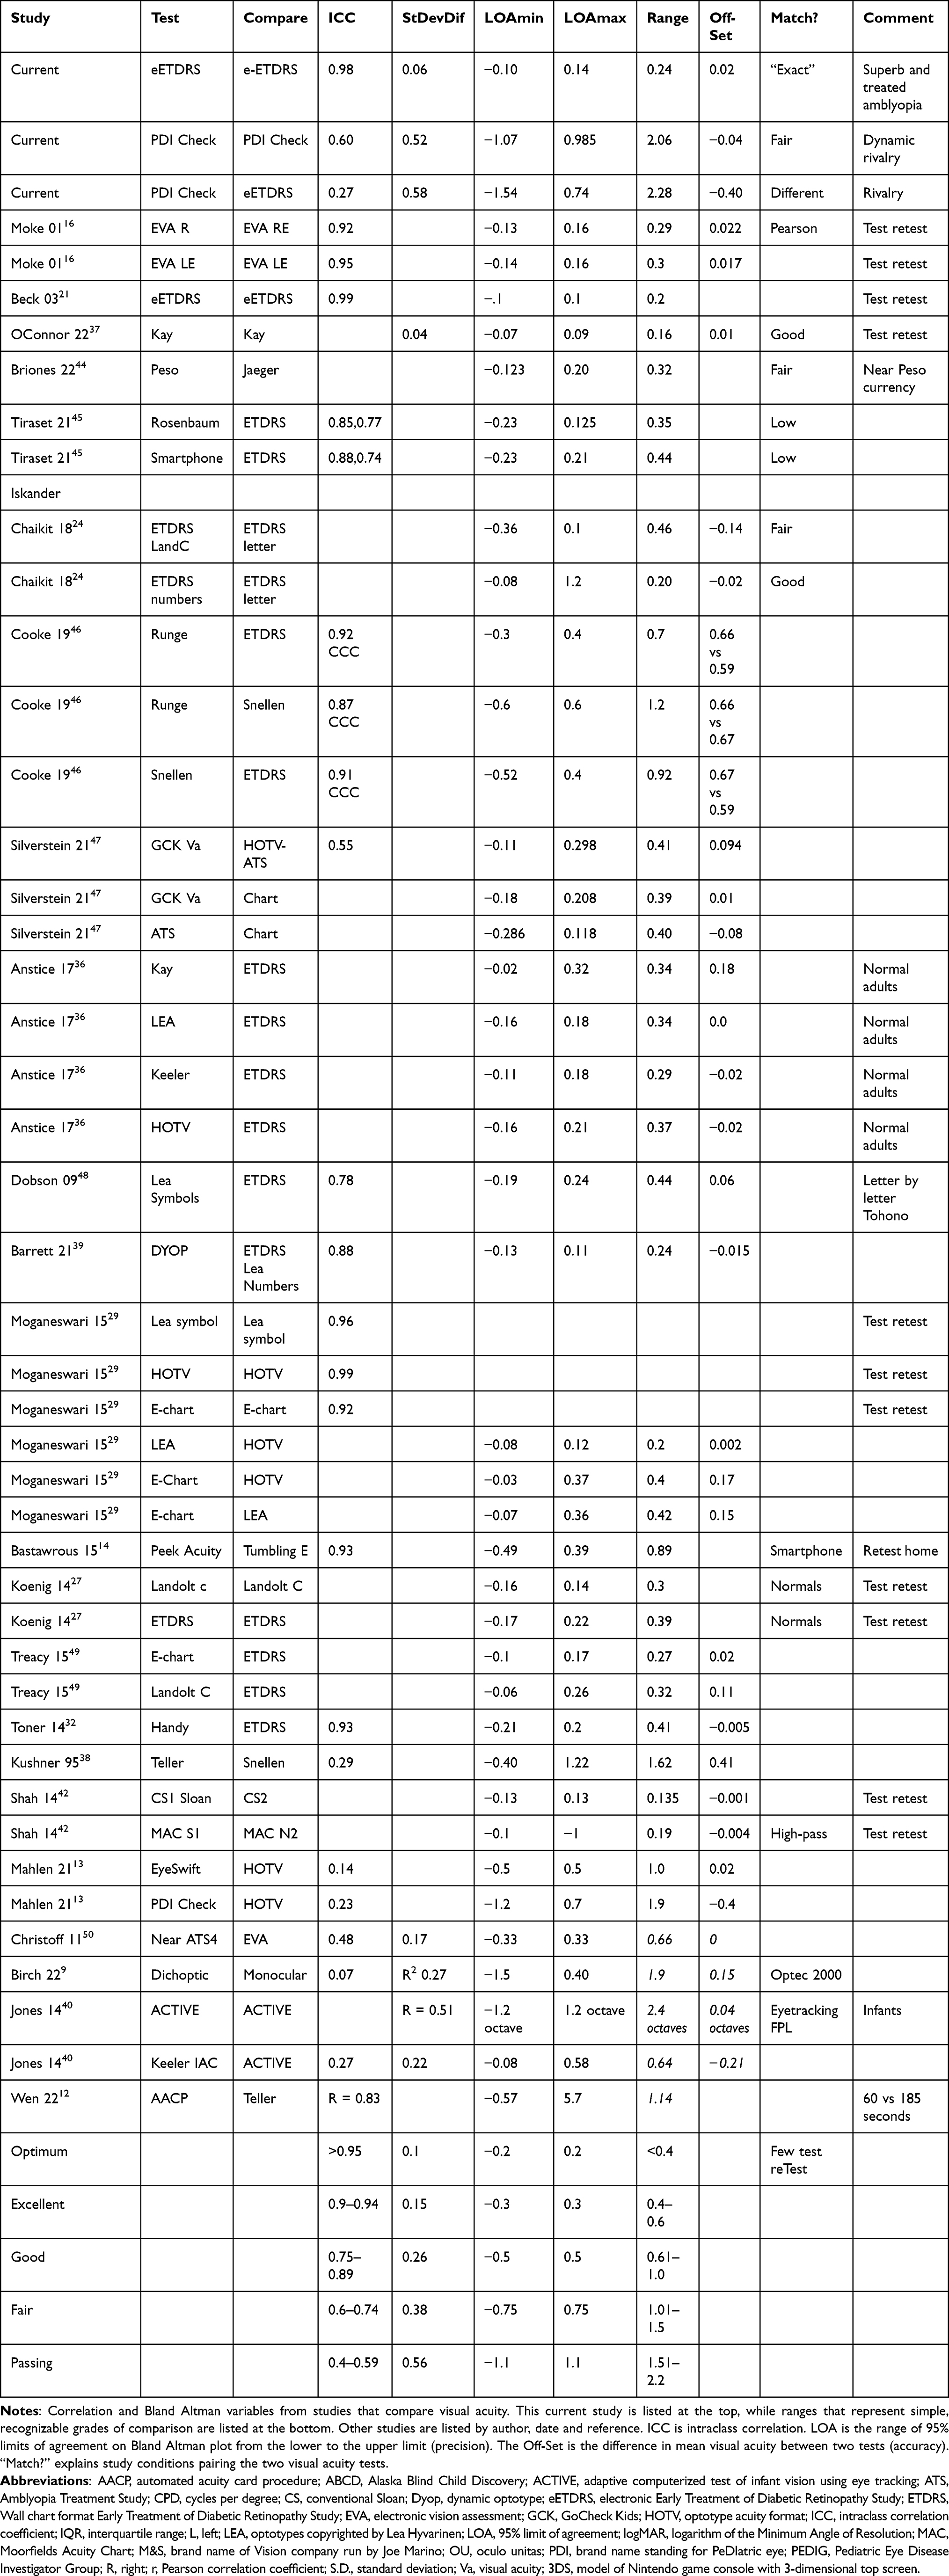 |
Table 2 Correlation and Bland Altman Variables from Studies That Compare Visual Acuity |
Birch et al studied the impact of dichoptic assessment with the Optic 2000 on patients with amblyopia and strabismus showing a weak (r – 0.52) correlation between dichoptic and monocular testing but substantially worse visual acuity including “unable” in many treated amblyopic patients.9 We analyzed their data substituting a poor value of visual acuity (20/800) for “unable” cases to derive an ICC of 0.07 and a Bland-Altman 95% Level of Agreement of 1.9 logMAR which is similar to our findings with the autostereoscopic dichoptic screen on the Nintendo 3DS and treated amblyopic patients with suppression.10
Our subjects with ICC = 0.98 had at least two differences compared to the initial PEDIG optimum performance (r = 0.99) of eETDRS:21 1) Ceiling of −0.3 instead of −0.2 and use of a matching card. The ceiling value testable by current eETDRS M&S system of logMAR −0.3 poses certain problems when dealing with subjects with superb acuity as some of our subjects scored 99 or 100 letters and should have had the opportunity to perceive logMAR −0.4 or better to fully encompass their visual ability. We believe the Sloan letter matching card allowed our patients to perform better on their initial test compared to subsequent ones due to familiarity with the larger, earlier-presented optotype options. We confirm the optimum performance of eETDRS employing Sloan letters for precise measurement of human visual acuity in subjects older than 7 years of age, but also confirm the excruciatingly slow process (560 seconds compared to just 39 seconds for PDI Check) which is too difficult for children with attention deficit disorder, but made even worse when employing just four LEA numbers compared to ten Sloan letters. Sufficient optotypes to reduce the chance of accidentally passing a row with the eETDRS paradigm is recommended.
The time to test compared to precision noted on test-retest comparison was not reported for Moke’s or Rice’s study on EVA,16,41 Morganeswari’s comparison of Lea, HOTV and Tumbling E29 or Shah’s study of the “Moorfields Acuity test”.42 Koenig et al in adults with eye disorders, starting at predicted good, or poor levels, and endpoint of two of the five missed per line, found Landolt C took on average 142 seconds compared to 77 seconds for ETDRS.27 Lim et al avoiding forced-choice found the per eye time for ETDRS of 36 seconds was slower than for Snellen (19 seconds).43 In very young children using preferential looking and digital eye tracking, test re-test achieved a similar LOA of two octaves in a median of about 100–110 seconds.40 DYOP is said to be quicker than LEA, perhaps similar to “Smith’s Method” in unpublished results.39
Finally, how do our two acuity tests compare based on our original criteria listed in the introduction? There are advantages and disadvantages and areas for improvement with both visual acuity tests. Regarding the accuracy represented by median visual acuity, eETDRS scored 0.00 fairly near to PDI Check 0.1. The Bland-Altman plot demonstrates a better match of PDI Check to eETDRS for good acuity, whereas patients who suppressed on PDI Check had less tight comparison and underestimated visual acuity scores compared to patched eETDRS. The tightest increment of visual acuity level testable by eETDRS is 0.02 logMAR, while PDI Check though derived through a continuously evolving optotype is just scored as one line (0.1 logMAR). The eETDRS and PDI Check tests have a floor and a ceiling excluding patients with low vision worse than 20/800 or normal subjects with super vision better than 20/10 with eETDRS running from −0.3 to 1.6 logMAR and PDI Check from −0.1 to 1.6 logMAR? eETDRS took much more average time per eye (280 seconds) compared to dynamic PDI Check with orientation plus monocular acuity in both eyes just 39 seconds. The eETDRS test acuity at distance (3 m) while PDI Check is for near testing. eETDRS requires patience and attention so is not usually recommended for children with developmental age less than 7 years, whereas PDI Check can be performed by children 3 years old and occasionally younger.
Conclusion
Using test re-test with standardized static optotypes, patching and matching cards affords optimum agreement but takes substantial time even for normal subject with superb visual acuity. Dynamic, dichoptic self-administered PDI Check was quick and identified suppression, however that suppression also highlighted the disparity between optimized eETDRS and PDI Check in the treated amblyopic patients.
Data Sharing Statement
Data Access: https://www.abcd-vision.org/references/eETDRS%20PDI%20check%20de-ID.pdf.
Funding
There is no funding to report.
Disclosure
Dr. Arnold is board-member of PDI Check and patent holder concerning autostereoscopic vision testing. He is also coordinator of the Alaska Blind Child Discovery which has received discounted technology from several vendors. Dr. Arnold was board-member of Glacier Medical Software which marketed NICU vision screening cloud-based software ROP Check. Dr. Arnold is an investigator and protocol developer for the Pediatric Eye Disease Investigator Group (PEDIG). No other conflicts of interest for other co-authors.
References
1. Beck RW. Clinical research in pediatric ophthalmology: the Pediatric Eye Disease Investigator Group. Curr Opin Ophthalmol. 2002;13:337–340.
2. Wu C, Hunter DG. Amblyopia: diagnostic and therapeutic options. Am J Ophthalmol. 2006;141(1):175–184. doi:10.1016/j.ajo.2005.07.060
3. Subramanian V, Jost RM, Birch EE. A quantitative study of fixation stability in amblyopia. Invest Ophthalmol Vis Sci. 2013;54(3):1998–2003. doi:10.1167/iovs.12-11054
4. Vedamurthy I, Suttle CM, Alexander J, Asper LJ. Interocular interactions during acuity measurement in children and adults, and in adults with amblyopia. Vision Res. 2007;47(2):179–188. doi:10.1016/j.visres.2006.08.017
5. Cotter SA, Edwards AR, Arnold RW, et al. Treatment of strabismic amblyopia with refractive correction. Am J Ophthalmol. 2007;143(6):1060–1063. doi:10.1016/j.ajo.2007.02.029
6. PEDIG. A randomized trial of atropine vs. patching for treatment of moderate amblyopia in children. Arch Ophthalmol. 2002;120(3):268–278. doi:10.1001/archopht.120.3.268
7. Wygnanski-Jaffe T, Kushner BJ, Moshkovitz A, Belkin M, Yehezkel O; CureSight Pivotal Trial G. An eye-tracking-based dichoptic home treatment for amblyopia: a multicenter randomized clinical trial. Ophthalmology. 2022. doi:10.1016/j.ophtha.2022.10.020
8. Stager D, Everett M, Birch E. Comparison of crowding bar and linear optotype acuity in amblyopia. Am Orthopt J. 1990;40(1):51–56. doi:10.1080/0065955X.1990.11981816
9. Birch EE, Jost RM, Hudgins LA, Morale SE, Donohoe M, Kelly KR. Dichoptic and monocular visual acuity in amblyopia. Am J Ophthalmol. 2022;242:209–214. doi:10.1016/j.ajo.2022.06.002
10. Smith KA, Arnold AW, Sprano JH, Arnold SL, Arnold RW. Performance of a quick screening version of Nintendo 3DS “PDI check” game on patients with ocular suppression. J Pediatr Ophthalmol Strabismus. 2019;56(4):234–237. doi:10.3928/01913913-20190502-01
11. Huurneman B, Boonstra FN. Assessment of near visual acuity in 0–13 year olds with normal and low vision: a systematic review. BMC Ophthalmol. 2016;16(1):215. doi:10.1186/s12886-016-0386-y
12. Wen J, Yang B, Li X, Cui J, Wang L. Automated assessment of grating acuity in infants and toddlers using an eye-tracking system. J Vis. 2022;22(12):8. doi:10.1167/jov.22.12.8
13. Mahlen T, Arnold R. Pediatric non-refractive vision screening with EyeSwift, PDI check and blinq. Clin Ophthalmol. 2021;16:375–384. doi:10.2147/OPTH.S344751
14. Bastawrous A, Rono HK, Livingstone IA, et al. Development and validation of a smartphone-based visual acuity test (peek acuity) for clinical practice and community-based fieldwork. JAMA Ophthalmol. 2015;133(8):930–937. doi:10.1001/jamaophthalmol.2015.1468
15. Bellsmith KN, Gale MJ, Yang S, et al. Validation of home visual acuity tests for telehealth in the COVID-19 era. JAMA Ophthalmol. 2022;140(5):465–471. doi:10.1001/jamaophthalmol.2022.0396
16. Moke PS, Turpin AH, Beck RW, et al. Computerized method of visual acuity testing: adaptation of the amblyopia treatment study visual acuity testing protocol. Am J Ophthalmol. 2001;132(6):903–909. doi:10.1016/S0002-9394(01)01256-9
17. Birch EE, Strauber SF, Beck RW, Holmes JM. Comparison of the amblyopia treatment study HOTV and the electronic-early treatment of diabetic retinopathy study visual acuity protocols in amblyopic children aged 5 to 11 years. J AAPOS. 2009;13(1):75–78. doi:10.1016/j.jaapos.2008.07.007
18. Tsou BC, Bressler NM. Visual acuity reporting in clinical research publications. JAMA Ophthalmol. 2017;135(6):651–653. doi:10.1001/jamaophthalmol.2017.0932
19. Bland JM, Altman DG. Statistical methods for assessing agreement between two methods of clinical measurement. Lancet. 1986;1(8476):307–310. doi:10.1016/S0140-6736(86)90837-8
20. Jones PR, Kalwarowsky S, Braddick OJ, Atkinson J, Nardini M. Optimizing the rapid measurement of detection thresholds in infants. J Vis. 2015;15(11):2. doi:10.1167/15.11.2
21. Beck RW, Moke PS, Turpin AH, et al. A computerized method of visual acuity testing: adaptation of the early treatment of diabetic retinopathy study testing protocol. Am J Ophthalmol. 2003;135(2):194–205. doi:10.1016/S0002-9394(02)01825-1
22. Iyer KK, Bradley AP, Wilson SJ. Conducting shorter VEP tests to estimate visual acuity via assessment of SNR. Doc Ophthalmol. 2013;126(1):21–28. doi:10.1007/s10633-012-9355-9
23. Ferris FL 3rd, Bailey I. Standardizing the measurement of visual acuity for clinical research studies: guidelines from the eye care technology forum. Ophthalmology. 1996;103(1):181–182. doi:10.1016/s0161-6420(96)30742-2
24. Chaikitmongkol V, Nanegrungsunk O, Patikulsila D, Ruamviboonsuk P, Bressler NM. Repeatability and agreement of visual acuity using the ETDRS number chart, Landolt C chart, or ETDRS alphabet chart in eyes with or without sight-threatening diseases. JAMA Ophthalmol. 2018;136(3):286–290. doi:10.1001/jamaophthalmol.2017.6290
25. Kuo HK, Kuo MT, Tiong IS, Wu PC, Chen YJ, Chen CH. Visual acuity as measured with Landolt C chart and Early Treatment of Diabetic Retinopathy Study (ETDRS) chart. Graefes Arch Clin Exp Ophthalmol. 2011;249(4):601–605. doi:10.1007/s00417-010-1461-3
26. Becker R, Teichler G, Graf M. [Comparison of visual acuity measured using Landolt-C and ETDRS charts in healthy subjects and patients with various eye diseases] Vergleich von Landoltring- und ETDRS-Buchstaben-Sehscharfe bei Augengesunden und Patienten mit unterschiedlichen Augenerkrankungen. Klin Monbl Augenheilkd. 2011;228(10):864–867. German. doi:10.1055/s-0031-1281758
27. Koenig S, Tonagel F, Schiefer U, Bach M, Heinrich SP. Assessing visual acuity across five disease types: ETDRS charts are faster with clinical outcome comparable to Landolt Cs. Graefes Arch Clin Exp Ophthalmol. 2014;252(7):1093–1099. doi:10.1007/s00417-014-2670-y
28. Ruamviboonsuk P, Tiensuwan M, Kunawut C, Masayaanon P. Repeatability of an automated Landolt C test, compared with the early treatment of diabetic retinopathy study (ETDRS) chart testing. Am J Ophthalmol. 2003;136(4):662–669. doi:10.1016/s0002-9394(03)00394-5
29. Moganeswari D, Thomas J, Srinivasan K, Jacob GP. Test re-test reliability and validity of different visual acuity and stereoacuity charts used in preschool children. J Clin Diagn Res. 2015;9(11):NC01–NC05. doi:10.7860/JCDR/2015/14407.6747
30. Raasch TW, Bailey IL, Bullimore MA. Repeatability of visual acuity measurement. Optom Vis Sci. 1998;75(5):342–348. doi:10.1097/00006324-199805000-00024
31. King TS, Chinchilli VM. Robust estimators of the concordance correlation coefficient. J Biopharm Stat. 2001;11(3):83–105. doi:10.1081/BIP-100107651
32. Toner KN, Lynn MJ, Candy TR, Hutchinson AK. The handy eye check: a mobile medical application to test visual acuity in children. J AAPOS. 2014;18(3):258–260. doi:10.1016/j.jaapos.2014.01.011
33. King TS, Chinchilli VM. A generalized concordance correlation coefficient for continuous and categorical data. Stat Med. 2001;20(14):2131–2147. doi:10.1002/sim.845
34. Taylor HR. Racial variations in vision. Am J Epidemiol. 1981;113(1):62–80. doi:10.1093/oxfordjournals.aje.a113067
35. Arnold RW. Digital values for alpha acuities. JPOS. 2021;58(2):132–135. doi:10.3928/01913913-20210111-02
36. Anstice NS, Jacobs RJ, Simkin SK, Thomson M, Thompson B, Collins AV. Do picture-based charts overestimate visual acuity? Comparison of kay pictures, lea symbols, HOTV and Keeler logMAR charts with Sloan letters in adults and children. PLoS One. 2017;12(2):e0170839. doi:10.1371/journal.pone.0170839
37. O’Connor A, King C, Milling A, Tidbury L. Using a computerised staircase and incremental optotype sizes to improve visual acuity assessment accuracy. Br Ir Orthopt J. 2022;18(1):93–100. doi:10.22599/bioj.271
38. Kushner BJ, Lucchese NJ, Morton GV. Grating visual acuity with teller cards compared with Snellen visual acuity in literate patients. Arch Ophthalmol. 1995;113(4):485–493. doi:10.1001/archopht.1995.01100040107035
39. Barnett-Itzhaki G, Barnett-Itzhaki Z, Ela-Dalman N. The dynamic optotype (Dyop): a novel visual acuity test for use in children. J AAPOS. 2021;25(5):285e1–285 e5. doi:10.1016/j.jaapos.2021.04.009
40. Jones PR, Kalwarowsky S, Atkinson J, Braddick OJ, Nardini M. Automated measurement of resolution acuity in infants using remote eye-tracking. Invest Ophthalmol Vis Sci. 2014;55(12):8102–8110. doi:10.1167/iovs.14-15108
41. Rice ML, Leske DA, Holmes JM. Comparison of the amblyopia treatment study HOTV and electronic-early treatment of diabetic retinopathy study visual acuity protocols in children aged 5 to 12 years. Am J Ophthalmol. 2004;137(2):278–282. doi:10.1016/j.ajo.2003.08.016
42. Shah N, Dakin SC, Whitaker HL, Anderson RS. Effect of scoring and termination rules on test-retest variability of a novel high-pass letter acuity chart. Invest Ophthalmol Vis Sci. 2014;55(3):1386–1392. doi:10.1167/iovs.13-13340
43. Lim LA, Frost NA, Powell RJ, Hewson P. Comparison of the ETDRS logMAR, ‘compact reduced logMar’ and Snellen charts in routine clinical practice. Eye. 2010;24(4):673–677. doi:10.1038/eye.2009.147
44. Briones LJ, Gomez JP, Leuenberger EF. The Philippine peso bill as an alternative near visual acuity chart in Filipino eyes: a pilot study. Clin Ophthalmol. 2022;16:3437–3445. doi:10.2147/OPTH.S376818
45. Tiraset N, Poonyathalang A, Padungkiatsagul T, Deeyai M, Vichitkunakorn P, Vanikieti K. Comparison of visual acuity measurement using three methods: standard ETDRS chart, near chart and a smartphone-based eye chart application. Clin Ophthalmol. 2021;15:859–869. doi:10.2147/OPTH.S304272
46. Cooke MD, Winter PA, McKenney KC, et al. An innovative visual acuity chart for urgent and primary care settings: validation of the Runge near vision card. Eye. 2019;33(7):1104–1110. doi:10.1038/s41433-019-0372-8
47. Silverstein E, Williams JS, Brown JR, Bylykbashi E, Stinnett SS. Teleophthalmology: evaluation of phone-based visual acuity in a pediatric population. Am J Ophthalmol. 2021;221:199–206. doi:10.1016/j.ajo.2020.08.007
48. Dobson V, Clifford-Donaldson CE, Miller JM, Garvey KA, Harvey EM. A comparison of lea symbol vs ETDRS letter distance visual acuity in a population of young children with a high prevalence of astigmatism. J AAPOS. 2009;13(3):253–257. doi:10.1016/j.jaapos.2009.01.007
49. Treacy MP, Hurst TP, Conway M, et al. The early treatment in diabetic retinopathy study chart compared with the tumbling-E and Landolt-C. Ophthalmology. 2015;122(5):1062–3 e1. doi:10.1016/j.ophtha.2014.11.024
50. Christoff A, Repka MX, Kaminski BM, Holmes JM. Distance versus near visual acuity in amblyopia. J AAPOS. 2011;15(4):342–344. doi:10.1016/j.jaapos.2011.05.004
 © 2023 The Author(s). This work is published and licensed by Dove Medical Press Limited. The
full terms of this license are available at https://www.dovepress.com/terms
and incorporate the Creative Commons Attribution
- Non Commercial (unported, 3.0) License.
By accessing the work you hereby accept the Terms. Non-commercial uses of the work are permitted
without any further permission from Dove Medical Press Limited, provided the work is properly
attributed. For permission for commercial use of this work, please see paragraphs 4.2 and 5 of our Terms.
© 2023 The Author(s). This work is published and licensed by Dove Medical Press Limited. The
full terms of this license are available at https://www.dovepress.com/terms
and incorporate the Creative Commons Attribution
- Non Commercial (unported, 3.0) License.
By accessing the work you hereby accept the Terms. Non-commercial uses of the work are permitted
without any further permission from Dove Medical Press Limited, provided the work is properly
attributed. For permission for commercial use of this work, please see paragraphs 4.2 and 5 of our Terms.
Recommended articles
Standard Amblyopia Therapy in Adults with Longstanding Amblyopia Improves Visual Acuity and Contrast Sensitivity
Ridder WH III, Patel R, Li YX, Staubli U
Clinical Ophthalmology 2023, 17:1847-1858
Published Date: 29 June 2023
Efficacy of Dichoptic Treatment vs Eye Patching in Pediatric Patients with Amblyopia: A Systematic Review and Meta-Analysis of Randomized Controlled Trials
Nughays RO, Almazroy EA, Elyas SK, Alamoudi A, Batais WT, Bogari AM, Alnabihi A, Alkharboush DH, Almarzouki H
Clinical Ophthalmology 2025, 19:1999-2009
Published Date: 26 June 2025