")
Back to Journals » Journal of Pain Research » Volume 12
Activation of hippocampal microglia in a murine model of cancer-induced pain
Authors Miladinovic T , Sharma M , Phan A, Geres H, Ungard RG , Linher-Melville K, Singh G
Received 23 October 2018
Accepted for publication 23 January 2019
Published 18 March 2019 Volume 2019:12 Pages 1003—1016
DOI https://doi.org/10.2147/JPR.S191860
Checked for plagiarism Yes
Review by Single anonymous peer review
Peer reviewer comments 3
Editor who approved publication: Dr Katherine Hanlon
Tanya Miladinovic,1,2 Manu Sharma,1,2 Andy Phan,1,2 Hana Geres,1,2 Robert G Ungard,1,2 Katja Linher-Melville,1,2 Gurmit Singh1,2
1Michael G. DeGroote Institute for Pain Research and Care, Medicine, McMaster University, Hamilton, ON L8S 4M1, Canada; 2Department of Pathology and Molecular Medicine, McMaster University, Hamilton, ON L8S 4M1, Canada
Introduction: Pain is a common and debilitating comorbidity of metastatic breast cancer. The hippocampus has been implicated in nociceptive processing, particularly relating to the subjective aspect of pain. Here, a syngeneic mouse model was used to characterize the effects of peripheral tumors on hippocampal microglial activation in relation to cancer-induced pain (CIP).
Materials and methods: Mice were systemically treated with the colony-stimulating factor 1 receptor inhibitor Pexidartinib prior to intrafemoral (IF) or subcutaneous 4T1 carcinoma cell inoculation. Spontaneous and evoked nociceptive responses were quantitated throughout tumor development, and contralateral hippocampi were collected via endpoint microdissection for RNA analysis. Additionally, IF tumor-bearing animals were sacrificed on days 5, 10, 15, and 20 post 4T1 cell inoculation, and brain sections were immunofluorescently stained for Iba1, a marker of activated microglia.
Results: Ablation of these neuroimmune cells with the CSF1R inhibitor Pexidartinib delayed the onset and severity of cancer-induced nociceptive behaviors in IF tumor-bearing animals, adding to the body of literature that demonstrates microglial contribution to the development and maintenance of CIP. Furthermore, in untreated IF tumor-bearing mice, nociceptive behaviors appeared to progress in parallel with microglial activation in hippocampal regions. Immunofluorescent Iba1+ microglia increased in the dentate gyrus and cornu ammonis 1 hippocampal regions in IF tumor-bearing animals over time, which was confirmed at the mRNA level using relevant microglial markers.
Conclusion: This is the first experimental evidence to demonstrate the effects of peripheral tumor-induced nociception on hippocampal microglial activation. The increase in hippocampal microglia observed in the present study may reflect the emotional and cognitive deficits reported by patients with CIP.
Keywords: nociception, hippocampus, cancer-induced bone pain, breast cancer, Iba1
Introduction
Pain is a complex, heterogeneous, and subjective phenomenon resulting from integration of sensory, affective, and cognitive experiences. A growing body of literature suggests that chronic pain conditions may be linked to aberrant functioning of neuroimmune circuits implicated in mood and motivation. The hippocampus is involved in multiple cognitive and emotional processes, including the initiation and maintenance of anxiety and depression.1,2 Clinical studies suggest that such mood conditions are among the factors that prevent recovery from pain, and may significantly reduce the efficacy of analgesic agents.3 Accordingly, development of pharmacologic interventions for the treatment of chronic pain ought to extend beyond circuits which control sensory transmission, to those which mediate affect. That is, pharmacologic interventions should not only target sensory transmission but should encompass the perceptive pathways involved as well. It is important to consider pathways implicated in the cognitive and affective aspects of pain processing in parallel with ascending and descending sensory pathways in the development of cancer-induced pain (CIP) therapeutics.
Emerging evidence suggests that the hippocampus may be involved in nociceptive processing, particularly with respect to the affective aspect of pain perception.4–14 The inflammatory response within the hippocampus has been implicated in the perception of pain15 through the processing and modification of nociceptive stimuli.16–18 Several experimental studies have found that direct manipulation of the hippocampus alters nociceptive behavior. For example, hippocampal manipulation has been shown to alter the perception of noxious stimuli: lesion to the ventral hippocampus partially alleviates acute thermal and mechanical nociception in rat pups and adults,5 while direct injection of the local anesthetic and sodium channel blocker lidocaine to the dentate gyrus (DG) region of the hippocampus produces analgesia.9,14
Our lab recently developed a validated murine model of cancer-induced depression (CID) using 4T1 carcinoma cells, in which subcutaneous (SC) tumor burden was associated with increased depressive-like symptoms.19 RNA-sequencing and real-time RT-PCR analysis of hippocampi revealed considerable overlap between cancer-induced and positive control corticosterone-induced depressive states.20 Several of the validated hippocampal mRNA targets associated with the depressive-like state in tumor-bearing mice were ionotropic and metabotropic glutamate receptors (GluRs) and glutamatergic modulators,20 many of which are expressed or secreted by microglia (reviewed in Murugan et al21).
In the healthy nervous system, the resident immune cells microglia have a highly branched morphology and a downregulated phenotype. Upon activation, microglia release pro-inflammatory cytokines, including interleukin-1 (IL-1), interleukin-6 (IL-6), and tumor necrosis factor-α (TNF-α) (reviewed in Hanisch25). However, rising attention is given to chronically activated microglia, which release substances inherent to several neurodegenerative disorders, leading to cytotoxicity and neuronal degeneration (reviewed in Tang and Le26). Although a complex process, microglial activation may be simplified to the classically activated M1 and alternatively activated M2 states. Thus, M1 microglia, activated by lipopolysaccharide or the pro-inflammatory cytokine interferon-γ, express antigens including CD68 and CD86, and produce high amounts of oxidative metabolites and pro-inflammatory cytokines. M2 microglia possess anti-inflammatory properties, express CD206 and arginase, and promote tissue repair and angiogenesis.22 In animal models of pain, however, this simplified M1/M2 classification may be insufficient, with several intermediate phenotypes present, causing a shift in the M1/M2 balance.23 In the present study, microglial activation was morphologically characterized by immunohistochemical quantification of ionized calcium-binding adapter molecule 1 (Iba1). Iba1 is a protein expressed by microglia, plays a role in their functional regulation, and is particularly relevant during their activation.24 Mounting evidence suggests that the immune response may play a significant role in the development of CIP.27–30
The present study was designed to further assess the role of the neuroimmune response within the hippocampus in relation to cancer-related nociception. Here, we present data that illustrate the role of hippocampal microglia in the development of tumor-related nociception using a validated murine model of CIP.31 Spontaneous and evoked nociceptive responses increased following tumor progression. Immunofluorescent and transcript evidence of microglial activation paralleled development of tumor-induced nociception, and pharmacological microglial inhibition with a colony-stimulating factor 1 receptor (CSF1R) inhibitor attenuated CIP.
Materials and methods
Cell culture
4T1 triple-negative murine mammary carcinoma cells (American Type Culture Collection, Manassas, VA, USA) were selected as an analog to aggressive triple-negative human breast cancer, such as the MDA-MB-231 cell line. Cells were maintained in high glucose RPMI (Life Technologies, Carlsbad, CA, USA), supplemented with 10% FBS and 1% antibiotic/antimycotic (Life Technologies), incubated at 37°C and 5% CO2, and verified to be mycoplasma free before experimental use.
Crystal violet
To assess potential off-target growth effects of the drug on tumor cells, the selective microglial inhibitor Pexidartinib (PLX3397; Plexxikon Inc, Berkeley, CA, USA), a validated inhibitor of microglial CSF1R,32 was dissolved in dimethyl sulfoxide (DMSO) for preparation of a 100 mM stock. 4T1 cells were seeded at 5×10³ cells/well in 96-well plates, treated with serial dilutions of Pexidartinib (0.01–100 ng/mL), dissolved in DMSO (maximum final concentration: 0.1%) or 0.1% DMSO alone (vehicle control) for 24 hours, fixed with 10% neutral buffered formalin and quantified using 0.1% Crystal Violet stain in 80% EtOH based on a standard curve for 4T1 cells. Absorbance was read on an optical plate reader (BioTek) at λ=570 nm and expressed as a fold change relative to naïve control wells on the same experimental plate.
Mice
Female BALB/c mice (Charles River Laboratories) aged 4–6 weeks upon arrival were provided ad libitum access to food and water and group housed in cages maintained at 24°C with a 12-hour light/dark cycle. Mice were randomly assigned to treatment groups: 1) sham intrafemoral (IF) surgery + vehicle, 2) IF tumor + vehicle, 3) IF tumor + Pexidartinib, 4) SC tumor + vehicle, or 5) SC tumor + Pexidartinib. All animal procedures were reviewed and approved by the Animal Research Ethics Board of McMaster University and performed according to guidelines established by the Canadian Council on Animal Care.
Experimental design
Our validated syngeneic mouse models of metastatic IF31 and SC19 cancer were utilized to characterize the effects of the CSF1R inhibitor Pexidartinib on tumor burden and tumor-induced nociception in vivo. Experimentally, naïve immunocompetent mice (N=46) were inoculated with either 2×10⁴ 4T1 cells or frozen/heat killed 4T1 cell sham controls (n=8) percutaneously into the right distal femur (n=28) or subcutaneously at the right hind limb, lateral to the pelvic-hip joint (n=10) to establish tumors. Animals were systemically treated with the CSF1R inhibitor Pexidartinib administered in pre-absorbed standard rodent chow or control chow for 3 weeks prior to 4T1 cell inoculation through to experimental endpoint. The behavioral timeline is detailed in Figure 1.
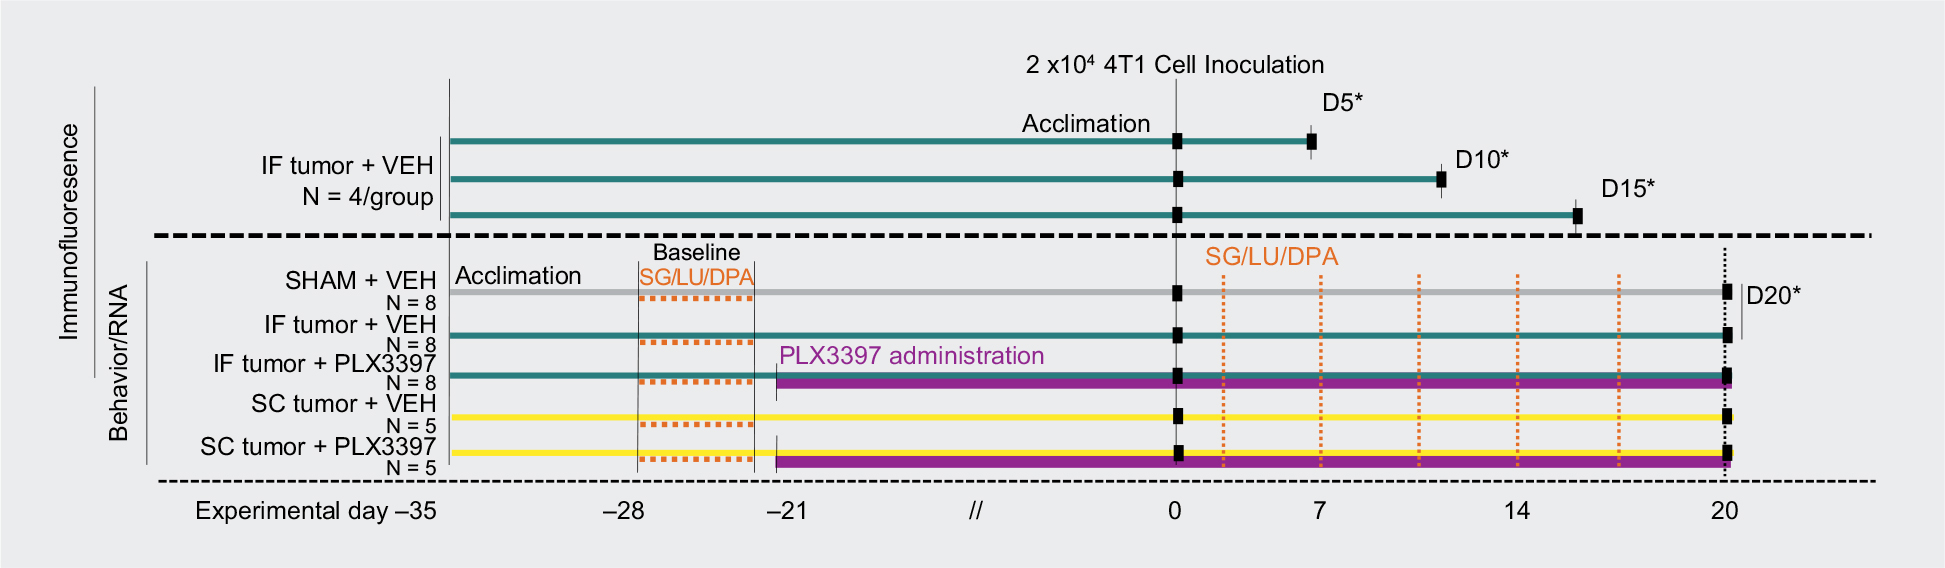 | Figure 1 Timeline of in vivo experiments. Notes: Procedures for each of the experimental groups are noted along the timeline at the days that they occurred. Day 0 represents the day of IF or SC inoculation. Orange dashed lines indicate days of nociceptive behavior tests; green lines indicate IF tumor group; yellow lines indicate SC tumor group; purple lines indicate period of treatment with Pexidartinib (PLX3397) CSF1R inhibitor. *Perfusions and tissue collection. Abbreviations: DPA, dynamic plantar aesthesiometer; IF, intrafemoral; LU, limb use; SC, subcutaneous; SG, spontaneous guarding. |
The progression of spontaneous and evoked nociception pre and post IF and SC 4T1 cell inoculation was monitored. A blinded experimenter performed all behavioral testing during the animals’ light cycle. Animals were randomly assigned to systemic therapies (Pexidartinib or control chow), were acclimated to the behavioral testing environment and equipment 1 week prior to commencing data recording, and tested twice weekly for the duration of the experiment. Three behavioral tests were performed prior to experimental day 0, which served to establish a stable baseline for the animals’ normal locomotive and nociceptive behavior; results are expressed for each animal as a percentage of these baseline scores. A selection of tests for spontaneous and evoked nociception was used to monitor nociceptive responses with tumor progression: Spontaneous Guarding, Limb Use, and dynamic plantar aesthesiometer (DPA; Ugo Basile, Comerio, Italy).
Spontaneous nociception
Open Field tests, including time spent spontaneously guarding the affected limb and scored limb use, were used to visually assess ongoing and ambulatory nociception using formerly validated tests.31,33 The time (s) spent spontaneously guarding the tumor-bearing hind paw was interpreted as representative of ongoing nociception and was recorded during a 2-minute open field observation period using a stopwatch. Guarding time was defined as the time the hind paw was held aloft while ambulatory. During the 2-minute spontaneous ambulation period, hind limb use was observed and scored on a scale of 4–0: 4 – normal use; 3 – pronounced limp; 2 – limp and guarding behavior; 1 – partial nonuse of the limb in locomotor activity; and 0 – complete lack of limb use.
Evoked nociception
The DPA test, a semi-automated version of the classic von Frey test,34 was used to quantitate mechanical allodynia and hyperalgesia. A normally non-nociceptive mechanical stimulus was presented individually to the plantar surface of the hind paws and the threshold force and time at which the paw was withdrawn were recorded on a computer. A metal filament raised by an electrical actuator with variable force and acceleration provided the tactile stimulus. Contralateral hind paws served as a control specific to each animal.
Transcardial perfusion and tissue collection
Throughout tumor development, animals were monitored daily for limb use, overall health status, and body weight. For immunofluorescent staining, animals were euthanized by transcardial perfusion on day 5, 10, 15 (IF tumor group), or day 20 (sham/IF/SC tumor groups) post tumor cell inoculation, or if they no longer bore weight on the afflicted limb. For hippocampal mRNA analysis, animals were euthanized by cervical dislocation under isofluorane anesthetic on or before day 20 post tumor cell inoculation.
For immunofluorescent histological analysis and quantification of activated hippocampal microglia, untreated and Pexidartinib-treated IF tumor mice and sham controls were sacrificed by transcardial perfusion on day 5, 10, 15, or 20 post 4T1 cell inoculation (n=4/day). Animals were sacrificed under sodium pentobarbital anesthetic (90 mg/kg, i.p.) and perfused with 100 mL of PBS, immediately followed by 100 mL of cold 4% paraformaldehyde (PFA; pH 6.9). Whole brains were dissected, post-fixed in 4% PFA for 48 hours, and paraffin-embedded for immunofluorescent analyses; tumor-bearing femurs and surrounding tissues were post-fixed in 4% PFA until radiographic analysis.
For RNA investigation, whole brains were immediately dissected on a chilled, RNase-free dish, and preserved in RNAlater Solution (Invitrogen, Carlsbad, CA, USA) at 4°C for 24 hours, and then at –80°C. Each brain was microdissected under stereoscopic microscope to isolate contralateral hippocampi under chilled, RNase-free conditions; the contralateral hemisphere was separated, the cerebellum was removed, and remaining tissue was adjusted with the medial side facing up. Tissue covering the medial surface of the hippocampus was removed using a dissection spatula by inserting below the corpus callosum. The thalamus, septum, and underlying striatum were discarded to clearly reveal the hippocampus. Using forceps to secure the cerebral cortex, a spatula was placed under the ventral part of the hippocampus. Finally, the structure was rolled out to separate the hippocampus from the rest of the cortex. Microdissection technique is detailed in Figure 2.
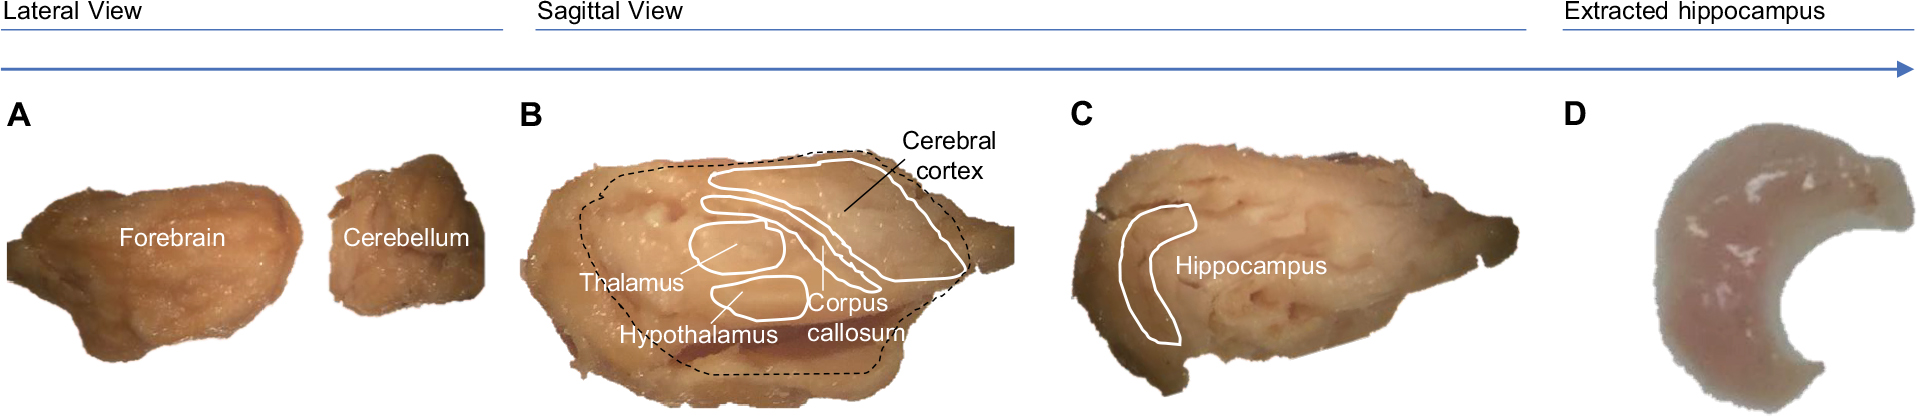 | Figure 2 Hippocampal microdissection methodology. Notes: Following cervical dislocation, contralateral hippocampi were immediately collected by microdissection: contralateral hemisphere was isolated and cerebellum was removed (A), remaining tissue was flipped with medial side facing up (B). Tissue covering the medial surface of hippocampus was removed using dissection spatula (spatula was inserted below corpus callosum; thalamus, septum, and underlying striatum were discarded to clearly reveal hippocampus) (C). Using forceps to secure cerebral cortex, spatula was placed under the ventral part of the hippocampus, and tissue was rolled out to separate the hippocampus from the cortex (D). |
Radiographic analysis
Radiographic analysis was used to establish the extent of bone degradation in hind limbs, indicative of tumor invasion. Radiographs were scored on a scale of 0–3: 0 – normal bone, no visible lesion; 1 – minor loss of bone density, minimal lesion; 2 – moderate to substantial loss of bone density, lesion limited to bone trabecula and cortex; 3 – substantial loss of bone density, lesion includes clear periosteal involvement or fracture (see scale development in Ungard et al35).
Hematoxylin and eosin
Tumor-bearing hind limbs were stained to confirm the degree of IF tumor in animals that demonstrated lytic lesions on X-rays. Following decalcification in 10% EDTA for 14 days, femurs and surrounding tissues were paraffin-embedded, sagittally sectioned at 5 µm, stained with hematoxylin and eosin, xylene-cleared, and imaged using brightfield microscopy.
Immunofluorescence
Brains were coronally sectioned at 5 µm, slide-mounted, rehydrated, and exposed to antigen retrieval in EDTA (pH 8, 95°C) for 20 minutes. Tissues were then blocked (Dako protein block) for 2 hours, incubated in respective primary (Wako anti-Iba1, 1:1,000, O/N at 4°C) and fluorescent secondary antibodies (Life Technologies AlexaFluor-488 goat anti-rabbit, 1:500, 2 hours at RT), or direct conjugate primary antibody (c-Fos D1 AlexaFluor 546: Santa Cruz, 1:200, O/N at 4°C), counterstained with DAPI, coverslipped, and imaged using EVOS FL Cell Imaging System at 10× (dry), 20× (dry), and 60× (oil) immersion lenses.
RNA isolation
Isolated hippocampi were dissociated, preserved in RNAlater, and total RNA was isolated from each sample using the RNeasy Kit (Qiagen), as described previously.20 Briefly, eluates were DNase-treated using the DNA-free Kit (DNase Treatment and Removal Reagents; Ambion) and RNA quality/purity was quantitated using spectrophotometric analysis at OD260/OD280.
Quantitative real-time PCR (qPCR)
Relative mRNA levels were quantified using qPCR, adopted from previous reports.20 Briefly, cDNA was synthesized from 400 ng total RNA via reverse transcription using Superscript III kit (Life Technologies) and qPCR assays were performed for each target and reference gene per sample with SsoAdvanced Universal SYBR Green Supermix (BioRad). All target and housekeeping gene primers based on sequences specific for Mus musculus were derived from PrimerBank.36 Official gene symbols, primer sequences (5′ to 3′), respective housekeepers, product sizes, and PrimerBank IDs for target gene products are listed in Table 1; specifications of housekeeping genes used in this study (SDHA: succinate dehydrogenase complex, subunit A; Polr2b: polymerase [RNA] II [DNA directed] polypeptide B; Taf1b: TATA box binding protein [Tbp]-associated factor, RNA polymerase I) are summarized in Table 2. Housekeeper genes were selected based on stringent efficiency testing of each target-housekeeper pair. All primers had an annealing temperature of 60°C. Amplification efficiencies were tested for each primer pair, with efficiency (E) = [10(−1/S)] – 1, and relative quantification analysis of gene expression data was conducted according to the 2–∆∆CT method.37
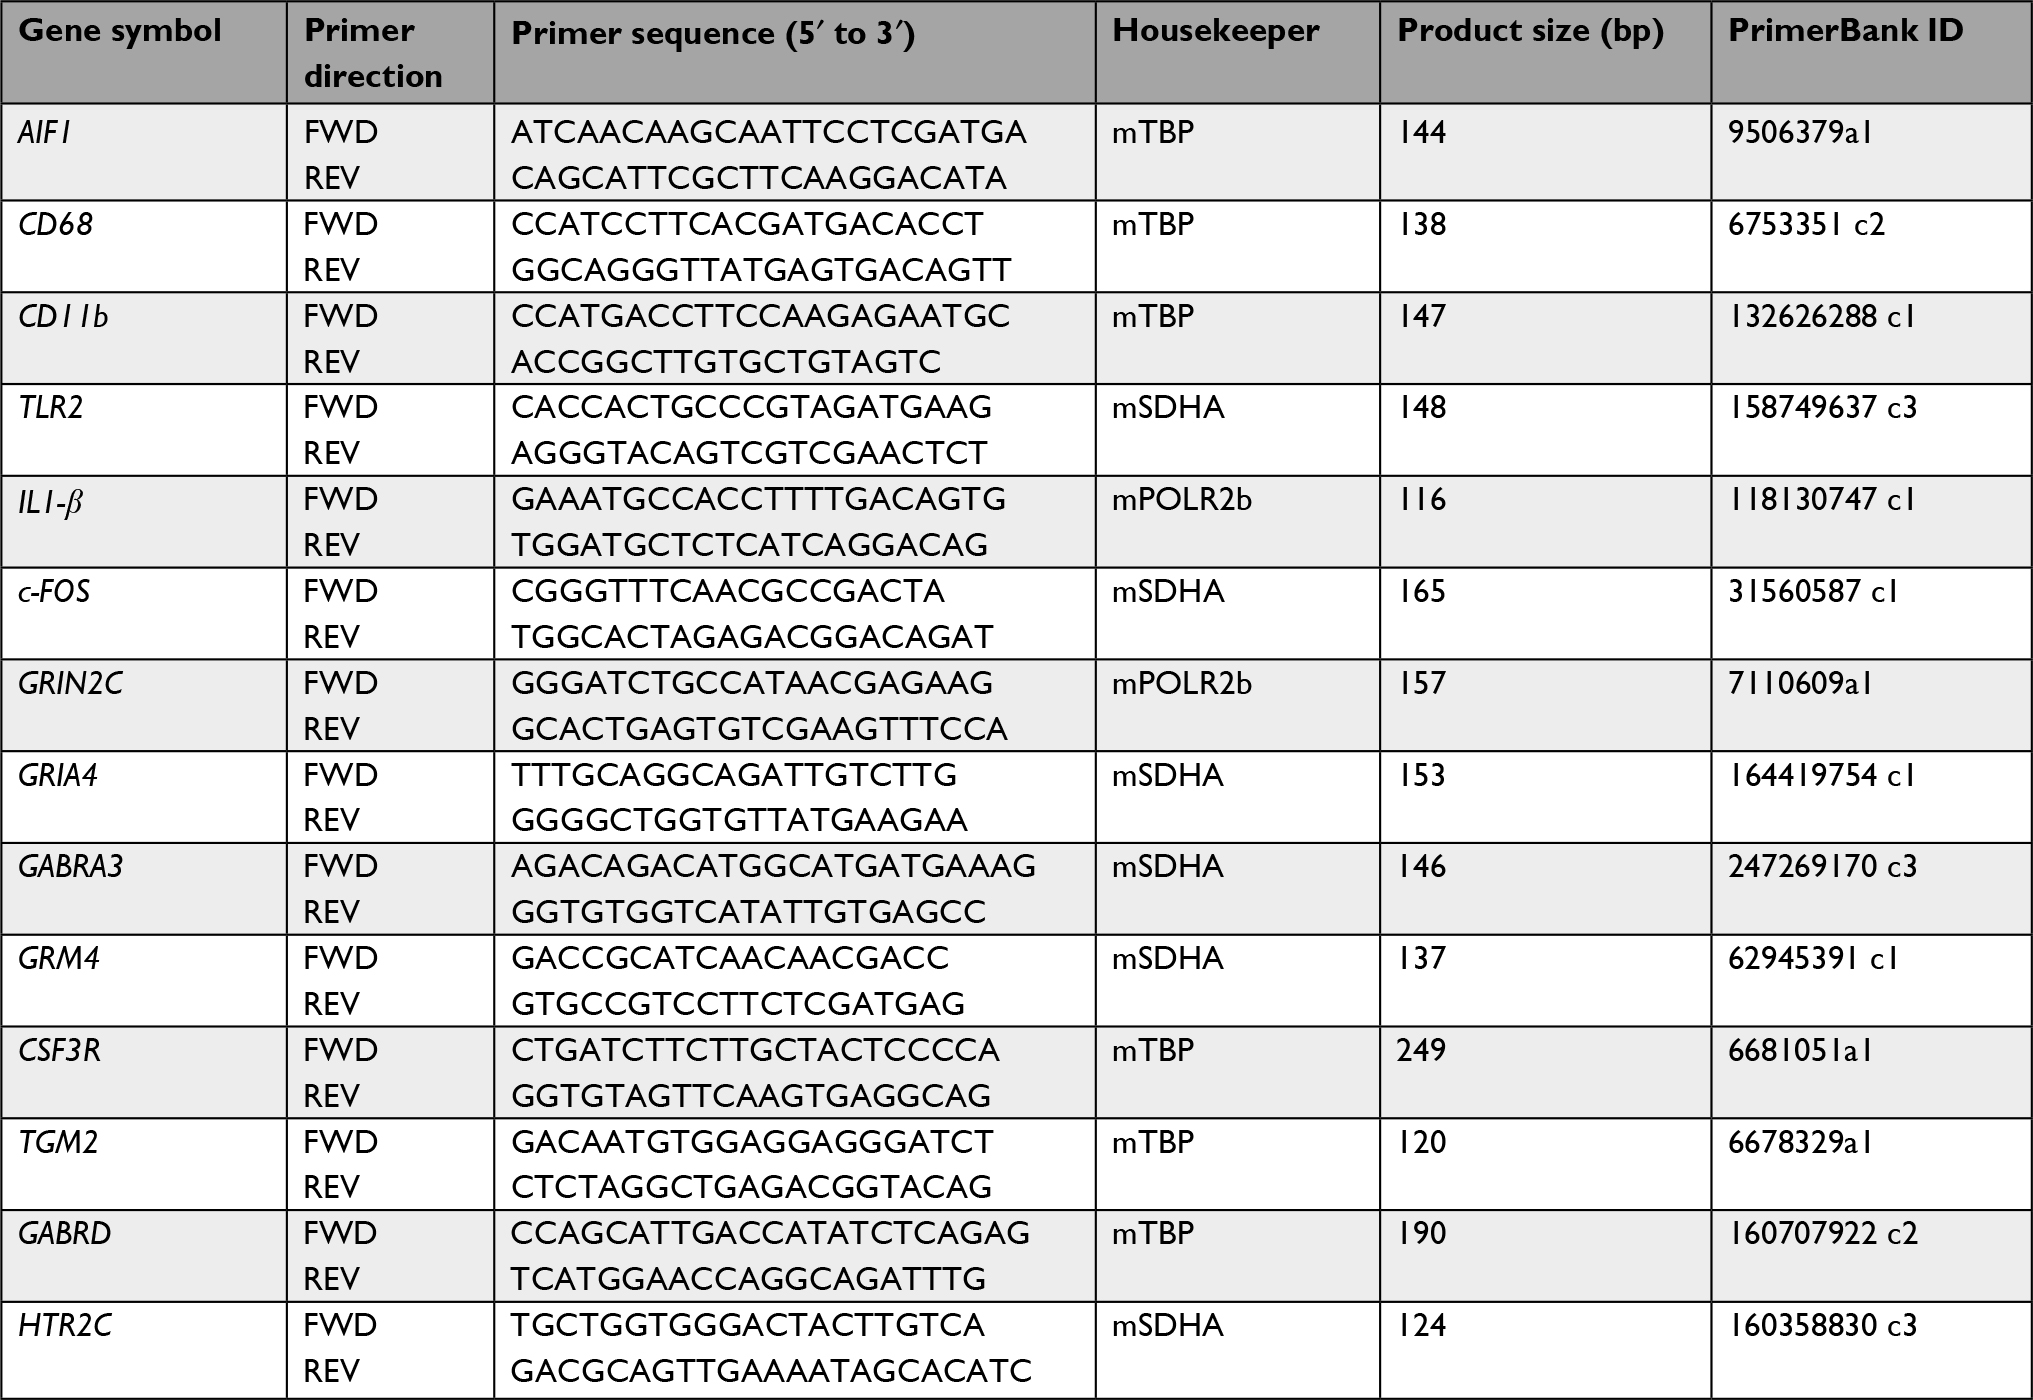 | Table 1 Primers used for relative qPCR analysis |
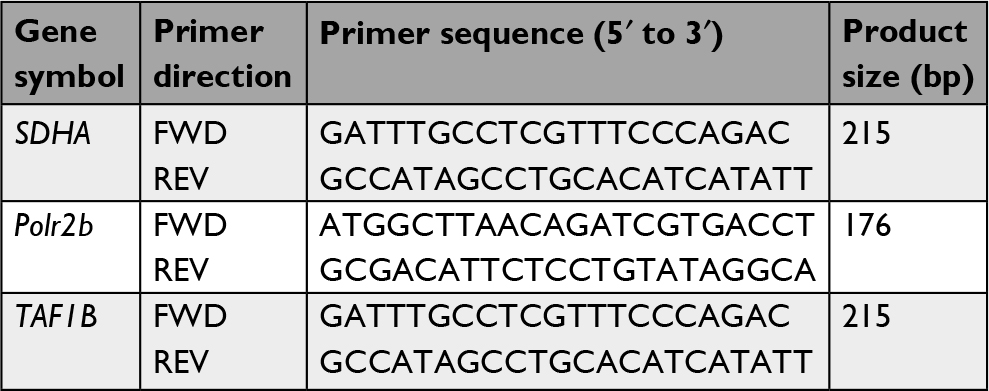 | Table 2 Housekeeping gene primers used for relative qPCR analysis |
Statistical analyses
Two-way (tumor × treatment) repeated measures ANOVA with Bonferroni post hoc planned comparisons were used to assess the effect of treatment on all behavioral outcomes. The DPA force recorded at paw withdrawal was expressed as the mean force of the five measurements collected on each test day and normalized to individual animal’s baseline values. A reduction in the force in the tumor-bearing limb relative to baseline was considered evidence of increased sensitivity in that limb manifested as an intentional limb withdrawal from the mechanical stimulus.
Chi-square analysis of the proportion of scores within each treatment group was used to assess radiographic analysis of osteolysis. Immunohistochemical staining of hematoxylin and eosin in hind limbs, and immunofluorescent co-staining of c-Fos and Iba1 at endpoint were qualitatively considered. Immunofluorescent staining of Iba1-positive activated microglia in DG and cornu ammonis 1 (CA1) regions of contralateral hippocampi throughout tumor progression was considered qualitatively and quantitated using Image J software;38 fluorescence levels were determined using the corrected total cell fluorescence method39 and frequency distributions at each time point were compared to that of sham controls using the Mann–Whitney U test. qPCR data were analyzed using the 2−ΔΔCT method,37 such that for each of the 14 target genes, the mean ΔCT for the three or four biological replicates in each group being compared was calculated as the mean cycle threshold (CT) of the target gene minus the mean CT of the respective housekeeping gene. For each pairwise comparison, ΔΔCT was then calculated as the mean ΔCT of the experimental group minus the ΔCT of the sham control, and the resulting ΔΔCT value was then converted to 2−ΔΔCT; in all pairwise comparisons of interest (IF tumor vs IF tumor + Pexidartinib; IF tumor vs SC tumor; and SC tumor vs SC tumor + Pexidartinib), fold changes were calculated relative to sham control group (n=1). To determine the overall experimental standard error of mean (SEM), SDs derived from the ΔCT values were converted to SEMs, which were used to calculate upper and lower values of 2−ΔΔCT. Data bars represent the mean (n=3, SC tumor group; n=4, IF tumor, IF tumor + Pexidartinib, and SC tumor + Pexidartinib groups) biological replicates relative to sham control, with error bars indicating SEM.
All analyses were performed using GraphPad Prism 7.0a software (GraphPad Software, Inc., La Jolla, CA, USA) and GraphPad Quick Cals; α was set at 0.05.
Results
Pexidartinib does not significantly alter tumor cell growth
Treatment with Pexidartinib (0.01–100 ng/mL) for 24 hours did not significantly affect murine 4T1 carcinoma cell number in vitro as measured by crystal violet stain (Figure 3), suggesting the effects seen in vivo were not attributable to drug effects on tumor cells themselves.
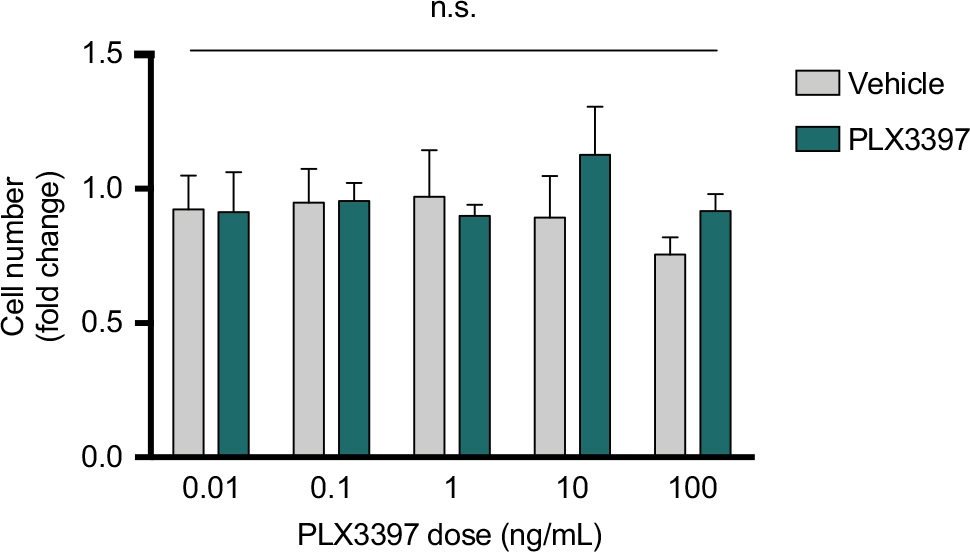 | Figure 3 CSF1R inhibition does not alter 4T1 breast cancer cell number in vitro. Notes: Cells were treated with Pexidartinib for 24 hours. Absorbance was read on a spectrophotometer optical plate reader at λ=570 nm, converted to cell number using a standard curve for 4T1 cells, and expressed as a fold change relative to naïve control wells on the same experimental plate. Abbreviation: n.s., not significant. |
Peripheral tumor increases activated microglia in DG and CA1
Immunofluorescent staining of Iba1+ cells in the hippocampus demonstrated robust changes in the morphology and number of microglia in the DG and CA1 regions (see Figure 4A,B for representative images of resting and activated states) over the course of IF tumor development (Figure 4B–E). Staining also revealed constitutive expression of Iba1 in sham mice (Figure 4F), with unaltered expression phenotype in SC tumor-bearing mice at day 20 (Figure 4G), and confirmed the ability of Pexidartinib to reach the intended target and ablate hippocampal microglia in vivo (Figure 4H). Serial coronal sections through DG and CA1 regions of the hippocampus were collected (~3 mm posterior to Bregma, as detailed in Figure 4I). Quantitatively, the presence of peripheral IF tumors was associated with significant increases in activated microglia on days 10, 15, and 20 in DG and days 15 and 20 in CA1 regions (Figure 4J).
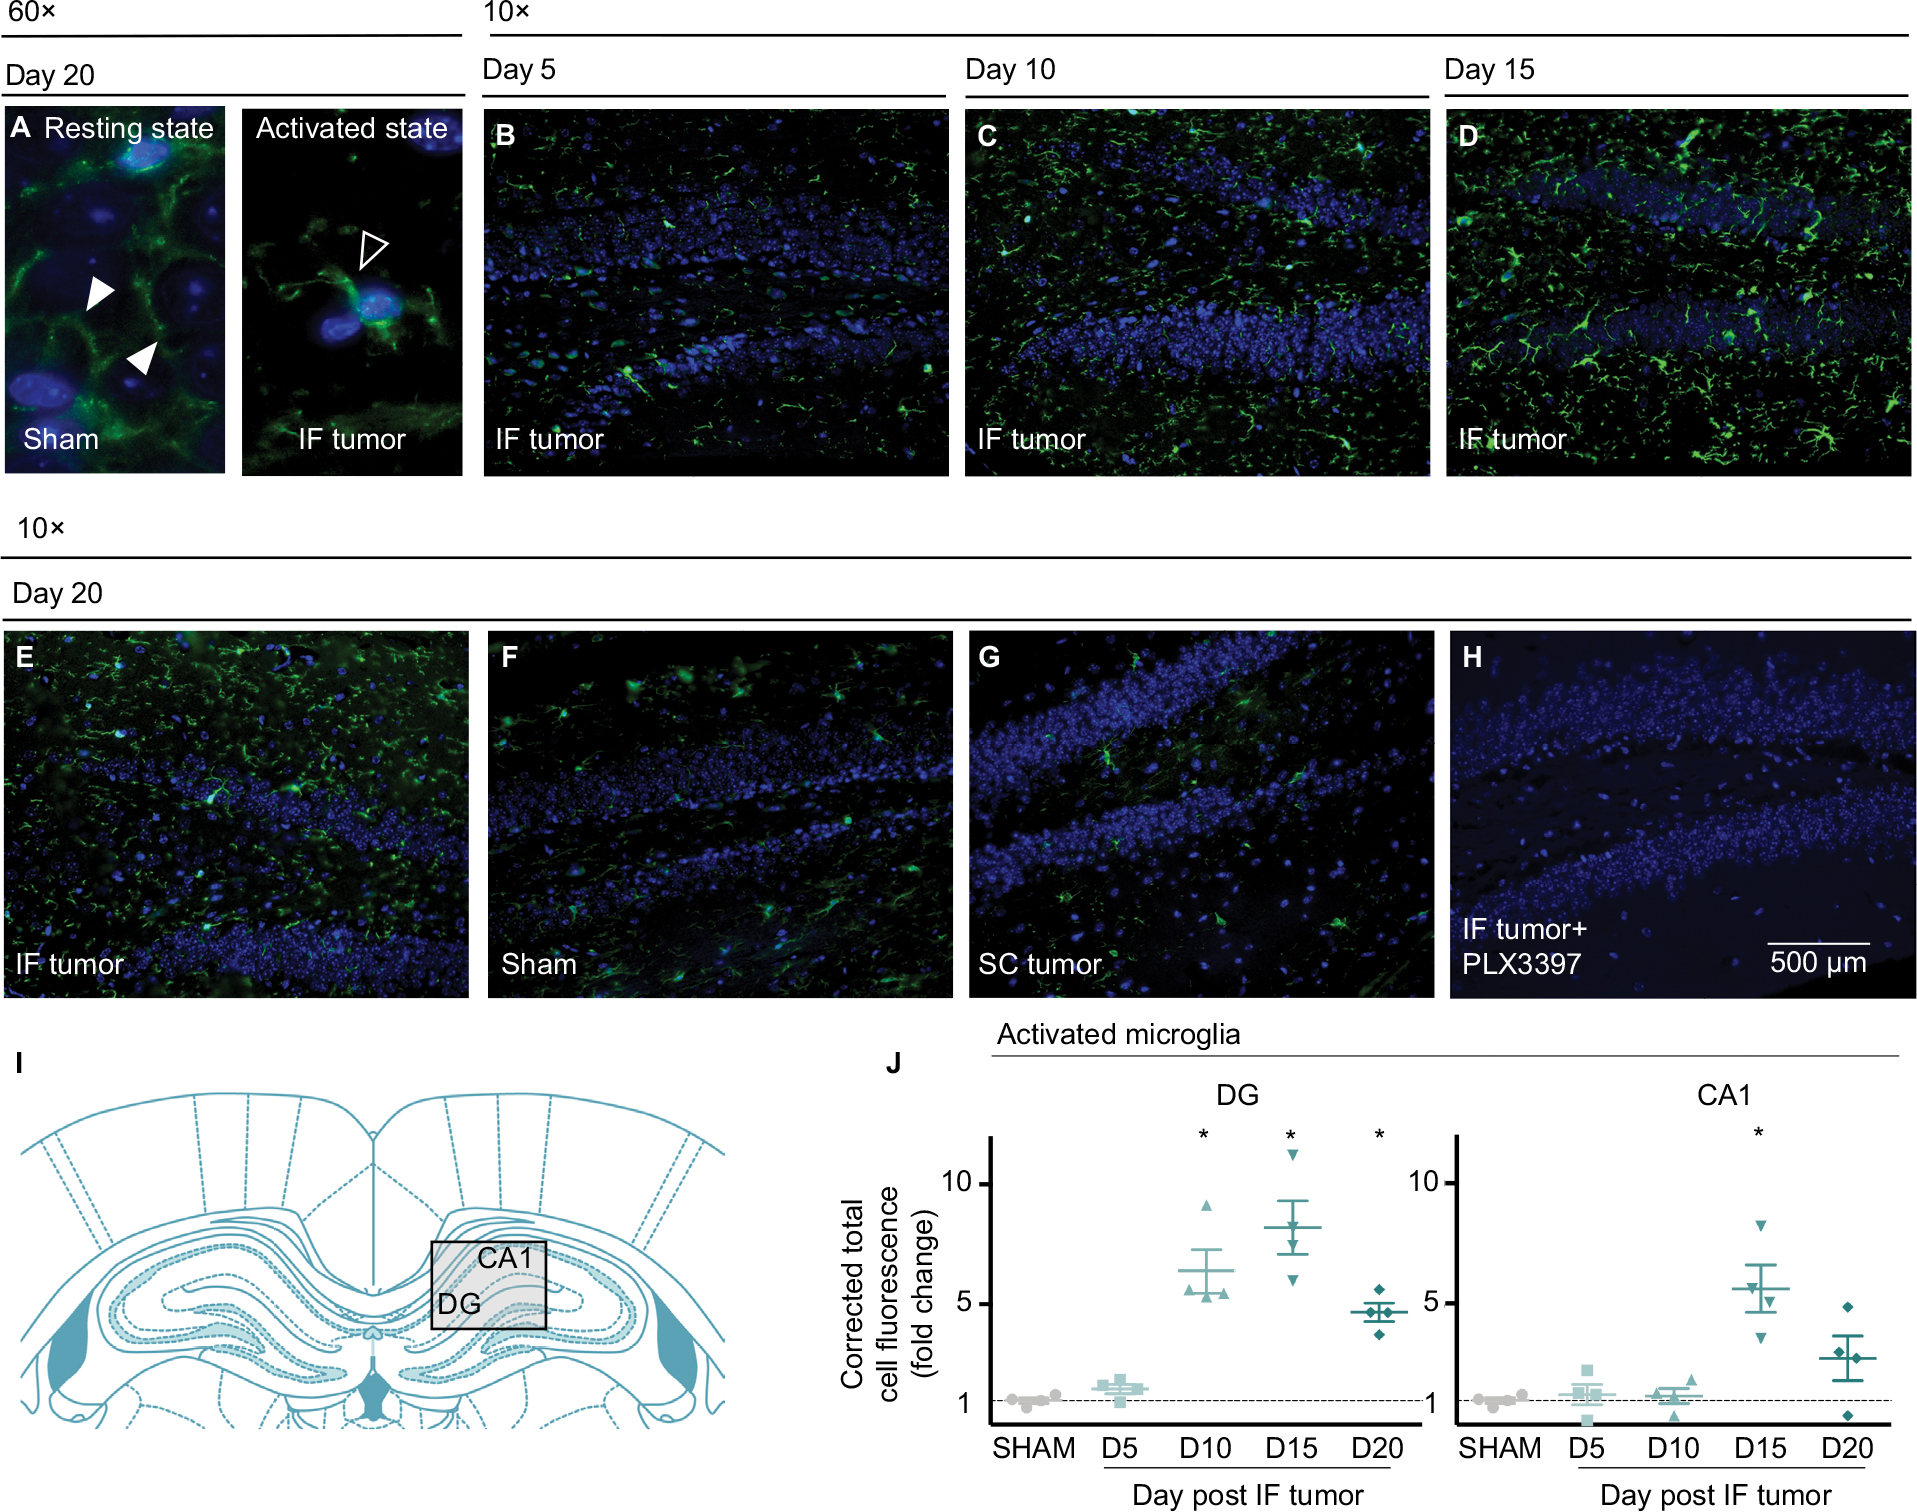 | Figure 4 Peripheral tumors increase activated microglia in hippocampal regions. Notes: Representative immunofluorescent confirmation of resting (A, left) and activated (A, right) microglia in sham and IF tumor-inoculated animals’ contralateral hippocampi at 60× magnification, white arrowheads indicate branched processes, characteristic of ramified microglia; black arrowheads indicate retracted processes, characteristic of activated microglia. Representative immunofluorescent staining of contralateral hippocampi throughout IF tumor progression (B–E), and sham (F), SC tumor (G), and IF tumor+ Pexidartinib (H) captures at endpoint (10× magnification). (I) Coronal sections through DG and CA1 regions of the hippocampus were collected (~3 mm posterior to Bregma. (J) Fold change: activated microglia in DG (left) and CA1 (right) regions of hippocampus throughout IF tumor progression relative to sham controls. Iba1+ staining in each region was quantitated using Image J, with corrected fluorescence levels determined using the CTCF method; n=4/group; points (J) represent CTCF-derived values within specified brain regions from individual animals; *P<0.05 represents significantly different from sham group, as determined by Mann–Whitney U test. Abbreviations: CA1, cornu ammonis 1; CTCF, corrected total cell fluorescence; DG, dentate gyrus; IF, intrafemoral; SC, subcutaneous. |
Immunocytochemical staining for Iba1+ cells on whole blood smears from Pexidartinib-treated animals confirmed the ability of the drug to ablate peripheral cells of macrophage linage (data not shown). No differences between sham and tumor-inoculated mice were observed in ipsilateral hippocampi or across prefrontal cortical regions (data not shown), suggesting that brain microgial activation increased in a region- and hemisphere-specific manner.
Peripheral tumor decreases hippocampal neural activity
Double-label immunofluorescent staining of Iba1 and c-Fos demonstrated a subtle trend toward lower c-Fos expression in the presence of greater Iba1 expression (Figure 5). The increased level of activated hippocampal microglia seen at endpoint in IF tumor group was associated with lower expression of regional c-Fos than sham and SC tumor groups, suggesting an inverse correlation between activated microglia and functional neural activity in the hippocampus of tumor-bearing animals.
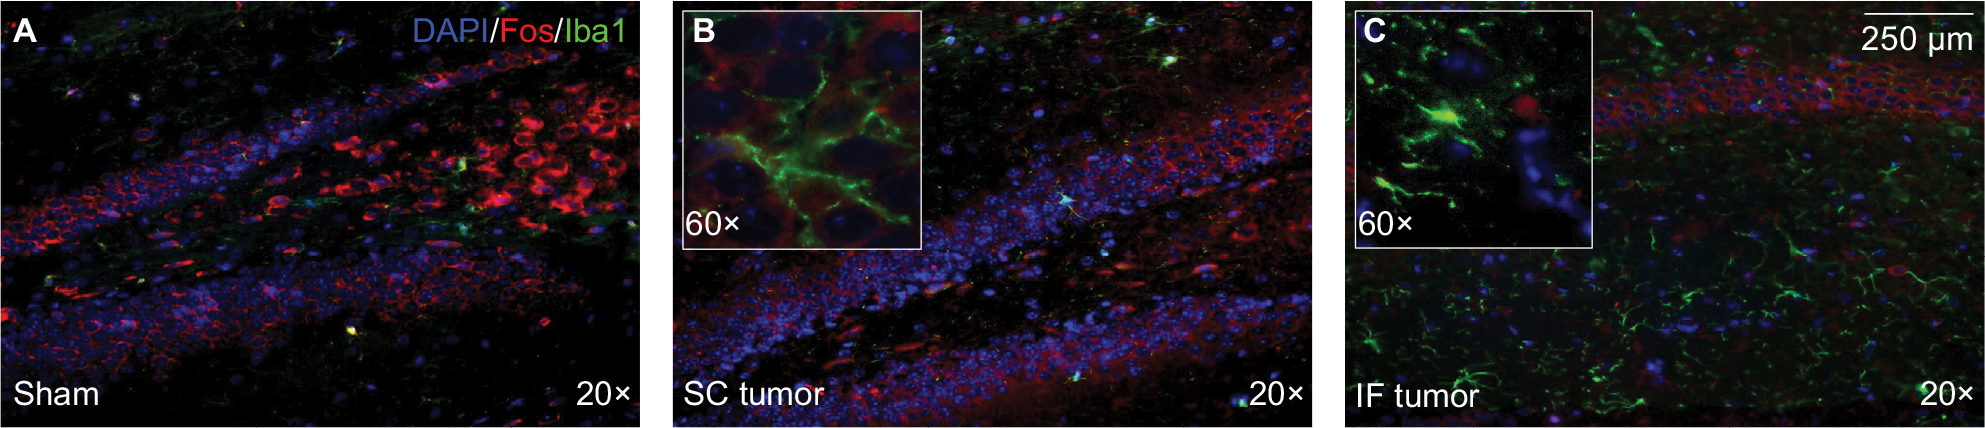 | Figure 5 Double-label immunofluorescent staining of Iba1 (green) and c-Fos (red), depicting activated microglia and functional neural activity, respectively, in the contralateral hippocampus of sham (A), SC (B), and IF (C) tumor-bearing animals. Notes: Captures were collected at endpoint (day 20 post tumor inoculation) at 20× magnification (inserts depict 60× magnification). Coronal sections through the hippocampus were collected (~3 mm posterior to Bregma using The Rat Brain in stereotaxic coordinates by Paxinos and Watson).59 Abbreviations: IF, intrafemoral; SC, subcutaneous. |
Pexidartinib attenuates tumor-induced nociceptive behaviors
IF tumor-inoculated mice demonstrated significantly greater spontaneous nociception relative to sham controls from days 9 and 13 post tumor cell inoculation until endpoint, as measured by Spontaneous Guarding and Limb Use, respectively. Eliminating microglia with Pexidartinib delayed the onset and severity of spontaneous nociception, as demonstrated by recovered limb use and dramatically reduced guarding behavior relative to untreated mice (Figure 6A,B, respectively). Similarly, in the DPA, tumor-inoculated mice exhibited significantly greater evoked nociceptive behaviors relative to sham controls from day 9 through endpoint, and ablating microglia with Pexidartinib significantly inhibited tumor-induced behavioral decline, as measured by attenuated hyperalgesia through experimental endpoint (Figure 7).
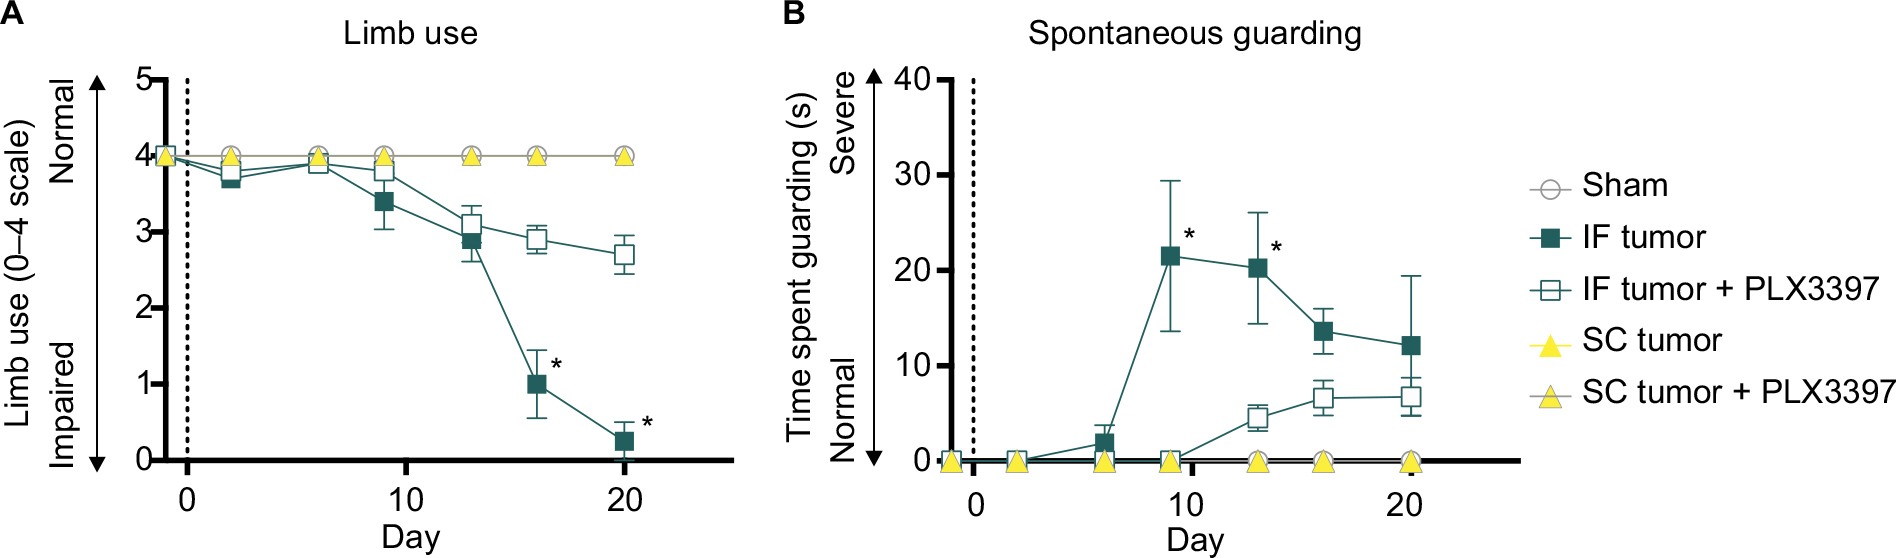 | Figure 6 Pexidartinib decreases spontaneous nociceptive behaviors. Notes: (A) Quantification of limb use in affected femurs throughout tumor progression. Normal hind limb use during spontaneous ambulation was observed and scored on a scale of 4–0: 4 – normal use, 3 – pronounced limp, 2 – limp and guarding behavior, 1 – partial nonuse of the limb in locomotor activity, and 0 – complete lack of limb use. (B) The time spent spontaneously guarding the hind paw represented ongoing pain and was recorded during a 2-minute open field observation period. Guarding time was defined as the time (S) the hind paw was held aloft while ambulatory. Points indicate mean ± SEM; *significantly different from sham controls, α=0.05; vertical dashed line indicates IF injections (day 0). Abbreviations: IF, intrafemoral; SC, subcutaneous; SEM, standard error of mean. |
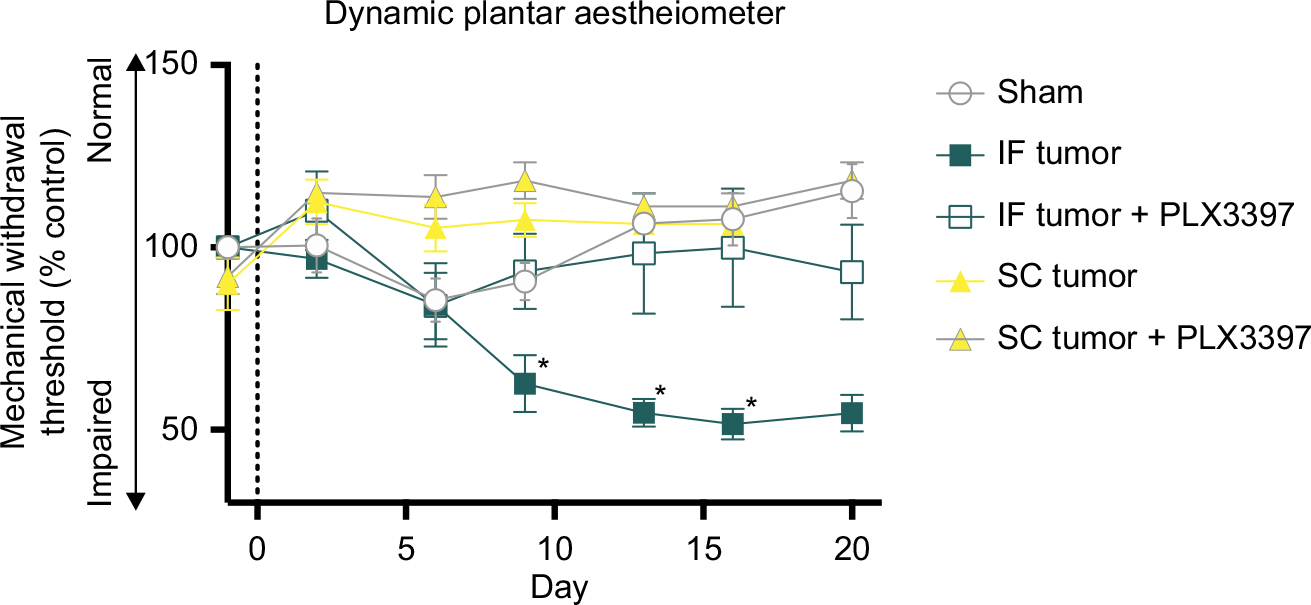 | Figure 7 Pexidartinib decreases evoked nociceptive behaviors. Notes: The DPA test quantitates evoked nociceptive behaviors by measuring the threshold force at which animals withdraw from a progressive stimulus applied to the plantar surface of the affected hind paw. Thus, 100% on the y-axis is equivalent to baseline behavior prior to tumor inoculation; <100% indicates a decrease in the force withstood by the tumor-bearing limb. Points indicate mean ± SEM; *significantly different from SHAM, α=0.05; vertical dashed lines indicate IF injections (day 0). Abbreviations: DPA, dynamic plantar aesthesiometer; IF, intrafemoral; SC, subcutaneous; SEM, standard error of mean. |
Pexidartinib does not significantly alter tumor invasion
Radiographic analysis confirmed the presence of bone degradation in cancer cell-inoculated mice at endpoint (see Figure 8A–C for representative images); Pexidartinib did not appear to significantly alter the extent of tumor-induced osteolysis (χ2 =0.896, P=0.484; see Figure 8D). Hematoxylin and eosin staining of affected hind limbs confirmed the presence of tumor cells in femurs of animals that demonstrated lytic lesions by X-ray; tumor invasion was most frequently observed in the distal epiphysis and diaphysis of affected femurs (data not shown).
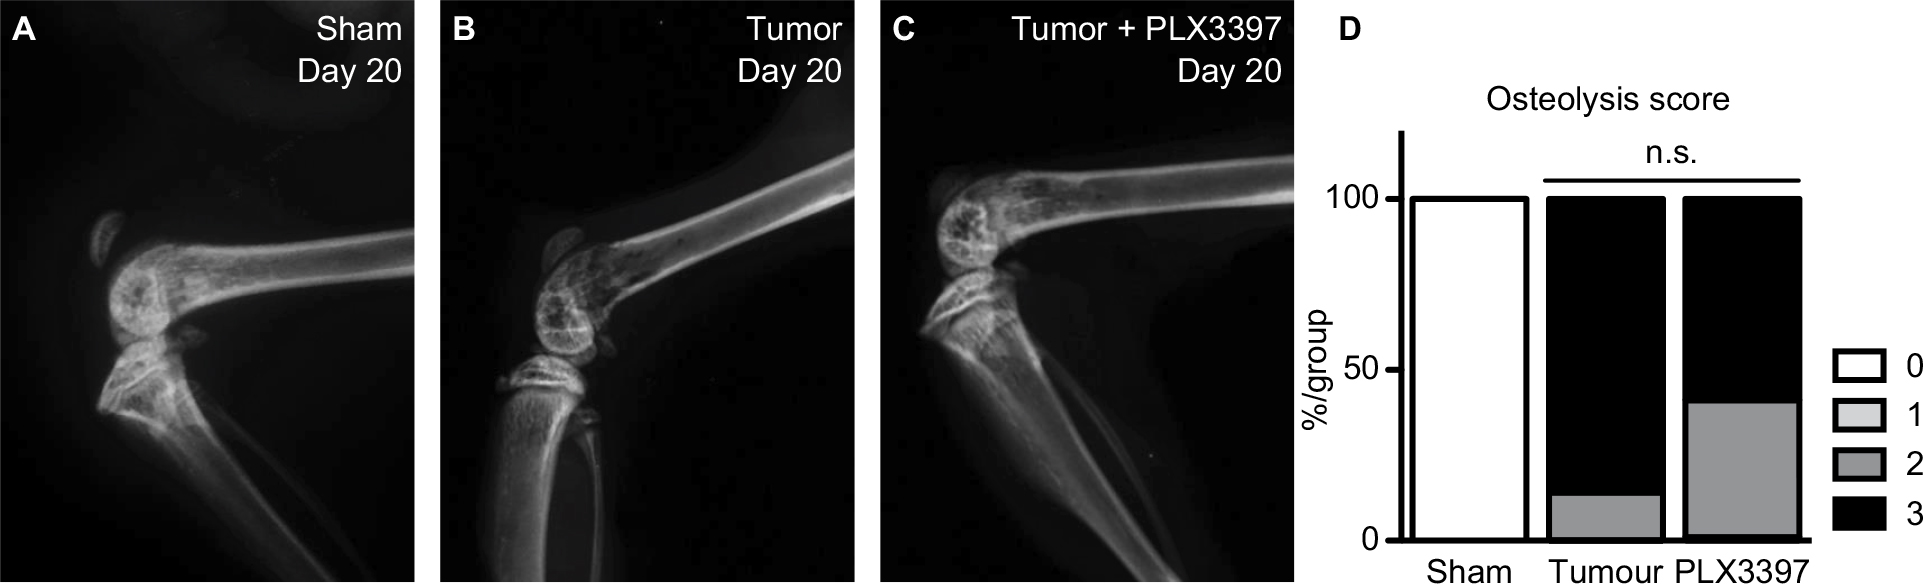 | Figure 8 Pexidartinib does not alter tumor-induced femoral osteolysis. Notes: (A–D) Quantification of bone osteolysis in tumor-bearing femurs on day 20 post tumor cell inoculation. Representative images indicate advanced tumor growth and consequent bone destruction in sham (A), vehicle- (B), and Pexidartinib-treated (C) tumor-inoculated mice as quantified by a 0–3 numerical scale. Radiographic Lesion Score numbers represent: 0 – normal bone, no visible lesion; 1 – minor loss of bone density, minimal lesion; 2 – moderate to substantial loss of bone density, lesion limited to bone trabeculae and cortex; 3 – substantial loss of bone density, lesion includes clear periosteal involvement and/or fracture. (D) Osteolytic scores expressed as total percent per treatment group in each score category at endpoint. *P<0.05, as determined by chi-square analysis, α=0.05; N=8/group. Abbreviation: n.s., not significant. |
Peripheral tumor alters hippocampal mRNA
qPCR confirmed the dramatic increase in hippocampal microglia in tumor-bearing animals at endpoint (day 20), as demonstrated across multiple microglial markers at the mRNA level, including AIF1 (Iba1), CD68, and CD11b (Figure 9A–C). Furthermore, IF tumor-bearing mice demonstrated greater levels of hippocampal microglial markers at the mRNA level relative to SC tumor-bearing mice, suggesting that the site of peripheral metastasis contributes to microglial activation in the hippocampus. Treatment with Pexidartinib dramatically reduced hippocampal microglia mRNA across both tumor-bearing models (Figure 9A–C), confirming the ability of the drug to abolish microglia in vivo. Hippocampal mRNA levels of the toll-like receptor 2 (TLR2) and pro-inflammatory cytokine IL-1β were also affected by peripheral tumor, with increases in hippocampal TLR2 and IL-1β mRNA in IF tumor-bearing mice relative to sham, a trend that was abolished by treatment with Pexidartinib (Figure 9D,E). Pexidartinib also slightly reversed marginal IF and SC tumor-induced decreases in c-Fos mRNA (Figure 9F).
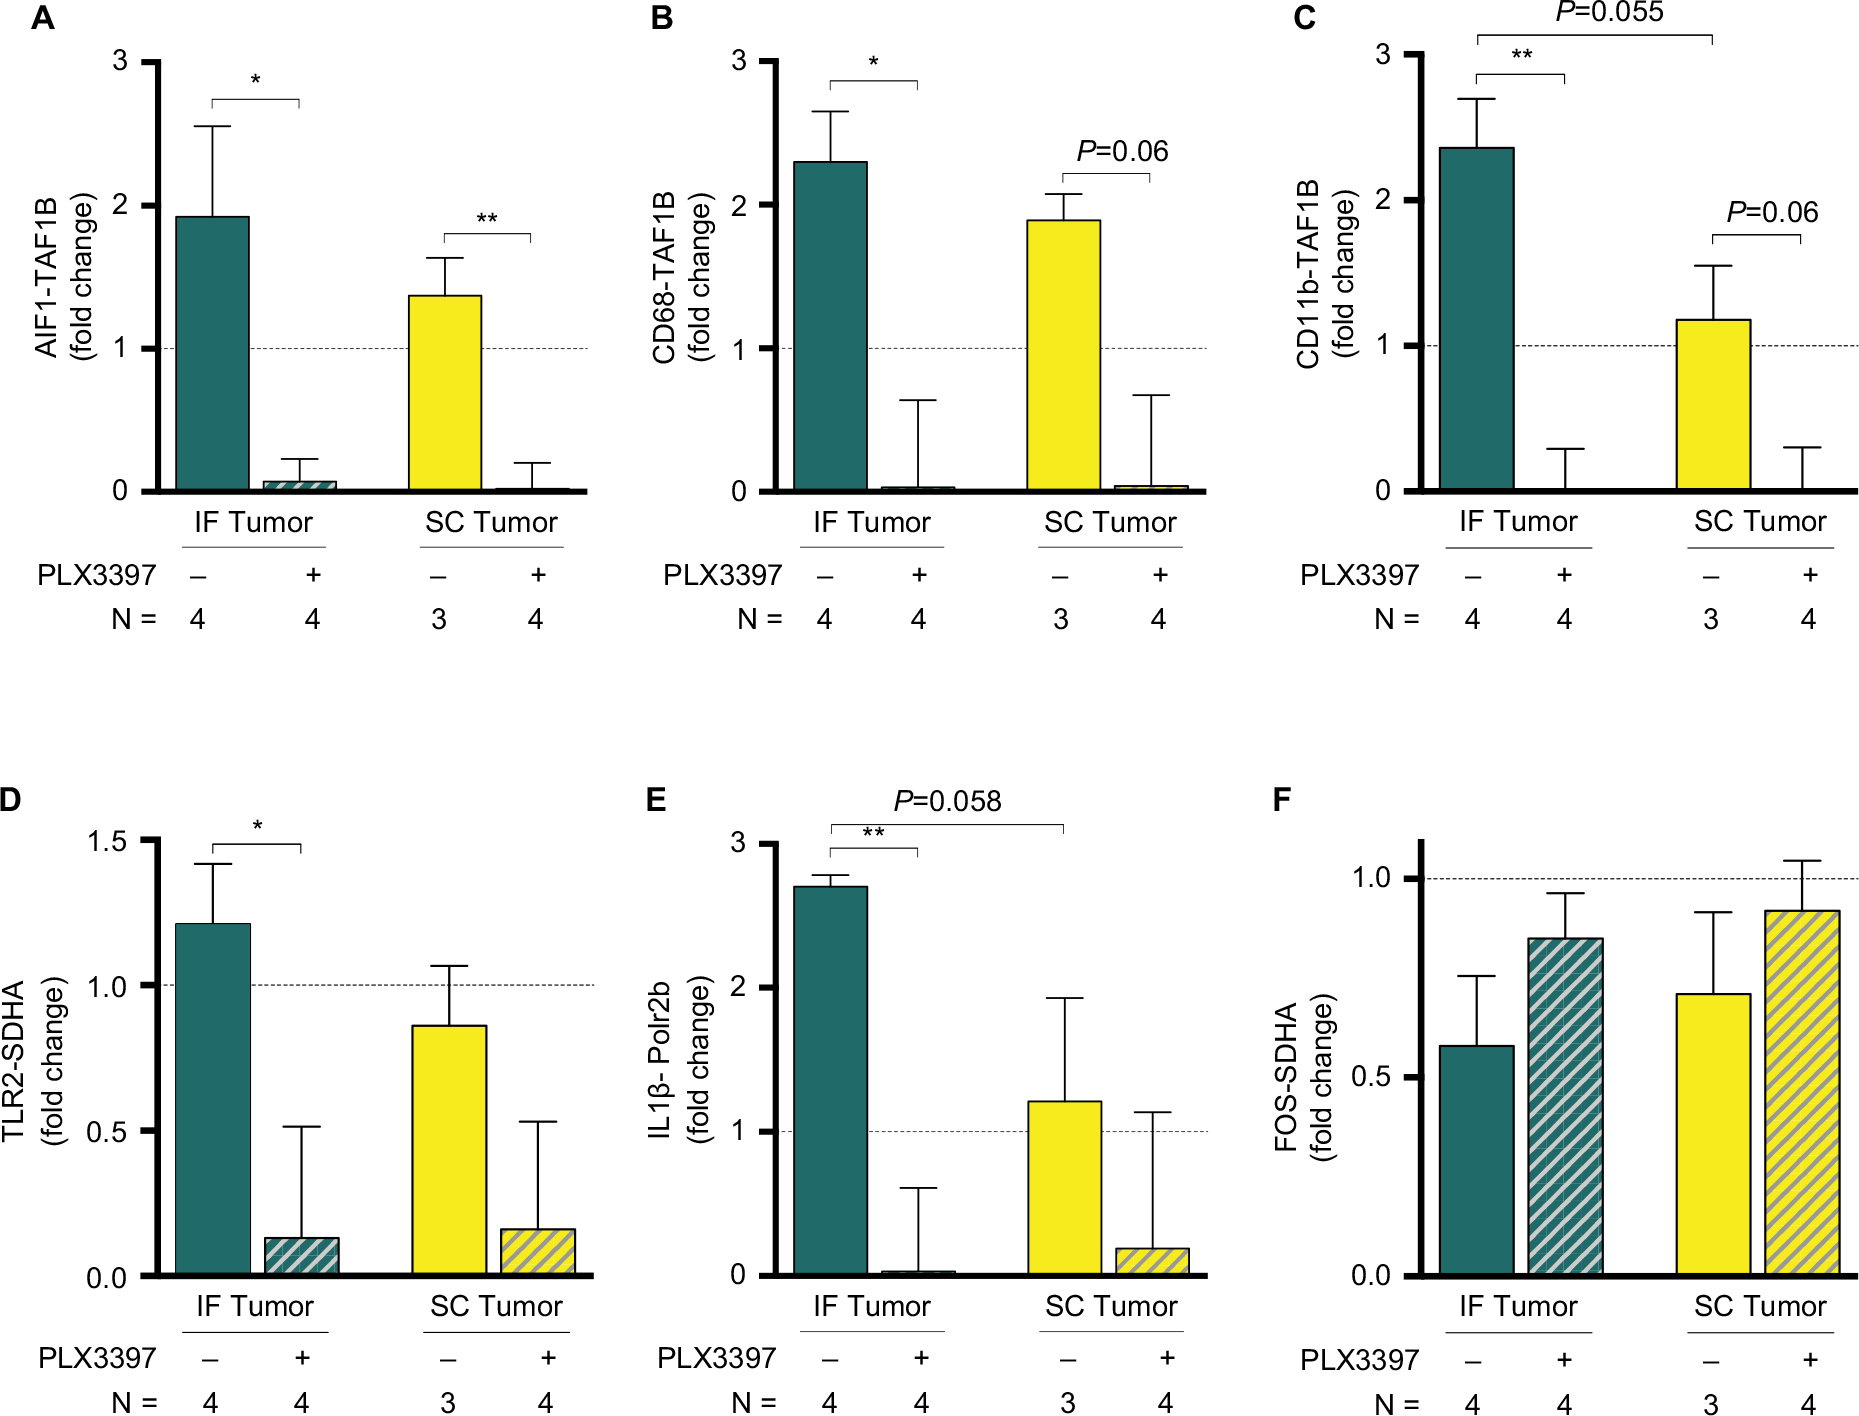 | Figure 9 IF tumors increase hippocampal microglial markers. Notes: (A–C) qPCR confirmed the dramatic increase of hippocampal microglia in tumor-bearing mice, as demonstrated by microglial markers allograft inflammatory factor 1/ionized calcium-binding adapter molecule 1 (AIF1/Iba1), CD68, and CD11b; treatment with the CSF1R inhibitor Pexidartinib dramatically reduced hippocampal microglia across IF and SC tumor-bearing models. IF tumor-bearing mice demonstrated significantly higher levels of hippocampal microglial mRNA relative to SC tumor-bearing mice. (D–F) Factors associated with microglial activation were also affected by peripheral tumor, including TLR2, IL-1β, and the immediate-early gene c-Fos. Bars represent the mean of three or four biological replicates as a fold change relative to sham (n=1), with error bars indicating SEM. *P<0.05 and **P<0.01, as determined by planned pairwise comparisons. Abbreviations: IF, intrafemoral; SC, subcutaneous; SEM, standard error of mean; TLR2, toll-like receptor 2. |
Several mRNA targets previously reported to be related to cancer- and drug-induced depression were affected by peripheral tumor in the present study, demonstrating parallel outcomes to those previously reported in SC tumor-bearing mice,20 with these effects being amplified in IF tumor-bearing mice. In particular, GluRs and glutamatergic modulators present on microglia (glutamate ionotropic receptor NMDA type subunit 2C [Grin2c], glutamate ionotropic receptor AMPA type subunit 4 [Gria4], gamma-aminobutyric acid type A receptor alpha 3 subunit [Gabra3], and glutamate metabotropic receptor 4 [Grm4]) were reduced across Pexidartinib- and control-treated IF and SC tumor groups, with the exception of increased Grin2c mRNA in IF tumor-bearing mice relative to sham. Colony stimulating factor 3 Receptor (CSF3r) and transglutaminase 2 (Tgm2) mRNA levels followed a similar pattern across treatment groups, with Pexidartinib abolishing IF and SC tumor-induced increases in mRNA, while gamma-aminobutyric acid type A receptor delta subunit (GABRD) mRNA levels were reduced across all groups relative to sham, and 5-hydroxytryptamine type 2C receptor (Htr2c) mRNA levels were reduced in IF tumor mice, with Pexidartinib reversing this effect (Figure 10). Given the relatively small group sizes used in this assay (n=3, SC tumor group; n=4 IF tumor, IF tumor + Pexidartinib, and SC tumor + Pexidartinib groups), no significant differences were observed within secondary mRNA targets (Grin2c, Gria4, Csf3r, Tgm2, Gabra3, Grm4, Gabrd, and Htr2c), and therefore only trends are offered within these planned comparisons.
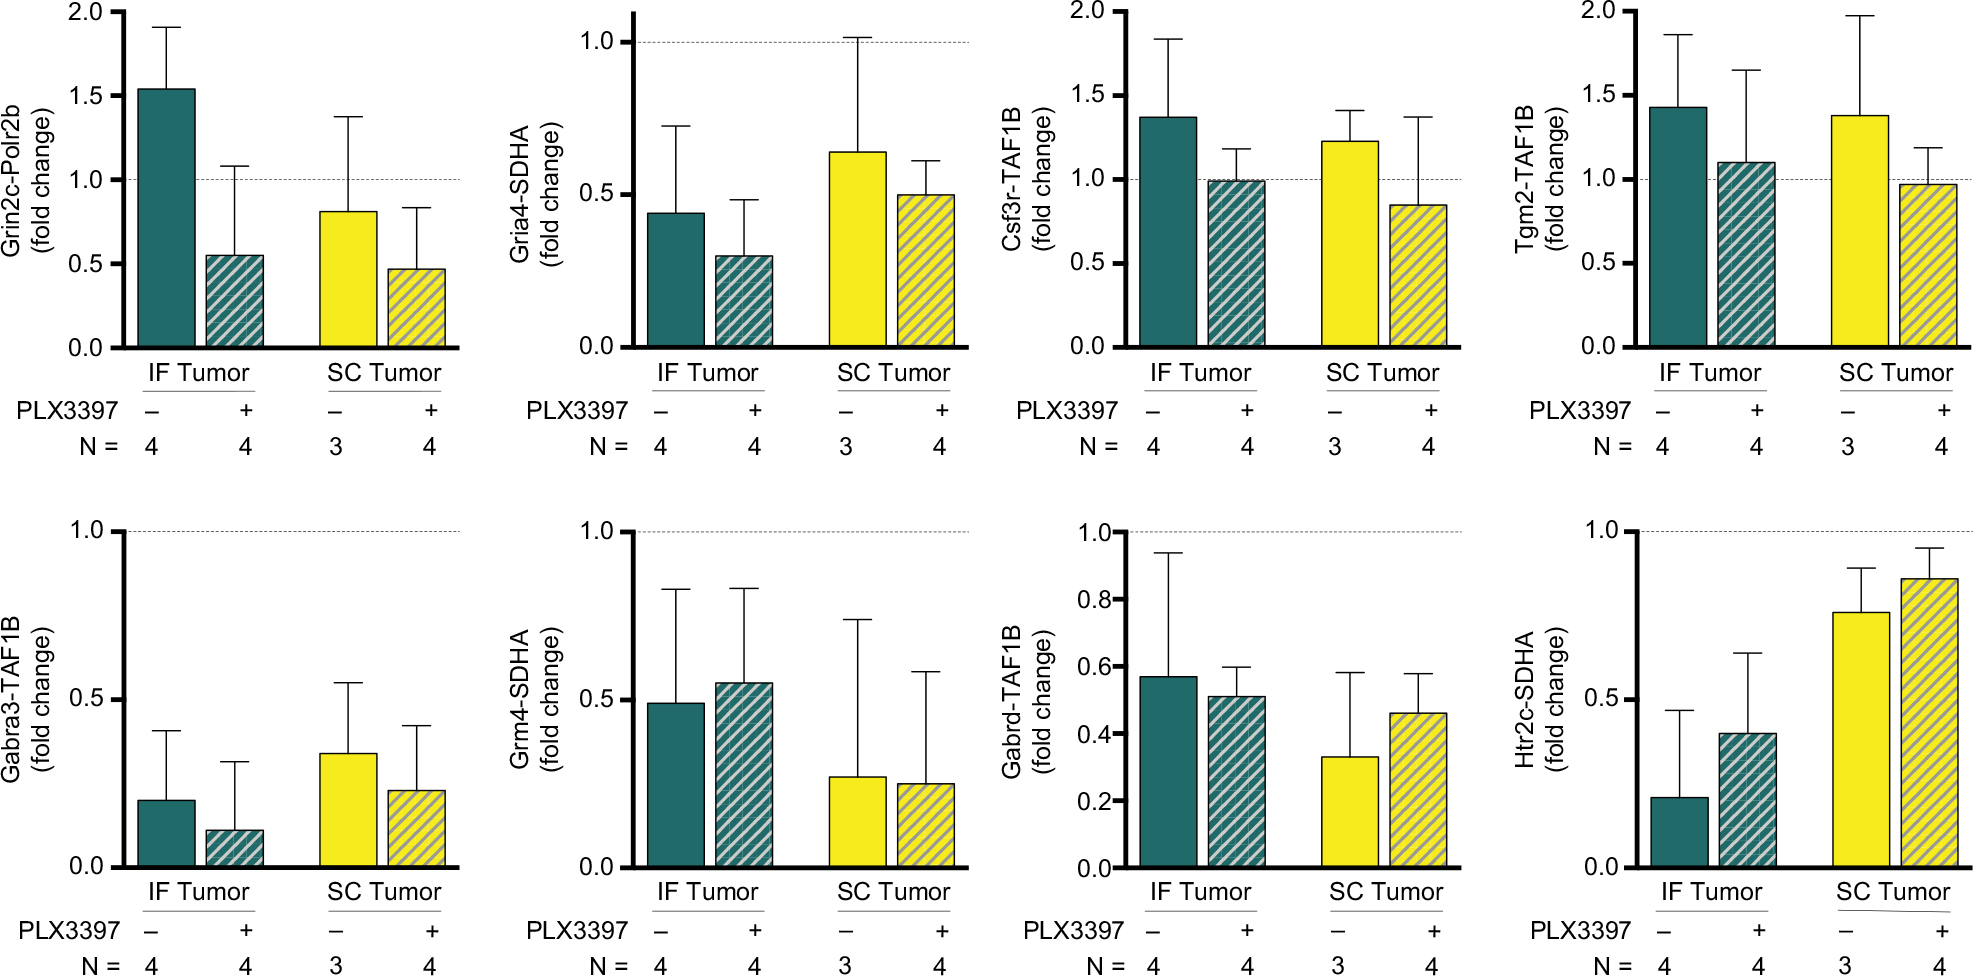 | Figure 10 Peripheral tumors alter select hippocampal mRNA. Notes: Secondary mRNA targets are affected by IF and SC tumors (glutamate ionotropic receptor NMDA type subunit 2C, Grin2c; glutamate ionotropic receptor AMPA type subunit 4, Gria4; colony stimulating factor 3 receptor, CSF3r; gamma-aminobutyric acid type A receptor alpha 3 subunit, Gabra3; transglutaminase 2, Tgm2; glutamate metabotropic receptor 4, Grm4; gamma-aminobutyric acid type A receptor delta subunit, GABRD; 5-hydroxytryptamine type 2C receptor, Htr2c). Bars represent the mean of three or four biological replicates as a fold change relative to sham (n=1), with error bars indicating SEM. Abbreviations: IF, intrafemoral; SC, subcutaneous; SEM, standard error of mean. |
Discussion
In the present study, we have demonstrated that activated Iba1+ microglia increase in the hippocampus as IF tumors progress in our validated murine model of CIP. Furthermore, globally eliminating microglia with the CSF1R inhibitor Pexidartinib delays the onset and severity of spontaneous and evoked cancer-induced nociception, and abolishes various tumor-induced aberrancies in microglia-associated mRNA marker levels within the hippocampus.
CSF1R is a key regulator of myeloid lineage cells and is required for microglial survival in the adult brain. Under normal conditions, microglia are the only cell type that express the CSF1R in the brain.32,40 Chronic treatment with the CSF1R inhibitor Pexidartinib has been shown to transiently eliminate virtually all microglia in the CNS, with no behavioral or cognitive impairments and without compromise of the blood brain barrier. In the present study, immunofluorescent staining of Iba1 confirmed the ability of Pexidartinib to ablate microglia in specific regions of the brain, and qPCR quantification of microglial markers Iba1, CD68, and CD11b from hippocampal mRNA further supported this finding.
In accordance with several murine models of CIP,31,35,41 IF inoculation of 4T1 murine mammary carcinoma cells produced dramatic and lasting nociceptive behaviors, while SC inoculation of the same cells did not yield nociception, as assessed by current behavioral assays, suggesting that the host tissue, rather than the mere presence of peripheral tumor, is intimately involved in the development of pain behaviors. It should be noted that the current behavioral assays selected to quantify nociceptive behaviors primarily examine hind limb nociception, as measured by limb use, paw withdrawal, and limb guarding. As such, SC tumor-bearing mice may have experienced nociception beyond that measured, as skin is highly innervated, and SC tumors were administered directly under the skin.
Inhibition of microglia with Pexidartinib delayed the onset and severity of sustained nociceptive behaviors in IF tumor-bearing mice, adding to the body of literature that implicates microglia in the pain state associated with bone metastasis.27,28,30,42–44 This is the first study to demonstrate inhibition of CIP by targeting CSF1R. Given that this model utilized breast cancer cells to establish IF and SC tumors, only female mice were used in an effort to translate to a clinically relevant population. However, previous studies have established an immune cell-related sexual dimorphism, such that spinal microglia were required for the development of neuropathic pain hypersensitivity in male, but not in female mice.45 While this effect may be dependent on several elements, including model- and strain-specific factors, additional murine studies in both males and females could further explore the role of region-specific microglial activation across various models of CIP.
Hippocampal microglial activation appeared highly correlated to the development of IF and SC tumors, with the effect being particularly pronounced in IF tumor-bearing mice. Temporal increases in nociceptive behaviors in IF tumor-bearing mice roughly mirrored microglial activation in hippocampal regions, with peak microglial activation occurring on day 15 post tumor cell inoculation, and morphological changes present as early as day 5 following tumor inoculation. Thus, microglial processes appeared retracted (see Figure 4A,B for representative instances), and fluorescent staining of Iba1 appeared brighter as tumors progressed, indicative of increased microglial activation.46 Interestingly, microglial activation in the dorsal horn of the spinal cord has been shown to peak 2 weeks following induction of bone cancer pain in a rat model,27 and a study assessing the effects of colon carcinoma cell-induced peripheral tumor demonstrated hippocampal dysfunction, including such affective measures as memory impairment and depression-like behaviors.47 To our knowledge, this is the first study that illustrates the relationship between hippocampal microglia and CIP.
Our lab previously demonstrated overlap in hippocampal mRNA changes within validated murine models of a classic depressive-like state and CID.19,20 Analysis of hippocampal mRNA from the present model of CIP demonstrated considerable overlap of select mRNA targets with that of mice from models of both corticosterone- and cancer-induced depressive states,20 including cell signaling and neurotransmission modulators present on microglia.
In the present study, qPCR results demonstrated a dramatic increase in multiple microglial markers in IF tumor-bearing mice relative to sham controls. It has been suggested that Iba1 is the most suitable early activation marker in considering morphological fluctuations in microglia, as Iba1 staining is inclusive of slender protrusions of ramified microglia, while CD68 and CD11b are widely expressed across various activation stages.46 Several other hippocampal factors were affected by IF and SC tumor, including TLR2 and IL-1β, both of which appeared to increase in mice with IF, but not SC tumor. mRNA levels of the immediate early gene c-Fos were also affected by the presence of tumor, such that IF tumor, and to a lesser extent, SC tumor, were associated with lower hippocampal c-Fos expression, a marginal effect which was mitigated by microglial inhibition.
Hippocampal abnormalities, including decreased hippocampal volume, are demonstrated in clinical cases of depression,48 and comorbidity between chronic pain and depression has been repeatedly established.49–53 One way by which hippocampal volume may be decreased in cases of pain or depression is via nerve death from excitotoxic factors secreted by microglia. That is, in pathological conditions, the state of chronically activated microglia switches from characteristically neuroprotective to neurotoxic (reviewed in Block et al54). Indeed, hippocampal expression of the c-Fos protein, a marker of functional neural activity, is dramatically reduced in CA1, CA3, and DG regions of the hippocampus in a formalin-induced model of inflammatory pain, corresponding to increased nociceptive behaviors.8 Immunofluorescent co-staining of c-Fos and Iba1 from the present study and a trend toward changes at the mRNA level of hippocampal c-Fos are in line with this, suggesting that parallel mechanisms may mediate these pain states.
The present study adds to a growing body of literature that implicates the hippocampus in the nociceptive and affective dimensions of pain. In clinical observation, electrical stimulation of the hippocampus has been shown to evoke painful sensations in humans,55 and micro-injection of the local anesthetic lidocaine into the DG mitigates formalin-induced nociception in rats.9 Furthermore, when injected into DG and CA1 regions, the competitive and noncompetitive NMDA receptor antagonists AP5 and MK801 reduce acute and persistent nociceptive behaviors in a model of chronic pain.10,11 One means by which hippocampal microglia may contribute to nociception is through the secretion of cytotoxic levels of glutamate, which are known to be released by microglia during states of chronic activation.56,57 Microglia are heterogeneously distributed within the adult mouse brain, with particular density in hippocampal regions,40 and the hippocampus modulates affective and motivational properties of the nucleus accumbens and forebrain through glutamatergic inputs (reviewed in Fasick et al and Neugebauer15,58). Future studies may further explore these pathways and their relationship to glutamate-mediated CIP.
In the present study, ablating microglia delayed the onset and severity of IF cancer-induced nociceptive behaviors. Furthermore, tumor-induced nociceptive behaviors appeared to progress in parallel with microglial activation in the DG and CA1 regions of the hippocampus, adding to the body of literature that implicates the hippocampus in the development and maintenance of CIP, and implicating hippocampal microglia in this response. Cumulatively, this is the first experimental evidence that demonstrates the effects of peripheral tumor on hippocampal microglial activation in relation to cancer-related nociception in female mice. However, it is important to appreciate the limitations of this study; we recognize that several other potential mechanisms may be driving CIP, including spinal and non-hippocampal brain microglia, and we suggest that hippocampal microglia may be one contributing factor to this pain state.
Conclusion
The increase in hippocampal microglia observed in the present study may reflect the emotional and cognitive problems reported by patients with CIP. Given the complexity of CIP and comorbidity between chronic pain conditions and mood disorders, it is essential to consider pathways implicated in the cognitive and affective aspects of pain processing in parallel with ascending and descending sensory pathways in the development of CIP therapeutics.
Acknowledgments
The authors wish to thank Plexxikon for supplying the CSF1R inhibitor Pexidartinib. This work was supported by the Canadian Breast Cancer Foundation to G.S.
Disclosure
The authors report no conflicts of interest in this work.
References
Murray F, Smith DW, Hutson PH. Chronic low dose corticosterone exposure decreased hippocampal cell proliferation, volume and induced anxiety and depression like behaviours in mice. Eur J Pharmacol. 2008;583(1):115–127. | ||
Eisch AJ, Petrik D. Depression and hippocampal neurogenesis: a road to remission? Science. 2012;338(6103):72–75. | ||
Legrain V, Iannetti GD, Plaghki L, Mouraux A. The pain matrix reloaded: a salience detection system for the body. Prog Neurobiol. 2011;93(1):111–124. | ||
Zhao XY, Liu MG, Yuan DL, et al. Nociception-induced spatial and temporal plasticity of synaptic connection and function in the hippocampal formation of rats: a multi-electrode array recording. Mol Pain. 2009;5:55. | ||
Al Amin HA, Atweh SF, Jabbur SJ, Saadé NE. Effects of ventral hippocampal lesion on thermal and mechanical nociception in neonates and adult rats. Eur J Neurosci. 2004;20(11):3027–3034. | ||
Echeverry MB, Guimarães FS, del Bel EA. Acute and delayed restraint stress-induced changes in nitric oxide producing neurons in limbic regions. Neuroscience. 2004;125(4):981–993. | ||
Favaroni Mendes LA, Menescal-de-Oliveira L. Role of cholinergic, opioidergic and GABAergic neurotransmission of the dorsal hippocampus in the modulation of nociception in guinea pigs. Life Sci. 2008;83(19–20):644–650. | ||
Khanna S, Chang LS, Jiang F, Koh HC. Nociception-driven decreased induction of Fos protein in ventral hippocampus field CA1 of the rat. Brain Res. 2004;1004(1–2):167–176. | ||
McKenna JE, Melzack R. Analgesia produced by lidocaine microinjection into the dentate gyrus. Pain. 1992;49(1):105–112. | ||
McKenna JE, Melzack R. Blocking NMDA receptors in the hippocampal dentate gyrus with AP5 produces analgesia in the formalin pain test. Exp Neurol. 2001;172(1):92–99. | ||
Soleimannejad E, Naghdi N, Semnanian S, Fathollahi Y, Kazemnejad A. Antinociceptive effect of intra-hippocampal CA1 and dentate gyrus injection of MK801 and AP5 in the formalin test in adult male rats. Eur J Pharmacol. 2007;562(1–2):39–46. | ||
Soleimannejad E, Semnanian S, Fathollahi Y, Naghdi N. Microinjection of ritanserin into the dorsal hippocampal CA1 and dentate gyrus decrease nociceptive behavior in adult male rat. Behav Brain Res. 2006;168(2):221–225. | ||
Yamamotová A, Franĕk M, Vaculín S, St’astný F, Bubeníková-Valesová V, Rokyta R. Different transfer of nociceptive sensitivity from rats with postnatal hippocampal lesions to control rats. Eur J Neurosci. 2007;26(2):446–450. | ||
McEwen BS. Plasticity of the hippocampus: adaptation to chronic stress and allostatic load. Ann N Y Acad Sci. 2001;933(1):265–277. | ||
Fasick V, Spengler RN, Samankan S, Nader ND, Ignatowski TA. The hippocampus and TNF: common links between chronic pain and depression. Neurosci Biobehav Rev. 2015;53:139–159. | ||
Bushnell MC, Čeko M, Low LA. Cognitive and emotional control of pain and its disruption in chronic pain. Nat Rev Neurosci. 2013;14(7):502–511. | ||
Liu M-G, Chen J. Roles of the hippocampal formation in pain information processing. Neurosci Bull. 2009;25(5):237–266. | ||
Simons LE, Elman I, Borsook D. Psychological processing in chronic pain: a neural systems approach. Neurosci Biobehav Rev. 2014;39:61–78. | ||
Nashed MG, Seidlitz EP, Frey BN, Singh G. Depressive-like behaviours and decreased dendritic branching in the medial prefrontal cortex of mice with tumors: a novel validated model of cancer-induced depression. Behav Brain Res. 2015;294:25–35. | ||
Nashed MG, Linher-Melville K, Frey BN, Singh G. RNA-sequencing profiles hippocampal gene expression in a validated model of cancer-induced depression. Genes Brain Behav. 2016;15(8):711–721. | ||
Murugan M, Ling EA, Kaur C. Glutamate receptors in microglia. CNS Neurol Disord Drug Targets. 2013;12(6):773–784. | ||
Czeh M, Gressens P, Kaindl AM. The yin and yang of microglia. Dev Neurosci. 2011;33(3–4):199–209. | ||
Mosser DM, Edwards JP. Exploring the full spectrum of macrophage activation. Nat Rev Immunol. 2008;8(12):958–969. | ||
Ito D, Imai Y, Ohsawa K, Nakajima K, Fukuuchi Y, Kohsaka S. Microglia-specific localisation of a novel calcium binding protein, iba1. Brain Res Mol Brain Res. 1998;57(1):1–9. | ||
Hanisch UK. Microglia as a source and target of cytokines. Glia. 2002;40(2):140–155. | ||
Tang Y, Le W. Differential roles of M1 and M2 microglia in neurodegenerative diseases. Mol Neurobiol. 2016;53(2):1181–1194. | ||
Yang Y, Li H, Li TT, et al. Delayed activation of spinal microglia contributes to the maintenance of bone cancer pain in female Wistar rats via P2X7 receptor and IL-18. J Neurosci. 2015;35(20):7950–7963. | ||
Hu JH, Yang JP, Liu L, et al. Involvement of CX3CR1 in bone cancer pain through the activation of microglia p38 MAPK pathway in the spinal cord. Brain Res. 2012;1465:1–9. | ||
Bu H, Shu B, Gao F, et al. Spinal IFN-γ-induced protein-10 (CXCL10) mediates metastatic breast cancer-induced bone pain by activation of microglia in rat models. Breast Cancer Res Treat. 2014;143(2):255–263. | ||
Jin D, Yang JP, Hu JH, Wang LN, Zuo JL. MCP-1 stimulates spinal microglia via PI3K/Akt pathway in bone cancer pain. Brain Res. 2015;1599:158–167. | ||
Miladinovic T, Ungard RG, Linher-Melville K, Popovic S, Singh G. Functional effects of TrkA inhibition on system x C−-mediated glutamate release and cancer-induced bone pain. Mol Pain. 2018;14:1744806918776467. | ||
Elmore MR, Najafi AR, Koike MA, et al. Colony-stimulating factor 1 receptor signaling is necessary for microglia viability, unmasking a microglia progenitor cell in the adult brain. Neuron. 2014;82(2):380–397. | ||
Luger NM, Honore P, Sabino MA, et al. Osteoprotegerin diminishes advanced bone cancer pain. Cancer Res. 2001;61(10):4038–4047. | ||
Nirogi R, Goura V, Shanmuganathan D, Jayarajan P, Abraham R. Comparison of manual and automated filaments for evaluation of neuropathic pain behavior in rats. J Pharmacol Toxicol Methods. 2012;66(1):8–13. | ||
Ungard RG, Seidlitz EP, Singh G. Inhibition of breast cancer-cell glutamate release with sulfasalazine limits cancer-induced bone pain. Pain. 2014;155(1):28–36. | ||
Wang T, Liang ZA, Sandford AJ, et al. Selection of suitable housekeeping genes for real-time quantitative PCR in CD4(+) lymphocytes from asthmatics with or without depression. PLoS One. 2012;7(10):e48367. | ||
Livak KJ, Schmittgen TD. Analysis of relative gene expression data using real-time quantitative PCR and the 2((–Delta Delta C(T)) method. Methods. 2001;25(4):402–408. | ||
Abramoff MD, Magalhães PJ, Ram SJ. Image processing with ImageJ. Biophotonics Int. 2004;11(7):36–41. | ||
Jensen EC. Quantitative analysis of histological staining and fluorescence using ImageJ. Anat Rec. 2013;296(3):378–381. | ||
Lawson LJ, Perry VH, Dri P, Gordon S. Heterogeneity in the distribution and morphology of microglia in the normal adult mouse brain. Neuroscience. 1990;39(1):151–170. | ||
Jimenez-Andrade JM, Ghilardi JR, Castañeda-Corral G, Kuskowski MA, Mantyh PW. Preventive or late administration of anti-NGF therapy attenuates tumor-induced nerve sprouting, neuroma formation, and cancer pain. Pain. 2011;152(11):2564–2574. | ||
Hald A, Nedergaard S, Hansen RR, Ding M, Heegaard A-M. Differential activation of spinal cord glial cells in murine models of neuropathic and cancer pain. Eur J Pain. 2009;13(2):138–145. | ||
Zhang RX, Liu B, Wang L, et al. Spinal glial activation in a new rat model of bone cancer pain produced by prostate cancer cell inoculation of the tibia. Pain. 2005;118(1–2):125–136. | ||
Huo W, Zhang Y, Liu Y, et al. Dehydrocorydaline attenuates bone cancer pain by shifting microglial M1/M2 polarization toward the M2 phenotype. Mol Pain. 2018;14(1):174480691878173. | ||
Sorge RE, Mapplebeck JCS, Rosen S, et al. Different immune cells mediate mechanical pain hypersensitivity in male and female mice. Nat Neurosci. 2015;18(8):1081–1083. | ||
Hendrickx DAE, van Eden CG, Schuurman KG, Hamann J, Huitinga I. Staining of HLA-DR, Iba1 and CD68 in human microglia reveals partially overlapping expression depending on cellular morphology and pathology. J Neuroimmunol. 2017;309:12–22. | ||
Yang M, Kim J, Kim JS, et al. Hippocampal dysfunctions in tumor-bearing mice. Brain Behav Immun. 2014;36:147–155. | ||
Cole J, Costafreda SG, McGuffin P, Fu CH, Chy F. Hippocampal atrophy in first episode depression: a meta-analysis of magnetic resonance imaging studies. J Affect Disord. 2011;134(1–3):483–487. | ||
Gore M, Sadosky A, Stacey BR, Tai KS, Leslie D. The burden of chronic low back pain: clinical comorbidities, treatment patterns, and health care costs in usual care settings. Spine (Phila Pa 1976). 2012;37(11):E668–E677. | ||
Apkarian AV, Mutso AA, Centeno MV, et al. Role of adult hippocampal neurogenesis in persistent pain. Pain. 2016;157(2):418–428. | ||
Mutso AA, Radzicki D, Baliki MN, et al. Abnormalities in hippocampal functioning with persistent pain. J Neurosci. 2012;32(17):5747–5756. | ||
Elman I, Borsook D, Volkow ND. Pain and suicidality: insights from reward and addiction neuroscience. Prog Neurobiol. 2013;109:1–27. | ||
Asmundson GJG, Katz J. Understanding the co-occurrence of anxiety disorders and chronic pain: state-of-the-art. Depress Anxiety. 2009;26(10):888–901. | ||
Block ML, Zecca L, Hong J-S. Microglia-mediated neurotoxicity: uncovering the molecular mechanisms. Nat Rev Neurosci. 2007;8(1):57–69. | ||
Halgren E, Walter RD, Cherlow DG, Crandall PH. Mental phenomena evoked by electrical stimulation of the human hippocampal formation and amygdala. Brain. 1978;101(1):83–115. | ||
Piani D, Frei K, Do KQ, Cuénod M, Fontana A. Murine brain macrophages induced NMDA receptor mediated neurotoxicity in vitro by secreting glutamate. Neurosci Lett. 1991;133(2):159–162. | ||
Piani D, Spranger M, Frei K, Schaffner A, Fontana A. Macrophage-induced cytotoxicity of N-methyl-D-aspartate receptor positive neurons involves excitatory amino acids rather than reactive oxygen intermediates and cytokines. Eur J Immunol. 1992;22(9):2429–2436. | ||
Neugebauer V. Amygdala pain mechanisms. Handb Exp Pharmacol. 2015;227:261–284. | ||
Paxinos G, Watson C. The Rat Brain in Stereotaxic Coordinates. 6th ed. Cambridge, MA: Academic Press; 2007. |
 © 2019 The Author(s). This work is published and licensed by Dove Medical Press Limited. The full terms of this license are available at https://www.dovepress.com/terms.php and incorporate the Creative Commons Attribution - Non Commercial (unported, v3.0) License.
By accessing the work you hereby accept the Terms. Non-commercial uses of the work are permitted without any further permission from Dove Medical Press Limited, provided the work is properly attributed. For permission for commercial use of this work, please see paragraphs 4.2 and 5 of our Terms.
© 2019 The Author(s). This work is published and licensed by Dove Medical Press Limited. The full terms of this license are available at https://www.dovepress.com/terms.php and incorporate the Creative Commons Attribution - Non Commercial (unported, v3.0) License.
By accessing the work you hereby accept the Terms. Non-commercial uses of the work are permitted without any further permission from Dove Medical Press Limited, provided the work is properly attributed. For permission for commercial use of this work, please see paragraphs 4.2 and 5 of our Terms.