")
Back to Journals » Neuropsychiatric Disease and Treatment » Volume 13
Accurately identifying patients who are excellent candidates or unsuitable for a medication: a novel approach
Authors South C, Rush AJ , Carmody TJ, Jha MK, Trivedi MH
Received 13 April 2017
Accepted for publication 31 August 2017
Published 15 December 2017 Volume 2017:13 Pages 3001—3010
DOI https://doi.org/10.2147/NDT.S139577
Checked for plagiarism Yes
Review by Single anonymous peer review
Peer reviewer comments 2
Editor who approved publication: Dr Roger Pinder
Charles South,1–3 A John Rush,4,* Thomas J Carmody,1–3 Manish K Jha,1,2 Madhukar H Trivedi1,2,*
1Center for Depression Research and Clinical Care, 2Department of Psychiatry, 3Department of Clinical Sciences, University of Texas Southwestern Medical Center, Dallas, TX, USA; 4Department of Psychiatry and Behavioral Sciences, Duke-National University of Singapore, Singapore; Duke Medical School, Durham, NC, USA
*These authors contributed equally to this work
Objective: The objective of the study was to determine whether a unique analytic approach – as a proof of concept – could identify individual depressed outpatients (using 30 baseline clinical and demographic variables) who are very likely (75% certain) to not benefit (NB) or to remit (R), accepting that without sufficient certainty, no prediction (NP) would be made.
Methods: Patients from the Combining Medications to Enhance Depression Outcomes trial treated with escitalopram (S-CIT) + placebo (n=212) or S-CIT + bupropion-SR (n=206) were analyzed separately to assess replicability. For each treatment, the elastic net was used to identify subsets of predictive baseline measures for R and NB, separately. Two different equations that estimate the likelihood of remission and no benefit were developed for each patient. The ratio of these two numbers characterized likely outcomes for each patient.
Results: The two treatment cells had comparable rates of remission (40%) and no benefit (22%). In S-CIT + bupropion-SR, 11 were predicted NB of which 82% were correct; 26 were predicted R – 85% correct (169 had NP). For S-CIT + placebo, 13 were predicted NB – 69% correct; 44 were predicted R – 75% correct (155 were NP). Overall, 94/418 (22%) patients were identified with a meaningful degree of certainty (69%–85% correct). Different variable sets with some overlap were predictive of remission and no benefit within and across treatments, despite comparable outcomes.
Conclusion: In two separate analyses with two different treatments, this analytic approach – which is also applicable to pretreatment laboratory tests – identified a meaningful proportion (over 20%) of depressed patients for whom a treatment outcome was predicted with sufficient certainty that the clinician can elect to strongly recommend for or choose to avoid a particular treatment. Different persons seem to be remitting or not benefiting with these two different treatments.
Keywords: patient selection, depression, elastic net, analytic approach, treatment response
Introduction
Depression is disabling, common, and heterogeneous with regard to both etiology and treatment response. Our treatments are moderately effective,1 but not everyone responds to the same treatments in the same way.2–8 This variation in treatment responsiveness (response heterogeneity) among depressed patients is thought to reflect etiological and biological heterogeneity of the depressive syndrome.7 To address response heterogeneity, clinical practice guidelines9–11 are used but clinicians still often need to try more than medication(s) to find the most effective, least burdensome selection for each patient.5
To date, various efforts to reduce treatment selection uncertainty have made use of a range of baseline sociodemographic and clinical features – but with only very modest success – to identify individual patients who would do either well or poorly with a particular treatment. These studies typically characterize every person in the sample using all the baseline variables that differentiate those who respond from those who do not based on a single equation that weights the predictor variables to maximally differentiate these two groups (e.g., refer to the studies by Trivedi et al1 and Papakostas et al12).
This approach may rest on two potentially dubious assumptions. First, the reasons for response may be distinct from those that explain non-response to any one medication. However, the development of a single predictor equation that uses the same variables to predict response and non-response implicitly assumes that the same features associated with success are also associated with failure. For example, therapeutic blood levels, comorbid psychiatric or general medical conditions, age, biological subtypes, and other features may act differentially to affect the likelihood of good vs poor outcomes with any single treatment.
It is entirely possible that each patient has some features that favor benefiting from a treatment and other features (perhaps overlapping or distinct) that favor not benefiting much at all. If different features are associated with no benefit and others with great benefit, the ratio of the likelihood of these outcomes derived from the different features may be a more accurate way of taking these diverse features into account in order to estimate each patient’s likely outcome with a specific treatment. These considerations lead us to create and evaluate – as a proof of concept – a different analytic approach.
A second consideration was the need to make predictions upon which the clinician could act. By definition, actionable predictions should have a clearly defined outcome (either no benefit or remission, e.g.) and the prediction made should carry rather low uncertainty, which we defined as at least 75% correct a priori.13–15 In other words, if either remission or no meaningful benefit could be predicted for a particular patient with a reasonably high certainty, the clinician could strongly encourage or actually avoid (for those with a high chance of no benefit) a particular treatment. We have previously employed analogous approaches with baseline neuropsychological tests.13–16
Identifying individuals who have rather certain outcomes (either no benefit or remission) will, by necessity, require the creation of three groups: 1) quite likely to remit, 2) quite likely to not benefit, and 3) insufficiently certain outcomes (ie, no prediction). We defined the success of this approach by the proportion of patients for whom meaningful outcomes (no benefit, remission) could be predicted with substantial (actionable) certainty.
To assess the feasibility and potential of this approach – as a proof of concept – we chose the Combining Medications to Enhance Depression Outcomes (CO-MED) trial,17 from which we selected the escitalopram + placebo and escitalopram + bupropion-SR treatment cells as samples of opportunity. We chose these two cells because evidence suggests that somewhat different patients may be responding as the baseline CRP level seems to act as moderator differentiating outcomes between the two cells.18 We viewed two cells as sufficient at this early stage.
In short, we developed two predictive equations for each patient for each treatment separately using baseline variables – one estimating the likelihood of remission and the other the likelihood of no meaningful benefit. We used the ratio of these two numbers to identify individuals for whom action could be taken at baseline given the nature and certainty of the prediction.
Methods
Clinical trial registration information
Combining Medications to Enhance Depression Outcomes (CO-MED). ClinicalTrials.gov ID: NCT00590863. URL: https://ClinicalTrials.gov/ct2/show/NCT00590863.
Study overview
This report relies on data from the CO-MED trial,17 which recruited 665 treatment-seeking participants who, after stratification by site, were randomly assigned to three treatments: escitalopram + placebo, escitalopram + bupropion-SR combination, and venlafaxine-mirtazapine combination.17 The analytic sample for this report included only those participants who were treated with SSRI monotherapy or the bupropion-SSRI combination (n=418). Analyses in this report were based only on the acute-phase visits at baseline and weeks 1, 2, 4, 6, 8, 10, and 12.
Broad inclusive entry criteria (https://ClinicalTrials.gov/ct2/show/NCT00590863) aimed to recruit a representative group of participants from both psychiatric and primary care practices that were chosen to ensure adequate minority representation.17 Briefly, participants were treatment-seeking patients with nonpsychotic major depressive disorder, diagnosed by a clinical interview and the Mini International Neuropsychiatric Interview.19 The current depressive episode had to be at least 2 months in duration and of at least moderate severity (17-item Hamilton Rating Scale for Depression [HRSD17] score of at least 16) with either a chronic or recurrent course as defined by the DSM-IV.20
All study-related procedures or assessments were completed after obtaining informed consent from participants. The study was conducted in compliance with Declaration of Helsinki, and was reviewed and approved by the institutional review boards at the University of Texas Southwestern Medical Center at Dallas, the University of Pittsburgh Data Coordinating Center, and each participating regional center and relevant clinical site. Additionally, the study was monitored by an independent data safety and monitoring board.
Medications
Participants were treated using measurement-based care and with dosage adjustments based on symptom severity and side effects as detailed elsewhere.17
Medications were administered single blind. At the end of acute-phase treatment, mean escitalopram dose was 17.6 mg/day and mean placebo dose was 1.4 pills/day in SSRI monotherapy treatment, whereas mean escitalopram dose was 14.0 mg/day and mean bupropion-SR dose was 324.0 mg/day in bupropion-SSRI combination treatment.17
Assessments
At baseline, participants provided sociodemographic information. Also at baseline, and at all treatment visits, participants filled out the 16-item Quick Inventory of Depressive Symptomatology – Self-Report (QIDS-SR16) scale21 which was the primary depression symptom severity outcome measure in the CO-MED trial. The 16 QIDS-SR items were scored from 0 to 3. The total score was calculated from nine domains derived from these 16 items, leading to a range of 0–27.21 The QIDS-SR16 correlates highly (0.86–0.93) with the HRSD17.22 In previous reports, the reported Cronbach’s α of the QIDS-SR16 ranged from 0.86 to 0.87.21–23 Clinicians administered the 30-item Inventory of Depressive Symptomatology – Clinician-rated (IDS-C30) from which the QIDS-C16 was extracted for making treatment decisions according to the measurement-based care approach.1
We selected a modest number of baseline variables largely defined by ease of acquisition and suggestions in the literature that each might relate to some degree to outcome, though none were established moderators of acute treatment of depression (e.g., refer to studies by Rush et al,24 Fava et al,25 McGrath et al,26 and Stewart et al27). In this proof of concept, we were not aiming to conduct a definitive analysis, but rather to evaluate an analytic approach.
Data
Thirty baseline measures were selected as potential baseline explanatory variables in the analysis. These measures included all QIDS-SR16 items, age, sex, IDS-C30 summary variables such as anxious features,28 atypical features,27 melancholic features,29 and several other measures. A full listing is given in the Results section. To define the response groups of interest, we used the following definitions:
- Remission: ascribed when QIDS-SR16 scores during the last 2 weeks before exit were below 8 in 1 week and below 6 in the other week (without regard to order).17
- No clinically meaningful benefit: ascribed when less than a 30% decrease in QIDS-SR16 score occurred from baseline to exit.
On the basis of these definitions, the 206 bupropion + escitalopram subjects included 82 remitters (39.8%), 45 with no meaningful benefit (21.8%), and 79 with neither distinction (38.3%), while the 212 escitalopram + placebo subjects included 85 remitters (40.1%), 46 with no meaningful benefit (21.7%), and 81 with neither distinction (38.2%). Note that there were a total of 5 participants who remitted but who were also classified as substantial non-responders on the basis of our definition (their baseline QIDS-SR16 score was low enough that less than a 30% improvement was needed to achieve remission). For the purpose of the analysis, these 5 participants were excluded.
Of the variables considered for analysis, several had a small amount of missing data (most were only missing 1 observation, but the suicide attempt variable had approximately 3.5% of observations missing). To address missing data issues, we utilized multivariate imputation (10 imputations) by chained equations30 (via the mice package31 in R 3.3.332). After imputing the data, the elastic net33 was used within each treatment for each dependent variable (remission and no meaningful benefit) to identify subsets of baseline measures with predictive power. The elastic net is a regularization regression method that functions as a variable selection technique by shrinking some of the regression coefficients to 0 and thus removing them from the regression equation; it does not suffer from the undesirable statistical consequences of more well-known stepwise selection methods, for example, biased parameter estimates, artificially small standard errors, or severe problems when some of the candidate predictors are correlated.34 For each imputed data set, the baseline measures were scaled to have a mean of 0 and standard deviation of 1 to allow for comparability across measures, and repeated 10-fold cross validation was used to select the best elastic net models according to mean squared error. The final estimated coefficient values and predicted probabilities were determined by averaging the results over all imputed data sets. The elastic net was implemented via the glmnet package35 in R 3.3.3.32
The primary goal of this method was to identify patient membership in the three aforementioned groups: remitters, no meaningful benefit, or neither. For any given medication, clinicians could more confidently prescribe a medication to patients predicted to remit or reject a medication to those predicted to have no meaningful benefit. Thus, we propose using the ratio of the estimated probability of remission to the estimated probability of no meaningful benefit, subject to a minimum probability threshold (where NMB = no meaningful benefit):
Predicted Group
|
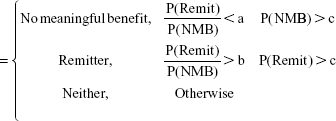
where a ratio less than a is necessary to identify someone as having no meaningful benefit, a ratio greater than b to identify someone as a remitter, and c is the minimum probability threshold we require to identify someone as a remitter or having no meaningful benefit, given that the appropriate ratio threshold is met. Assume that a ≤ b.
As an example, suppose that a patient receiving escitalopram + bupropion-SR had an estimated probability of remission of 0.6 and an estimated probability of no meaningful benefit of 0.3. The corresponding ratio value would be 0.6/0.3=2. The patient is estimated to be twice as likely to remit as to show no meaningful benefit. Given that the probability of remission was 0.6, we may be comfortable predicting this person to be a remitter. However, consider a similar scenario in which the probability of remission is estimated as 0.1 and the probability of no benefit is estimated at 0.05. In this case the ratio is still 2, but we may not be comfortable labeling this person as a remitter since the estimated probability of remission is so low. Thus, it is important to set some minimum probability threshold (c) in addition to considering the magnitude of the ratio. A grid of values for a and b were tested at each value of c to identify the optimal cut points. Two values of c were considered (0.3 and 0.5).
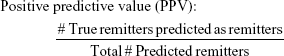
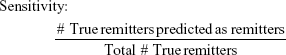
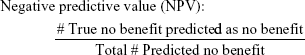
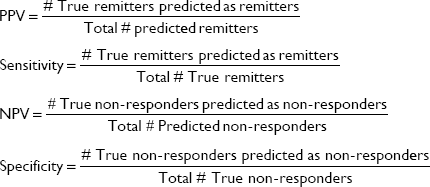
To evaluate the efficacy of the proposed methodology, four adjusted metrics were defined (phrased as “adjusted” because they are not defined in the traditional sense, ie, remission vs non-remission or response vs non-response). Remission and no meaningful benefit – while mutually exclusive – are not complementary events, resulting in the creation of the “neither” group composed of people with some degree of benefit from treatment but not enough to achieve remission. The adjusted metrics are as follows:
|
|
|
|
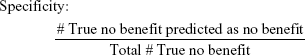
Actionable decisions can be made when the PPV or NPV is large for a substantial portion of true remitters or those without benefit. Specifically, we considered this to be at least 75% PPV and NPV at sensitivities and specificities of at least 20%. We chose 20% as a minimum threshold for the proportion of patients with low uncertainty as it approximates the 15%–20% difference in response rates between antidepressant medication and placebo (NNT =5–7).9 We operationalized remission using the criteria from the protocol used to compile the sample. No meaningful benefit was defined a priori as less than a 30% reduction in depressive symptoms by study exit.36
Results
The baseline measures considered as explanatory variables are given in Table 1. Figure 1 plots the estimated elastic net coefficients within each treatment, with coefficients from the remission model on the x-axis and coefficients from the no meaningful benefit model on the y-axis. Consider point 23, which represents the total Cognitive and Physical Functioning Questionnaire (CPFQ)37 score. In the escitalopram + bupropion-SR treatment group, this coefficient has a value of −0.37 in the remission model and 0.23 in the non-response model. In the escitalopram + placebo treatment, these values were −0.12 and −0.05, respectively. So, the impact of a one standard deviation increase in CPFQ total score was estimated to decrease the probability of non-response in the escitalopram + placebo group, whereas it increased the probability of non-response in the escitalopram + bupropion-SR treatment group.
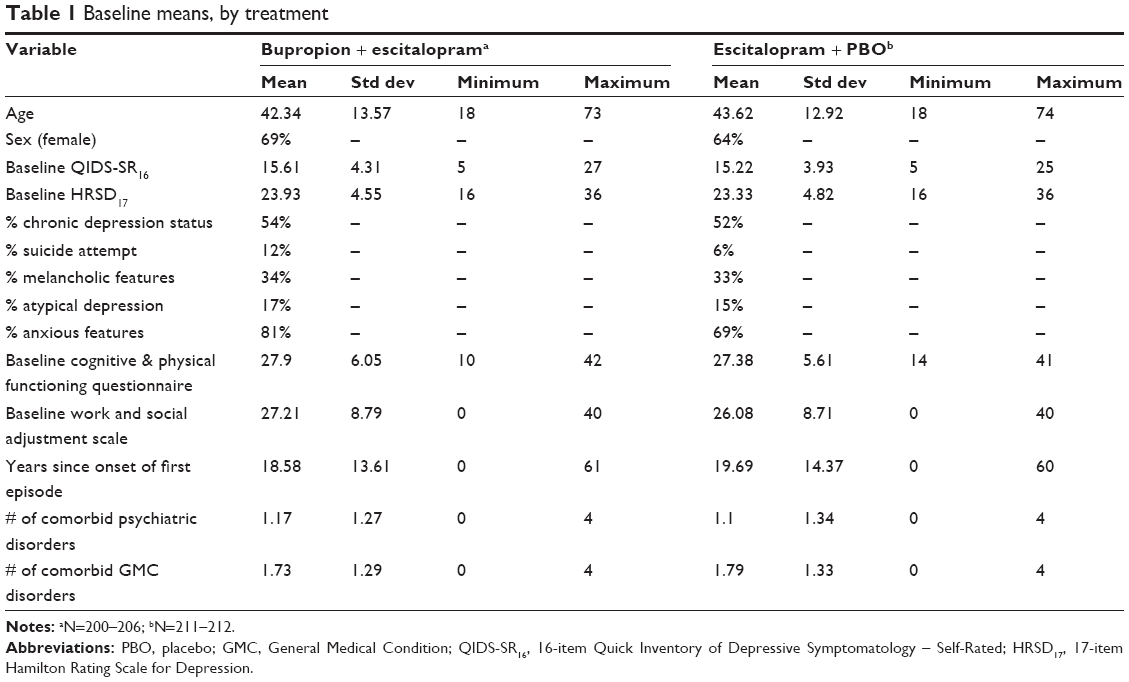 | Table 1 Baseline means, by treatment |
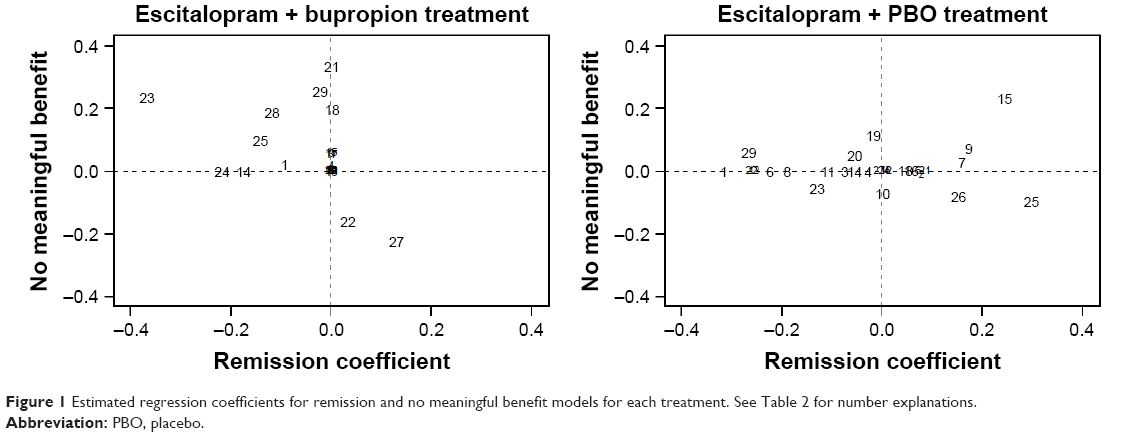 | Figure 1 Estimated regression coefficients for remission and no meaningful benefit models for each treatment. See Table 2 for number explanations. |
Note also that there is a vertical line of points in the left plot and a horizontal line of points in the right plot. These indicate that in the escitalopram + bupropion-SR treatment, there were several variables that were estimated to have little to no impact on predicting remission, but they did have an impact on predicting non-response. On the other hand, in the escitalopram + placebo treatment, several variables were estimated to have little to no effect on non-response, but some were predictive of remission. Visual inspection of the plots show that the points are located in different positions, further suggesting that the effects are not uniform across treatments and remission and no benefit outcomes. Table 2 serves as a key for identifying the variables. Indices of the variables that were selected by the elastic net to be predictive of either remission or no meaningful benefit in each treatment group are shown in Table 3.
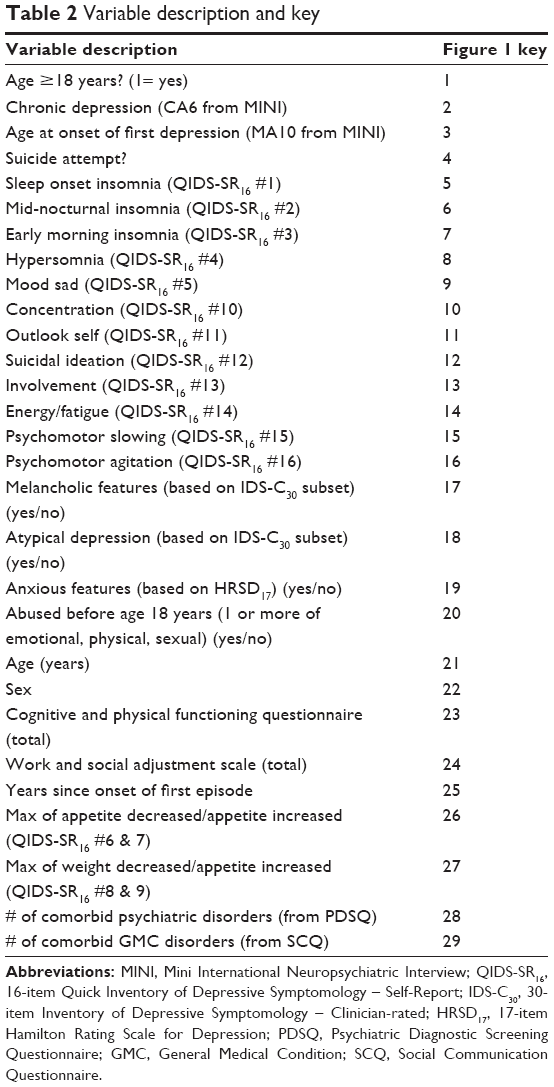 | Table 2 Variable description and key |
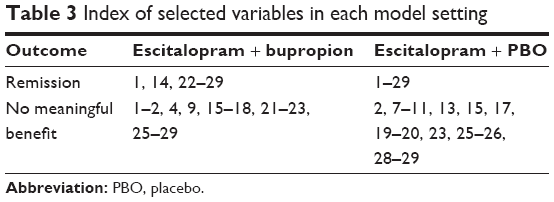 | Table 3 Index of selected variables in each model setting |
With respect to prediction, a receiver operator characteristic analysis found that area under the curve values ranged from 0.698 to 0.800 across the treatments and remission and no benefit outcomes, suggesting moderate predictive power. Figure 2 is a scatterplot showing the predicted probability of remission versus predicted probability of non-response for the escitalopram + bupropion-SR treatment. The scatterplot primarily matches with intuition – that is, most people with a larger predicted probability of remission had a smaller predicted probability of no meaningful benefit and vice versa. Also as expected, the “neither” group was composed of patients with relatively small probabilities in both models.
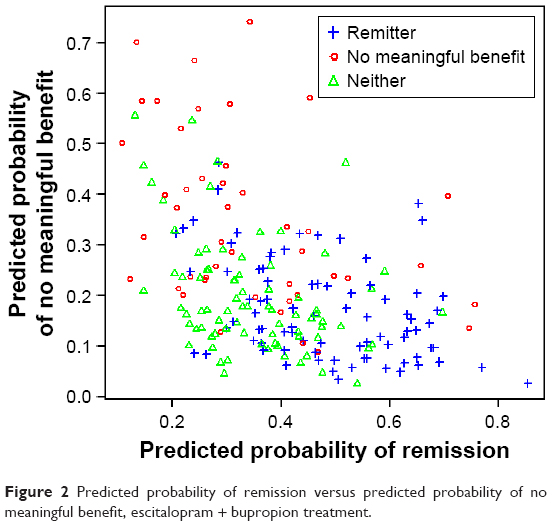 | Figure 2 Predicted probability of remission versus predicted probability of no meaningful benefit, escitalopram + bupropion treatment. |
In terms of the efficacy of prediction for each treatment, Table 4 shows the values of the adjusted metrics and optimal cut points. For reference, Table 5 shows the actual counts for the two treatments. Specifically, in the S-CIT + bupropion-SR group, 11 subjects were predicted NB, of which 82% were correct; 26 were predicted R – 85% correct (169 had NP). In the S-CIT + placebo group, 13 were predicted NB – 69% correct; 44 were predicted R – 75% correct (155 were NP). In addition to meeting our criteria for clinical meaningfulness in 3 of the 4 model settings, there is a very low gross misclassification rate – that is, few actual remitters were predicted to have no meaningful benefit and vice versa. Between the two treatments, the model fit makes an actionable prediction (ie, either a remitter or will have no meaningful response) for 94 participants and was correct for 73 of them (a 77.7% hit rate). Conversely for the overall sample, 258 participants were either remitters or showed no meaningful response and 28.3% (73/258) of them were correctly identified.
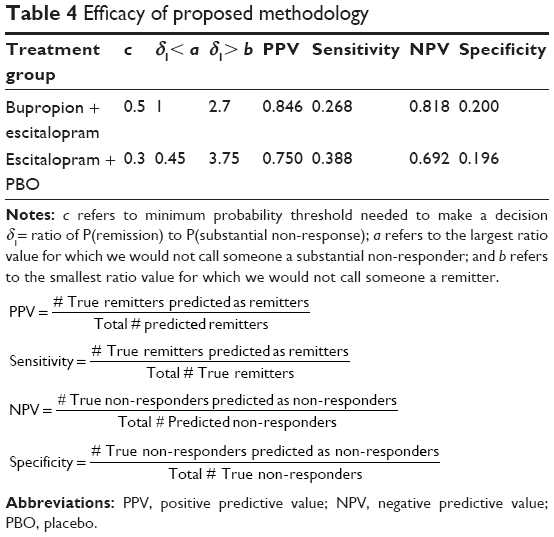 | Table 4 Efficacy of proposed methodology |
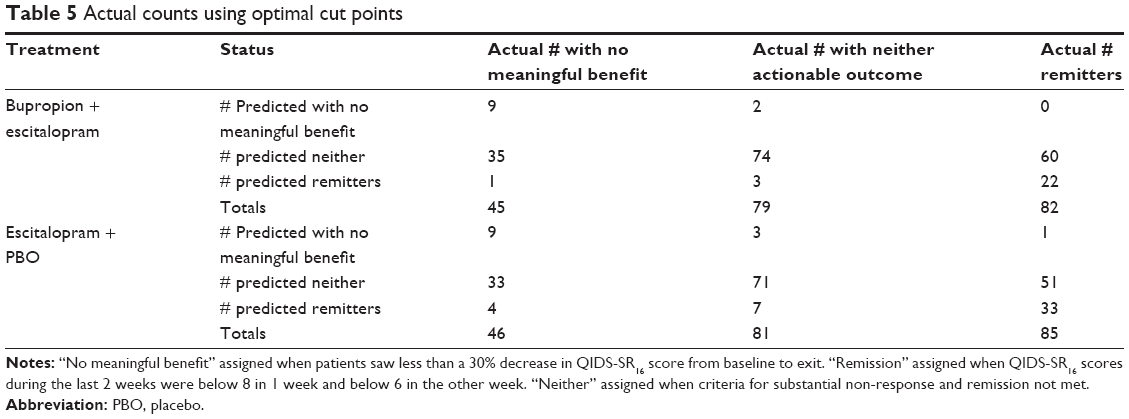 | Table 5 Actual counts using optimal cut points |
Discussion
Using a modest list of baseline clinical and demographic variables in this data set of convenience, we found that we could group depressed patients undergoing up to 12 weeks of two different antidepressant treatments into three mutually exclusive groups: remission very likely, no clinically meaningful benefit very likely, and no actionable prediction. Meaningful predictions were achieved with over 20% of the two samples taken together with 69%–85% certainty as to either of these two outcomes (no benefit; remission). In addition, the baseline variables that impacted the prediction of remission and no benefit were different within each treatment cell, as well as across the two treatment groups. The method employed is generalizable and can be applied in other clinical trial samples or even open case series, and it can incorporate baseline biological and other laboratory findings.
Our results are consistent with the notion that different baseline variables seem to contribute to remission as opposed to no benefit, and furthermore that different patients – at least to some degree – are responding to different treatments. Consequently, baseline predictors would be expected to differ across different treatments and across the divergent outcomes.
Others have attempted to identify a set of baseline variables that could inform treatment selection.5,13,38–40 Largely these efforts have resulted in characterizing the full sample and have not achieved actionable outcomes in the sense of having certain enough predictions to recommend clearly for or against a treatment.
The present approach follows on from our previous efforts14 in which we first searched for subgroups with more certain predictions. This study is the first to separately identify factors contributing to two very important and distinct outcomes – remission and no benefit – that can be used to characterize each patient. As expected, the samples of each were divided into three groups. While reasonably certain predictions could be made for the subsets of interest, it was just about 1 in 5 patients, leaving 80% in the “no prediction” group. Whether more or fewer patients with different medications and various other clinical demographic baseline parameters would result in better or worse performance is an open question.
While the proportion for whom an actionable prediction could be made was modest, it is still clinically meaningful because there are other treatment options for those with no benefit. By avoiding this ineffective medication, the overall response rate in the remaining 90% of the sample would rise by 10%. The other predicted remitters would benefit by being reassured to persist for the full trial, where dropout rates are 20%–30%.36,41
One way to potentially improve performance so as to reduce the uncertainty for, and increase the proportion of, those for whom a “rather certain” prediction can be made might be to add baseline biomarkers that are germane to the pharmacological effects of the particular drug or to the relevant biological features of depression. This approach would allow for a rapid assessment of a large number of potential biomarkers in order to determine which are relevant to either remission or no benefit and which are not, and recent literature supports the utility of biomarkers in depression research.18,42–44
This study has several limitations. This secondary analysis is on a subset of CO-MED trial participants. From a computational point of view, the elastic net requires the optimization of two tuning parameters; depending on the choice of these tuning parameters, the algorithm may be more or less conservative with respect to selecting variables. Further, the solution to the elastic net path is found via optimization and does not result in any tests of statistical significance. Therefore, we cannot speak regarding the statistical significance of the predictors reported in this analysis; we can only say that they were selected by the elastic net to have some predictive power.
On the basis of these limitations, findings from this report should be considered as a proof of concept that needs further testing on samples. It has been employed in a secondary analysis of one additional clinical trial,45 but it too had a small sample size. Additionally, though the initial sample size was reasonable, due to the grouping of patients in three groups within each treatment some findings may be driven by a small number of patients. The specific clinical findings are of limited generalizability and apply only to outpatients with chronic or recurrent depression taking either escitalopram or a combination of escitalopram and bupropion-SR.
Future work could apply this methodology to other data sets – particularly those large enough to allow for a validation set. This would give more evidence for reproducibility and efficacy of the derived models. Further, more consideration should be given to alternate treatment options, that is, how should we go about identifying the optimal treatment option among several competing choices.
In summary, we have developed and evaluated a flexible, feasible methodology that uses baseline variables to identify individuals with a high likelihood of definitive outcomes (remission or no meaningful benefit) and that enables clinicians to act on a meaningful subset of depressed patients to either encourage the use of or avoid a particular treatment, thereby enhancing clinical decision-making. The results with this approach recommend additional evaluations on other data sets including the incorporation of potential biomarkers.
Acknowledgments
The CO-MED trial was funded by NIMH under contract N01 MH-90003 to the University of Texas Southwestern Medical Center at Dallas (Principal Investigators, M H Trivedi and A J Rush). This work was also supported in part by the Center for Depression Research and Clinical Care at University of Texas Southwestern Medical Center (Principal Investigator: M H Trivedi) and the Hersh Foundation. The authors would like to thank the clinical staff at each clinical site for their assistance with this project and all the study participants. The authors appreciate the editorial support of Jon Kilner (Pittsburgh, PA, USA) and the administrative support of Jennifer Furman (Dallas, TX, USA) and Jeremy A Kee (Dallas, TX, USA). Forest Pharmaceuticals, GlaxoSmithKline, Organon, and Wyeth Pharmaceuticals provided medications for the CO-MED trial at no cost. The content of this publication does not necessarily reflect the views or policies of the U.S. Department of Health and Human Services, nor does mention of trade names, commercial products, or organizations imply endorsement by the U.S. government. NIMH had no role in the drafting or review of the manuscript or in the collection or analysis of the data.
Disclosure
Dr Rush has received consulting fees from Akili Inc., Brain Resource Ltd., Compass Inc., Curbstone Consultant LLC., Eli Lilly & Company, Emmes Corp., Holmusk, Inc., Liva-Nova, National Institute of Drug Abuse, Santium Inc., Sunovion, Taj Medical, Takeda USA; speaking fees from Liva-Nova; royalties from Guilford Publications and the University of Texas Southwestern Medical Center.
Dr Trivedi is or has been an advisor/consultant and received fees from: Alkermes, AstraZeneca, Cerecor, Eli Lilly & Company, Lundbeck, Naurex, Neuronetics, Otsuka Pharmaceuticals, Pamlab, Pfizer Inc., SHIRE Development, and Takeda. In addition, he has received grants/research support from National Institute of Mental Health and National Institute on Drug Abuse.
The other authors report no conflicts of interest in this work.
References
Trivedi MH, Rush AJ, Wisniewski SR, et al; STAR*D Study Team. Evaluation of outcomes with citalopram for depression using measurement-based care in STAR*D: implications for clinical practice. Am J Psychiatry. 2006;163(1):28–40. | ||
Rush AJ, Trivedi MH, Wisniewski SR, et al. Acute and longer-term outcomes in depressed outpatients requiring one or several treatment steps: a STAR*D report. Am J Psychiatry. 2006;163(11):1905–1917. | ||
Rush AJ, Trivedi MH, Wisniewski SR, et al; STAR*D Study Team. Bupropion-SR, sertraline, or venlafaxine-XR after failure of SSRIs for depression. N Engl J Med. 2006;354(12):1231–1242. | ||
Trivedi MH, Fava M, Wisniewski SR, et al; STAR*D Study Team. Medication augmentation after the failure of SSRIs for depression. N Engl J Med. 2006;354(12):1243–1252. | ||
Iniesta R, Malki K, Maier W, et al. Combining clinical variables to optimize prediction of antidepressant treatment outcomes. J Psychiatr Res. 2016;78:94–102. | ||
Papakostas GI, Fava M. Predictors, moderators, and mediators (correlates) of treatment outcome in major depressive disorder. Dialogues Clin Neurosci. 2008;10(4):439–451. | ||
Schmidt HD, Shelton RC, Duman RS. Functional biomarkers of depression: diagnosis, treatment, and pathophysiology. Neuropsychopharmacology. 2011;36(12):2375–2394. | ||
Kennedy SH, Downar J, Evans KR, et al. The Canadian Biomarker Integration Network in Depression (CAN-BIND): advances in response prediction. Curr Pharm Des. 2012;18(36):5976–5989. | ||
Gelenberg AJ, Freeman MP, Markowitz JC, et al. Practice guideline for the treatment of patients with major depressive disorder third edition. Am J Psychiatry. 2010;167(10):1–152. | ||
Cleare A, Pariante CM, Young AH, et al; Members of the Consensus Meeting. Evidence-based guidelines for treating depressive disorders with antidepressants: a revision of the 2008 British Association for Psychopharmacology guidelines. J Psychopharmacol. 2015;29(5):459–525. | ||
Bauer M, Whybrow PC, Angst J, Versiani M, Möller HJ; World Federation of Societies Biological Psychiatry Task Force on Treatment Guidelines for Unipolar Depressive Disorders. World Federation of Societies of Biological Psychiatry (WFSBP) guidelines for biological treatment of unipolar depressive disorders, part 1: acute and continuation treatment of major depressive disorder. World J Biol Psychiatry. 2002;3(1):5–43. | ||
Papakostas GI, Petersen T, Homberger CH, et al. Hopelessness as a predictor of non-response to fluoxetine in major depressive disorder. Ann Clinical Psychiatry. 2007;19(1):5–8. | ||
Kuk AY, Li J, Rush AJ. Recursive subsetting to identify patients in the STAR*D: a method to enhance the accuracy of early prediction of treatment outcome and to inform personalized care. J Clin Psychiatry. 2010;71(11):1502–1508. | ||
Gordon E, Rush AJ, Palmer DM, Braund TA, Rekshan W. Toward an online cognitive and emotional battery to predict treatment remission in depression. Neuropsychiatr Dis Treat. 2015;11:517–531. | ||
Li J, Kuk A, Rush AJ. A practical approach to the early identification of antidepressant medication non-responders. Psychol Med. 2012;42(2):309–316. | ||
Grieve SM, Korgaonkar MS, Gordon E, Williams LM, Rush AJ. Prediction of nonremission to antidepressant therapy using diffusion tensor imaging. J Clin Psychiatry. 2016;77(4):e436–e443. | ||
Rush AJ, Trivedi MH, Stewart JW, et al. Combining medications to enhance depression outcomes (CO-MED): acute and long-term outcomes of a single-blind randomized study. Am J Psychiatry. 2011;168(7):689–701. | ||
Jha MK, Minhajuddin A, Gadad BS, et al. Can C-reactive protein inform antidepressant medication selection in depressed outpatients? Findings from the CO-MED trial. Psychoneuroendocrinology. 2017;78:105–113. | ||
Sheehan DV, Lecrubier Y, Sheehan KH, et al. The Mini-International Neuropsychiatric Interview (M.I.N.I.): the development and validation of a structured diagnostic psychiatric interview for DSM-IV and ICD-10. J Clin Psychiatry. 1998;59(Suppl 20):22–33; quiz 34–57. | ||
American Psychiatric Association. DSM III. 3rd ed. American Psychiatric Association; 1980. | ||
Rush AJ, Trivedi MH, Ibrahim HM, et al. The 16-Item Quick Inventory of Depressive Symptomatology (QIDS), clinician rating (QIDS-C), and self-report (QIDS-SR): a psychometric evaluation in patients with chronic major depression. Biol Psychiatry. 2003;54(5):573–583. | ||
Rush AJ, Bernstein IH, Trivedi MH, et al. An evaluation of the Quick Inventory of Depressive Symptomatology and the Hamilton Rating Scale for Depression: a sequenced treatment alternatives to relieve depression trial report. Biol Psychiatry. 2006;59(6):493–501. | ||
Trivedi MH, Rush AJ, Ibrahim HM, et al. The Inventory of Depressive Symptomatology, Clinician Rating (IDS-C) and Self-Report (IDS-SR), and the Quick Inventory of Depressive Symptomatology, Clinician Rating (QIDS-C) and Self-Report (QIDS-SR) in public sector patients with mood disorders: a psychometric evaluation. Psychol Med. 2004;34(1):73–82. | ||
Rush AJ, Wisniewski SR, Warden D, et al. Selecting among second-step antidepressant medication monotherapies: predictive value of clinical, demographic, or first-step treatment features. Arch Gen Psychiatry. 2008;65(8):870–880. | ||
Fava M, Rush AJ, Alpert JE, et al. Difference in treatment outcome in outpatients with anxious versus nonanxious depression: a STAR* D report. Am J Psychiatry. 2008;165(3):342–351. | ||
McGrath PJ, Khan AY, Trivedi MH, et al. Response to a selective serotonin reuptake inhibitor (citalopram) in major depressive disorder with melancholic features: a STAR* D report. J Clin Psychiatry. 2008;69(12):1847–1855. | ||
Stewart JW, McGrath PJ, Fava M, et al. Do atypical features affect outcome in depressed outpatients treated with citalopram? Int J Neuropsychopharmacol. 2010;13(1):15–30. | ||
Cleary P, Guy W. Factor analysis of the Hamilton Depression Scale. Drugs Exp Clin Res. 1977;1:115–120. | ||
Bobo WV, Chen H, Trivedi MH, et al. Randomized comparison of selective serotonin reuptake inhibitor (escitalopram) monotherapy and antidepressant combination pharmacotherapy for major depressive disorder with melancholic features: a CO-MED report. J Affect Disord. 2011;133(3):467–476. | ||
van Buuren S, Oudshoorn CGM. Multivariate Imputation by Chained Equations: MICE V1. 0 User’s Manual. Leiden: The Netherlands. TNO Prevention and Health, Public Health; 2000. | ||
van Buuren S, Groothuis-Oudshoorn K. mice: Multivariate imputation by chained equations in R. J Stat Softw. 2011;45(3):1–67. | ||
Team RC. R: A Language and Environment for Statistical Computing. Vienna: Austria, R Foundation for Statistical Computing; 2017. | ||
Zou H, Hastie T. Regularization and variable selection via the elastic net. J R Stat Soc Series B Stat Methodol. 2005;67(2):301–320. | ||
Harrell F. Regression modeling strategies: with Applications to Linear Models, Logistic and Ordinal Regression, and Survival Analysis. Springer; 2015. | ||
Friedman J, Hastie T, Tibshirani R. glmnet: Lasso and Elastic-Net Regularized Generalized Linear Models. R package version; 2009:1–4. | ||
Dunlop BW, Kelley ME, Aponte-Rivera V, et al; PReDICT Team. Effects of patient preferences on outcomes in the Predictors of Remission in Depression to Individual and Combined Treatments (PReDICT) study. Am J Psychiatry. 2017;174(6):546–556. | ||
Fava M, Iosifescu DV, Pedrelli P, Baer L. Reliability and validity of the Massachusetts general hospital cognitive and physical functioning questionnaire. Psychother Psychosom. 2009;78(2):91–97. | ||
Chekroud AM, Zotti RJ, Shehzad Z, et al. Cross-trial prediction of treatment outcome in depression: a machine learning approach. Lancet Psychiatry. 2016;3(3):243–250. | ||
Jain FA, Hunter AM, Brooks JO 3rd, Leuchter AF. Predictive socioeconomic and clinical profiles of antidepressant response and remission. Depress Anxiety. 2013;30(7):624–630. | ||
Olbert CM, Rasmussen A, Gala GJ, Tupler LA. Treatment outcome variation between depression symptom combinations in the STAR* D study. J Affect Disord. 2016;201:1–7. | ||
Olfson M, Mojtabai R, Sampson NA, et al. Dropout from outpatient mental health care in the United States. Psychiatr Serv. 2009;60(7):898–907. | ||
Gadad BS, Jha MK, Grannemann BD, Mayes TL, Trivedi MH. Proteomics profiling of inflammation-related biomarkers in antidepressant treatment response: findings from the CO-MED trial. J Psychiatr Res. 2017;94:1–6. | ||
Jha MK, Minhajuddin A, Gadad BS, Greer TL, Mayes TL, Trivedi MH. Interleukin 17 selectively predicts better outcomes with bupropion-SSRI combination: novel T cell biomarker for antidepressant medication selection. Brain Behav Immun. Epub 2017 Jul 8. | ||
Jha MK, Minhajuddin A, Gadad BS, Trivedi MH. Platelet-derived growth factor as an antidepressant treatment selection biomarker: higher levels selectively predict better outcomes with bupropion-SSRI combination. International Journal of Neuropsychopharmacology. 2017:1–9. | ||
Rethorst CD, South CC, Rush AJ, Greer TL, Trivedi MH. Prediction of treatment outcomes to exercise in patients with nonremitted major depressive disorder. Depress Anxiety. Epub 2017 Jul 3. |
 © 2017 The Author(s). This work is published and licensed by Dove Medical Press Limited. The full terms of this license are available at https://www.dovepress.com/terms.php and incorporate the Creative Commons Attribution - Non Commercial (unported, v3.0) License.
By accessing the work you hereby accept the Terms. Non-commercial uses of the work are permitted without any further permission from Dove Medical Press Limited, provided the work is properly attributed. For permission for commercial use of this work, please see paragraphs 4.2 and 5 of our Terms.
© 2017 The Author(s). This work is published and licensed by Dove Medical Press Limited. The full terms of this license are available at https://www.dovepress.com/terms.php and incorporate the Creative Commons Attribution - Non Commercial (unported, v3.0) License.
By accessing the work you hereby accept the Terms. Non-commercial uses of the work are permitted without any further permission from Dove Medical Press Limited, provided the work is properly attributed. For permission for commercial use of this work, please see paragraphs 4.2 and 5 of our Terms.