")
Back to Journals » International Journal of General Medicine » Volume 16
Accuracy and Reproducibility of Coronary Angiography-Derived Fractional Flow Reserve in the Assessment of Coronary Lesion Severity
Authors Yang G, Li L, Peng X, Tang G , Zheng N , Zhao Y, Li H, Zhang H, Sun F, Ai H
Received 30 March 2023
Accepted for publication 1 August 2023
Published 28 August 2023 Volume 2023:16 Pages 3805—3814
DOI https://doi.org/10.2147/IJGM.S413991
Checked for plagiarism Yes
Review by Single anonymous peer review
Peer reviewer comments 2
Editor who approved publication: Prof. Dr. Yuriy Sirenko
Guojian Yang,* Le Li,* Xi Peng, Guodong Tang, Naixin Zheng, Ying Zhao, Hui Li, Huiping Zhang, Fucheng Sun, Hu Ai
Department of Cardiology, Beijing Hospital, National Center of Gerontology, Institute of Geriatric Medicine, Chinese Academy of Medical Sciences, Beijing, 100730, People’s Republic of China
*These authors contributed equally to this work
Correspondence: Hu Ai, Department of Cardiology, Beijing Hospital, National Center of Gerontology, Institute of Geriatric Medicine, Chinese Academy of Medical Sciences, No. 1 DaHua Road, Dong Dan, Beijing, 100730, People’s Republic of China, Tel +86 18601025086, Email [email protected]
Purpose: Coronary angiography-derived fractional flow reserve (caFFR) is a novel computational flow dynamics (CFD)-derived assessment of coronary vessel flow with good diagnostic performance. Herein, we performed a retrospective study to evaluate the reproducibility of caFFR findings between observers and investigate the diagnostic performance of caFFR for coronary stenosis defined as FFR ≤ 0.80, especially in the grey zone (0.75≤caFFR ≤ 0.80).
Patients and Methods: A total of 150 patients (167 coronary vessels) underwent caFFR (with FlashAngio used for calculation of flow variables) and subsequent invasive fractional flow reserve (FFR) measurements. Outcomes, including reproducibility, were compared for vessels in and outside the grey zone.
Results: The correlation of caFFR findings was good between the two laboratories (r = 0.723, p< 0.001). The AUC of ROC were both high for caFFR-CoreLab1 and caFFR-CoreLab2 (0.975 and 0.883). The diagnostic accuracy, sensitivity, specificity, and negative and positive predictive values were not significantly different between the two laboratories (p> 0.05). caFFR had a strong correlation with measures to FFR (r=0.911, p< 0.001). There was no systematic difference between caFFR and FFR on Bland-Altman analysis in and outside the grey zone. There was no difference in diagnostic accuracy between the grey and non-grey zones in the prediction of FFR ≤ 0.80 (p=0.09).
Conclusion: The inter-observer reproducibility for caFFR was high, and the diagnostic accuracy of caFFR was good compared to that of FFR.
Keywords: fractional flow reserve, computational flow dynamics, grey zone, diagnose, myocardial ischemia
Introduction
Wire-based fractional flow reserve (FFR) is the gold standard for coronary revascularization in patients with stable ischemic heart disease,1,2 and its favorable clinical outcomes have been demonstrated in several multicenter randomized trials.3–5 However, the use of wire-based FFR is limited by its high cost, additional time to perform, and patient discomfort.6,7 Over the past decade, four CFD-derived FFR techniques have been developed to avoid the need of using an invasive pressure wire: quantitative flow ratio (QFR),8 FFRangio,9 vessel FFR (vFFR)10 and coronary angiography-derived FFR (caFFR).11 All these techniques provide a good diagnostic accuracy comparable to that of wire-based FFR. However, the cut-off FFR values for percutaneous revascularization are yet to be fully clarified. Based on data obtained during a 5-year follow-up period, the DEFER study3 set the FFR cut-off for percutaneous revascularization at <0.75, while the subsequent FAME family studies elevated the FFR cut-off to ≤0.80 to avoid undertreatment.4,5 Moreover, the optimal treatment for coronary stenosis in patients with an FFR between 0.75 and 0.80 (the so-called grey zone)12–14 remains controversial.
As a novel CFD-derived FFR, caFFR, combined with the FlashAngio software (Rainmed Ltd., Suzhou, China) for analysis and calculation of outcomes, has been shown to have good accuracy and agreement with wire-based FFR.11,15,16 Nevertheless, no study has assessed the inter-observer reproducibility of caFFR. In addition, the diagnostic accuracy of caFFR for FFR values of coronary vessels in the grey zone has not been validated. Accordingly, the aim of this study was two-fold: first, to evaluate the reproducibility of caFFR between two independent laboratories; and second, to investigate the diagnostic ability of caFFR in detecting functionally significant coronary stenosis defined as FFR ≤0.80, especially in the grey zone (0.75≤caFFR ≤0.80).
Materials and Methods
Ethics Statement
This study was approved by the Institutional Review Board (2020BJYYEC-038-01) of Beijing Hospital, and the methods were consistent with the Declaration of Helsinki and Good Clinical Practice Guidelines of the China Food and Drug Administration. All patients provided informed consent for treatment and for the use of their data for research and publication.
Study Group
Eligible patients were those aged >18 years who underwent coronary angiography (CAG) and subsequent invasive FFR measurements between February 2015 and July 2021, at Beijing Hospital. The exclusion criteria were as follows: previous MI (STEMI), LVEF ≤40%, cardiomyopathies, previous PCI or CABG of interrogated coronary artery, valvular heart diseases, stenosis caused by a myocardial bridge, ostial lesions, poor contrast opacification, severe vascular overlap or distortion of the interrogated vessel, poor angiographic image quality precluding contour detection. For patients with stable angina and silent ischemia, we performed coronary angiography due to some positive non-invasive examinations: coronary CTA, treadmill exercise test, myocardial perfusion tomographic imaging or active request of patients. A caFFR value ≤0.80 in the target vessel (compared to the value for invasive FFR ≤0.80 as a reference standard) was considered significant stenosis. Among the 182 coronary vessels (obtained from the 165 eligible patients), 167 (91.8%, 150 patients) were included in the final analysis. Fifteen eligible patients were excluded for the following reasons: lack of qualified angiographic position and separation by <30° (n = 5); target vessels involving myocardial bridges (n = 4); severe vascular overlap (n = 4); and poor contrast filling on angiography (n = 2).
Coronary Angiography
CAG was performed according to the Judkins method from nine conventional projection views, using a 6-F angiography catheter (via a femoral or transradial approach). Angiographic images were recorded using a Philips Allura Xper FD10 system (Philips Healthcare; 15 frames/s). The contrast agent was injected using a mechanical pump at a rate of 3.5 mL/s. All angiography examinations were performed by skilled and experienced interventional cardiologists.
Wire-Derived FFR Measurements
Coronary FFR measurements were performed using a pressure wire system (Certus, Abbott Vascular, Santa Clara, CA, USA). Intracoronary nitroglycerine (200 μg) was routinely injected before FFR. After calibrating the system, a 0.014-inch pressure wire was positioned using a ≥6-F guide catheter, 1–2 cm downstream from the edge of the target lesion. The location of the pressure wire was recorded on images as a standard procedure. Coronary hyperemia was then induced by administering adenosine triphosphate via the antecubital vein at a rate of 140 µg/kg/min for 150 s. FFR was determined by the ratio Pd/Pa, where Pd represents mean hyperemic coronary pressure distal to the lesions measured by the pressure wire, and Pa represents mean aortic pressure measured by the guiding catheter.17 Hemodynamic data were recorded for at least 10s in the presence of a stable FFR value. The accepted range of pressure drift was between 0.97 and 1.03, measured when the pressure wire was pulled back near the tip of the guiding catheter.
Offline caFFR Measurement
At least two Digital Imaging and Communications in Medicine angiograms were transferred to the FlashAngio system to obtain a three-dimensional (3-D) reconstruction of the coronary arteries. The operator imputed the mean aortic pressure (MAP) and selected the appropriate cine images of the target vessel. The location of the caFFR was consistent with the position of the FFR pressure wire. Resting flow velocities (V) obtained by the TIMI Frame Count method and MAP (Pa ′) from the FlashAngio software were calculated by an optimized CFD method to compute a pressure drop (∆P) along the generated mesh of the coronary artery as caFFR = (Pa ′−∆P)/ Pa ′.11 At the two laboratories, CoreLab1 (Rainmed Ltd., Suzhou, China) and CoreLab2 (Beijing Hospital), caFFR was measured according to standard operation procedures by two highly trained technicians, one in each laboratory. All caFFR measurements were performed offline in a blinded fashion, using the FlashAngio caFFR system.
Statistical Analysis
Clinical and angiographic data were extracted from the electronic medical record system and cardiac catheterization laboratory at Beijing Hospital. Continuous data are expressed as mean and standard deviation. Categorical variables are expressed as count and percentage. The Student’s t-test or chi-squared test was used to evaluate between-group differences. Pearson’s correlation coefficient between FFR and caFFR was calculated, with Bland-Altman plots used to evaluate agreement between FFR and caFFR. The validity of the caFFR for predicting functionally significant stenosis defined as FFR ≤0.80 was evaluated using sensitivity, specificity, accuracy, positive predictive value (PPV), and negative predictive value (NPV). The intraclass correlation coefficient (ICC), Pearson’s correlation coefficient and Bland-Altman plots were used to assess the correlation and agreement of caFFR between the two laboratories, CoreLab1 and CoreLab2. The chi-squared test was used to compare the diagnostic performance characteristics of caFFR in two groups. A p-value <0.05 was considered significant for all analyses.
All statistical analyses were performed using SPSS software (version 24.0; IBM SPSS, Armonk, New, USA) and GraphPad Prism software version 8.0.3 (GraphPad Software Inc., San Diego, CA, USA).
Results
Feasibility and Clinical Characteristics of the Patients
After exclusion, our study group included 150 patients (167 vessels), 67% of whom were men. The mean age of our study sample was 63.3 years. Stable angina was the diagnosis in 52% of patients, and 39% of patients had diabetes mellitus. Target vessels were predominantly located in the left anterior descending artery (76%). Detailed clinical characteristics of the patients are presented in Table 1. The angiography characteristics of the target lesions are reported in Table 2.
 |
Table 1 Baseline Demographic and Clinical Parameters per Patient (n = 150) |
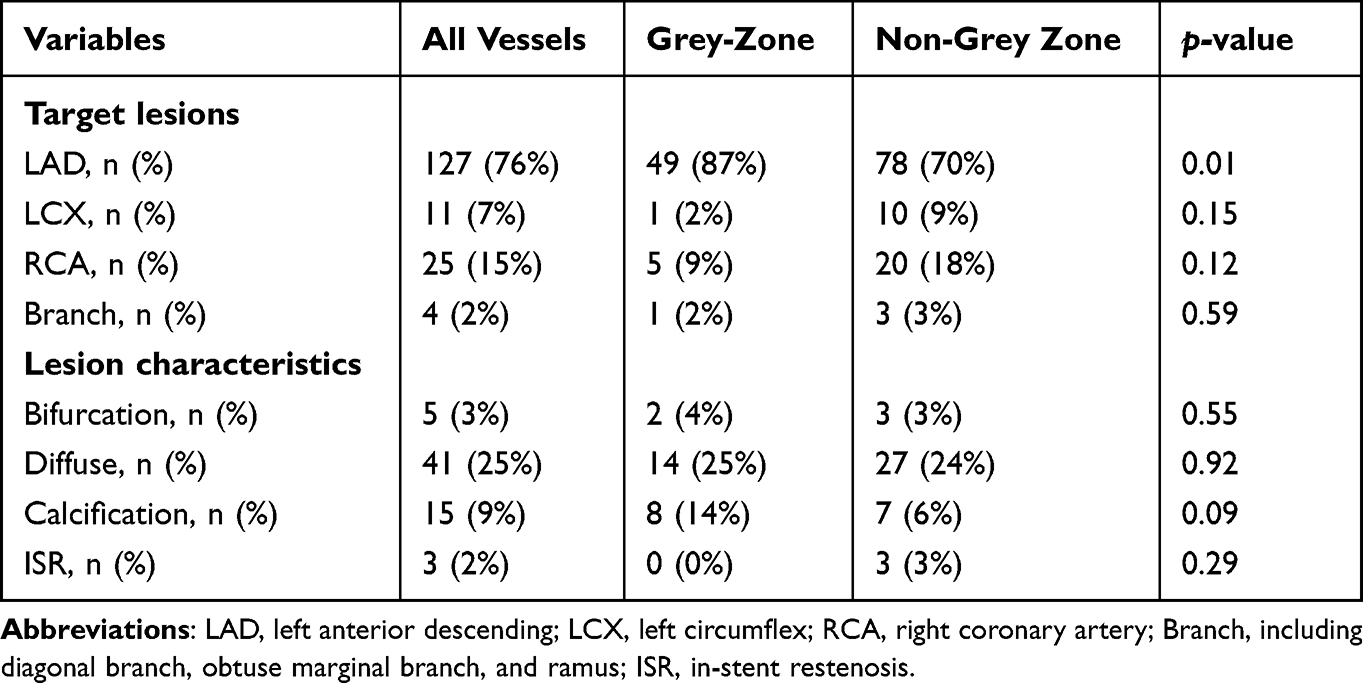 |
Table 2 Angiographic and Lesions Characteristics per Vessel (n = 167) |
Inter-Observer Agreement
There was good correlation and agreement between measured caFFR outcomes between the two labs (r = 0.723; 95% confidence interval [CI]: 0.645–0.787; p<0.001), with an ICC value of 0.724 (95% CI: 0.642–0.789; p<0.001). On Bland-Altman analysis of caFFR measurements, there were no systematic differences between CoreLab1 and CoreLab2 (mean difference, 0.0; 95% lower and upper level agreement, –0.12 to 0.13; Figure 1). The sensitivity, specificity, PPV, NPV and overall diagnostic accuracy of caFFR-CoreLab1 were as follows: 92%; 91%; 94%; 89% and 91%, respectively. The diagnostic value of caFFR-CoreLab2 for hemodynamically significant stenosis was also good, with a sensitivity, specificity, PPV, NPV and overall diagnostic accuracy of 83%, 82%, 87%, 77% and 83% (all p > 0.05; Figure 2), respectively. The AUC of ROC for caFFR- CoreLab1 and caFFR-CoreLab2 were both high, 0.975 (95% CI: 0.953–0.997, p < 0.001) and 0.883 (95% CI: 0.831–0.935, p < 0.001). C statistic analysis for patients with FFR≤0.8 showed the difference between the AUC of caFFR-CorLab1 and caFFR-CorLab2 was 0.092 (95% CI: 0.043–0.141, p < 0.05).
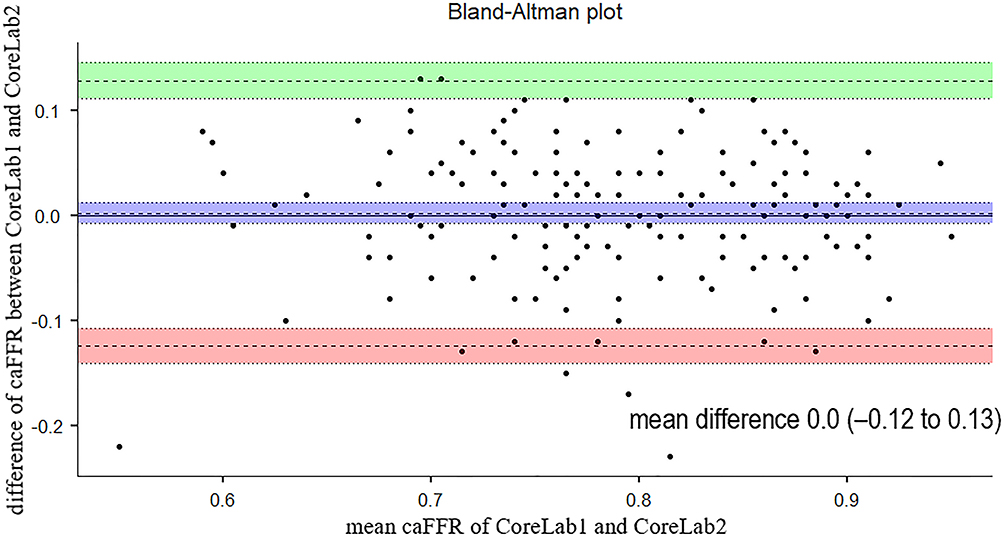 |
Figure 1 Bland-Altman analysis of caFFR by CoreLab1 and CoreLab2 (purple band means 95% CI of mean difference of caFFR between CoreLab1 and CoreLab2, green band means 95% CI of upper limit of agreement, pink band means 95% CI of lower limit of agreement). |
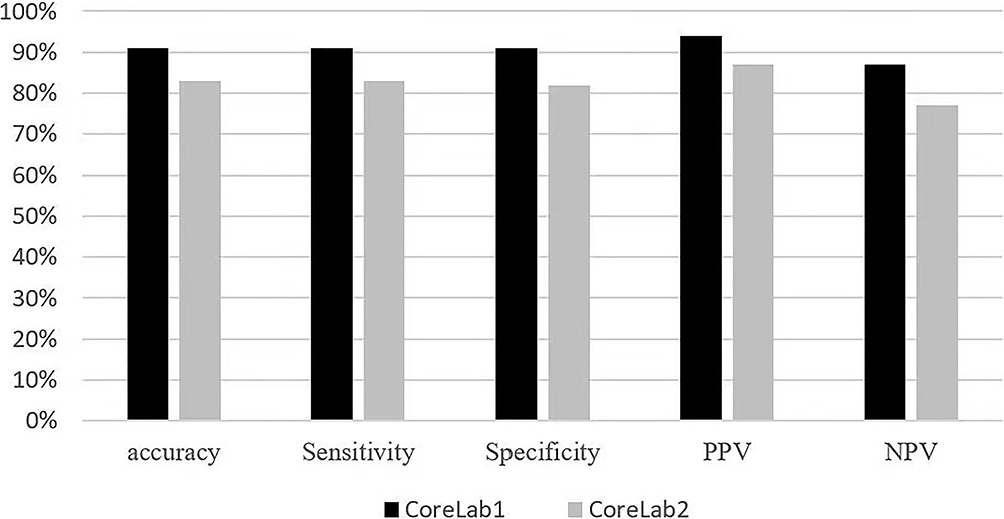 |
Figure 2 Diagnostic characteristics of caFFR between CoreLab1 and CoreLab2. |
Diagnostic Accuracy of caFFR
In all study patients, the mean of FFR and caFFR were both 0.79±0.09 (p=0.202; Figure 3). There was a strong correlation between caFFR and FFR (r=0.911; p<0.001). On Bland-Altman analysis, there was no systematic difference between caFFR and FFR on per-vessel basis (mean difference, 0.0; 95% lower and upper level agreement, –0.009 to 0.002; Figure 4). The AUC of ROC for caFFR was 0.975 (95% CI: 0.953–0.997; p< 0.001). The sensitivity, specificity, PPV, NPV and overall diagnostic accuracy of caFFR in the prediction of FFR ≤0.80 were as follows: 92%; 91%; 94%; 89% and 91%, respectively. At the per-vessel level, there were 56 vessels in the grey zone and 111 vessels in the non-grey zone, with no significant difference in the clinical characteristics between the patients in these two groups (Table 1). Using an FFR cut-off value of ≤0.80 as reference, caFFR correctly identified 42 vessels with an FFR <0.75, 48 vessels with an FFR between 0.75 and 0.80, and 62 vessels with an FFR >0.80. Incorrect identification by caFFR included three vessels with an FFR <0.75, eight with an FFR between 0.75 and 0.80, and four with an FFR >0.80 (Figure 5).
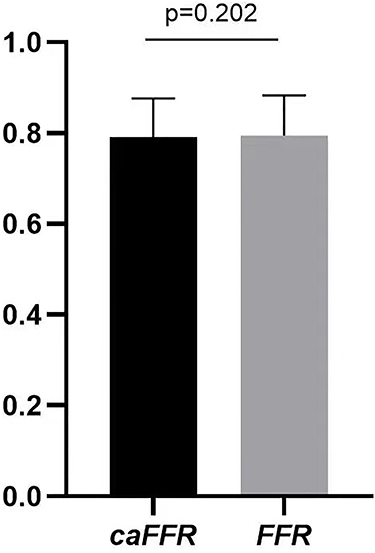 |
Figure 3 Mean of FFR and caFFR (n = 167). |
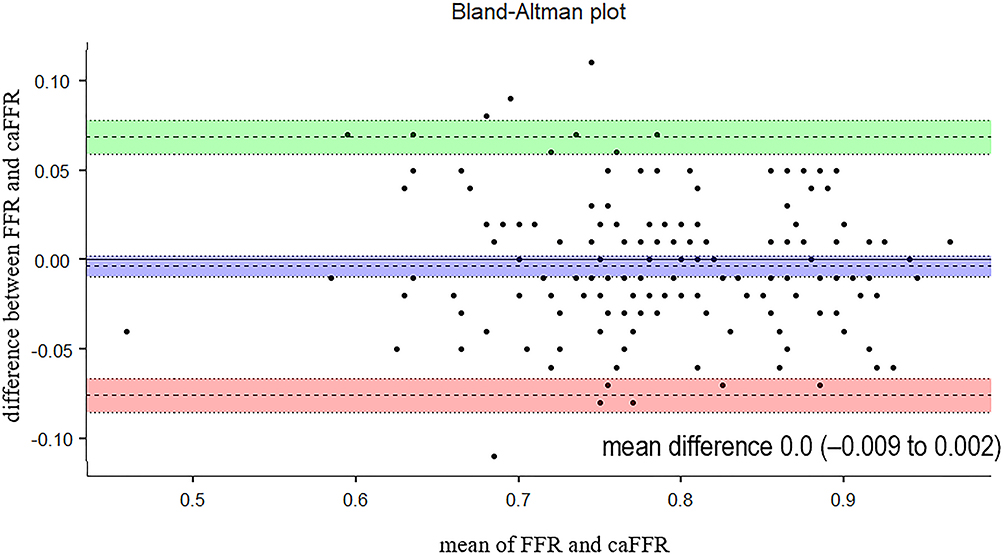 |
Figure 4 Bland-Altman analysis of caFFR and FFR in all patients (purple band means 95% CI of mean difference of caFFR and FFR in all patients, green band means 95% CI of upper limit of agreement, pink band means 95% CI of lower limit of agreement). |
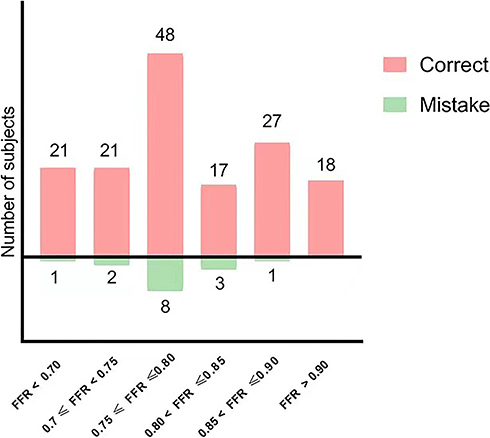 |
Figure 5 Diagnostic performance of caFFR for grey-zone lesions. The diagnostic accuracy of the caFFR in correctly identifying hemodynamically significant lesions among the different FFR groups is observed, with no difference between the grey zone group and the other two groups (FFR <0.75 and FFR >0.80). |
In patients in the grey zone, on Bland-Altman analysis, there was no systematic difference between caFFR and FFR (mean difference, 0.0; 95% lower and upper level agreement, –0.07 to 0.05; Figure 6). There was a medium correlation between caFFR and FFR (r=0.329; p<0.0014) in the prediction of 0.75≤ FFR ≤0.80 and a strong correlation between caFFR and FFR (r=0.774; p<0.001) in the prediction of FFR ≤0.80. The sensitivity, specificity, PPV, NPV and overall diagnostic accuracy of caFFR in the prediction of 0.75≤ FFR ≤0.80 were as follows: 60%, 85%, 66%, 81%, 66%, and 100%, 90%, 90%, 100%, 90%, in the prediction of FFR ≤0.80.
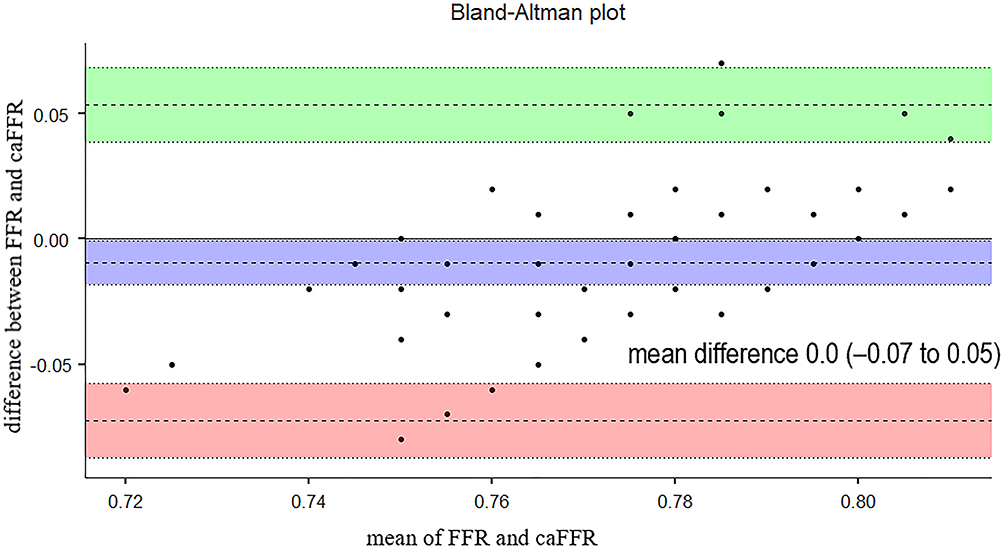 |
Figure 6 Bland-Altman analysis of caFFR and FFR in patients in grey zone (purple band means 95% CI of mean difference of caFFR and FFR in grey zone, green band means 95% CI of upper limit of agreement, pink band means 95% CI of lower limit of agreement). |
In patients in the non-grey zone, there was a strong correlation between caFFR and FFR (r=0.931; p<0.001). On Bland-Altman analysis, there was no systematic difference between caFFR and FFR (mean difference, 0.0; 95% lower and upper level agreement, –0.008 to 0.006; Figure 7). The AUC of ROC for caFFR was 0.927 (95% CI: 0.888–0.967; p< 0.001). The sensitivity, specificity, PPV, NPV and overall diagnostic accuracy of caFFR in the prediction of FFR ≤0.80 were as follows: 98%; 85%; 89%; 98% and 94%, respectively. There was no difference in the diagnostic accuracy of the caFFR between the grey and non-grey zones (chi-squared, 2.899; p=0.09).
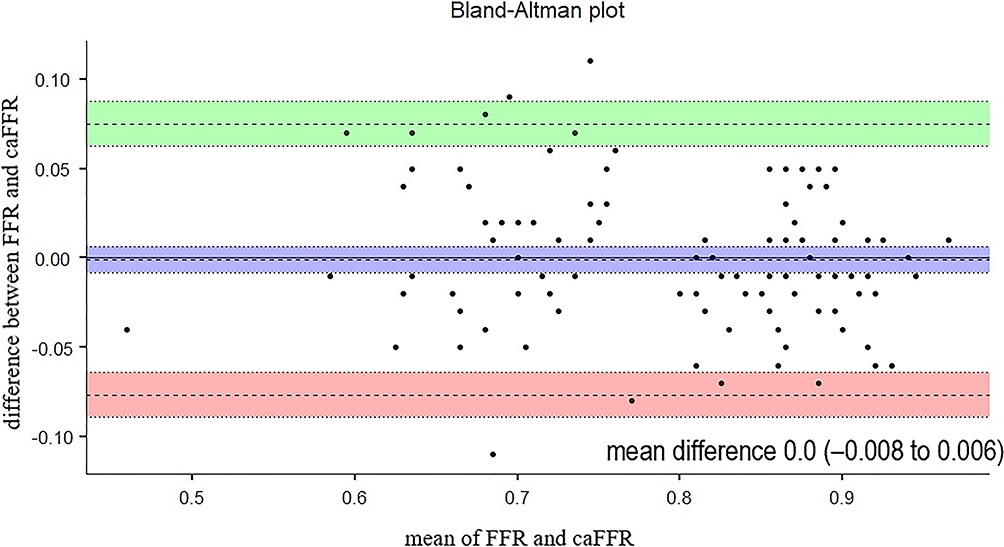 |
Figure 7 Bland-Altman analysis of caFFR and FFR in patients in non-grey zone (purple band means 95% CI of mean difference of caFFR and FFR in non-grey zone, green band means 95% CI of upper limit of agreement, pink band means 95% CI of lower limit of agreement). |
Discussion
The two main findings of our study are as follows: first, inter-observer reliability supports caFFR as a feasible and reproducible method, which can be applied to most conventional CAG images. Second, the diagnostic value of caFFR was lower in the grey zone compared to the non-grey zone.
The methodology of CFD simulates the actual pressure distribution in the coronary artery by calculating specific fluid control equations.18 CFD-derived FFR is based on computed tomography (CT) or transcatheter coronary angiograms and does not require pressure wires or the use of vasodilators. These advantages could increase the application of FFR for the diagnosis of coronary stenosis. Inter-observer agreement of CFD-derived FFR values is essential for the generalizability of the technique in practice. The reproducibility of QFR is reportedly high, with a mean inter-observer error of 0 ± 0.03.19 We identified similar favorable reproducibility of caFFR, with an inter-observer error of 0 ± 0.06. Inter-observer agreement was likely increased by our use of rigorous standard operating procedures for coronary image acquisition, strictly controlled angiography quality, and the elaborate protocol for caFFR analysis used.
CFD-derived FFR software can automatically create a 3-D reconstruction of the coronary artery tree, with manual adjustment of vessel contours required at times. The quality of the image can influence the precision of the examination and thus, the interpretation of the severity of coronary stenosis and the treatment selected.20 The diagnostic value of CT angiography-derived FFR (FFRCT) has been previously demonstrated;21–24 however, it is rather low, ranging from 0.70 to 0.80.25 Moreover, angiography-derived FFR showed a favorable diagnostic performance similar to wire-based FFR, when using an FFR of 0.80 as the cut-off value, the diagnostic accuracy of caFFR was 95.7%,11 similar to those of QFR,8 FFRangio9 and vFFR.10 Our study further confirmed the “good” diagnostic performance of caFFR using the FlashAngio system for offline analysis of caFFR and calculation of outcomes in all study patients (r 0.911, AUC 0.975, diagnostic accuracy 91%).
The cut-off FFR value for revascularization treatment of coronary stenosis varies in clinical literature. While an FFR value <0.75 has been used to predict myocardial ischemia,26 the DEFER trial3 demonstrated the safety of deferring revascularization therapy for patients with stable coronary artery disease when the FFR is >0.75. Although an FFR >0.80 excludes 90% of the cases of stable coronary artery disease,27 some patients with an FFR of 0.75–0.80 present with typical exercise-induced angina pectoris.28 Accordingly, the FAME4 and FAME-25 trials adopted an FFR value of 0.80 to limit the number of ischemic lesions left untreated and demonstrated that the FFR-guided percutaneous coronary artery intervention improved the clinical outcomes of these patients. However, several clinical trials have shown that revascularization does not result in better clinical outcomes for coronary stenosis in patients with an FFR in the grey zone.12–14 In the grey zone, it is essential to maintain a high diagnostic accuracy of FFR derivative indicators to generalize their application to practice to avoid ambiguous decisions regarding treatment. A diagnostic accuracy of 71.3% has been reported for QFR29 and 85.5% for FFRangio.30 In our study, we reported a diagnostic accuracy of caFFR for FFR of 0.75–0.80; although this rate of accuracy was somewhat lower (66%) than previously reported rates, the diagnostic accuracy for FFR ≤0.80 usually used as the standard of ischemia was high (90%). We observed that there was no difference in accuracy between the grey and non-grey zone groups in the prediction of FFR ≤0.80 (90% vs 94%, respectively; p=0.09).
The limitations of our study need to be acknowledged in the interpretation of our findings in clinical practice. First, it was a retrospective, single-center study with a small sample size; this limits the generalizability of our findings. Second, the accuracy of angiography-derived FFR in complex lesions, including bifurcation, diffuse or in-stent restenosis vessels remains to be verified in a large cohort study. Third, all measurements of caFFR were performed by highly trained professional technicians; the reproducibility of caFFR should be verified when calculated by different technicians in real-world clinical practice. Finally, although QFR-guided coronary revascularization can improve clinical outcomes at 1 year compared to standard angiography guided revascularization,31 our study did not consider the long-term effect of caFFR on lesion selection for percutaneous coronary intervention. This will be an important clinical issue to consider in future studies.
Conclusion
In summary, our findings indicate that caFFR is a feasible and reproducible examination for coronary ischemia (including for lesions in the grey zone) and has good correlation with findings on invasive FFR measurements for detecting coronary ischemia. Future studies are warranted to provide further evidence to support the generalizability of caFFR in practice.
Acknowledgments
We are deeply grateful to all the participants in this trial. In addition, we thank Suzhou Rainmed Ltd. for providing us with the FlashAngio console free of charge for research purposes.
Funding
This study was supported by the Chinese Academy of Medical Sciences Innovation Fund for Medical Sciences [Grant Number: 2021-I2M-C&T-A-019], the Beijing Municipal Science & Technology Commission, Administrative Commission of Zhongguancun Science Park [Grant Number: Z211100002921008], and the Beijing Hospital Clinical Research “set sail” Project [Grant Number: BJ-2022-135].
Disclosure
The authors report no conflicts of interest in this work.
References
1. Patel MR, Calhoon JH, Dehmer GJ, et al. ACC/AATS/AHA/ASE/ASNC/SCAI/SCCT/STS 2017. Appropriate use criteria for coronary revascularization in patients with stable ischemic heart disease: a report of the American College of Cardiology Appropriate Use Criteria Task Force, American Association for Thoracic Surgery, American Heart Association, American Society of Echocardiography, American Society of Nuclear Cardiology, Society for Cardiovascular Angiography and Interventions, Society of Cardiovascular Computed Tomography, and Society of Thoracic Surgeons. J Am Coll Cardiol. 2017;69:2212–2241. doi:10.1016/j.jacc.2017.02.001
2. Neumann FJ, Sousa-Uva M, Ahlsson A, et al. 2018 ESC/EACTS guidelines on myocardial. Revascularization. Eur Heart J. 2019;40:87–165. doi:10.1093/eurheartj/ehy394
3. Pijls NH, van Schaardenburgh P, Manoharan G, et al. Percutaneous coronary intervention of functionally nonsignificant stenosis: 5-year follow-up of the DEFER Study. J Am Coll Cardiol. 2007;49:2105–2111. doi:10.1016/j.jacc.2007.01.087
4. Tonino PA, De Bruyne B, Pijls NH, et al. Fractional flow reserve versus angiography for guiding percutaneous coronary intervention. N Engl J Med. 2009;360:213–224. doi:10.1056/NEJMoa0807611
5. De Bruyne B, Pijls NH, Kalesan B, et al. Fractional flow reserve-guided PCI versus medical therapy in stable coronary disease. N Engl J Med. 2012;367:991–1001. doi:10.1056/NEJMoa1205361
6. Davies JE, Sen S, Dehbi HM, et al. Use of the instantaneous wave-free ratio or fractional flow reserve in PCI. N Engl J Med. 2017;376:1824–1834. doi:10.1056/NEJMoa1700445
7. Parikh RV, Liu G, Plomondon ME, et al. Utilization and outcomes of measuring fractional flow reserve in patients with stable ischemic heart disease. J Am Coll Cardiol. 2020;75:409–419. doi:10.1016/j.jacc.2019.10.060
8. Xu B, Tu S, Qiao S, et al. Diagnostic accuracy of angiography-based quantitative flow ratio measurements for online assessment of coronary stenosis. J Am Coll Cardiol. 2017;70:3077–3087. doi:10.1016/j.jacc.2017.10.035
9. Fearon WF, Achenbach S, Engstrom T, et al. Accuracy of fractional flow reserve derived from coronary angiography. Circulation. 2019;139:477–484. doi:10.1161/CIRCULATIONAHA.118.037350
10. Masdjedi K, van Zandvoort LJC, Balbi MM, et al. Validation of a three-dimensional quantitative coronary angiography-based software to calculate fractional flow reserve: the FAST study. EuroIntervention. 2020;16:591–599. doi:10.4244/EIJ-D-19-00466
11. Li J, Gong Y, Wang W, et al. Accuracy of computational pressure-fluid dynamics applied to coronary angiography to derive fractional flow reserve: FLASH FFR. Cardiovasc Res. 2020;116:1349–1356. doi:10.1093/cvr/cvz289
12. Shin D, Lee JM, Lee SH, et al. Non-randomized comparison between revascularization and deferral for intermediate coronary stenosis with abnormal fractional flow reserve and preserved coronary flow reserve. Sci Rep. 2021;11:9126. doi:10.1038/s41598-021-88732-4
13. Kang DY, Ahn JM, Lee CH, et al. Deferred vs. performed revascularization for coronary stenosis with grey-zone fractional flow reserve values: data from the IRIS-FFR registry. Eur Heart J. 2018;39:1610–1619. doi:10.1093/eurheartj/ehy079
14. Hennigan B, Berry C, Collison D, et al. Percutaneous coronary intervention versus medical therapy in patients with angina and grey-zone fractional flow reserve values: a randomised clinical trial. Heart. 2020;106:758–764. doi:10.1136/heartjnl-2019-316075
15. Ai H, Zheng N, Li L, et al. Agreement of angiography-derived and wire-based fractional flow reserves in percutaneous coronary intervention. Front Cardiovasc Med. 2021;8:654392. doi:10.3389/fcvm.2021.654392
16. Choi KH, Dai N, Li Y, et al. Functional coronary angiography-derived index of microcirculatory resistance in patients with ST-segment elevation myocardial infarction. JACC Cardiovasc Interv. 2021;14:1670–1684. doi:10.1016/j.jcin.2021.05.027
17. Pijls NH, Van GB, Van VP, et al. Fractional flow reserve. A useful index to evaluate the influence of an epicardial coronary stenosis on myocardial blood flow. Circulation. 1995;92:3183–3193. doi:10.1161/01.CIR.92.11.3183
18. Frenning G, Ahnfelt E, Sjögren E, Lennernäs H. Computational fluid dynamics (CFD) studies of a miniaturized dissolution system. Int J Pharm. 2017;521:274–281. doi:10.1016/j.ijpharm.2017.01.072
19. Chang Y, Chen L, Westra J, et al. Reproducibility of quantitative flow ratio: an inter-core laboratory variability study. Cardiol J. 2020;27:230–237. doi:10.5603/CJ.a2018.0105
20. Westra J, Sejr-Hansen M, Koltowski L, et al. Reproducibility of quantitative flow ratio: the QREP study. EuroIntervention. 2022;17:1252–1259. doi:10.4244/EIJ-D-21-00425
21. Koo BK, Erglis A, Doh JH, et al. Diagnosis of ischemia-causing coronary stenoses by noninvasive fractional flow reserve computed from coronary computed tomographic angiograms. Results from the prospective multicenter DISCOVER-FLOW (Diagnosis of ischemia-causing stenoses obtained via noninvasive fractional flow reserve) study. J Am Coll Cardiol. 2011;58:1987–1997.
22. Min JK, Leipsic J, Pencina MJ, et al. Diagnostic accuracy of fractional flow reserve from anatomic CT angiography. JAMA. 2012;308:1237–1245. doi:10.1001/2012.jama.11274
23. Nørgaard BL, Leipsic J, Gaur S, et al. Diagnostic performance of noninvasive fractional flow reserve derived from coronary computed tomography angiography in suspected coronary artery disease: the NXT trial (Analysis of coronary blood flow using CT angiography: next steps). J Am Coll Cardiol. 2014;63:1145–1155. doi:10.1016/j.jacc.2013.11.043
24. Xue J, Li J, Sun D, et al. Functional evaluation of intermediate coronary lesions with integrated computed tomography angiography and invasive angiography in patients with stable coronary artery disease. J Transl Intern Med. 2022;10:255–263. doi:10.2478/jtim-2022-0018
25. Cook CM, Petraco R, Shun-Shin MJ, et al. Diagnostic accuracy of computed tomography-derived fractional flow reserve: a systematic review. JAMA Cardiol. 2017;2:803–810. doi:10.1001/jamacardio.2017.1314
26. Pijls NH, De Bruyne B, Peels K, et al. Measurement of fractional flow reserve to assess the functional severity of coronary-artery stenosis. N Engl J Med. 1996;334:1703–1708. doi:10.1056/NEJM199606273342604
27. Pijls NH. Is it time to measure fractional flow reserve in all patients? J Am Coll Cardiol. 2003;41:1122–1124. doi:10.1016/S0735-1097(03)00056-1
28. De Bruyne B, Pijls NH, Bartunek J, et al. Fractional flow reserve in patients with prior myocardial infarction. Circulation. 2001;104:157–162. doi:10.1161/01.CIR.104.2.157
29. Westra J, Andersen BK, Campo G, et al. Diagnostic performance of in-procedure angiography-derived quantitative flow reserve compared to pressure-derived fractional flow reserve: the FAVOR II Europe-Japan study. J Am Heart Assoc. 2018;7:e009603. doi:10.1161/JAHA.118.009603
30. Witberg G, De Bruyne B, Fearon WF, et al. Diagnostic performance of angiogram-derived fractional flow reserve: a pooled analysis of 5 prospective cohort studies. JACC Cardiovasc Interv. 2020;13:488–497. doi:10.1016/j.jcin.2019.10.045
31. Xu B, Tu S, Song L, et al. Angiographic quantitative flow ratio-guided coronary intervention (FAVOR III China): a multicentre, randomised, sham-controlled trial. Lancet. 2021;398:2149–2159. doi:10.1016/S0140-6736(21)02248-0
 © 2023 The Author(s). This work is published and licensed by Dove Medical Press Limited. The full terms of this license are available at https://www.dovepress.com/terms.php and incorporate the Creative Commons Attribution - Non Commercial (unported, v3.0) License.
By accessing the work you hereby accept the Terms. Non-commercial uses of the work are permitted without any further permission from Dove Medical Press Limited, provided the work is properly attributed. For permission for commercial use of this work, please see paragraphs 4.2 and 5 of our Terms.
© 2023 The Author(s). This work is published and licensed by Dove Medical Press Limited. The full terms of this license are available at https://www.dovepress.com/terms.php and incorporate the Creative Commons Attribution - Non Commercial (unported, v3.0) License.
By accessing the work you hereby accept the Terms. Non-commercial uses of the work are permitted without any further permission from Dove Medical Press Limited, provided the work is properly attributed. For permission for commercial use of this work, please see paragraphs 4.2 and 5 of our Terms.