Back to Journals » Clinical Epidemiology » Volume 17
Accounting for Comorbidity in Etiologic Research
Authors Khachadourian V ![]() , Janecka M
, Janecka M
Received 23 May 2025
Accepted for publication 27 August 2025
Published 22 October 2025 Volume 2025:17 Pages 837—844
DOI https://doi.org/10.2147/CLEP.S535276
Checked for plagiarism Yes
Review by Single anonymous peer review
Peer reviewer comments 2
Editor who approved publication: Professor Lars Pedersen
Vahe Khachadourian,1 Magdalena Janecka1,2
1Department of Child and Adolescent Psychiatry, NYU Grossman School of Medicine, New York, NY, USA; 2Department of Population Health, NYU Grossman School of Medicine, New York, NY, USA
Correspondence: Vahe Khachadourian, Department of Child and Adolescent Psychiatry, NYU Grossman School of Medicine, New York, NY, USA, Email [email protected]
Introduction: Comorbidity between disorders is pervasive, and its relationship to the main conditions under investigation needs to be addressed for robust causal inference. However, many clinical etiologic studies still fail to capitalize on the theoretical advancements and improved recommendations regarding covariate adjustment in this context. Specifically, studies often lack explicit causal assumptions about the role of comorbidity in exposure–outcome relationships, potentially leading to inappropriate accounting for comorbid conditions and resulting in biased effect estimates. This study aims to explore common causal structures involving comorbidity and provide guidance for handling it in etiologic research.
Methods: We use Directed Acyclic Graphs (DAGs) to depict six causal scenarios involving comorbidity as a confounder, mediator, collider, or consequence of the exposure or outcome, illustrated with real-world clinical examples. Simulations were conducted across 5,000 iterations for each scenario, assessing the impact of conditioning on comorbidity under four effect measures (risk difference, odds ratio, risk ratio, and mean difference). Bias was evaluated by comparing adjusted and unadjusted effect estimates to the true values.
Results: The impact of conditioning on comorbidity varied by its causal role. Adjusting for comorbidity mitigated bias when it acted as a confounder but introduced bias when it was a mediator or collider. In instances where comorbidity was a consequence of either the exposure or outcome, the decision to adjust depended on the research objectives and could vary across effect measures.
Discussion: Explicit causal assumptions are essential for selecting appropriate analytical strategies in etiologic research. This study provides practical guidance on analytical handling of the measures of comorbidity, highlighting the need for study design and analysis to align with research objectives. Future work should address more complex causal structures and other methodological challenges.
Keywords: etiologic research, causal inference, comorbidity, epidemiology, simulation study
Introduction
Over the past decades, etiologic research on human disease has advanced significantly due to improvements in causal inference methodology, availability of health records – including registry-based studies – and establishment of international consortia allowing researchers to gauge the generalizability of results. Throughout, a considerable focus in observational studies has been placed on reducing confounding and other biases.1 Although numerous publications2–5 have now addressed various aspects of “adjustment” in design or analyses, many of these works are either theory-based or focused on specific causal structures,3,4 limiting their wider implementation in applied research. Specifically, the issue of comorbidity, its various causal relationships with the outcome of interest, and downstream analytical recommendations have not been widely discussed. Therefore, addressing the issue of comorbidity in etiologic studies, integrating clinical perspectives and concepts, could help bridge the gap between methodological knowledge and practice.
Comorbidity, first defined by Feinstein (1970),6 is the presence (existence or occurrence) of another distinct health condition in an individual with the index disease. However, the definition and interpretation of comorbidity varies.7,8 A primary point of divergence is its scope; indices like the Charlson Comorbidity Index,9,10 for example, focus on a specific list of chronic conditions, whereas other study contexts may define comorbidity more broadly to include any co-occurring diagnosis.11 Despite these definitional nuances, studies consistently show that comorbidity is a common phenomenon.12
Given the pervasive nature of comorbidity in many disorders,13 etiologic studies often consider comorbidity in their design or analyses.14–19 The motivations for such considerations could include understanding the risk factors for the disease of interest “independent” of its comorbidity,20 control of confounding,21 minimizing misclassification,22 or to study effect measure modification by comorbidity.23,24 Despite these various contexts for considering comorbidity in etiologic research, the underlying motivation is most often to reduce bias or obtain a valid estimate for the parameters of interest. For instance, in pharmacoepidemiologic research, a large observational study assessing the effect of sodium-glucose cotransporter-2 (SGLT2) inhibitors on cardiovascular outcomes adjusted for baseline comorbidities such as obesity and nephropathy to control for potential confounding of the exposure–outcome relationship, yielding a more precise estimate of the drug’s true effect.25
As there is no universally assumed (or universally true) causal structure between comorbidity8 and other variables in a study, a one-size-fits-all solution for accounting for comorbidity in etiologic research does not exist. For instance, comorbidity could be a risk factor for the index disease, its consequence, or share a common cause with it. Depending on the causal structure at hand, adjusting for comorbidity can change the effect estimate of the exposure on the outcome, sometimes resulting in attenuation, amplification, or even reversal of the estimated association relative to the comorbidity unadjusted associations.2–4,26 Understanding the scenarios under which comorbidity adjustment is made and its impact on the main effect of exposure on the index diagnosis is therefore critical.
As the definition of comorbidity does not imply any causal relation or even temporal order between the index disease and the co-occurring comorbid conditions, it is important to be clear about the assumed structure(s) – which often is critical for informing the correct design or analytical strategy. However, a review of the literature reveals that the handling of comorbidity in the design and analysis of etiologic studies often lacks explicit assumptions about their relationship with other variables or may in fact not fully align with the study objectives.14,19
In this paper, we therefore explore several common causal structures involving an exposure, index disease (outcome) and its comorbidity. For each scenario, we discuss the impact of adjusting for comorbidity on the effect estimates, as well as other potential considerations. We hope this piece can provide guidance for accounting for comorbidity (and potentially other covariates) in epidemiological research and contribute to improved causal inference.
Controlling for comorbidity extends beyond adjustment in the analytical model and can occur by restricting the sample based on comorbidity, stratified sampling or analysis based on comorbidity, or handling differential loss to follow-up or non-random missingness patterns. Henceforth, for ease of reading, we use conditioning and adjusting interchangeably, and unless otherwise specified, the statements about adjustment are applicable to all other conditioning approaches.
Methods
Possible Structure of Associations
Explicitly stating the causal assumptions is critical for the choice of the study design or analytical methods, and clear communication and justification of these decisions. Causal diagrams, specifically Directed Acyclic Graphs (DAGs)27 are a common tool in causal inference for depicting assumptions and assessing bias. A concise and accessible description of the causal diagrams is provided by Greenland et al.28
Here, we use DAGs to depict possible common scenarios underpinning the associations between exposure (X), index condition (outcome; Y) and comorbidity (C):
- Comorbidity as a common cause of X and Y
- Comorbidity as a mediator of the effects of X on Y
- Comorbidity as a collider in the association between X and Y
- Comorbidity as a consequence of X, but not a risk factor for Y
- Comorbidity as a risk factor of Y, but independent of X
- Comorbidity as a consequence of Y, but not directly associated with X
Effect Measures
The impact of adjusting for comorbidity on the estimate of the total effect depends on the choice of effect measures. To extend the applications of our work, for each of the above scenarios presented, we will assess and discuss the effect of conditioning on comorbidity for four different effect measures; 1) risk difference (RD) (linear risk regression), 2) risk ratio (RR) (log binomial regression), 3) odds ratio (OR) (logistic regression), and 4) least squares mean difference (LSMD) (least squares regression).
Simulation Setting
We conducted a simulation study to assess the effect of conditioning on covariate C in each of the causal structures presented in Figure 1. The parameters for the simulations, along with the analytical code, can be accessed at https://github.com/v-k-lab/comorbidity. Briefly, for each of the causal structures presented in Figure 1, we made 5,000 iterations of simulated studies with sample size 10,000. For simplicity, we assumed X and C are both binary variables. For each causal diagram, we simulated 4 sets of outcomes (Y): three binary endpoints (eg, hip fracture) corresponding to the total effect of X on Y on the RD, RR, and OR scales to be 0.2, 2, and 2 respectively; and one normally distributed, continuous endpoint (eg, serum cholesterol level) for which the total effect of X on Y measured by the mean difference was equal to 2.
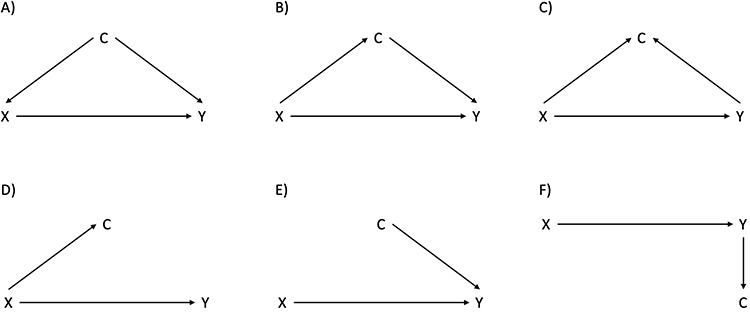 |
Figure 1 Depicting causal relation between exposure (X), index disease (Y), and comorbidity (C) in selected common scenarios using Directed Acyclic Graphs (DAGs). (A) DAG 1; (B) DAG 2; (C) DAG 3; (D) DAG 4; (E) DAG 5; (F) DAG 6. |
The simulation for the causal structure depicted in Figure 1 panel A included the following steps:
- Simulate binary covariate, C, with a probability of pc.
- Simulate a binary exposure variable, X (0, 1), where the probability of X, px, was assumed to be a function of C, P(X = 1|C).
- Simulate a response Y, where Y was assumed to be a function of X and C.
- The response for the linear risk regression estimating RD was simulated by:P(Y = 1|X, C) = 0.2 + 0.2 × x + 0.2 × c
- The response for the log binomial model estimating RR was simulated by:P(Y = 1|X, C) = exp(log(0.2) + log(2) × x + log(2) × c)
- The response for the logistic regression model estimating OR was simulated by:P(Y = 1|X, C) = 1/(1 + exp(-(log(0.4) + log(2) × x + log(2) × c)))
- The response for the linear regression model estimating mean difference was simulated byE(Y|X, C) = N~(2, 22) + N~(2 × x, 22) + N~(2 × c, 22)
- Run the following models:
- Linear risk regression model estimating effect of X on Y, with and without adjusting for C. The effect measure from this model is RD.
- log binomial regression model estimating effect of X on Y, with and without adjusting for C. Exponentiate coefficient of X to obtain RR.
- logistic regression model estimating effect of X on Y, with and without adjusting for C. Exponentiate coefficient of X to obtain OR.
- least squares regression model estimating effect of X on Y, with and without adjusting for C. The effect measure from this model is LSMD.
- Repeat steps 1–4, 5,000 times.
The point estimate for each effect measure was the median of the estimates from the 5,000 iterations and the lower and upper limits of the 95% CI corresponded to the 2.5th and 97.5th percentile of these 5,000 estimates. Given the true effect estimate for RR, OR, and LSMD was 2, the coefficient of x from each model was evaluated based on the relative bias (estimated effect - 2)/2. For RD, the relative bias was estimated as (estimated effect - 0.2)/0.2
Furthermore, to enhance the real-world applicability of our study, we extended our analyses to scenarios where C is either categorical or continuous, and assessed the impact of misclassification of covariate C on the C adjusted estimated effect.
Results
Anticipated Effect of Conditioning on Comorbidity and Simulation Results
Table 1 presents simulation results. For each of these causal diagrams, the crude and C-adjusted estimated association between X and Y, along with their 95% CI intervals, were summarized for RD, RR, OR, and LSMD effect measures. The relative bias of the point estimate was reported as percentage difference from the unbiased estimate.
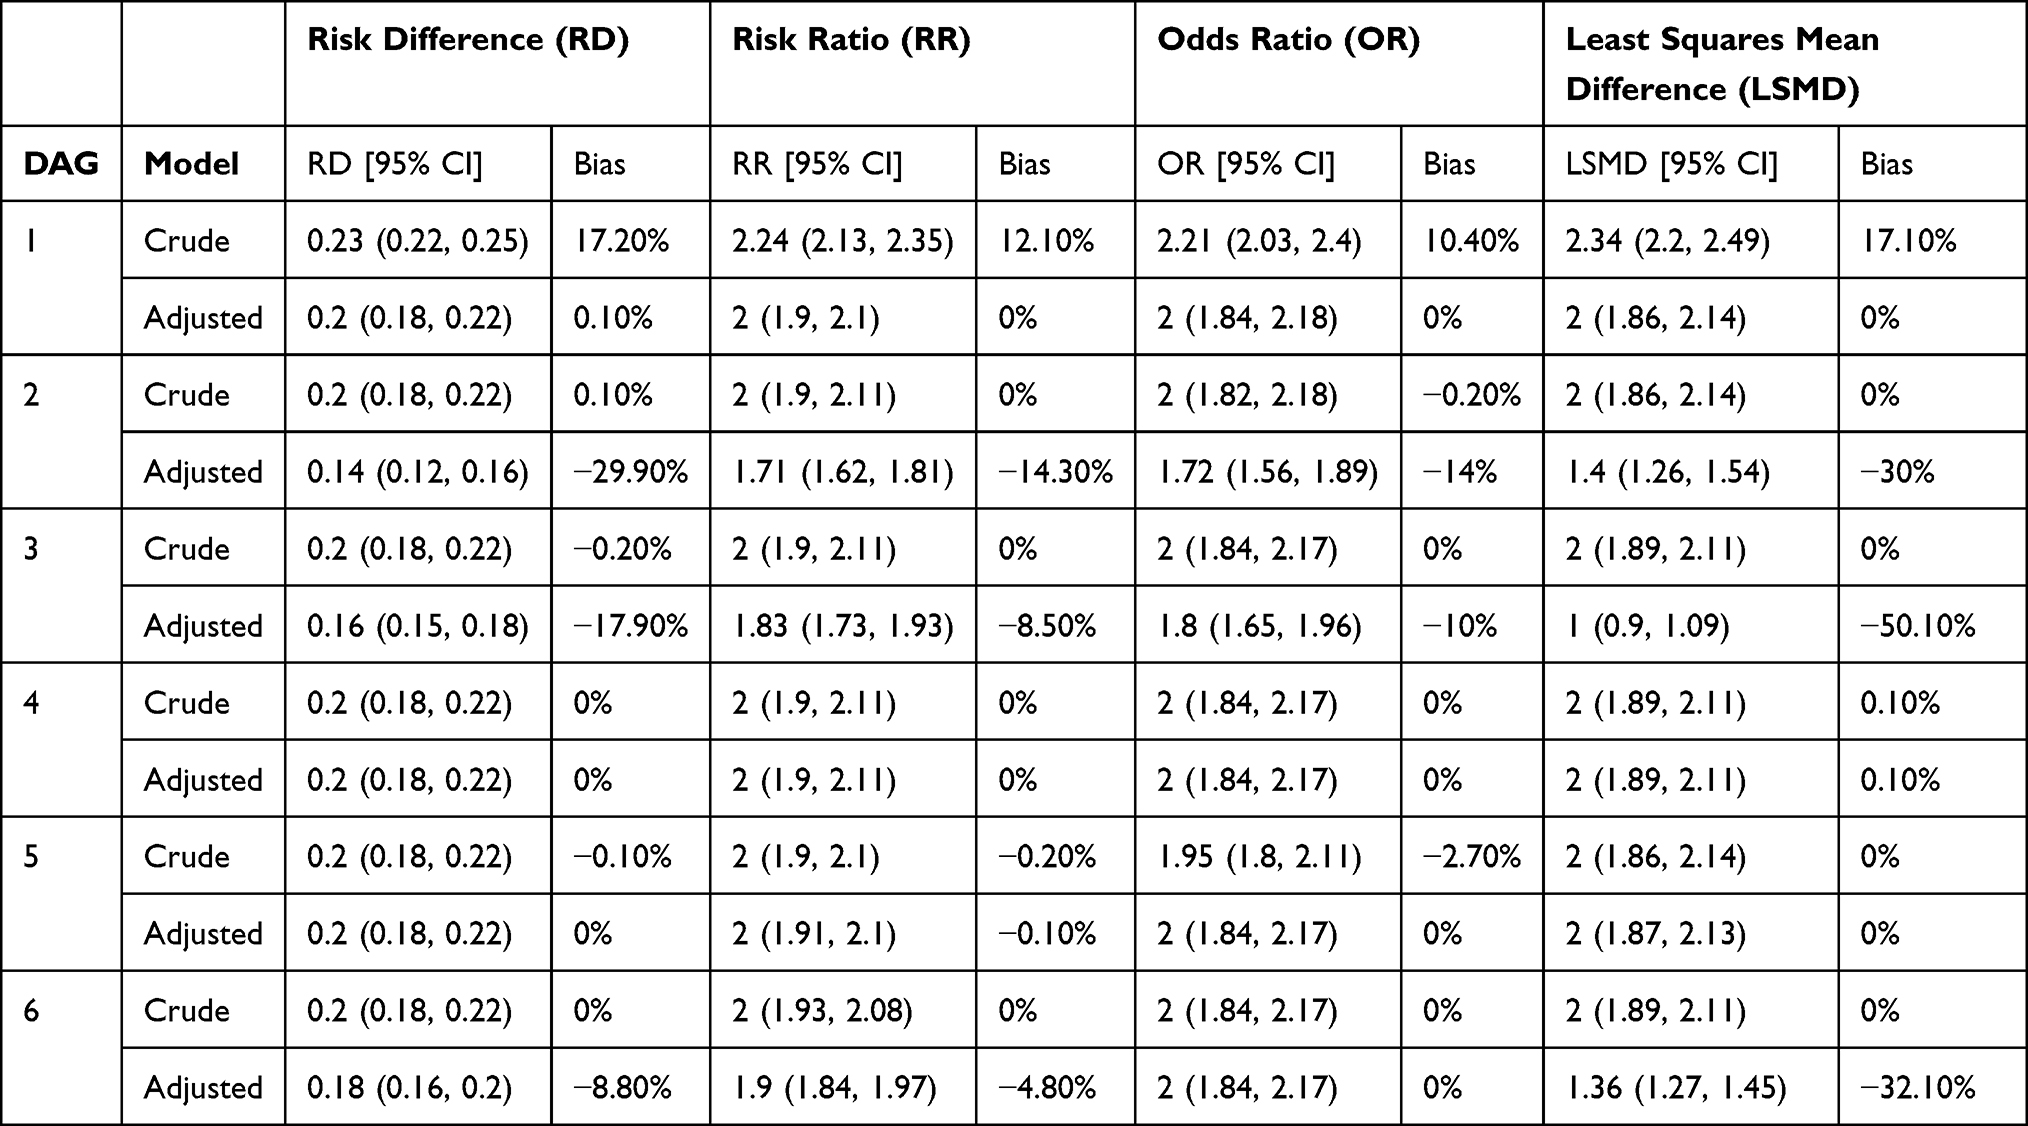 |
Table 1 Association Between Exposure (X) and Index Disease (Y) in Crude and Comorbidity (C) Adjusted Models for Different Causal Scenarios |
DAG 1: Comorbidity as a Common Cause of X and Y
Real-world example: Obesity (C) in a study of the effects of type 2 diabetes mellitus (X) on ischemic heart disease (Y).
In this scenario, comorbidity is the common cause of exposure and outcome, fulfilling the definition of a confounder. Using DAGs, we observe the open back door path from X to C to Y, resulting in bias. Conditioning on comorbidity is warranted, and failure to condition on comorbidity in this case will result in confounding of the effect estimate of X on Y. The crude estimate was biased for all three models, and the adjusted estimates remained unbiased (Table 1, DAG 1).21
Recommended strategy is to adjust for comorbidity.
DAG 2: Comorbidity as a Mediator of the Effects of X on Y
Real-world example: hyperlipidemia (C) in a study of the effects of sedentary lifestyle (X) on ischemic heart disease (Y).
In this case, the path from X to C to Y is causal. C is a mediator on the path reflecting the indirect effect of X to Y. Therefore, conditioning on C resulted in bias in the estimate of the total effect of X on Y, whereas the unconditional effect remained unbiased (Table 1, DAG 2).
Recommended strategy is to not adjust for comorbidity.
DAG 3: Comorbidity as a Collider
Real-world example: injury (C) in a study of the effects of alcohol use (X) on depression (Y).
When the comorbidity is caused by both exposure and index disease, the path connecting exposure and index disease through comorbidity is closed and the comorbidity serves as a collider on that path. Here, the crude estimate provided unbiased effect estimates, and adjusting for C resulted in bias (collider stratification bias) in the estimates.2,4 This bias is present regardless of the analytical model used, and its magnitude depends on the strength of the association between X and C; and Y and C (Table 1, DAG 3).
Recommended strategy is to not adjust for comorbidity.
DAG 4: Comorbidity as a Consequence of X, but Not a Risk Factor for Y
Real-world example: liver failure (C) in a study of the effects of alcohol use (X) on dementia (Y).
In this case, either conditioning on C or not will not bias the estimate of the effect of X on Y, and both crude and C-adjusted models provided unbiased estimates of RD, RR, OR, and LSMD (Table 1, DAG 4).
Recommended strategy is that both adjusting or not adjusting are fine and will not result in bias.
DAG 5: Comorbidity as a Risk Factor of Y, but Independent of X
Real-world example: alcohol abuse (C) in a study of the effects of air pollution (X) on hepatic cancer (Y).
When comorbidity is a risk factor for the index disease but is not associated with the exposure, adjusting for comorbidity does not introduce bias. RD, RR and LSMD are unbiased in both crude and adjusted models. For the OR, the results for the adjusted and crude models differ due to the non-collapsibility of the OR, representing conditional and marginal effects, respectively. Both estimates are unbiased for their respective target parameters. However, due to the non-collapsibility of nonlinear models (eg, logistic regression), the conditional and marginal effects of X on Y could differ, and the difference in the estimates between the crude and adjusted models reflects the difference in the underlying effects being estimated, and not necessarily possible bias.3,29–31 The choice of the model should be guided by clear definition of the underlying effect of interest.
Recommended strategy is that both adjusting or not adjusting for comorbidity are analytically sound and will not result in bias.
DAG 6: Comorbidity as a Consequence of Y, but Not Directly Associated with X
Real-world example: opportunistic infection (C) in a study of the effects of syringe service program (X) on risk of HIV infection (Y).
When the disease is a risk factor for comorbidity, the crude estimates are unbiased. However, under the assumption that X has an effect on Y, conditioning on comorbidity in the linear models (eg, RD, RR and LSMD) leads to biased estimates, while the OR from the adjusted model remained unbiased (Table 1, DAG 6). None of the models will be biased by adjusting for C if the effect of X on Y is null.3
Recommended strategy is that both adjusting or not adjusting for comorbidity will not result in bias in OR. It is recommended to not adjust for comorbidity in linear risk, log binomial, and least squares regression models.
The additional analyses, using either a categorical or continuous specification of the covariate C, yielded results consistent with the main findings (Supplemental Table S1). Furthermore, models incorporating misclassified measures of comorbidity—whether differentially or non-differentially misclassified with respect to exposure—produced effect estimates that fell between those from the crude model and those adjusted for correctly measured C (Supplemental Table S2) for causal structures depicted in DAGs 1–4 and DAG 6. This pattern was also true when adjusting for non-differentially misclassified C in the causal structure depicted in DAG 5. Nevertheless, when adjusting for differentially misclassified C in the causal structure depicted in DAG 5, estimates could fall outside the range defined by those from the crude models and those adjusted for correctly measured C.
Additional analyses yielded a consistent pattern across varying levels of misclassification in scenarios with binary exposure and binary outcome: regardless of whether comorbidity acted as a confounder or a mediator, the effect estimates fell between those from the crude model and those adjusted for correctly measured C (Supplemental Figure S1).
Discussion
This study provides a detailed exploration of the potential roles of comorbidity in the association between exposure and index disease, highlighting the diverse causal relationships that can exist between these variables. Accounting for the correct causal structure has extensive implications for causal inference in etiologic research. By systematically examining common causal structures and their effects on bias, this work addresses a critical but underexplored issue: the appropriate handling of comorbidity in causal research.
Our findings confirm that the role of comorbidity in the exposure–outcome relationship determines the impact of conditioning. When comorbidity acts as a confounder, conditioning effectively mitigates confounding bias across all the effect measures (eg, risk difference [RD], risk ratio [RR], odds ratio [OR], and least-squares mean difference [LSMD]). Conversely, when comorbidity serves as a mediator or collider, conditioning introduces bias into the total effect estimate of the exposure on the outcome. This highlights the critical need to avoid inappropriate adjustments.
When comorbidity is either a cause or consequence of the exposure but has no direct connection to the outcome (except through the exposure), adjusting for comorbidity does not affect the estimated effect. However, if comorbidity is a consequence of the outcome, rather than exposure, adjustment introduces bias in log-binomial and linear regression models, but not in logistic regression models. If comorbidity is a cause of the outcome, adjusting for it does not result in bias. However, in nonlinear models like logistic regression, the distinction between marginal and conditional effects due to the non-collapsibility of effect measures emphasizes the importance of aligning analytical strategies with study objectives, which extends beyond merely minimizing bias. For example, marginal effects provide insight into the exposure’s effect on the outcome at the population level, whereas, the conditional effect could be more relevant for inference on an individual level.
Although our results demonstrate that inappropriate handling of comorbidity in the analyses could lead to bias, it is important to note that the direction and magnitude of such bias depend on the distribution and prevalence of the exposure, outcome, comorbidity, and the nature of the associations among these variables. While our primary focus was on comorbidity expressed as a binary measure (presence/absence of a co-occurring condition), additional analyses using categorical and continuous expressions of comorbidity showed that our approach extends to other variable types.
Furthermore, although our examples focused on a single comorbidity at a time, in practice, multiple comorbid conditions may be associated with the index disease. The relation of these comorbidities with the study exposure and the index disease could be different, and each should be considered according to underlying assumptions and their causal relations.
We also illustrated the effects of differential and non-differential misclassification of comorbidity in scenarios with binary exposure and comorbidity. While in our main analyses we assumed no measurement error, no selection bias, and no model misspecification, in real-life settings, and in the presence of one or more of these issues, the impact of adjusting for comorbidity on the overall bias might change.
We focus on comorbidity as a tangible, interpretable example to emphasize the importance of causal reasoning in etiologic research. However, the principles extend far beyond this context. The analytical challenges and strategies we explored reflect the well-established concepts in causal inference,1–3,27 which provide a principled framework for evaluating covariates—whether demographic factors, co-medications, or clinical markers—and are instrumental for valid inference across a wide range of research setting.
In conclusion, this study corroborated the results from the simulations and theoretical insights, illustrating how the causal role of comorbidity influences bias under various analytical strategies. Our results emphasize the importance of explicit causal assumptions and appropriate model selection to ensure valid inferences. By examining several common causal structures between exposure, index disease and its comorbidity, this study provides practical guidance for refining study design and analytical methods. While no universal approach exists for handling comorbidity, integrating methodological rigor with clinical insight – essential to decide which of the causal structures is most applicable in the study setting – will enhance the validity and applicability of etiologic research.
Acknowledgment
This paper has been uploaded to medRvix as a preprint: https://www.medrxiv.org/content/10.1101/2025.01.19.25320775v1
Disclosure
V.K. is currently employed by Takeda Pharmaceutical Company outside of the submitted work. M.J. declares no competing interests in this work.
References
1. Grimes DA, Schulz KF. Bias and causal associations in observational research. Lancet. 2002;359(9302):248–252. doi:10.1016/S0140-6736(02)07451-2
2. Digitale JC, Martin JN, Glidden DV, Glymour MM. Key concepts in clinical epidemiology: collider-conditioning bias. J Clin Epidemiol. 2023;161:152–156. doi:10.1016/j.jclinepi.2023.07.004
3. Schisterman EF, Cole SR, Platt RW. Overadjustment bias and unnecessary adjustment in epidemiologic studies. Epidemiology. 2009;20(4):488–495. doi:10.1097/EDE.0b013e3181a819a1
4. Holmberg MJ, Andersen LW. Collider Bias. JAMA. 2022;327(13):1282. doi:10.1001/jama.2022.1820
5. Etminan M, Brophy JM, Collins G, Nazemipour M, Mansournia MA. To adjust or not to adjust: the role of different covariates in cardiovascular observational studies. Am Heart J. 2021;237:62–67. doi:10.1016/j.ahj.2021.03.008
6. Feinstein AR. The pre-therapeutic classification of co-morbidity in chronic disease. J Chronic Dis. 1970;23(7):455–468. doi:10.1016/0021-9681(70)90054-8
7. van den Akker M, Buntinx F, Knottnerus JA. Comorbidity or multimorbidity. Eur J Gener Pract. 1996;2(2):65–70. doi:10.3109/13814789609162146
8. Valderas JM, Starfield B, Sibbald B, Salisbury C, Roland M. Defining comorbidity: implications for understanding health and health services. Anna Family Med. 2009;7(4):357–363. doi:10.1370/afm.983
9. Charlson ME, Carrozzino D, Guidi J, Patierno C. Charlson comorbidity index: a critical review of clinimetric properties. Psychother Psychosom. 2022;91(1):8–35. doi:10.1159/000521288
10. Charlson ME, Pompei P, Ales KL, MacKenzie CR. A new method of classifying prognostic comorbidity in longitudinal studies: development and validation. J Chronic Dis. 1987;40(5):373–383. doi:10.1016/0021-9681(87)90171-8
11. Khachadourian V, Kodesh A, Levine S, et al. Maternal psychiatric diagnosis and comorbidities around pregnancy. Biol Psychiatry. 2021;89(9):S96. doi:10.1016/j.biopsych.2021.02.251
12. Starfield B. Threads and Yarns: weaving the tapestry of comorbidity. Anna Family Med. 2006;4(2):101–103. doi:10.1370/afm.524
13. Khachadourian V, Mahjani B, Sandin S, et al. Comorbidities in autism spectrum disorder and their etiologies. Transl Psychiatry. 2023;13(1):71. doi:10.1038/s41398-023-02374-w
14. Kanina A, Larsson H, Sjölander A, et al. Association between cumulative psychosocial adversity in the family and ADHD and autism: a family-based cohort study. Transl Psychiatry. 2023;13(1):282. doi:10.1038/s41398-023-02571-7
15. Zhuang S, Na M, Winkelman JW, et al. Association of restless legs syndrome with risk of suicide and self-harm. JAMA Network Open. 2019;2(8):e199966. doi:10.1001/jamanetworkopen.2019.9966
16. Alonso J, de Jonge P, Lim CCW, et al. Association between mental disorders and subsequent adult onset asthma. J Psychiatr Res. 2014;59:179–188. doi:10.1016/j.jpsychires.2014.09.007
17. Borrelli A, Spencer K, Birch R. Adjusting for comorbidity in observational cancer studies: a systematic review to assess alignment between index and study. Int J Oncol. 2022;62(1):9. doi:10.3892/ijo.2022.5457
18. Federico A, Zgodic A, Flory K, et al. Predictors of autism spectrum disorder and ADHD: results from the national survey of children’s health. Disabil Health J. 2024;17(1):101512. doi:10.1016/j.dhjo.2023.101512
19. Song IG, Kim HS, Cho YM, et al. Association between birth weight and neurodevelopmental disorders assessed using the Korean national health insurance service claims data. Sci Rep. 2022;12(1):2080. doi:10.1038/s41598-022-06094-x
20. Navarro‐Cano G, Del Rincón I, Pogosian S, Roldán JF, Escalante A. Association of mortality with disease severity in rheumatoid arthritis, independent of comorbidity. Arthritis Rheum. 2003;48(9):2425–2433. doi:10.1002/art.11127
21. Schneeweiss S, Maclure M. Use of comorbidity scores for control of confounding in studies using administrative databases. Int J Epidemiol. 2000;29(5):891–898. doi:10.1093/ije/29.5.891
22. Bossini L, Casolaro I, Caterini C, et al. Diagnostic mistakes in post-traumatic stress disorder. The problem of symptom overlap with depression. Psychiatr Pol. 2013;47(6):1051–1063. doi:10.12740/PP/20380
23. Liu YC, Liao YT, Wen MH, Chen VCH, Chen YL. The association between autism spectrum disorder and precocious puberty: considering effect modification by sex and neuropsychiatric comorbidities. J Pers Med. 2024;14(6):632. doi:10.3390/jpm14060632
24. Khachadourian V, Arildskov ES, Grove J, et al. Familial confounding in the associations between maternal health and autism. Nat Med. 2025;31(3):996–1007. doi:10.1038/s41591-024-03479-5
25. Kosiborod M, Cavender MA, Fu AZ, et al. Lower risk of heart failure and death in patients initiated on sodium-glucose cotransporter-2 inhibitors versus other glucose-lowering drugs: the CVD-REAL study (Comparative effectiveness of cardiovascular outcomes in new users of sodium-glucose cotransporter-2 inhibitors). Circulation. 2017;136(3):249–259. doi:10.1161/CIRCULATIONAHA.117.029190
26. Arah OA. Bias analysis for uncontrolled confounding in the health sciences. Annu Rev Public Health. 2017;38(1):23–38. doi:10.1146/annurev-publhealth-032315-021644
27. Pearl J. Causal diagrams for empirical research. Biometrika. 1995;82(4):669–688. doi:10.1093/biomet/82.4.669
28. Greenland S, Pearl J, Robins JM. Causal diagrams for epidemiologic research. Epidemiology. 1999;10(1):37–48. doi:10.1097/00001648-199901000-00008
29. Steingrimsson JA, Hanley DF, Rosenblum M. Improving precision by adjusting for prognostic baseline variables in randomized trials with binary outcomes, without regression model assumptions. Contemp Clin Trials. 2017;54:18–24. doi:10.1016/j.cct.2016.12.026
30. Greenland S. Noncollapsibility, confounding, and sparse-data bias. Part 1: the oddities of odds. J Clin Epidemiol. 2021;138:178–181. doi:10.1016/j.jclinepi.2021.06.007
31. Greenland S. Noncollapsibility, confounding, and sparse-data bias. Part 2: what should researchers make of persistent controversies about the odds ratio? J Clin Epidemiol. 2021;139:264–268. doi:10.1016/j.jclinepi.2021.06.004
 © 2025 The Author(s). This work is published and licensed by Dove Medical Press Limited. The
full terms of this license are available at https://www.dovepress.com/terms
and incorporate the Creative Commons Attribution
- Non Commercial (unported, 4.0) License.
By accessing the work you hereby accept the Terms. Non-commercial uses of the work are permitted
without any further permission from Dove Medical Press Limited, provided the work is properly
attributed. For permission for commercial use of this work, please see paragraphs 4.2 and 5 of our Terms.
© 2025 The Author(s). This work is published and licensed by Dove Medical Press Limited. The
full terms of this license are available at https://www.dovepress.com/terms
and incorporate the Creative Commons Attribution
- Non Commercial (unported, 4.0) License.
By accessing the work you hereby accept the Terms. Non-commercial uses of the work are permitted
without any further permission from Dove Medical Press Limited, provided the work is properly
attributed. For permission for commercial use of this work, please see paragraphs 4.2 and 5 of our Terms.