Back to Journals » Neuropsychiatric Disease and Treatment » Volume 13
Abnormal regional spontaneous neural activity in visual pathway in retinal detachment patients: a resting-state functional MRI study
Authors Huang X, Li D ![]() , Li H, Zhong Y, Freeberg S
, Li H, Zhong Y, Freeberg S ![]() , Bao J
, Bao J ![]() , Zeng X, Shao Y
, Zeng X, Shao Y ![]()
Received 29 July 2017
Accepted for publication 21 September 2017
Published 22 November 2017 Volume 2017:13 Pages 2849—2854
DOI https://doi.org/10.2147/NDT.S147645
Checked for plagiarism Yes
Review by Single anonymous peer review
Peer reviewer comments 3
Editor who approved publication: Professor Wai Kwong Tang
Xin Huang,1,2,* Dan Li,3,* Hai-Jun Li,3 Yu-Lin Zhong,1 Shelby Freeberg,4 Jing Bao,1 Xian-Jun Zeng,3 Yi Shao1
1Department of Ophthalmology, The First Affiliated Hospital of Nanchang University, Jiangxi Province Clinical Ophthalmology Institute, Nanchang, Jiangxi, People’s Republic of China; 2Department of Ophthalmology, Eye Center, Renmin Hospital of Wuhan University, Wuhan University, Wuhan, Hubei, People’s Republic of China; 3Department of Radiology, The First Affiliated Hospital of Nanchang University, Nanchang, Jiangxi, People’s Republic of China; 4Department of Ophthalmology, University of Florida, Gainesville, FL, USA
*These authors contributed equally to this work
Objective: The aim of the study was to investigate changes of brain neural homogeneity in retinal detachment (RD) patients using the regional homogeneity (ReHo) method to understand their relationships with clinical features.
Materials and methods: A total of 30 patients with RD (16 men and 14 women), and 30 healthy controls (HCs) (16 men and 14 women) closely matched in age and sex were recruited. Resting-state functional magnetic resonance imaging scans were performed for all subjects. The ReHo method was used to investigate the brain regional neural homogeneity. Patients with RD were distinguished from HCs by receiver operating characteristic curve. The relationships between the mean ReHo signal values in many brain regions and clinical features in RD patients were calculated by Pearson correlation analysis.
Results: Compared with HCs, RD patients had significantly decreased ReHo values in the right occipital lobe, right superior temporal gyrus, bilateral cuneus and left middle frontal gyrus. Moreover, we found that the mean ReHo signal of the bilateral cuneus showed positive relationships with the duration of the RD (r=0.392, P=0.032).
Conclusion: The RD patients showed brain neural homogeneity dysfunction in the visual pathway, which may underline the pathological mechanism of RD patients with acute vision loss. Besides, the ReHo values can reflect the progress of the RD disease.
Keywords: retinal detachment, neural regional homogeneity, resting state, functional magnetic resonance imaging
Introduction
Retinal detachment (RD) is a severe eye disease in which the retina separates from the layer underneath. RD is often characterized by floaters, flashes and visual field defects.1 According to a survey in Scotland, the annual incidence of rhegmatogenous RD is 12.05 per 100,000 in Scotland.2 The occurrence of RD is associated with various risks including high myopia,3 ocular trauma4 and vitreous detachment.5 The RD is accompanied by a variety of complications such as proliferative vitreoretinopathy (PVR),6 vitreous hemorrhage7 and even blindness.8 At present, surgery is the main treatment of RD.9
Currently, ocular ultrasound and optical coherence tomography (OCT) are the noninvasive technologies used to detect RD. The ocular ultrasound was effective for diagnosis of RD.10 However, ultrasound can only roughly judge for RD, as it cannot indicate the scope and degree of RD. The OCT can not only make effective diagnoses of RD,11 but it can also provide useful information about the microstructure changes of the retinal layers in RD patients.12 Besides, the OCT can help in surgical planning of RD.13 Moreover, the spectral-domain OCT can reveal the integrity of the intermediate line and changes in the thickness of the outer nuclear layer, which is an important index for the recovery of visual outcomes after RD repair.14 The abovementioned researches only focus on the abnormal ocular changes in RD patients. Visual pathways include the retina through the optic nerve to the visual cortex. However, whether RD leads to abnormalities of other visual systems, including the visual pathways and the visual cortex, remains unknown.
Resting-state functional magnetic resonance imaging (rs-fMRI) is an effective method, which has been applied successfully to evaluate the changes of brain activity. The regional homogeneity (ReHo) method, an rs-fMRI measurement method, is thought to be a reliable and sensitive measurement, which can be used to evaluate coherence of the blood oxygen level-dependent signal among neighboring voxels of the whole brain at rest.15,16 The ReHo method is widely used to investigate the local synchronization of spontaneous fMRI signals. In our previous studies, the ReHo method has been successfully used to assess the neurological conditions in some eye diseases such as optic neuritis17 and comitant strabismus.18
Here, our study is the first to evaluate regional spontaneous neural activity changes in RD patients using the ReHo method. We hypothesized that RD might lead to abnormal visual cortex activity.
Materials and methods
Subjects
A total of 30 patients with RD (16 men and 14 women) were recruited from the Ophthalmology Department of the First Affiliated Hospital of Nanchang University. The inclusion criteria of the study in RD patients were 1) idiopathic RD patients with one or two retinal tear(s); 2) the range of RD being no more than two quadrants; and 3) bilateral eye without any ocular diseases (cataracts, glaucoma, optic neuritis, maculopathy, and so on).
The exclusion criteria of RD in the study were 1) recurrent RD or recurrent after RD repairment operation; 2) RD due to ocular trauma; 3) RD with serious related complications (PVR, vitreous hemorrhage, macular degeneration, and so on); 4) RD patients with a history of laser treatment or surgery; 5) with cardiovascular system diseases such as heart disease and hypertension and 6) with psychiatric disorders and cerebral infarction diseases.
Thirty healthy controls (HCs) (16 men and 14 women) who were age-, sex- and status-matched to subjects in the RD group were also enrolled for this study. All HCs met the following criteria: 1) no ocular disease with uncorrected visual acuity (VA) >1.0; 2) no psychiatric disorders (depression, bipolar disorder); and 3) ability to be scanned with an MRI (eg, no cardiac pacemaker or implanted metal devices).
The protocol of this research was approved by the First Affiliated Hospital of Nanchang University Medical Ethics Committee, and followed the tenets of the Declaration of Helsinki. All subjects provided written informed consent to participate.
MRI parameters
MRI scanning was performed on a 3-Tesla MR scanner (Trio, Siemens, Munich, Germany). The whole-brain T1-weighted images were obtained with spoiled gradient-recalled echo sequence with the parameters: (repetition time =1,900 ms, echo time =2.26 ms, thickness =1.0 mm, gap =0.5 mm, acquisition matrix =256×256, field of view =250×250 mm, flip angle =9°). Functional images with the parameters (repetition time =2,000 ms, echo time =30 ms, thickness =4.0 mm, gap =1.2 mm, acquisition matrix =64×64, flip angle =90°, field of view =220×220 mm, 29 axial) were corrected.
fMRI data processing
The functional images were analyzed as described previously.18 Briefly, the data were filtered by software and preprocessed using Statistical Parametric Mapping SPM8 (The MathWorks, Inc., Natick, MA, USA) and Data Processing Assistant for rs-fMRI DPARSFA (Institute of Psychology, CAS., Beijing, People’s Republic of China) software.19 The first 10 volumes of each subject were discarded because of the signal reaching equilibrium. After head motion was corrected, spatial smoothing was done. The fMRI images were detrended and band-pass-filtered (0.01–0.08 Hz) to reduce the effects of low-frequency drift and physiological high-frequency respiratory and cardiac noise.20 Based on Kendall’s coefficient of concordance (KCC), each voxel in the brain was calculated voxelwise by applying a cluster size of 26 voxels. We did not regress the global signal out according to a previous study.21 Finally, the remaining data were smoothed with a Gaussian kernel of 6×6×6 mm 3 full-width at half-maximum.
ReHo statistical analysis
ReHo computation was performed with REST software (Institute of Psychology, CAS.).16 ReHo analysis was performed to assess the consistency and similarity for each individual by calculating the KCC of the time series of one given voxel with those of its adjacent voxels in a voxelwise analysis based on the assumption that a voxel was temporally similar to those of its neighbors.
Statistical analysis
The cumulative clinical measurements, including the duration of the onset of RD, were analyzed in the study with an independent-sample t-test using SPSS version 16.0 (SPSS Inc, Chicago, IL, USA) (P<0.05 significant differences).
Statistical analysis was performed with a general linear model analysis using the SPM8 toolkit. The two-sample t-tests were used to examine the differences in the ReHo maps between the RD groups and the health controls (P<0.01) for multiple comparisons using Gaussian random field theory (z>2.3, P<0.01, cluster >40 voxels, AlphaSim corrected).
The mean ReHo values in the different brain regions between the two groups were analyzed by the receiver operating characteristic (ROC) curves method. Pearson correlation was used to evaluate the relationship between the mean ReHo values in different brain regions in the RD group and behavioral performances (P<0.05 significant differences).
Results
Demographics and visual measurements
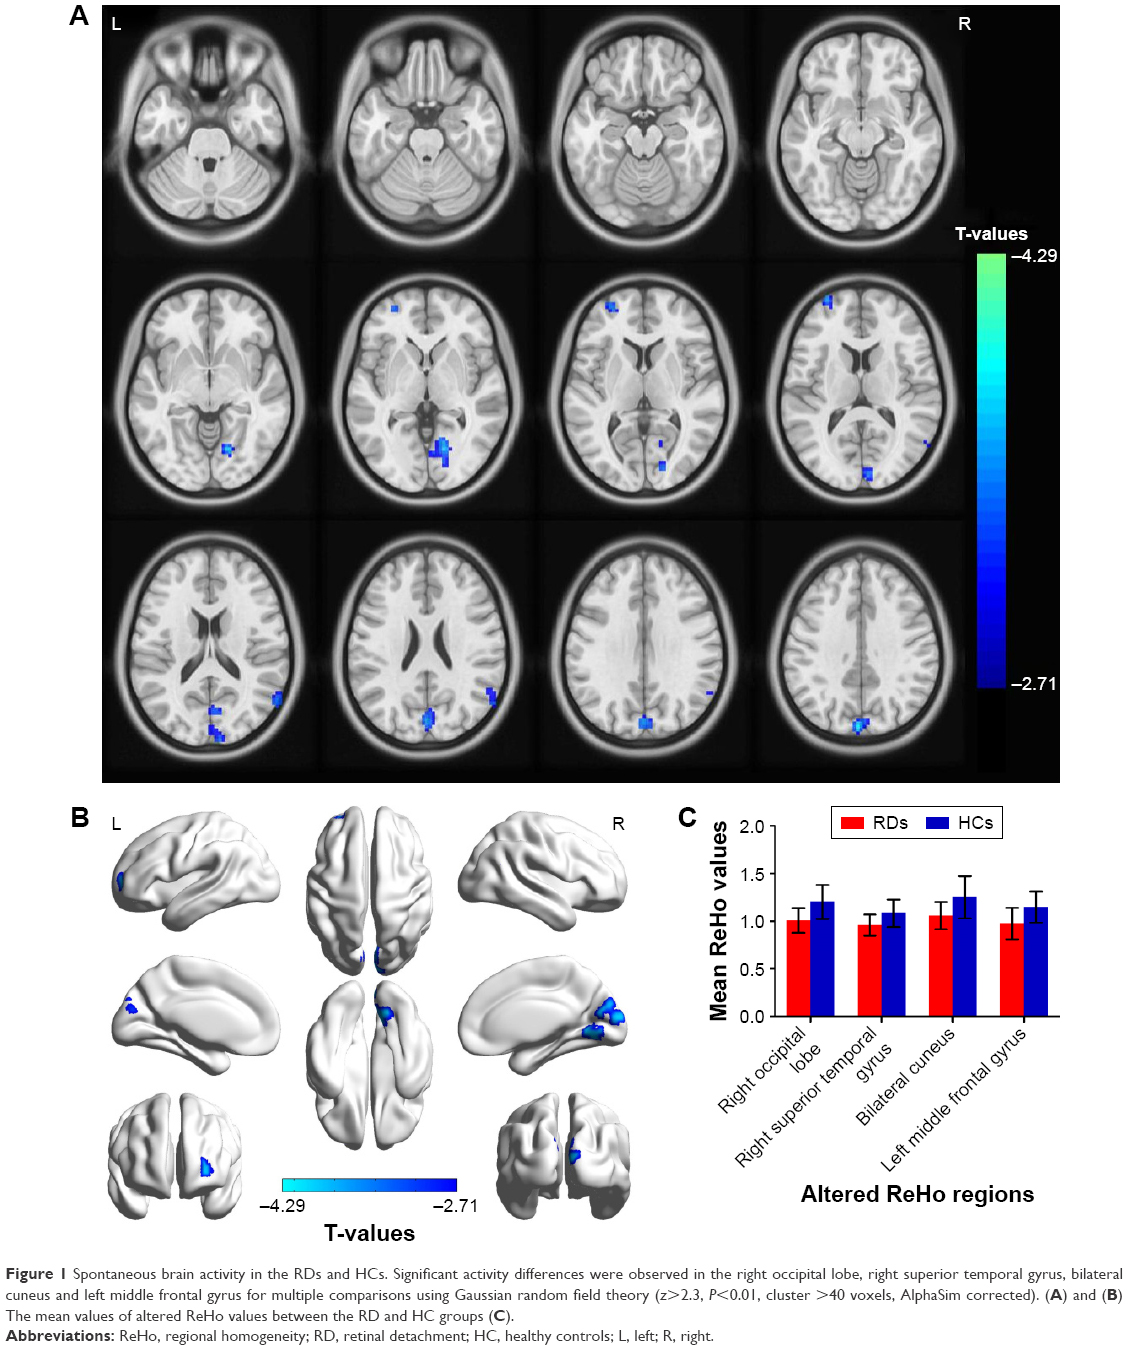
We did not find any significant differences in age (P=0.903) and weight (P=0.816), and there were significant differences in best-corrected VA-right (P<0.001) and best-corrected VA-left (P=0.001) between the two groups. Meanwhile, the mean values of the duration of RD were 24.05±19.61 days (Table 1).
 | Table 1 Demographics and clinical measurements by group |
ReHo differences
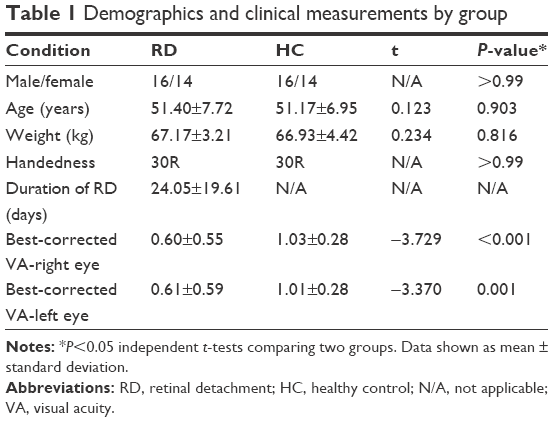
Compared with HCs, RD patients had significantly decreased ReHo values in the right occipital lobe, right superior temporal gyrus (STG), bilateral cuneus and left middle frontal gyrus (MFG) (Figure 1A and B [blue]; Table 2) (z>2.3, P<0.01, cluster >40 voxels, AlphaSim corrected). The mean values of altered ReHo between the two groups are shown in Figure 1C. In the RD group, the mean ReHo signal of the bilateral cuneus showed the positive relationships with the duration of the RD (r=0.392, P=0.032) (Figure 2).
 | Figure 1 Spontaneous brain activity in the RDs and HCs. Significant activity differences were observed in the right occipital lobe, right superior temporal gyrus, bilateral cuneus and left middle frontal gyrus for multiple comparisons using Gaussian random field theory (z>2.3, P<0.01, cluster >40 voxels, AlphaSim corrected). (A) and (B) The mean values of altered ReHo values between the RD and HC groups (C). |
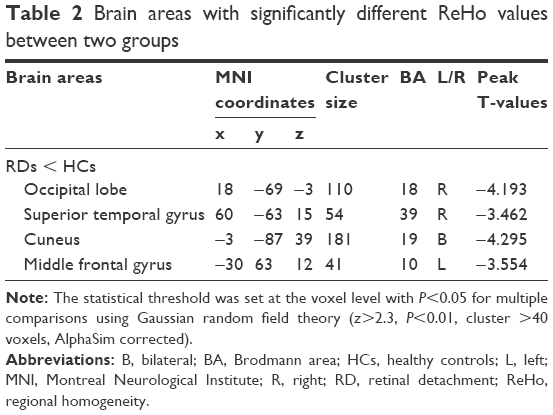 | Table 2 Brain areas with significantly different ReHo values between two groups |
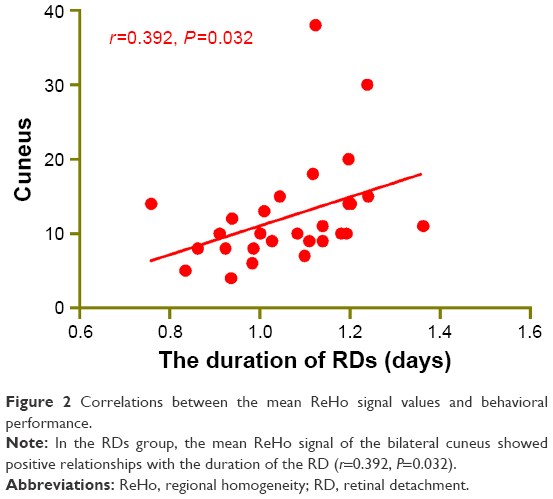 | Figure 2 Correlations between the mean ReHo signal values and behavioral performance. |
Receiver operating characteristic curve
We speculated that the ReHo differences between the two groups might be useful diagnostic markers. Thus, the mean ReHo values in the different brain regions were analyzed by the ROC curves method. The areas under the ROC curve were as follows: the right occipital lobe (0.807); right STG (0.764); bilateral cuneus (0.744) and left MFG (0.750) (RDs < HCs) (Figure 3).
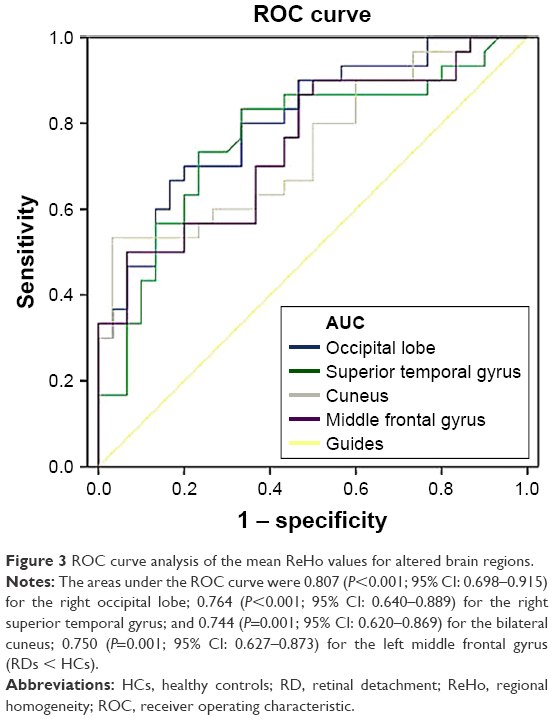 | Figure 3 ROC curve analysis of the mean ReHo values for altered brain regions. |
Discussion
To our knowledge, the study is the first to investigate the regional spontaneous neural activity changes in RD patients using the ReHo method. In our study, RD patients had significantly decreased ReHo values in the right occipital lobe, right STG, bilateral cuneus and left MFG. Moreover, we found that the mean ReHo signal of the bilateral cuneus showed positive relationships with the duration of the RD (r=0.392, P=0.032).
The occipital lobe is the anatomical region of the visual cortex, which plays a critical role in visual processing. The primary visual cortex is an important part of the occipital lobe, which receives the visual signals from the lateral geniculate body through visual radiation.22 The normal function of the retinal ganglion cells plays a critical role in visual stimulation. The pathological mechanism of RD is when the retinal neuroepithelium separates from the pigment epithelium.23 The RD may lead to impaired visual evoked potentials.24 Besides, the RD patients were associated with visual loss.25 In our study, we found that the RD patients had significantly decreased ReHo values in the right occipital lobe, which reflected the dysfunction of the local synchronization of brain activities in the brain region. Therefore, we speculated that RD not only leads to abnormal function of the retina, but also affects the function of the visual cortex.
The cuneus is a part of the occipital lobe, which plays an important role in visual processing. The anteromedial cuneus is needed to interact with the primary visual cortex V1 to encode visual information to the extrastriate cortices.26 Meanwhile, the cuneus is part of the visual pathway, which is involved in spatial location.27 Moreover, the dysfunction of the cuneus is seen in many diseases, such as trigeminal neuralgia28 and panic disorder.29 In our study, we found that the RD patients showed significantly decreased ReHo values in the bilateral cuneus, which indicated the dysfunction of the local synchronization of brain activities. Moreover, the ReHo signal of the bilateral cuneus showed positive relationships with the duration of the RD (r=0.392, P=0.032). Thus, we speculated that the RD patients were associated with impaired brain activities in the cuneus. Besides, the degree of impaired cuneus may reflect the progress of the RD disease.
The STG is located in the temporal lobe, which plays an important role in auditory processing30 and auditory memory.31 The STG is also involved in visual search insights32 and visual information processing.33 In our study, we found that the RD patients showed decreased ReHo values in the right STG, which reflects the impaired synchronization of brain activities in the STG. We speculated that RD might lead to the dysfunction of auditory and visual information processing.
The MFG is a part of frontal gyrus, which is involved in the contingency awareness34 and cognition.35 Besides, the MFG is associated with executive attention.36 In our study, we found that the RD patients had significantly decreased ReHo values in the left MFG, which might indicate that RD leads to the dysfunction of cognitive activities.
Conclusion
In summary, our results showed that the RD patients had brain neural homogeneity dysfunction in the visual pathway, which may underline pathological mechanisms of the RD patients with acute vision loss. Besides, the ReHo values can reflect the progress of the RD disease.
Acknowledgments
This work was supported by grants from the National Natural Science Foundation of China (No: 81660158, 81160118, 81460092, 81400372); Jiangxi Province Voyage Project (No: 2014022); Natural Science Key Project of Jiangxi Province (No: 20161ACB21,017); Youth Science Foundation of Jiangxi Province (No: 20151BAB215016); Technology and Science Foundation of Jiangxi Province (No: 20151BBG70223); Health Development Planning Commission Science Foundation of Jiangxi Province (No: 20175115, 20175116).
Disclosure
The authors report no conflicts of interest in this work.
References
Lumi X, Hawlina M, Glavač D, et al. Aging of the vitreous: from acute onset floaters and flashes to retinal detachment. Aging Res Rev. 2015;21:71–77. | ||
Mitry D, Charteris DG, Yorston D, et al. The epidemiology and socioeconomic associations of retinal detachment in Scotland: a two-year prospective population-based study. Invest Ophthalmol Vis Sci. 2010;51(10):4963–4968. | ||
Baba T, Ohno-Matsui K, Futagami S, et al. Prevalence and characteristics of foveal retinal detachment without macular hole in high myopia. Am J Ophthalmol. 2003;135(3):338–342. | ||
Lee TH, Chen YH, Kuo HK, et al. Retinal detachment associated with basketball-related eye trauma. Am J Ophthalmol. 2017;180:97–101. | ||
Williams KM, Watt L, Williamson TH. Acute symptomatic posterior vitreous detachment and delayed retinal breaks. Acta Ophthalmol. 2011;89(1):e100–e101. | ||
Joeres S, Kirchhof B, Joussen AM. PVR as a complication of rhegmatogeneous retinal detachment: a solved problem? Br J Ophthalmol. 2006;90(6):796–797. | ||
Sarrafizadeh R, Hassan TS, Ruby AJ, et al. Incidence of retinal detachment and visual outcome in eyes presenting with posterior vitreous separation and dense fundus-obscuring vitreous hemorrhage. Ophthalmology. 2001;108(12):2273–2278. | ||
Chen KH, Chen LR. Bilateral retinal detachment with subsequent blindness in a pregnant woman with severe pre-eclampsia. Taiwan J Obstet Gynecol. 2013;52(1):142–144. | ||
Manners S, Ng JQ, Kemp-Casey A, Chow K, Kang CY, Preen DB. Retinal detachment surgery in Western Australia (2000–2013): a whole-population study. Br J Ophthalmol. Epub 2017 Apr 8. | ||
Yoonessi R, Hussain A, Jang TB. Bedside ocular ultrasound for the detection of retinal detachment in the emergency department. Acad Emerg Med. 2010;17(9):913–917. | ||
Akiba J, Konno S, Sato E, Yoshida A. Retinal detachment and retinoschisis detected by optical coherence tomography in a myopic eye with a macular hole. Ophthalmic Surg Lasers. 2000;31(3):240–242. | ||
Kim JH, Park DY, Ha HS, Kang SW. Topographic changes of retinal layers after resolution of acute retinal detachment. Invest Ophthalmol Vis Sci. 2012;53(11):7316–7321. | ||
Auger G, Winder S. Spectral domain OCT: an aid to diagnosis and surgical planning of retinal detachments. J Ophthalmol. 2011;2011:725362. | ||
Gharbiya M, Grandinetti F, Scavella V, et al. Correlation between spectral-domain optical coherence tomography findings and visual outcome after primary rhegmatogenous retinal detachment repair. Retina. 2012;32(1):43–53. | ||
Zang Y, Jiang T, Lu Y, He Y, Tian L. Regional homogeneity approach to fMRI data analysis. Neuroimage. 2004;22(1):394–400. | ||
Tononi G, McIntosh AR, Russell DP, Edelman GM. Functional clustering: identifying strongly interactive brain regions in neuroimaging data. Neuroimage. 1998;7(2):133–149. | ||
Shao Y, Cai FQ, Zhong YL, et al. Altered intrinsic regional spontaneous brain activity in patients with optic neuritis: a resting-state functional magnetic resonance imaging study. Neuropsychiatr Dis Treat. 2015;11:3065–3073. | ||
Huang X, Li SH, Zhou FQ, et al. Altered intrinsic regional brain spontaneous activity in patients with comitant strabismus: a resting-state functional MRI study. Neuropsychiatr Dis Treat. 2016;12:1303–1308. | ||
Chao-Gan Y, Yu-Feng Z. DPARSF: A MATLAB toolbox for “pipeline” data analysis of resting-state fMRI. Front Syst Neurosci. 2010;4:13. | ||
Lowe MJ, Mock BJ, Sorenson JA. Functional connectivity in single and multislice echoplanar imaging using resting-state fluctuations. Neuroimage. 1998;7(2):119–132. | ||
Murphy K, Birn RM, Handwerker DA, Jones TB, Bandettini PA. The impact of global signal regression on resting state correlations: are anti-correlated networks introduced? Neuroimage. 2009;44(3):893–905. | ||
Chen W, Zhu XH. Correlation of activation sizes between lateral geniculate nucleus and primary visual cortex in humans. Magn Reson Med. 2001;45(2):202–205. | ||
Schubert HD. Structural organization of choroidal colobomas of young and adult patients and mechanism of retinal detachment. Trans Am Ophthalmol Soc. 2005;103:457–472. | ||
Ozgür S, Esgin H. Macular function of successfully repaired macula-off retinal detachments. Retina. 2007;27(3):358–364. | ||
Di Lauro S, Castrejón M, Fernández I, et al. Loss of visual acuity after successful surgery for macula-on rhegmatogenous retinal detachment in a prospective multicentre study. J Ophthalmol. 2015;2015:821864. | ||
Vanni S, Tanskanen T, Seppä M, Uutela K, Hari R. Coinciding early activation of the human primary visual cortex and anteromedial cuneus. Proc Natl Acad Sci U S A. 2001;98(5):2776–2780. | ||
Rao H, Zhou T, Zhuo Y, Fan S, Chen L. Spatiotemporal activation of the two visual pathways in form discrimination and spatial location: a brain mapping study. Hum Brain Mapp. 2003;18(2):79–89. | ||
Parise M, Kubo TT, Doring TM, Tukamoto G, Vincent M, Gasparetto EL. Cuneus and fusiform cortices thickness is reduced in trigeminal neuralgia. J Headache Pain. 2014;15:17. | ||
Lai CH, Wu YT. Decreased regional homogeneity in lingual gyrus, increased regional homogeneity in cuneus and correlations with panic symptom severity of first-episode, medication-naïve and late-onset panic disorder patients. Psychiatry Res. 2013;211(2):127–131. | ||
Howard MA, Volkov IO, Mirsky R, et al. Auditory cortex on the human posterior superior temporal gyrus. J Comp Neurol. 2000;416(1):79–92. | ||
Muñoz-López M, Insausti R, Mohedano-Moriano A, Mishkin M, Saunders RC. Anatomical pathways for auditory memory II: information from rostral superior temporal gyrus to dorsolateral temporal pole and medial temporal cortex. Front Neurosci. 2015;9:158. | ||
Gharabaghi A, Fruhmann Berger M, Tatagiba M, Karnath HO. The role of the right superior temporal gyrus in visual search-insights from intraoperative electrical stimulation. Neuropsychologia. 2006;44(12):2578–2581. | ||
Beauchamp MS, Lee KE, Argall BD, Martin A. Integration of auditory and visual information about objects in superior temporal sulcus. Neuron. 2004;41(5):809–823. | ||
Carter RM, O’Doherty JP, Seymour B, Koch C, Dolan RJ. Contingency awareness in human aversive conditioning involves the middle frontal gyrus. Neuroimage. 2006;29(3):1007–1012. | ||
Achiron A, Chapman J, Tal S, Bercovich E, Gil H, Achiron A. Superior temporal gyrus thickness correlates with cognitive performance in multiple sclerosis. Brain Struct Funct. 2013;218(4):943–950. | ||
Andersson M, Ystad M, Lundervold A, Lundervold AJ. Correlations between measures of executive attention and cortical thickness of left posterior middle frontal gyrus – a dichotic listening study. Behav Brain Funct. 2009;5:41. |
 © 2017 The Author(s). This work is published and licensed by Dove Medical Press Limited. The
full terms of this license are available at https://www.dovepress.com/terms
and incorporate the Creative Commons Attribution
- Non Commercial (unported, 3.0) License.
By accessing the work you hereby accept the Terms. Non-commercial uses of the work are permitted
without any further permission from Dove Medical Press Limited, provided the work is properly
attributed. For permission for commercial use of this work, please see paragraphs 4.2 and 5 of our Terms.
© 2017 The Author(s). This work is published and licensed by Dove Medical Press Limited. The
full terms of this license are available at https://www.dovepress.com/terms
and incorporate the Creative Commons Attribution
- Non Commercial (unported, 3.0) License.
By accessing the work you hereby accept the Terms. Non-commercial uses of the work are permitted
without any further permission from Dove Medical Press Limited, provided the work is properly
attributed. For permission for commercial use of this work, please see paragraphs 4.2 and 5 of our Terms.