Back to Journals » Diabetes, Metabolic Syndrome and Obesity » Volume 13
Abnormal Glucose Metabolism and Associated Risk Factors Among Adults in Mekelle City, Ethiopia
Authors Gebreegziabiher G ![]() , Belachew T, Tamiru D
, Belachew T, Tamiru D ![]()
Received 3 September 2020
Accepted for publication 14 October 2020
Published 27 October 2020 Volume 2020:13 Pages 4017—4032
DOI https://doi.org/10.2147/DMSO.S280215
Checked for plagiarism Yes
Review by Single anonymous peer review
Peer reviewer comments 3
Editor who approved publication: Professor Ming-Hui Zou
Gebremedhin Gebreegziabiher,1 Tefera Belachew,2 Dessalegn Tamiru2
1Department of Human Nutrition, School of Public Health, College of Medicine and Health Sciences, Adigrat University, Adigrat, Ethiopia; 2Department of Nutrition and Dietetics, Faculty of Public Health, Jimma University, Jimma, Ethiopia
Correspondence: Gebremedhin Gebreegziabiher Tel +251914754562
Email [email protected]
Background: In the past decade, the prevalence of diabetes has grown more rapidly in low- and middle-income countries than in high-income countries. In 2019, Ethiopia is the fourth highest contributor to cases with diabetes in Africa with 1.7 million total cases. The present study was aimed to determine the prevalence of abnormal glucose metabolism and associated factors in Mekelle city, Northern Ethiopia.
Methods and Materials: Community-based cross-sectional study was conducted among 321 randomly selected participants aged 20 years and above. Sociodemographic, lifestyle, clinical, and anthropometric data were collected in accordance with the STEPwise approach as recommended by the World Health Organization (WHO) for non-communicable disease (NCDs) surveillance. Blood glucose and lipid profiles were determined using a fasting venous blood sample. Bivariate and multivariable logistic regression analysis was used to identify factors associated with abnormal glucose metabolism. The level of statistical significance was set at p ≤ 0.05.
Results: More than half (54.8%) of the participants were women with an overall mean (±SD) age of 39.0 (± 14.2) years. The overall prevalence of pre-diabetes and diabetes was 12.5% and 9.3%, respectively, with a mean (±SD) fasting blood glucose of 97.42 (± 38.03) mg/dL. More than two-thirds (70.0%) of adults with diabetes were not aware of being diabetes. Advanced age, hypercholesterolemia, medium and high rank of heart rate, and raised waist to height ratio were significantly associated with a higher risk of pre-diabetes, whereas having house servant, systolic hypertension, and hypercholesterolemia were significantly associated with diabetes.
Conclusion: We found a high prevalence of prediabetes and diabetes with more than two-thirds (70.0%) of newly diagnosed adults with diabetes, which showed a lack of awareness in the community. Awareness creation together with access to basic diagnostics in the primary health-care settings should therefore be a top priority to prevent its progression and complication.
Keywords: abnormal glucose metabolism, diabetes, associated factor, adult, Ethiopia
Background
Diabetes Mellitus (DM) is a chronic disease resulting from inadequate secretion of insulin, insulin insensitivity, or both.1,2 DM is a global public health problem due to its high prevalence and a strong link with different health complications.3 DM leads to long-lasting complications such as kidney failure, nerve damage, loss of vision, leg amputation, and Cardiovascular Disease (CVD) in chronic uncontrolled conditions.4–7 Around 75–80% of people with diabetes die due to CVD complications.8 The number of people living with DM worldwide was 463 million in 2019 and projected to rise to 578 million by 2030. In the same year, around 4.2 million people aged 20–79 years were estimated to die, contributing 11.3% of all global deaths. Globally, over 50% of people with diabetes are undiagnosed.9 In the past decade, the prevalence of diabetes has grown more rapidly in low and middle-income countries than in high-income countries.10 Most cases of diabetes live in low and middle-income countries and these countries will experience the greatest increase over the next years.11,12
More than 45 million and 19 million people in Africa have prediabetes and diabetes with an age-adjusted comparative prevalence of 10.1% and 4.7%, respectively. By 2045, diabetes is forecasted to increase by 143% (47 million) in Africa, almost three times the world forecast (51%). Africa has the highest proportion of undiagnosed diabetes with 3 out of 5 people who do not know their status. In 2019, diabetes killed 366,200 people in Africa.9 According to systematic review finding in Africa, the prevalence of diabetes ranged from 2.6% in rural Sudan to 20.0% in urban Egypt.13 Increasing aging population, rapid urbanization, overweight and obesity, sedentary lifestyle, and excessive intake of alcohol and unhealthy diets were identified as significant predictors to the escalation of DM worldwide.9,14 The prevalence of DM in Africa is forecasted to triple in the coming 25 years involving young populations too, because of increasing sedentary lifestyle, fast-growing urbanization, and a shift from local traditional to processed foods.9,15
Ethiopia is the fourth highest contributor of cases with DM in Africa in 2019, with 1.7 million total cases; 4.3% age-adjusted comparative prevalence; and 23,157 total deaths among 20–79 years old population.9 STEPS survey conducted in Ethiopia among 15–69 years old population found a prevalence of 9.1% and 3.2% for pre-diabetes and diabetes, respectively.16 Study conducted in the Koladiba district among adults also found a prevalence of 12.0% and 2.3% for pre-diabetes and diabetes, respectively.17 Another study conducted in the capital city Addis Ababa among federal police members aged 18–55 years found 13.0% hyperglycemia, with higher pre-diabetes (8.0%) compared to diabetes (5.0%).18 However, most previous studies conducted in Ethiopia use a simple glucometer to measure glucose using a capillary blood sample from finger pricking, all of which may compromise the quality of the test.17–23 Besides, some are institutional-based studies18,19 and others are conducted in small towns,21–23 which greatly affect their representativeness. According to different studies conducted in Ethiopia, hypertension,17–21,24 increased Body Mass Index (BMI),17–21 central obesity,20,21,24 advanced age,24 male sex and raised triglyceride18 were identified as significant risk factors for abnormal glucose metabolism.
In the past 1 to 2 decades, Ethiopia has experienced significant lifestyle changes with rapid population growth and urbanization, which are considered as the main risk factors of abnormal glucose metabolism. Besides, the country has a weak health system to make early diagnosis and management of diabetes. After the clinical manifestation of complications, it will be too difficult to reverse and overcome abnormal glucose metabolism. Early detection, intervention, and avoidance of risk factors have paramount benefit, which is only possible when there is evidence showing the level of the problem and its associated risk factors. However, a limited number of pocket studies were conducted in Ethiopia, most of which were institutional-based; conducted in small towns; used poor quality testing device (glucometer), and random capillary blood from finger pricking. Besides, no community-based study was conducted in the study area in particular and Northern Ethiopia in general. Therefore, the aim of the present study was to generate evidence on the prevalence of abnormal glucose metabolism and its associated risk factors among adult residents of Mekelle city, Northern Ethiopia.
Methods and Materials
Study Design, Setting, and Population
Community-based cross-sectional study was conducted among 321 adult study participants in Mekelle city, Northern Ethiopia from July to September 2019. Mekelle, the second-largest city in Ethiopia, is the capital city of Tigray regional state; which is located at 783 km to the north of the capital city, Addis Ababa. In 2019, Mekelle city has a total population of 505,000, of whom 48.1% (242,905) are adults aged 20 years and above. All adults aged 20 years and above living in Mekelle city at least for 6 months were considered as the study population. Pregnant women and the first 6 months of lactating mothers were excluded from the study.
Sample Size Determination and Sampling Procedure
A single population proportion formula was used to determine the sample size by considering the proportion of abnormal glucose metabolism at Koladiba town 14.3%,17 95% level of confidence, 4% margin of error, and 80% power. The calculation resulted in 295 and after adding 10% (n = 30) of the calculated sample size for non-response rate, the total sample size was 325. The total sample size was proportionally allocated to the seven sub-cities and we have selected households using a simple random sampling technique (computer-based random number generator) using the health extension workers’ family folder as a sampling frame in each sub-city. Besides, within the household, a single adult individual was selected by lottery method from among all the eligible individuals (Figure 1).
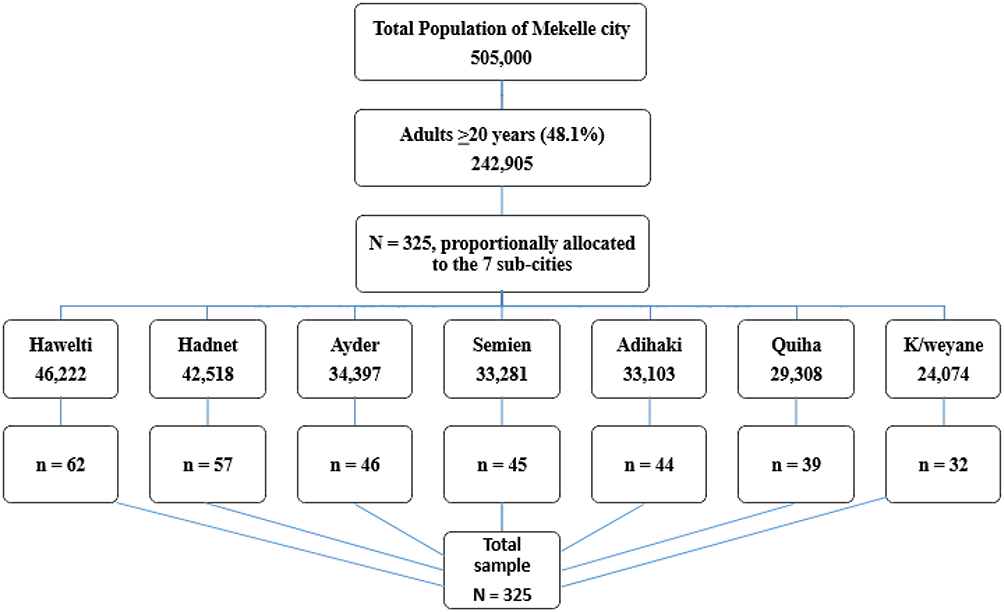 |
Figure 1 Flow chart of the sampling procedure using proportional allocation (n = 321). |
Data Collection Tools and Procedures
Six health professionals (four data collectors, one laboratory analyzer, and one supervisor) were deployed to collect the data. Of the four data collectors, three were first-degree holder public health professionals and the fourth one was a first-degree holder medical laboratory technologist. The laboratory technologist was responsible for blood sample collection, handling, and transport to the laboratory in the regional health research institute. A second-degree holder medical laboratory technologist with a specialization in clinical chemistry was also assigned to conduct the laboratory tests. The data collectors were trained for two days covering how to conduct face-to-face interviews, anthropometric measurements, how to measure blood pressure, and how to collect blood samples (including sample collection, handling, storage, and transport to the laboratory). The average time required to collect data from one participant was 30 minutes and the total duration of the data collection time was two months.
Trained public health professionals conducted a face-to-face interview using a structured questionnaire adapted from the WHO STEPwise approach to NCDs surveillance tool.25 Portable stadiometer (UNICEF SECA) was used to measure height to the nearest 0.1 cm. During height measurement, the subjects positioned at the Frankfurt plane without shoes, and the four points (heel, calf, buttock, and shoulder) touching the vertical stand was checked. Waist Circumference (WC) was measured to the nearest 0.1 cm at the midway between the lowest costal margin of the midclavicular line and the anterior superior iliac spine using fixed tension tape. Hip circumference was also taken to the nearest 0.1 cm at the level of the greater trochanter of the femur with the subjects wearing a pant.
Weight was measured using a digital scale (UNICEF SECA) with light closes and without shoes. The validity of the weighing scale was checked before starting each measurement using a known weight. All anthropometric measurements were done in triplicate and the average values were used for further analyses. All measurement data were obtained using standardized techniques and calibrated equipment.26 Blood pressure was measured using digital blood pressure measuring apparatus in triplicate after five minutes of rest and the subsequent measurements were done five minutes apart. The mean Systolic Blood Pressure (SBP) and Diastolic Blood Pressure (DBP) were considered for analyses. Full data were collected from 321 participants.
Blood Sample Collection and Laboratory Analysis
Study participants were appointed the next day after data collection to their nearest health facility to give fasting venous blood (after at least 10 hours of fasting) in the early morning (8:00 am – 9:00 am). Approximately 5 mL of venous blood was collected from each participant for Fasting Blood Glucose (FBG), High-Density Lipoprotein Cholesterol (HDL-C), triglyceride, Low-Density Lipoprotein Cholesterol (LDL-C), and total cholesterol tests. An appropriate test tube was used to minimize the consumption of glucose by cells in the blood and serum was separated within 30 minutes of blood collection. After retracting the clot, the sample was centrifuged at 4000 revolutions per minute for 5 minutes and 2.5 mL pure serum sample was transferred to Nunc tube. The sample was analyzed using Bio-system A25 automated clinical chemistry machine (Spain). Before sample analysis, the machine was checked using controls and blank on a daily basis. We proceed to the sample analysis once the test was passed for blank and controls (normal and pathological).
Data Quality Control
To ensure the quality of data, the data collectors were selected by their experience in data collection and local language skills. Two days of training were given for all data collectors and the supervisor. The questionnaire was translated to the local language (Tigrigna) by native speakers and back-translated to English to check the consistency. The data collection tools were pretested in 5% (n = 16) of the sample size in a different site to check the completeness, consistency, sensitivity, and applicability and were ratified accordingly. The supervisor has closely supervised the data collection process; crosschecked all the filled questionnaires on daily basis for completeness, clarity, and consistency. Every evening, a discussion has been arranged with the data collection team to identify and address any difficulties encountered during fieldwork. The weighing scale was calibrated using known weight before starting in the early morning and between each measurement. Besides, experienced laboratory technologist conducted the laboratory tests in the regional health research institute following standard operating procedure.
Definition of Terms
Abnormal glucose metabolism is defined as FBG ≥5.56 mmol/L (≥100 mg/dL) or on diabetes medication. Diabetes mellitus is defined as FBG ≥7.00 mmol/L (≥126 mg/dL) or on diabetes medication. Impaired fasting glucose (IFG) or prediabetes is defined as FBG 5.56-<7.00 mmol/L (100–125 mg/dL). Normal glucose metabolism is defined as FBG <5.56 mmol/L (<100 mg/dL). Raised WC or central obesity is defined as WC ≥94 cm for men and ≥80 cm for women.27
Metabolic syndrome is defined as a compulsory raised WC of ≥94 cm for men and ≥80 cm for women plus two of the remaining four metabolic syndrome components, elevated triglyceride ≥150 mg/dL; low HDL-C <1.03 mmol/L (<40 mg/dL) for men and <1.3 mmol/L (<50 mg/dL) for women; raised blood pressure ≥130/85 mmHg or on hypertension treatment; and raised FBG ≥5.56 mmol/L (≥100 mg/dL) or on diabetes treatment.27
Dyslipidemia is defined as lipid profile that consists of the following abnormalities, either singly or in combination. Total cholesterol ≥5.17 mmol/L (≥200 mg/dL); LDL-C ≥3.36 mmol/L (≥130 mg/dL); HDL-C <1.03 mmol/L (<40 mg/dL) for men, <1.3 mmol/L (<50 mg/dL) for women; and triglyceride ≥1.7 mmol/L (≥150 mg/dL).28
Based on blood pressure, an individual is classified as normotensive (<130/85 mmHg); pre-hypertensive (≥130–139/85–89 mmHg); and hypertensive (≥140/90 mmHg or on anti-hypertensive medication) for SBP and DBP, respectively.
BMI was calculated by dividing weight in kilogram (kg) by the squared meter (m2) of height. Participants with BMI <18.5 kg/m2 are classified as underweight; 18.5–24.9 kg/m2 as normal; 25.0–29.9 kg/m2 as overweight; and ≥30.0 kg/m2 as obese.29
Waist to height ratio was calculated by dividing WC in cm by the height in cm, and raised waist to height ratio was considered when ≥0.49 in men and >0.50 in women. Waist to hip ratio was calculated by dividing WC in cm by the hip circumference in cm and raised waist to hip ratio was considered when ≥0.88 in men and >0.82 in women.30
Household wealth (19 variables indicating ownership of different household assets including house ownership, ownership of a car, bicycle, refrigerator, cheap utensils, expensive utensils, mobile, laundry machine, television, having house servant, access to electricity, access to clean water, separate sleeping room, floor quality, toilet quality, dining table, sofa, cupboard for clothes, and cupboard for utensils) was recorded and used to generate wealth tertiles (poor, medium, and rich) using Principal Component Analysis.31
Study participants were considered as smokers if they smoked any tobacco product at least occasionally, and as alcohol consumers, if they drunk at least twice a week of any alcoholic stuff. Physical activity was measured using the WHO global physical activity questionnaire.25 The questionnaire assessed work-related activity, walking, sport and recreational activity, and time spent sitting per day. Work-related activities were categorized as work involving vigorous, moderate, and low-intensity activities with large, small, and no increases in breathing or heart rate for at least 10 minutes, respectively. Participants were categorized as physically active if they do at least 150 minutes and 75 minutes of moderate-intensity work or vigorous-intensity work per week, respectively. Otherwise, participants were categorized as physically inactive.
Data Analysis
Data were checked for completeness and consistency in the hard copy. Four participants’ data were found to be incomplete and thus excluded from the analysis. Data were double entered into EPI data software version 3.1 to check clerical errors, and were exported to Statistical Package for the Social Sciences (SPSS) version 24 for analyses. Descriptive analysis of the background characteristics of participants was performed and normality was checked for continuous variables. Data were summarized as mean ± standard deviation (SD) for continuous variables, and frequencies and percentages for categorical variables. Student’s t-test and Pearson’s Chi-square test were used to assessing the associations between each factor and categorical outcome variables.
Multivariable logistic regression analyses were done to control potential confounding variables and to determine factors associated with prediabetes and diabetes. Backward stepwise elimination was used to remove non-significant variables until only statistically significant variables remained in the final logistic model at p ≤0.05. Unadjusted and adjusted odds ratios and their corresponding 95% Confidence Intervals (CI) were computed using bivariate and multivariable logistic regression analysis. The goodness of fit for the model was checked with the Hosmer-Lemeshow test. The significant association was declared at p ≤0.05 for the final logistic model.
Ethical Issues
The institutional review board of Jimma University has approved the study with a reference number of IHRPGD/349/2019. We have obtained a support letter to conduct the study from all concerned health authorities (Tigray regional health bureau, Mekelle city zonal health office, and the seven sub-cities’ district health offices). All participants were informed of what is expected from them and their rights using the information sheet. We have obtained written informed consent from each participant. We have linked participants with abnormal lipid profile, abnormal glucose metabolism, and hypertension to their nearest health facility for further investigation, counseling, and treatment. This study was conducted in accordance with the Declaration of Helsinki.
Results
Sociodemographic and Lifestyle Characteristics of the Participants
Almost all the randomly selected adults (n = 321) participated in the study with a response rate of 98.8%. The mean (±SD) age of the study participants was 39.0 (±14.2) years, ranged 20–92 years. More than half (54.8%) of the participants were women. More than three-quarters (73.2%) of the respondents were grade 8 and above, and a significantly higher proportion of men were literate (p = 0.002). More than two-thirds (69.8%) of the participants were married with a statistically significant difference across gender (p = 0.001). Over half (62.3%) of the participants were employed and one quarter (24.9%) were housewives. A significantly higher proportion of men were from households with poor wealth index (p =0.029). One in twenty participants (5.0%) smoked tobacco and the same number of study participants (5.0%) live with smokers with all smokers being men (p <0.001). More than three quarters (77.3%) of the participants drunk alcohol with a statistically significant difference across gender (p =0.003).
Only 13.4% of individuals were engaged in formal physical activity. Besides, a significantly higher proportion of men walked more than 150 minutes weekly and engaged in formal physical activity (p<0.001). Eight out of ten (80.0%) and 10.0% of participants were engaged in moderate and vigorous-intensity daily work, respectively with a statistically significant difference across gender (p = 0.044). The median fruit and vegetable intake of the participants was one and two times a week, respectively (Table 1).
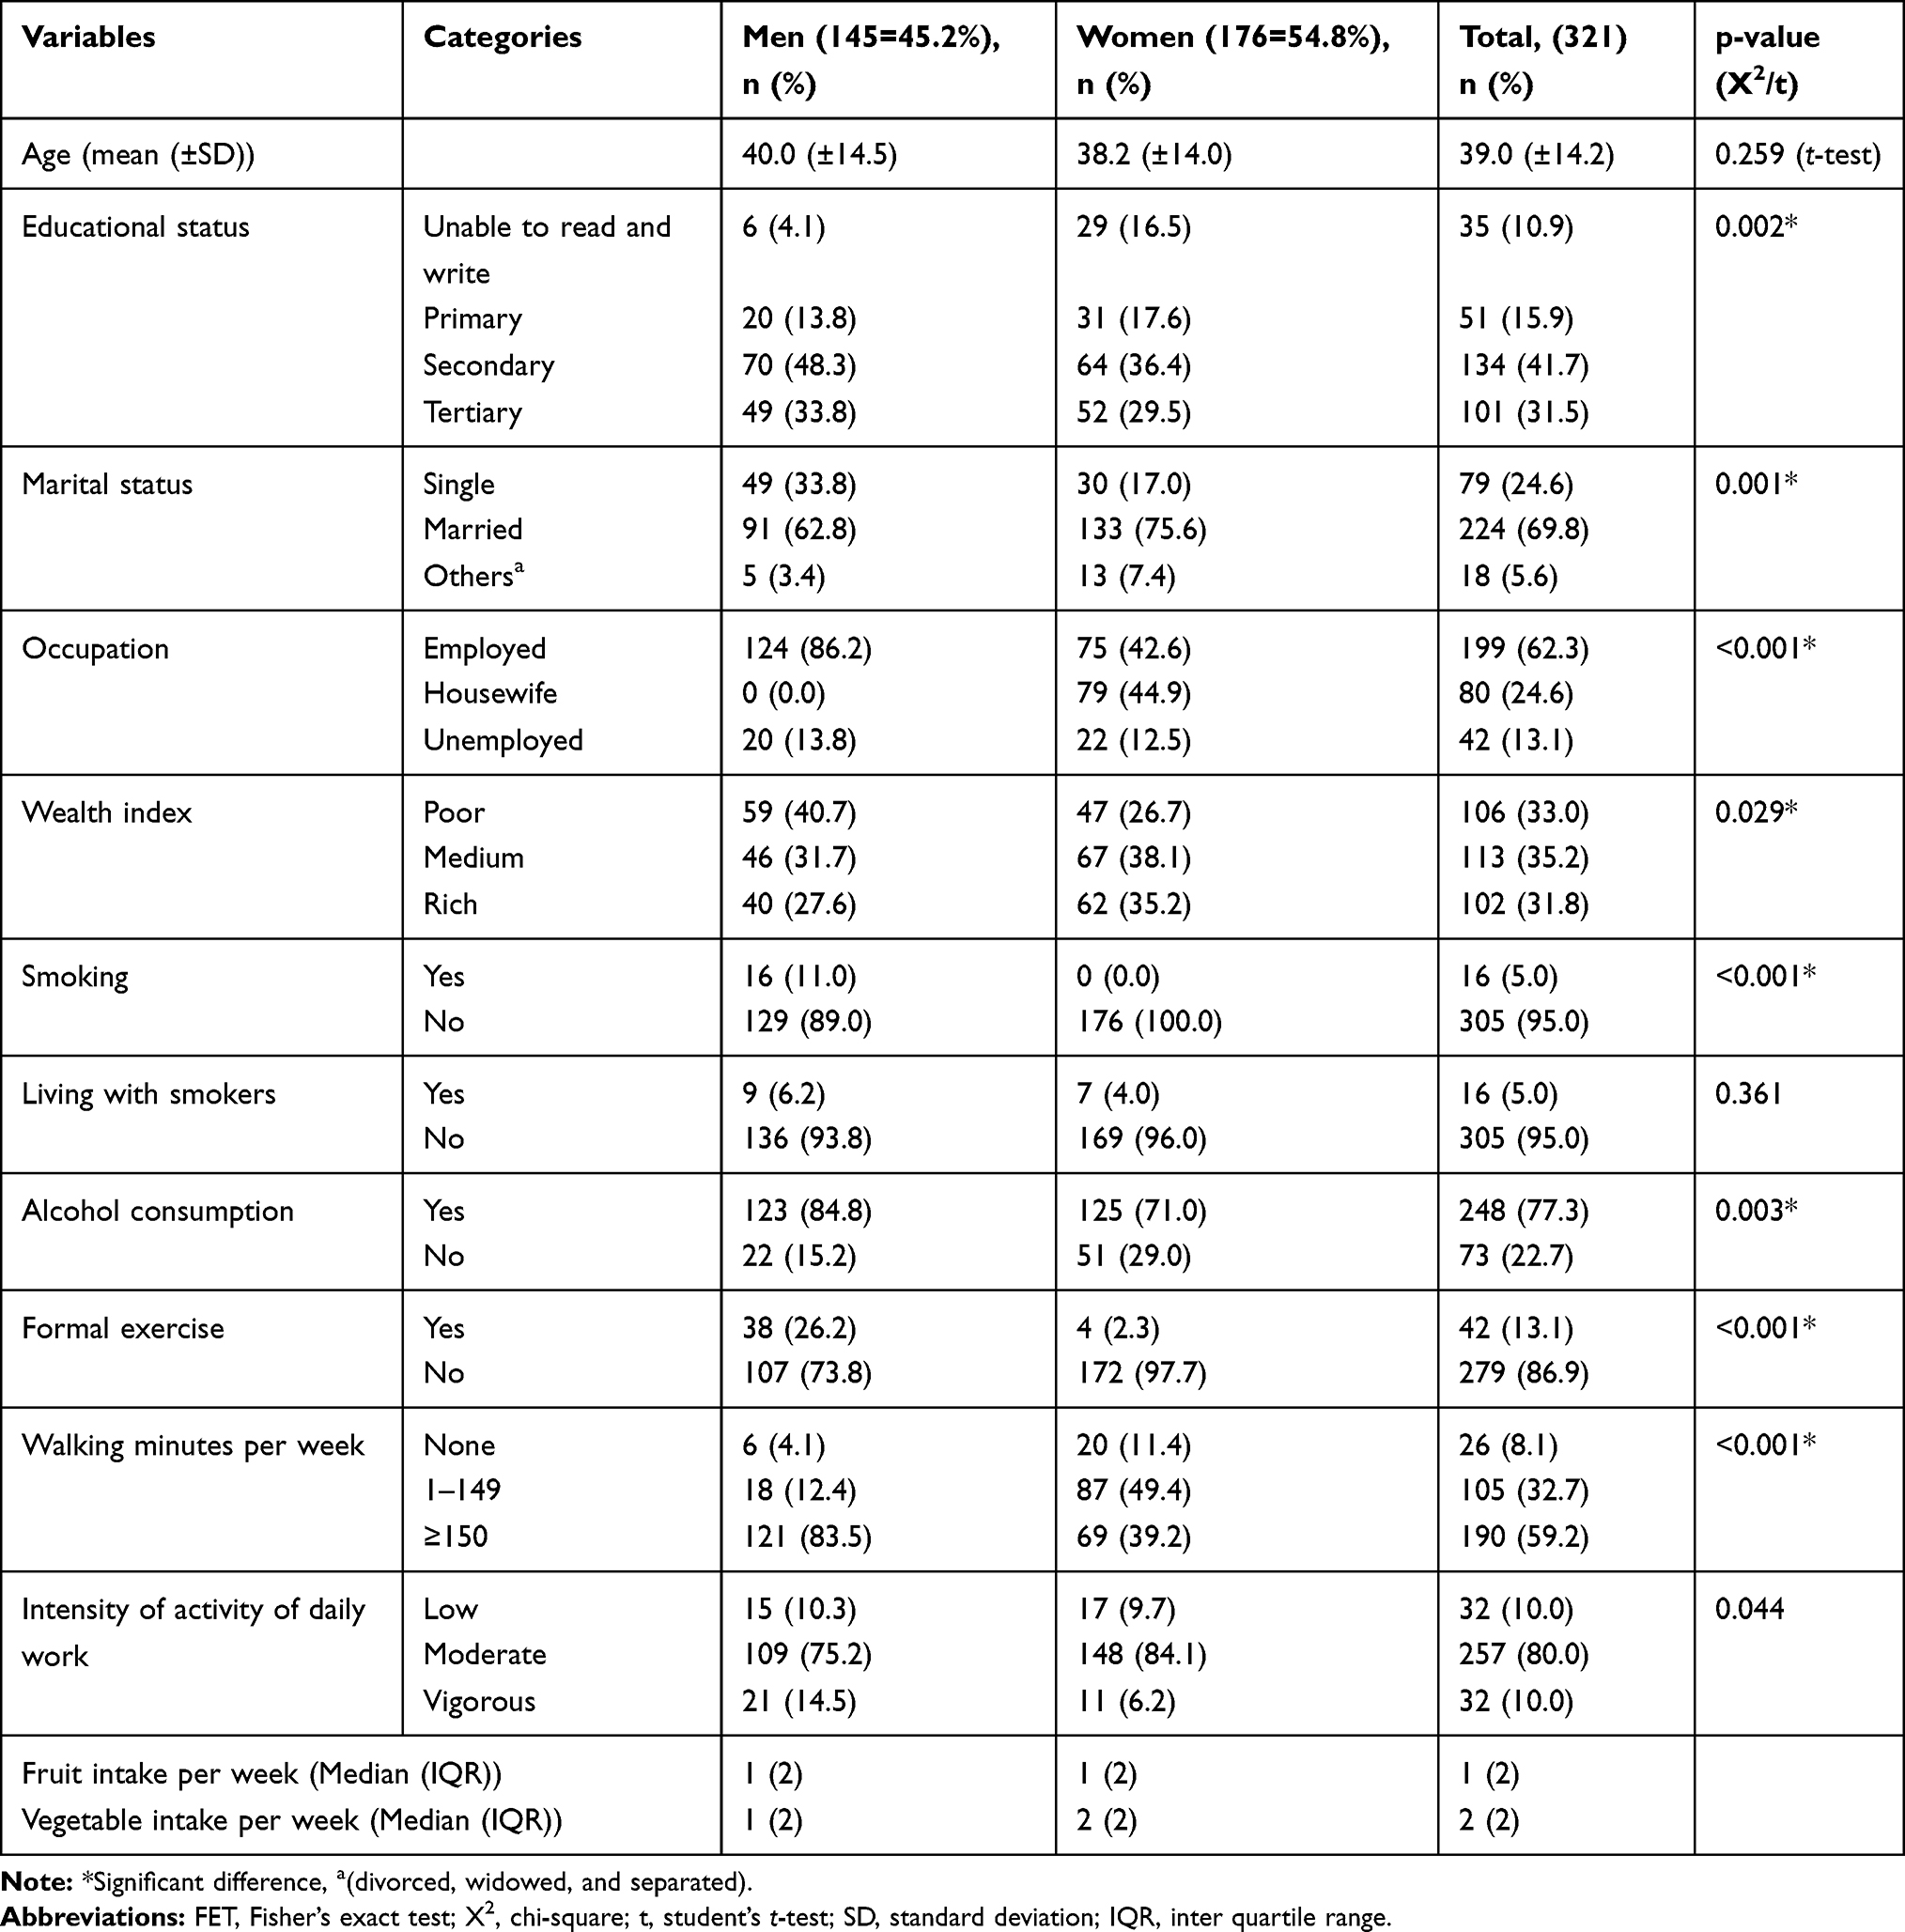 |
Table 1 Socio-Demographic, Lifestyle, and Behavioral Characteristics of the Participants Stratified by Sex (n = 321) |
Clinical and Anthropometric Characteristics of the Participants
More than half (60.1%) of adults ever been measured their blood pressure while around half (48.9%) of the participants ever been measured their blood glucose. A significantly higher proportion of women were ever been measured their blood pressure and blood glucose (p<0.005). Besides, 10.0% of participants were ever told having raised blood pressure and 3.1% were on treatment for hypertension. Similarly, 4.7% were ever told having raised blood glucose and 1.2% were on treatment for diabetes. The mean (±SD) of FBG was 97.42 (±38.03) mg/dL, higher among men (101.02 (±38.86) mg/dL) compared to women (94.45 (±37.17) mg/dL) with no statistically significant difference across gender.
Almost one-third (30.8%) of the participants had raised total cholesterol and a half (49.5%) had raised LDL-C with no significant difference across gender. Besides, raised triglyceride was detected in 40.2%, significantly higher among men (51.0%) compared to women (31.2%) (p<0.001). Only 16.5% of adults had low HDL-C with significantly higher prevalence among women (21.6%) compared to men (10.3%) (p = 0.007). Likewise, more than one quarter (27.1%) of the participants were overweight and 13.1% were obese. More women were underweight (9.1%) and obese (16.5%) compared to men, among whom the prevalence was 6.9% and 9.0%, respectively. Similarly, around 43.6% of adults had central obesity with a significantly higher proportion among women (54.5%) compared to men (30.3%) (p<0.001). Besides, three-quarters (74.8%) of the participants had elevated waist to hip ratio, significantly higher among women (79.5%) compared to men (69.0%) (p = 0.03). Likewise, raised blood pressure was detected in 44.2% of the participants, with no significant difference across gender (Table 2).
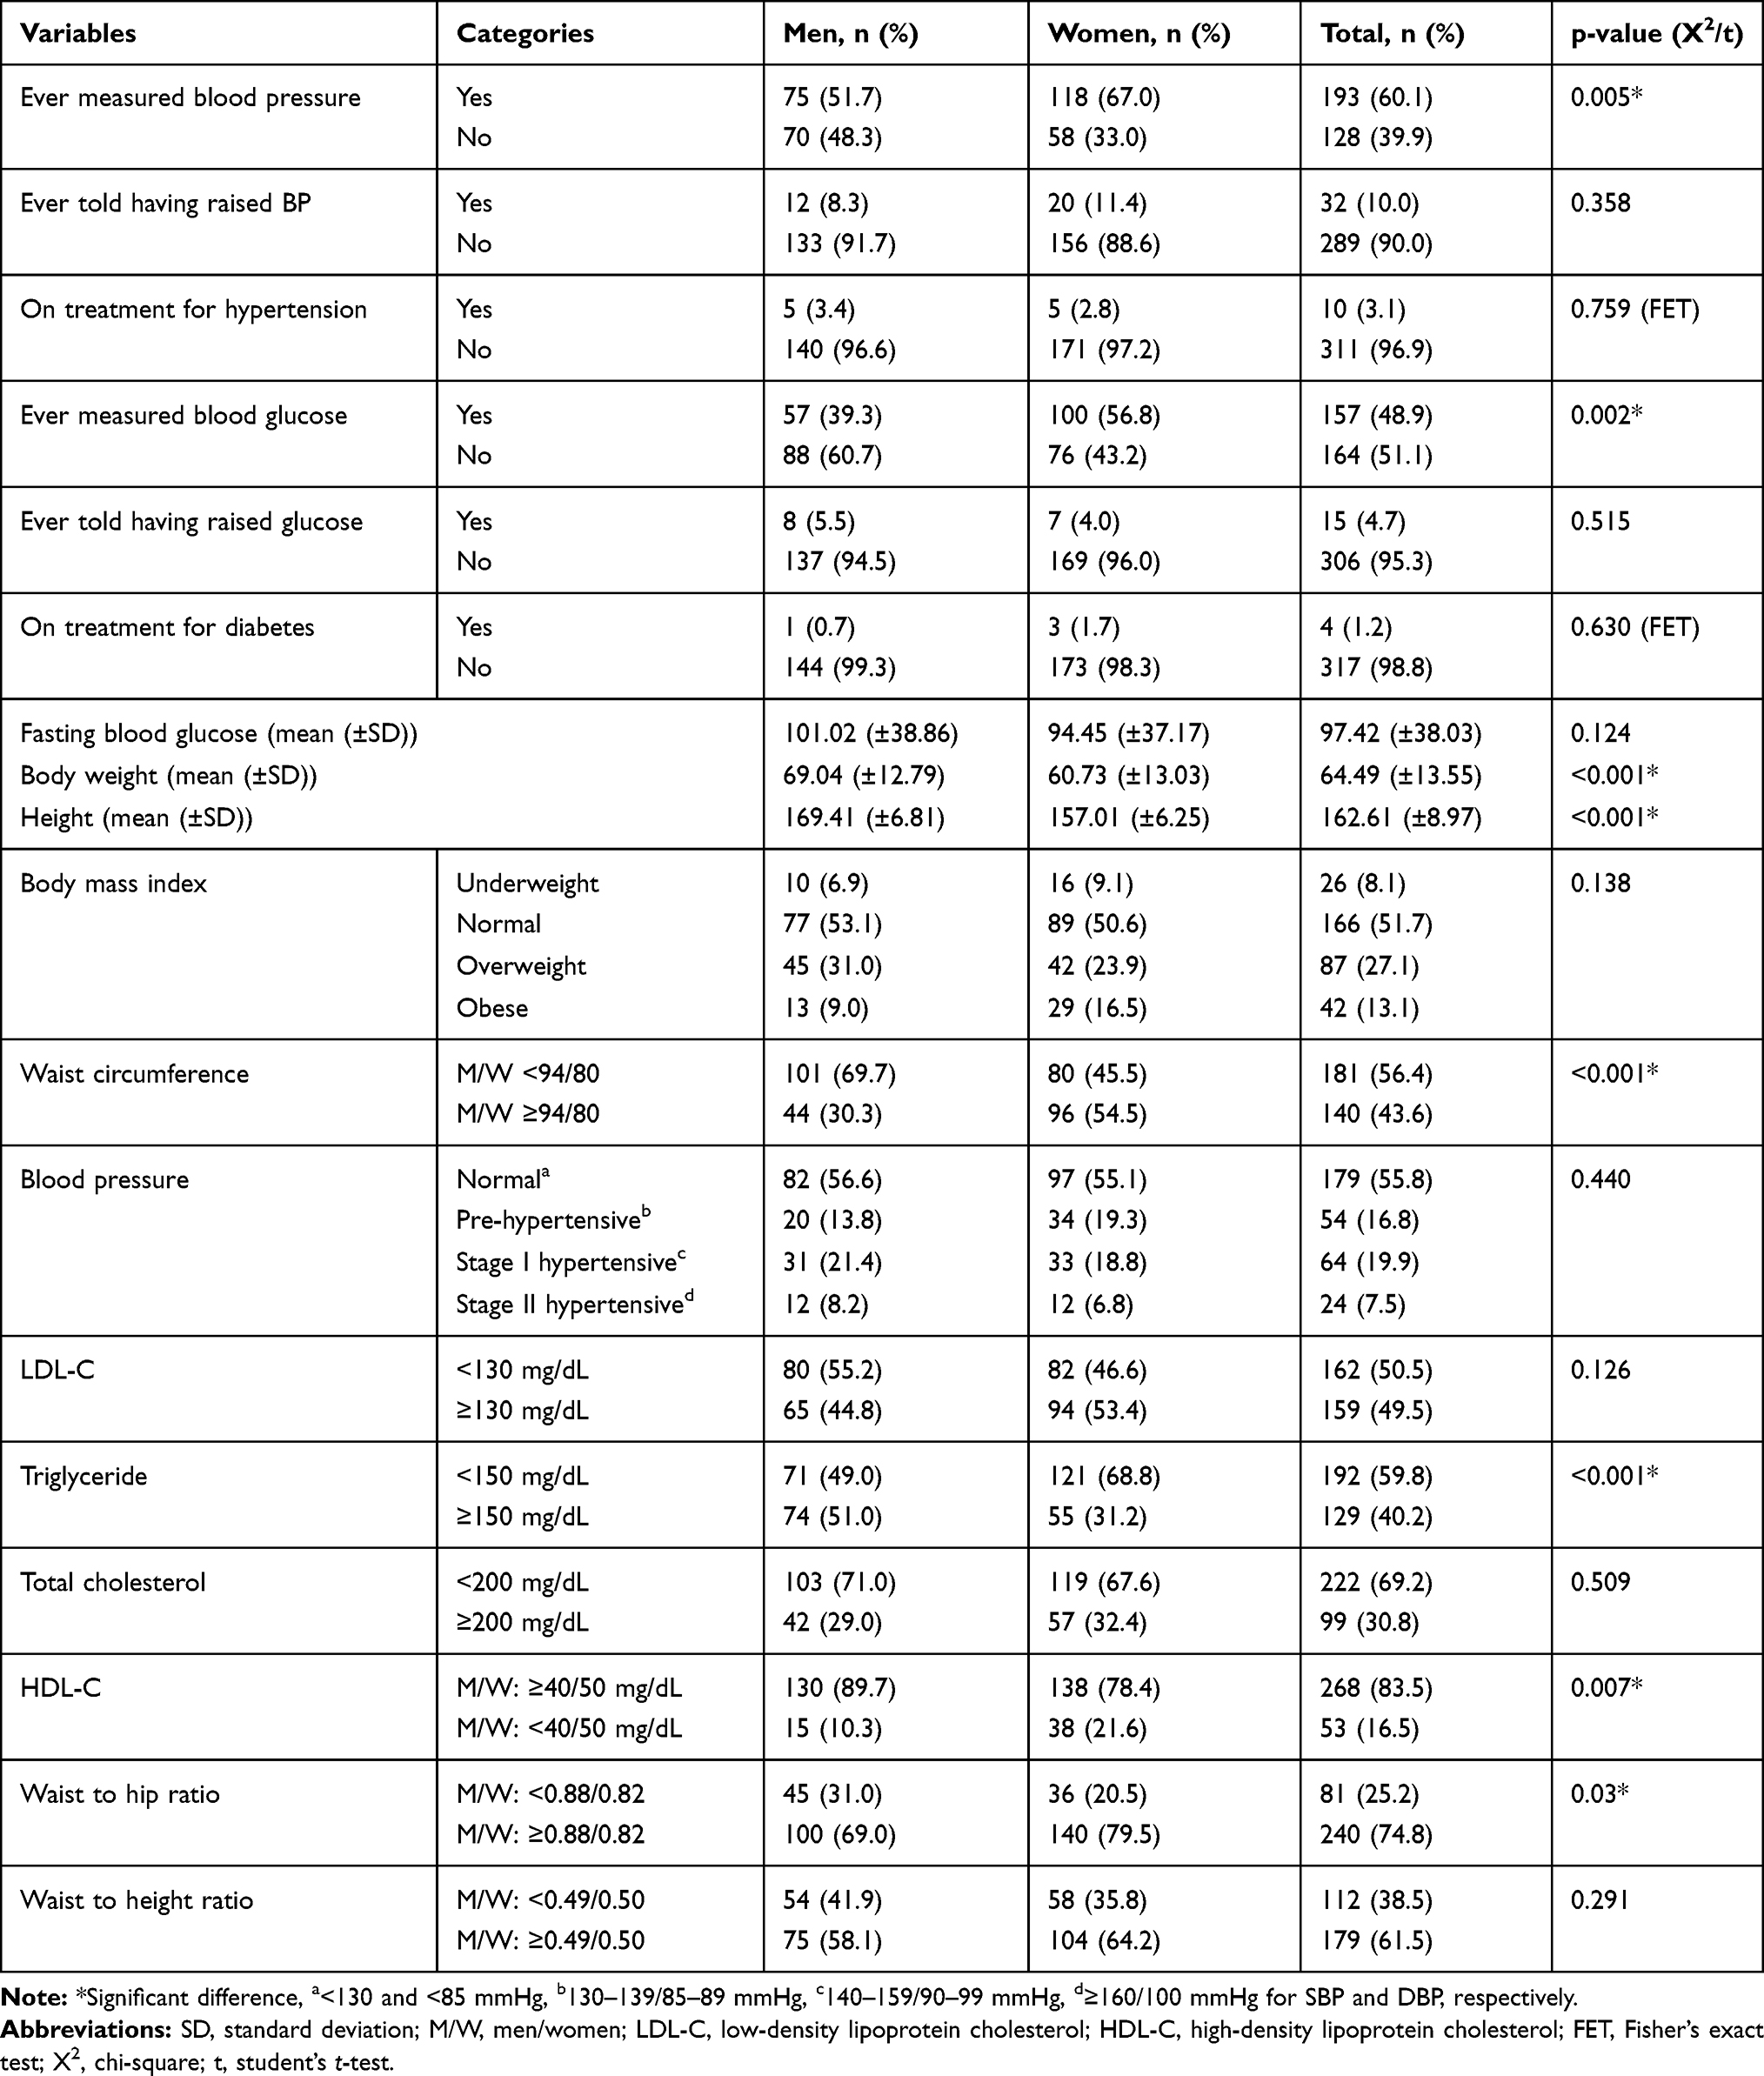 |
Table 2 Clinical and Anthropometric Findings of the Participants Stratified by Sex (n = 321) |
Prevalence of Abnormal Glucose Metabolism
Of the total (321) participants, 40 (12.5%) had pre-diabetes while 30 (9.3%) had diabetes with an overall abnormal glucose metabolism prevalence of 70 (21.8%). Of the 30 diabetic cases, 21 (70.0%) were newly diagnosed, making the ratio of diagnosed to undiagnosed diabetes 1:2.3. The prevalence of pre-diabetes and diabetes were slightly higher in men compared to women with no statistically significant difference. The prevalence of both pre-diabetes and diabetes was significantly increased with age (p<0.001). The prevalence of pre-diabetes was 7.4% in the lowest (20–39 years) age range, increased to 20.2% in the medium (40–64 years) age range, and slightly decreased to 18.2% in the highest (≥65 years) age range. The same is true for diabetes with a prevalence of 5.8%, 14.7%, and 13.6% among 20–39 years, 40–64 years, and ≥65 years age range, respectively. The highest prevalence of pre-diabetes (17.1%) and diabetes (13.9%) were found among adults who cannot read and write and with tertiary education, respectively. Similarly, the highest (13.3%) prevalence of diabetes was documented in the medium tertile of wealth index, and the prevalence of pre-diabetes was almost the same in the medium (14.2%) and rich (14.7%) tertile of the wealth index.
Both pre-diabetes and diabetes were significantly increased with heart rate (p = 0.029). The prevalence of prediabetes was 7.2%, 13.6%, and 16.8%, and that of diabetes was 4.5%, 11.7%, and 12.1% among participants with low, medium, and high rank of heart rate, respectively. Significantly higher prevalence of pre-diabetes and diabetes were also observed among participants who have house servant (p<0.001) and laundry machine (p = 0.012). Only 4.3% of subjects with normal WC had diabetes whereas the prevalence was 14.4% in subjects with central obesity. Likewise, the prevalence of pre-diabetes was 9.3% and 15.6% in subjects with normal WC and central obesity, respectively. A higher proportion (19.5%) of overweight participants had pre-diabetes, whereas a higher proportion (21.4%) of obese participants had diabetes. That means when adults develop overweight, they will become more prone to pre-diabetes and when they move to obesity, they will move to diabetes too. The same is true in blood pressure, with more prediabetes (16.7%) and diabetes (18.2%) in pre-hypertensive and hypertensive participants, respectively. More than one-quarter of metabolic syndrome positive adults had pre-diabetes (25.7%) and diabetes (27.1%), whereas the prevalence was only 8.0% and 2.8%, respectively among metabolic syndrome negative adults. Similarly, 16.8% and 13.1% of participants with dyslipidemia had pre-diabetes and diabetes, respectively whereas the prevalence was only 3.7% and 1.9% respectively among dyslipidemia negative participants (Table 3).
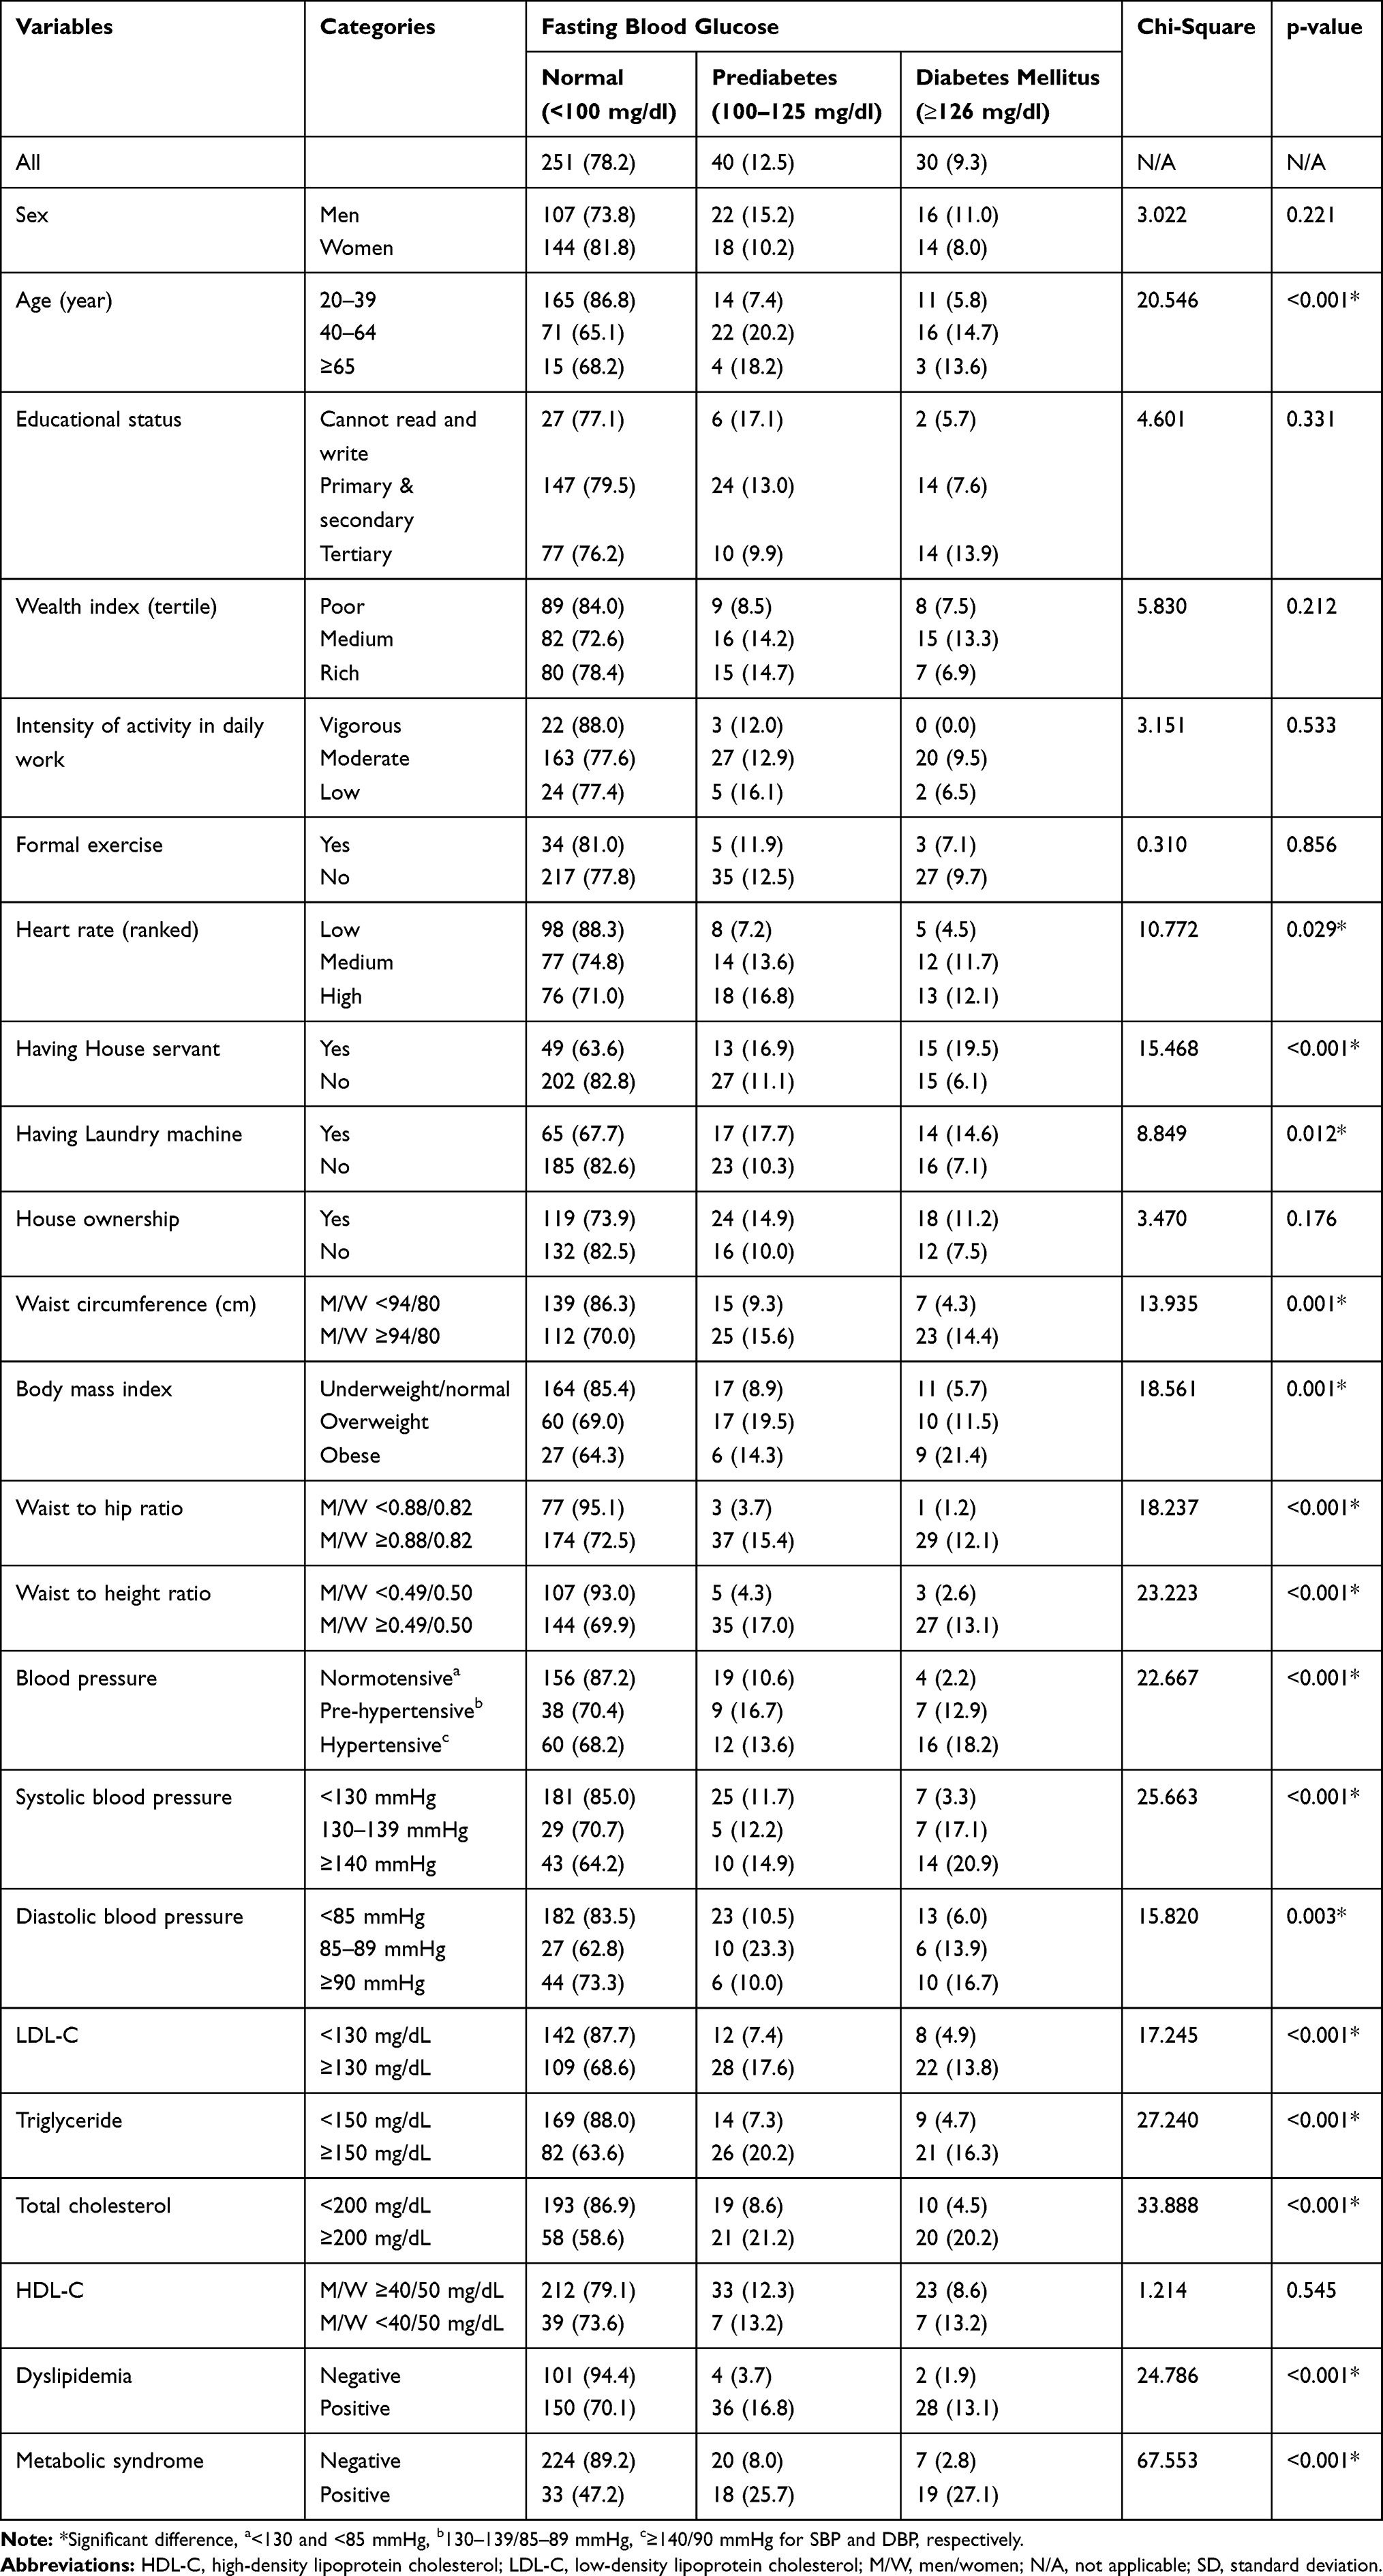 |
Table 3 Background Characteristics of the Participants Stratified by Blood Glucose (n=321) |
The prevalence of abnormal glucose metabolism was increased throughout the whole ranges of total cholesterol, triglyceride, LDL-C, and BMI, whereas some irregularity in trend was observed with age and blood pressure. The highest (85.7%) prevalence of abnormal glucose metabolism was documented among adults with very high triglyceride concentration (>500 mg/dL), followed by 60.0% in adults with very high total cholesterol concentration (≥300 mg/dL). The prevalence was increased to 36.6% up to 60 years age range, then decreased to 25.0% in the age range of 60–69 years and again increased to 35.7% among participants with the peak age range (≥70 years). The prevalence was also increased from 12.9% (among normotensive participants) to 30.0% (among pre-hypertensive), then slightly decreased to 27.3% (among stage one hypertensive) and lastly increased largely to 40.6% (among stage two hypertensive participants) (Figure 2).
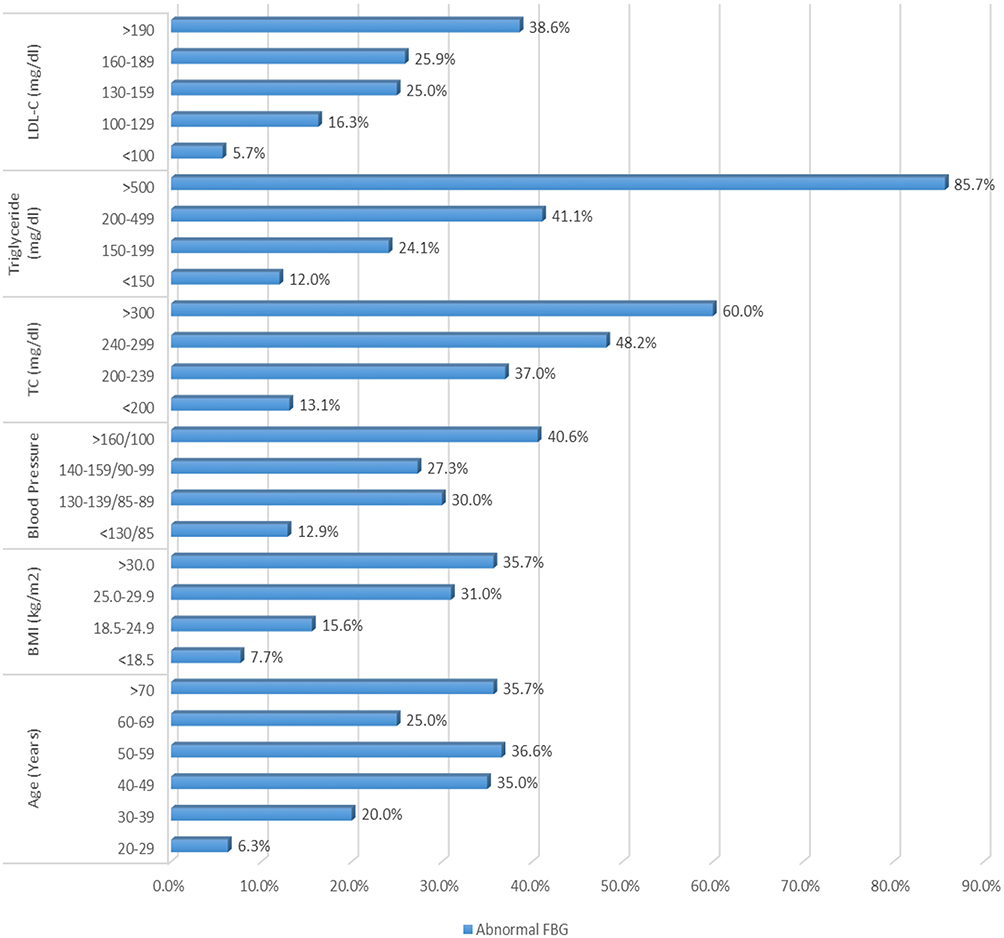 |
Figure 2 Trend of abnormal glucose metabolism with age, BMI, blood pressure, and lipid profile (n = 321). |
Factors Associated with Abnormal Glucose Metabolism
On multivariable logistic regression (model I), advanced age; raised waist to height ratio (men/women ≥0.49/0.50); the medium and high rank of heart rate; and raised total cholesterol (TC ≥200 mg/dL) were significantly associated with increased odds of pre-diabetes, adjusting for all other variables in the model. Participants aged 40 years and above were around 3.7 times more likely to develop pre-diabetes compared to the lower age groups (AOR: 3.653, 95% CI: 1.698–7.863). Likewise, adults with raised waist to height ratio were around 3.2 times more likely to have pre-diabetes compared to adults with normal waist to height ratio (AOR: 3.153, 95% CI: 1.212–9.470). Similarly, subjects with medium and high rank of heart rate were around 3.3 (AOR: 3.324, 95% CI: 1.213–9.110) and 3.9 (AOR: 3.921, 95% CI: 1.480–10.386) times, respectively more likely to develop pre-diabetes compared to subjects in the low rank of heart rate. Besides, the risk of having pre-diabetes among participants with raised total cholesterol was 2.6 times higher than in participants with normal total cholesterol (AOR: 2.549, 95% CI: 1.200–5.415) (Table 4).
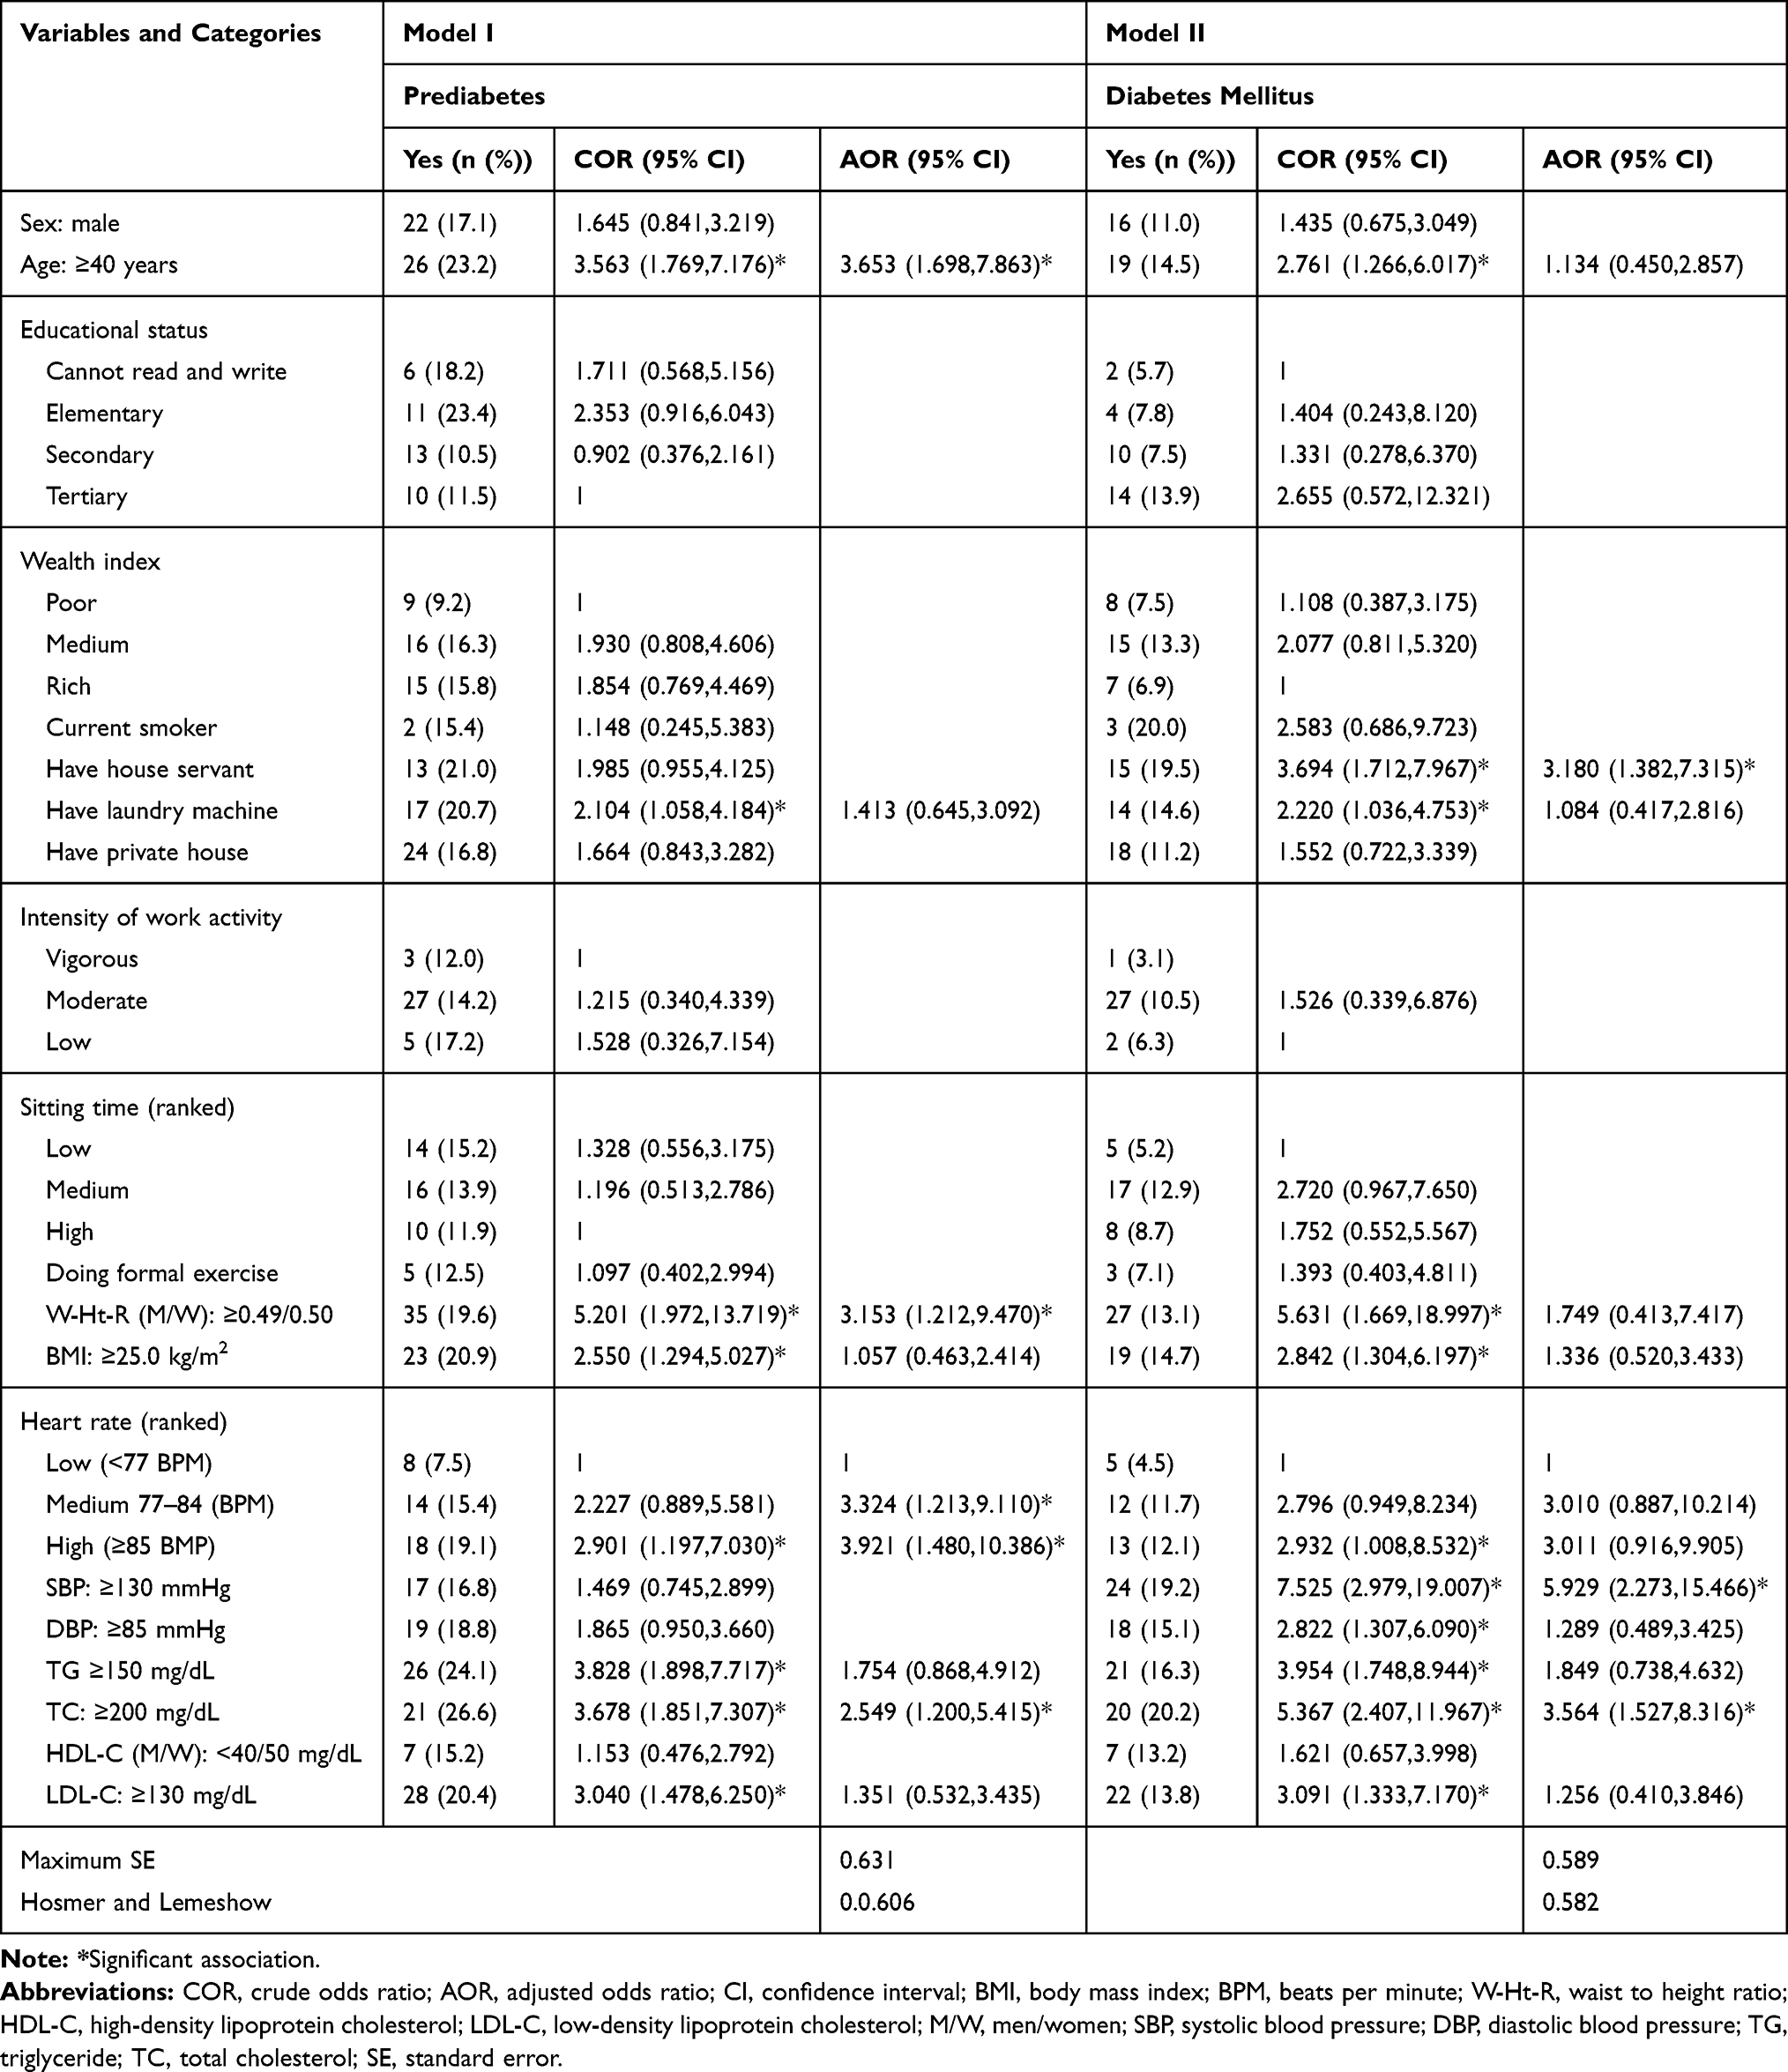 |
Table 4 Bivariate and Multivariable Logistic Regression Analysis to Determine Factors Associated with Abnormal Glucose Metabolism (n = 321) |
Besides, on multivariable logistic regression (model II), having house servant, SBP ≥130 mmHg, and raised total cholesterol (TC ≥200 mg/dL) were significantly associated with increased odds of diabetes, adjusting for all other variables in the model. The odds of developing diabetes mellitus in subjects having house servant was 3.2 times higher compared to subjects having no house servant (AOR: 3.180, 95% CI: 1.382–7.315). Likewise, adults with raised SBP were 5.9 times at higher risk of developing diabetes compared to adults with normal SBP (AOR: 5.929, 95% CI: 2.273–15.466). Similarly, study participants with raised total cholesterol were 3.6 times more likely to have diabetes compared to participants with normal total cholesterol (AOR: 3.564, 95% CI: 1.527–8.316) (Table 4).
Discussion
NCDs are becoming one of the major health challenges in Ethiopia, leading to a double burden in the population together with the unresolved burden of infectious diseases. Besides, the current status of NCDs especially pre-diabetes and diabetes is not well studied. In the present study, we found a high prevalence of pre-diabetes (12.5%) and diabetes mellitus (9.3%) among adults aged 20 years and above residing in Mekelle city, Northern Ethiopia. The possible explanation may be, as death from infectious diseases declined in Ethiopia, life expectancy increased accompanied by other risk factors like dietary change, adoption of a sedentary lifestyle, overweight, and obesity all of which fuels the pre-diabetes and diabetes prevalence.32 Besides, a fast-growing economy accompanied by rapid urbanization may contribute to the rise in the prevalence.
More than two-thirds (70.0%) of adults with diabetes we found in the present study were newly diagnosed, comparable with the previous finding in North East Ethiopia (72.5%).33 But higher than the previous studies conducted in Southern Ethiopia specifically Hosanna town (36.0%),22 Bona (54.0%),21 and that reported elsewhere in Sub-Saharan African countries (25.0%-56.8%).34–37 This showed poor community awareness in diabetes screening practice among the urban dwellers of Ethiopia. Since the present study setting is the second-largest city in Ethiopia, it is expected to have better health-seeking behavior in the community. Being urban residents can have better knowledge and awareness of factors that would change their lifestyle in an attempt to decrease the risk of pre-diabetes and diabetes. However, the proportion of undiagnosed diabetes (70.0%) we found showed the opposite.
It is of paramount importance to improve community awareness about NCDs like diabetes to enhance early detection and management before its progression to life-threatening complications. After diabetes-related complications become clinically manifested, it will be too late to reverse the problem and to overcome the complications; that also demand costly resources, which is unaffordable in developing countries like Ethiopia. But the proportion of undiagnosed diabetes we found in the present study was lower than previous findings documented in Ethiopia (88.5%,23 76.1%,20) and Swaziland (89.3%).38 This may be due to differences in the study setting and inclusion of lower age participants.
The prevalence of diabetes (9.3%) we found in the present study was comparable with previous study findings conducted in North West Ethiopia (8.8%,39 10.2%40). But higher than many previous study findings from Southern Ethiopia specifically Mizan Aman (6.5%),23 Hosanna (5.7%),22 Bona (1.9%),21 and Robe (1.4%),41 and outside Ethiopia including Swaziland (7.3%),38 Ghana (5.4%),42 Namibia (5.1%),43 and China (4.2%).44 Similarly, it was higher than the 2019 IDF report on diabetes prevalence in Ethiopia (4.3%) and Africa (4.7%).9 This difference may be due to differences in lifestyle, socioeconomic status, level of urbanization, study setting, and sample size.
We also found a high prevalence of pre-diabetes (12.5%), comparable with the finding from Koladiba town (12.0%),17 showing that unless the necessary measure is taken, it will evolve to diabetes.9,45 Most of the pre-diabetes individuals evolve to diabetes in 5 to 10 years and are at high risk of developing complications. It was much higher than previously reported findings in Southern Ethiopia (2.6%)21 and elsewhere including Ghana (10.0%),42 China (7.2%),44 Swaziland (6.5%),38 and Uganda (3.8%).46 Contrary to this, the present finding is lower than previous findings from Mizan Aman (15.9%),23 North East Ethiopia (15.7%),33 and Namibia (20.1%).43 Similarly, this difference may be due to differences in diagnostic criteria (IDF versus WHO), lifestyle, socioeconomic status, level of urbanization, study setting, and sample size.
Advanced age, raised total cholesterol, medium and high rank of heart rate, and increased waist to height ratio were significantly associated with a higher risk of pre-diabetes. Similarly, having house servant, systolic hypertension, and raised total cholesterol were positively significantly associated with diabetes. All of the identified risk factors, except advanced age, are modifiable that can be averted. Advanced age was significantly associated with pre-diabetes, in agreement with previous study findings in Ethiopia,21,33,47 and outside Ethiopia including Namibia,43 and Swaziland.38 This may be due to the decreasing level of activity, increasing body weight, and decreasing insulin sensitivity with age. Therefore, routine diabetes checkup activities should be in place prioritizing older adults. However, unexpectedly advanced age was not significantly associated with diabetes, which may be due to the small number of diabetes cases.
Waist to height ratio was positively associated with pre-diabetes, in agreement with previous studies conducted elsewhere.48–51 This may be due to excessive non-essential fat accumulation around the vital organs with increased waist to height ratio, which may lead to low secretion of insulin by the pancreas or insulin insensitivity, both leads to type 2 diabetes. It has been indicated that excessive abdominal fat accumulation disturbs insulin action by secreting free fatty acids. Besides fat cells release signaling factors like interleukein-6 and tumor necrosis factor-α which take part in the development of insulin resistance.52 We found a remarkably high proportion (61.5%) of subjects with raised waist to height ratio, which may contribute to the alarmingly increasing prevalence of diabetes in Ethiopia.
Participants with raised total cholesterol were 2.6 and 3.6 times at higher risk of developing prediabetes and diabetes, respectively. Previous studies documented that total cholesterol was significantly associated with diabetes only.23,33,53,54 This may be due to the tendency of increasing concentration of total cholesterol and blood glucose almost in the same manner with body weight in general and central obesity in particular. However, the literature on the effect of the total cholesterol on prediabetes is limited.
The medium and high rank of heart rate were also positively associated with pre-diabetes, but not with diabetes. The higher the number of heart rate per minute, the more the risk of pre-diabetes. Heart rate may increase with most metabolic risk factors like age, body weight, central obesity, and inactivity, all of which may lead to decreased secretion of insulin and insulin insensitivity. A fast resting heart rate was significantly associated with an increased risk of type two diabetes mellitus.55–58 A fast heart rate or tachycardia is a signal from the sympathetic nervous system and increased sympathetic activity elevate not only pulse rate but also blood glucose, which is a specific and pathologic feature of diabetes. Therefore, chronic sympathetic over activity may indicate the development of diabetes in subjects with an increased heart rate.59
Systolic hypertension was also significantly associated with increased odds of diabetes, consistent with previous studies.21,33 Both hypertension and diabetes mostly appear together, increases in the same manner, and share most of the risk factors like increased body weight.60 Hypertension is associated with insulin resistance especially in the skeletal muscle, which involves in the conversion of excess glucose into glycogen.61 If excess glucose is not converted into glycogen by muscle cells, it will circulate in the blood. Under persistent condition, this can develop to diabetes mellitus. Besides, the occurrence of both diseases increases with age and they have similar predisposing factors.
Participants having house servant in their household were at a higher risk of having diabetes. If an individual has a house servant, s/he will stop all household activities, which may lead to less energy expenditure and more weight gain. If an individual is not engaged in household activities, the amount of fat mass increases replacing the lean mass, such that the amount of muscle available for glucose absorption decreases. Besides, if subjects are not actively engaged in routine household activities, they will prone to weight gain and this in turn leads to the production of inflammatory cytokines, which result in insulin resistance.62 Activity is important in enhancing glucose transport to the muscle cells possibly by the expression of glucose transporter 4, which in turn leads to glucose uptake by the muscle cells.63 However, the literature on the effect of having a house servant on diabetes specifically is limited.
Strengths and Limitations
The strength of the present study was, unlike many previous studies in Ethiopia that have used a random capillary blood sample, we have used both fasting and venous blood samples, which produces more accurate estimates of glucose concentration. This study was also a community-based cross-sectional study, which is more representative than previously conducted facility-based pocket studies in Ethiopia. Besides, we have used a better fully automated clinical chemistry analyzer machine. As a limitation, since the test for FBG was not repeated among the study participants, there is a potential for measurement error. The study was not able to differentiate the different types of diabetes. In addition, the causal pathways cannot be assumed, because of the cross-sectional nature of the study design.
Conclusion
We found a high prevalence of pre-diabetes and diabetes in the present study. Besides, around 70% of adults with diabetes were newly diagnosed which showed poor community awareness. This reveals an urgent need to identify undiagnosed people with diabetes and provide appropriate and timely care. Normal individuals should practice healthy lifestyle behaviors like exercising regularly to prevent weight gain, eating healthily, controlling blood pressure and lipids, thereby maintaining insulin sensitivity. Subjects with pre-diabetes could prevent the onset of type two diabetes by losing their body weight especially central obesity through physical exercise, dietary management, behavioral modification, if necessary medication, and periodic monitoring of blood glucose levels. Adults with diabetes should also be aware of the glycemic control by periodic monitoring of their blood glucose levels to prevent them from diabetes-related complications and death. Early diagnosis of diabetes is an important step to address life-threatening complications and fatality, which can be integrated into the existing health extension program in the health post in Ethiopia. The health extension program is the lowest health-care unit on which Ethiopia did an exemplary job in fighting communicable diseases. Awareness creation together with access to basic diagnostics in the primary health-care settings should therefore be a top priority.
Abbreviations
BMI, body mass index; CVD, cardiovascular disease, DBP, diastolic blood pressure; DM, diabetes mellitus; FBG, fasting blood glucose; HDL-C, high-density lipoprotein cholesterol; IDF, International Diabetic Federation; IFG, impaired fasting glucose; LDL-C, low-density lipoprotein cholesterol; NCDs, non-communicable diseases; SBP, systolic blood pressure; WC, waist circumference; WHO, World Health Organization.
Data Sharing Statement
The main part of the data generated or analyzed during this study was included in this article.
Consent to Publish
All participants provided written informed consent to publish this study.
Acknowledgments
We would like to express our heartfelt gratitude for all study participants, data collectors, Tigray Health Research Institute (our setup for a laboratory test), Jimma University and Adigrat University (for funding the study).
Author Contributions
All authors contributed to data analysis, drafting or revising the article, have agreed on the journal to which the article will be submitted, gave final approval of the version to be published, and agree to be accountable for all aspects of the work.
Disclosure
The authors declare that they have no competing interests.
References
1. Kharroubi AT, Darwish HM. Diabetes mellitus: the epidemic of the century. World J Diabetes. 2015;6(6):850–867. doi:10.4239/wjd.v6.i6.850
2. International Diabetes Federation. IDF Diabetes Atlas.
3. Loghmani E. Diabetes mellitus: type 1 and type 2. In: Stang J, Story M, editors. Guidelines for Adolescent Nutrition Services. Minneapolis: University of Minnesota; 2005:167–182.
4. Girach A, Porta M. Diabetic microvascular complications: can patients at risk be identified? A review. Int J Clin Pract. 2006;60(11):1471–1483.
5. IDF. IDF Diabetes Atlas.
6. Yamagishi S, Imaizumi T. Diabetic vascular complications: pathophysiology, biochemical basis and potential therapeutic strategy. Curr Pharm Des. 2005;11:2279–2299. doi:10.2174/1381612054367300
7. American diabetes association. Diagnosis and classification of diabetes mellitus. Diabetes Care. 2008;31:S55–60. doi:10.2337/dc08-S055
8. Manuel D, Schultz S. Health-related quality of life and health-adjusted life expectancy of people with diabetes mellitus in Ontario, Canada, 1996–1997. Diabetes Care. 2004;27:407–414.
9. IDF. IDF Diabetes Atlas.
10. WHO. Global Report on Diabetes. Geneva, Switzerland: WHO; 2016.
11. Guariguata L, Whiting DR, Hambleton I, et al. Global estimates of diabetes prevalence for 2013 and projections for 2035. Diabetes Res Clin Pract. 2014;103(2):137–149. doi:10.1016/j.diabres.2013.11.002
12. Harrison TA, Hindorff LA, Kim H, et al. Family history of diabetes as a potential public health tool. Am J Prev Med. 2003;24(2):152–159. doi:10.1016/S0749-3797(02)00588-3
13. Bos M, Agyemang C. Prevalence and complications of diabetes mellitus in Northern Africa, a systematic review. BMC Public Health. 2013;13(1). doi:10.1186/1471-2458-13-387
14. Ginter E, Simko V. Type 2 diabetes mellitus, pandemic in 21st century. Adv Exp Med Biol. 2013;771:42–50.
15. Motala A, Omar M, Pirie F. Diabetes in Africa: diabetes micro vascular and macro vascular disease in Africa. J Cardiovasc Risk. 2003;10(2):77–83. doi:10.1097/00043798-200304000-00002
16. Gebreyes YF, Goshu DY, Geletew TK, et al. Prevalence of high blood pressure, hyperglycemia, dyslipidemia, metabolic syndrome and their determinants in Ethiopia: evidences from the National NCDs STEPS Survey, 2015. PLoS One. 2018;13(5):e0194819. doi:10.1371/journal.pone.0194819
17. Worede A, Alemu S, Gelaw YA, et al. The prevalence of impaired fasting glucose and undiagnosed diabetes mellitus and associated risk factors among adults living in a rural Koladiba town, northwest Ethiopia. BMC Res Notes. 2017;10:251. doi:10.1186/s13104-017-2571-3
18. Tesfaye T, Shikur B, Shimels T, et al. Prevalence and factors associated with diabetes mellitus and impaired fasting glucose level among members of federal police commission residing in Addis Ababa, Ethiopia. BMC Endocr Disord. 2016;16:68. doi:10.1186/s12902-016-0150-6
19. Habtewold TD, Tsega WD, Wale BY. Diabetes Mellitus in Outpatients in Debre Berhan Referral Hospital, Ethiopia. HPC J Diabetes Res. 2016;2016. doi:10.1155/2016/3571368
20. Animaw W, Seyoum Y. Increasing prevalence of diabetes mellitus in a developing country and its related factors. PLoS One. 2017;12(11):e0187670. doi:10.1371/journal.pone.0187670
21. Zekewos A, Loha E, Egeno T, et al. Prevalence of diabetes mellitus and associated factors in Bona District, Sidama Zone: a community based study. Ethiop J Health Sci. 2018;28(4):451. doi:10.4314/ejhs.v28i4.11
22. Dereje N, Earsido A, Temam L, et al. Prevalence and associated factors of diabetes mellitus in Hosanna Town, Southern Ethiopia. Ann Glob Health. 2020;86(1):1–9. doi:10.5334/aogh.2663
23. Aynalem SB, Zeleke AJ. Prevalence of diabetes mellitus and its risk factors among individuals aged 15 years and above in Mizan-Aman Town, Southwest Ethiopia, 2016: a cross sectional study. Int J Endocrinol. 2018;2018:1–7. doi:10.1155/2018/9317987
24. Giday A, Wolde M, Yihdego D. Hypertension, obesity and central obesity in diabetics and non-diabetics in Southern Ethiopia. Ethiop J Health Dev. 2010;42(2):145–147.
25. WHO. The WHO STEPwise approach to chronic disease risk factor surveillance (STEPS). Geneva: Switzerland. V2.1; 2009. Available from: www.who.int/chp/steps.
26. Stewart A, Marfell-Jones M, De Ridder JH. International Standards for Anthropometric Assessment.
27. Alberti KGMM, Zimmet P, Shaw J. Metabolic syndrome — a new world-wide definition. A Consensus Statement from the International Diabetes Federation. Diabet Med. 2006;23(5):469–480. doi:10.1111/j.1464-5491.2006.01858.x
28. NCEP Expert panel on detection, evaluation, and treatment of high blood cholesterol in adults. Executive summary of the third report of the National Cholesterol Education Program (NCEP) expert panel on detection, evaluation, and treatment of high blood cholesterol in adults (adult treatment panel III). JAMA. 2001;285(19):2486–2497. doi:10.1001/jama.285.19.2486
29. Douglas G, Nicol F, Robertson C. Macleod’s Clinical Examination E-Book, UK.
30. Sinaga M, Worku M, Yemane T, et al. Optimal cut-off for obesity and markers of metabolic syndrome for Ethiopian adults. Nutr J. 2018;17(109):1–12. doi:10.1186/s12937-018-0416-0
31. Vyas S, Kumaranayake L. Constructing Socio-Economic Status Indices: How to Use Principal Components Analysis. London: Oxford University Press; 2006.
32. Smyth S, Heron A. Diabetes and obesity: the twin epidemics. Nat Med. 2006;12:75–80. doi:10.1038/nm0106-75
33. Asmelash D. Prevalence of diabetes mellitus, prediabetes and its associated factors in Dessie Town, Northeast Ethiopia: a community-based study. Diabetes Metab Syndr Obes. 2019;12:2799–2809. doi:10.2147/DMSO.S225854
34. Price AJ, Crampin AC, Amberbir A, et al. Prevalence of obesity, hypertension, and diabetes, and cascade of care in sub-Saharan Africa: a cross-sectional, population-based study in rural and urban Malawi. Lancet Diabetes Endocrinol. 2018;6:208–222. doi:10.1016/S2213-8587(17)30432-1
35. Bailey SL, Ayles H, Beyers N, et al. Diabetes mellitus in Zambia and the Western cape province of South Africa: prevalence, risk factors, diagnosis and management. Diabetes Res Clin Pract. 2016;118:1–11. doi:10.1016/j.diabres.2016.05.001
36. Werfalli M, Kassanjeeb R, Kalulac S, et al. Diabetes in south African older adults: prevalence and impact on quality of life and functional disability – as assessed using SAGE wave 1 data. Glob Health Action. 2018;11:1449924. doi:10.1080/16549716.2018.1449924
37. Christensen DL, Friis H, Mwaniki D, et al. Prevalence of glucose intolerance and associated risk factors in rural and urban populations of different ethnic groups in Kenya. Diabetes Res Clin Pract. 2009;84(3):303–310. doi:10.1016/j.diabres.2009.03.007
38. Gbadamosi MA, Tlou B. Prevalence of abnormal glucose metabolism among adults attending an outpatient department at a tertiary referral hospital in Swaziland: a cross-sectional study. BMC Public Health. 2020;20(392):1–12. doi:10.1186/s12889-020-08489-9
39. Gebrie A, Tesfaye B, Gebru T, et al. Diabetes mellitus and its associated risk factors in patients with human immunodeficiency virus on anti - retroviral therapy at referral hospitals of Northwest Ethiopia. Diabetol Metab Syndr. 2020;12(20):1–8. doi:10.1186/s13098-020-00527-1
40. Bantie GM, Wondaye AA, Arike EB, et al. Prevalence of undiagnosed diabetes mellitus and associated factors among adult residents of Bahir Dar city, northwest Ethiopia: a community based cross sectional study. BMJ Open. 2019;9:e030158. doi:10.1136/bmjopen-2019-030158
41. Gebrewold F. Prevalence of diabetes mellitus patients attending Robe Hospital, Robe, Bale Zone, Ethiopia. J Health Med Nurs. 2018;16(46):247–254.
42. Bawah AT, Yawson AA, Seini MM, et al. Prevalence of diabetes among homeless and slum dwellers in Accra, Ghana: a survey study. BMC Res Notes. 2019;12(572):1–5. doi:10.1186/s13104-019-4613-5
43. Adekanmbi VT, Uthman OA, Erqou S, et al. Epidemiology of prediabetes and diabetes in Namibia, Africa: a multilevel analysis. J Diabetes. 2019;11:161–172.
44. Abdulai T, Li Y, Zhang H, et al. Prevalence of impaired fasting glucose, type 2 diabetes and associated risk factors in undiagnosed Chinese rural population: the Henan Rural Cohort Study. BMJ Open. 2019;9:e029628. doi:10.1136/bmjopen-2019-029628
45. Huang D, Refaat M, Mohammedi K, et al. Macrovascular complications in patients with diabetes and prediabetes. Biomed Res Int. 2017;2017:1–9. doi:10.1155/2017/7839101
46. Aramo C, Oyom AP, Okello E, et al. Assessing the prevalence and risk factors of pre ‑ diabetes among the community of Iganga municipality, Uganda: a cross sectional study. BMC Res Notes. 2019;12(553):10–14. doi:10.1186/s13104-019-4589-1
47. Kehabtimer SK, Nardos TM, Deneke WS, et al. Prevalence and predictors of hypertension-type 2 diabetes mellitus comorbidity among patients in Wachemo University Nigest Elleni Mohammed Memorial Referral Hospital, Southern Ethiopia. EC Endocrinol Metab Res. 2020;5(2):1–11.
48. Hardy DS, Stallings DT, Garvin JT, et al. Anthropometric discriminators of type 2 diabetes among White and Black American adults. J Diabetes. 2017;9:296–307. doi:10.1111/1753-0407.12416
49. Son YJ, Kim J, Park H, et al. Association of waist-height ratio with diabetes risk: a 4-year longitudinal retrospective study. Endocrinol Metab. 2016;31:127–133. doi:10.3803/EnM.2016.31.1.127
50. Hou S, Chen G, Hu P, et al. Stronger associations of waist circumference and waist-to-height ratio with diabetes than BMI in Chinese Adults. Diabetes Res Clin Pract. 2018. doi:10.1016/j.diabres.2018.07.029
51. Jamar G, Rossi F, Gagliardi A, et al. Evaluation of waist-to-height ratio as a predictor of insulin resistance in non-diabetic obese individuals. A cross-sectional study. Sao Paulo Med J. 2017;135(5):462–468. doi:10.1590/1516-3180.2016.0358280417
52. Ekpenyong CE, Akpan U, Ibu JO, et al. Gender and age specific prevalence and associated risk factors of type 2 diabetes mellitus in Uyo metropolis, South Eastern Nigeria. Diabetol Croat. 2012;41(1).
53. Chilunga FP, Henneman P, Ac K, et al. Prevalence and determinants of type 2 diabetes among lean African migrants and non-migrants: the RODAM study. J Glob Health. 2019;9(2). doi:10.7189/jogh.09.020426
54. Das RN. Association between diabetes markers and cholesterol. Diabetes Manag. 2017;7:247–249.
55. Li Y, Sun C, Li L, et al. Resting heart rate as a marker for identifying the risk of undiagnosed type 2 diabetes mellitus: a cross-sectional survey. 2014;1–7. BMC Public Health. 2014;14:1052. doi:10.1186/1471-2458-14-1052
56. Zhang X, Shu X, Xiang Y, et al. Resting heart rate and risk of type 2 diabetes in women. Int J Epidemiol. 2010;39:900–906. doi:10.1093/ije/dyq068
57. Xu C, Zhong J, Zhu H, et al. Independent and interactive associations of heart rate and body mass index or blood pressure with type 2 diabetes mellitus incidence: A prospective cohort study. J Diabetes Investig. 2019;10:1068–1074. doi:10.1111/jdi.12999
58. Hong JW, Noh JH, Kim D. The association of resting heart rate with the presence of diabetes in Korean adults: the 2010–2013 Korea National health and nutrition examination survey. PLoS One. 2016;11(12):e0168527. doi:10.1371/journal.pone.0168527
59. Nagaya T, Yoshida H, Takahashi H, et al. Resting heart rate and blood pressure, independent of each other, proportionally raise the risk for type 2 diabetes mellitus. Int J Epidemiol. 2010;39:215–222. doi:10.1093/ije/dyp229
60. World Health Organization. World Health Day 2013: A Global Brief on Hypertension. Geneva, Switzerland: World Health Organization; 2013.
61. Contreras F, Rivera M, Vasquez J, et al. Diabetes and hypertension physiopathology and therapeutics. J Hum Hypertens. 2000;14(Suppl 1):S26–S31. doi:10.1038/sj.jhh.1000983
62. Bradley RL, Jeon JY, Liu FF, et al. Voluntary exercise improves insulin sensitivity and adipose tissue inflammation in diet-induced obese mice. Am J Physiol Endocrinol Metab. 2008;295:E586–E594. doi:10.1152/ajpendo.00309.2007
63. Leone TC, Lehman JJ, Finck BN, et al. PGC-1a-deficiency causes multi-system energy metabolic derangements: muscle dysfunction, abnormal weight control and hepatic steatosis. PLoS Biol. 2005;3(4):e101.
 © 2020 The Author(s). This work is published and licensed by Dove Medical Press Limited. The
full terms of this license are available at https://www.dovepress.com/terms
and incorporate the Creative Commons Attribution
- Non Commercial (unported, 3.0) License.
By accessing the work you hereby accept the Terms. Non-commercial uses of the work are permitted
without any further permission from Dove Medical Press Limited, provided the work is properly
attributed. For permission for commercial use of this work, please see paragraphs 4.2 and 5 of our Terms.
© 2020 The Author(s). This work is published and licensed by Dove Medical Press Limited. The
full terms of this license are available at https://www.dovepress.com/terms
and incorporate the Creative Commons Attribution
- Non Commercial (unported, 3.0) License.
By accessing the work you hereby accept the Terms. Non-commercial uses of the work are permitted
without any further permission from Dove Medical Press Limited, provided the work is properly
attributed. For permission for commercial use of this work, please see paragraphs 4.2 and 5 of our Terms.