Back to Journals » Journal of Hepatocellular Carcinoma » Volume 13
Aberrant Cholesterol Metabolism Caused by Decreased Lecithin: Cholesterol Acyltransferase Promoted Hepatocarcinogenesis
Authors Gao H, Peng X ![]() , Wen Y, Gou L, Xu Y, Qu X, Wu J, Xue B
, Wen Y, Gou L, Xu Y, Qu X, Wu J, Xue B
Received 24 August 2025
Accepted for publication 22 May 2026
Published 15 June 2026 Volume 2026:13 562838
DOI https://doi.org/10.2147/JHC.S562838
Checked for plagiarism Yes
Review by Single anonymous peer review
Peer reviewer comments 2
Editor who approved publication: Dr David Gerber
Hongliang Gao,1,2,* Xing Peng,3,* Yali Wen,1,* Liming Gou,1,* Yanchao Xu,4 Xuan Qu,1 Jing Wu,1 Bin Xue1,5– 7
1Translational Medicine Research Center, Children’s Hospital of Nanjing Medical University, Nanjing, 210000, People’s Republic of China; 2School of Basic Medicine, Wannan Medical College, Wuhu, 241002, People’s Republic of China; 3Core Laboratory, Department of Clinical Laboratory, Sir Run Run Hospital, Collaborative Innovation Center for Cancer Personalized Medicine, Nanjing Medical University, Nanjing, Jiangsu, People’s Republic of China; 4Division of Hepatobiliary and Transplantation Surgery, Department of General Surgery, Nanjing Drum Tower Hospital, The Affiliated Hospital of Nanjing University Medical School, Nanjing, 210008, People’s Republic of China; 5Department of General Surgery, The Affiliated Changzhou Second People’s Hospital of Nanjing Medical University, Changzhou, 213003, People’s Republic of China; 6NHC Key Laboratory of Antibody Technique, Nanjing Medical University, Nanjing, People’s Republic of China; 7Collaborative Innovation Center for Cancer Personalized Medicine, Nanjing Medical University, Nanjing, 211166, People’s Republic of China
*These authors contributed equally to this work
Bin Xue
Translational Medicine Research Center, Children’s Hospital of Nanjing Medical University, Nanjing, People’s Republic of China
, Email [email protected]
Jing Wu
Translational Medicine Research Center, Children’s Hospital of Nanjing Medical University, Nanjing, People’s Republic of China
, Email [email protected]
Background: Hepatocellular carcinoma (HCC), the most common primary liver cancer, exhibits metabolic reprogramming with disrupted cholesterol metabolism as a key feature. Lecithin-cholesterol acyltransferase (LCAT) contributes to HCC development, but its exact on cogenic mechanisms remain unclear. This study aims to investigate the role of LCAT in hepatocarcinogenesis and elucidate its underlying molecular mechanisms in HCC.
Methods: The Cancer Genome Atlas (TCGA), GEPIA, and Kaplan–Meier plotter databases were used to analyze LCAT expression and perform survival analysis and functional enrichment analysis. Clinical paired samples were collected to evaluate LCAT expression and observed changes in cholesterol metabolism levels Liver-specific Lcat knockout mice were constructed to investigate the hepatocarcinogenesis effect of LCAT. Loss-of-function studies were performed to confirm the molecular mechanism of LCAT in HCC. Finally, investigated the correlation between LCAT and immune infiltration.
Results: LCAT expression level was down-regulated in HCC patients and low LCAT level was associated with poor prognosis. International Cancer Genome Consortium (ICGC) data reveal dysregulated cholesterol metabolism in HCC, further validated by clinical evidence of metabolic aberrations in patients Besides, we constructed DEN induced HCC model using Alb-Cre; Lcatfl/fl mice and found that liver-specific Lcat knockout promoted cancerogenesis through ERK pathway. Meanwhile, knockdown of LCAT significantly promoted proliferation, migration, and invasion in Huh7 cell. Finally, immune infiltration analysis showed that LCAT was significantly related to immune infiltration, and LCAT expression was significantly associated with more than 10 immune checkpoint markers such as IL12A, VTCN1, BTLA, and TIGIT.
Conclusion: This study first explored the biological functions of LCAT in HCC based on in vitro and in vivo experiments. Our results indicate that LCAT deficiency correlates with aggressive HCC progression and immunosuppression, suggesting its potential as a prognostic biomarker. Given its role in modulating the HCC microenvironment, LCAT warrants further investigation as a predictive marker for immunotherapy response.
Keywords: LCAT, hepatocellular, carcinoma, proliferation, cholesterol metabolism, Lcat cKO mice, immunoinfiltration
Introduction
Hepatocellular carcinoma is a highly malignant tumor, ranking sixth in global cancer incidence and fourth in cancer-related mortality.1,2 It was reported that the estimated incidence of HCC is expected to rise to 1.4 million individuals in 2040.3 The prognosis for patients with HCC remains poor due to the high degree of malignancy, rapid growth and proliferation ability, and high metastasis rate.4 Only 20% of patients are eligible for curative surgery at presentation, and the remainder have limited therapeutic options.5 Although, with the development of cell molecular biology and immunology, immune therapy has become a novel treatment direction for HCC, only a small subset of patients responds to immunotherapy.6 Cholesterol metabolism reprogramming has recently emerged as a critical factor in HCC progression. Cholesterol, a key component of biological membranes and energy storage, plays dual roles in maintaining cellular homeostasis and shaping HCC pathogenesis.7,8 While its physiological functions are well-established, its impact on HCC remains debated. Clarifying cholesterol-linked mechanisms in HCC development could unlock novel therapeutic strategies.9 Thus, it is urgent to find novel and effective diagnostic markers for HCC and provide a theoretical basis for the later diagnosis, treatment, and prevention of HCC.
Lecithin-Cholesterol Acyltransferase (LCAT), a hepatocyte-derived factor primarily secreted by the liver, is an important enzyme involved in the maintenance of tissue and plasma cholesterol equilibrium via reverse cholesterol transport (RCT).10 In 1962, Glomset named LCAT after noticing a drop in lecithin and FC levels in human plasma and suggested that the acyltransferase reaction mediated by LCAT is the major source of the esterified cholesterol of the HDL.11 In normal physiological circumstances, LCAT mediates the synthesis of 70% cholesterol esters in plasma, which then results in the formation of mature HDL particles. In this way, the HDL particles transport cholesterol from peripheral tissues via LDL to the liver, and the excess cholesterol were then excreted by bile acid metabolism. Consequently, LCAT critically facilitates the maintenance of physiological homeostasis via RCT. Numerous studies have demonstrated that mutations in both alleles of LCAT gene lead to two syndromes namely, familial LCAT deficiency (FLD),12 and fish-eye disease (FED)13 which caused serious clinical symptoms including a decrease in HDL cholesterol level, Apolipoprotein A-I (apoA-I)apoA-I and apo A-II, a decrease in LDL cholesterol level and an increase in FC and Apo E.14 LCAT was proved to show a cardiovascular disease preventive effect during physiological states.15 Moreover, there is a recognized strong association of LCAT with many diseases such as parenchymal liver disease, central nervous system disease, reproductive system disease as well as malignant tumors.16,17
To date, some had been written in the literature regarding the association between LCAT and tumors.18–20 The plasma LCAT activity is dynamically altered as a serum secretory protein during tumorigenesis and the progression of various tumors. Hyoung-Min Park20 reported LCAT upregulation was observed in high-grade and lymph node-positive breast cancer through computational analysis, highlighting its possible role as a circulating biomarker. And in colorectal cancer (CRC), Marija Mihajlovica21 found that plasma LCAT activity was decreased in CRC patients. Also, Russell reported that combined biomarker panels (IGFBP2, LCAT, and CA125) provide increased diagnostic lead times for Type I and Type II ovarian cancer.22 Besides, the expression level of LCAT is down-regulated in hepatocellular carcinoma and could be utilized as a novel prognostic marker for survival prognostication in patients with HCC based on bioinformatic analysis.23 However, the specific mechanisms have not been fully elucidated.
This study initially characterized LCAT expression profiles in paired HCC clinical specimens, followed by in vitro functional investigations through LCAT knockdown models to delineate its mechanistic roles. Furthermore, we generated Alb-Cre; Lcatfl/fl (Lcat cKO) mice and probed the preliminary mechanism of LCAT knockout in DEN-induced HCC model. Since immune status is critical for the survival of HCC patients, the relationship between LCAT expression and immune cell infiltration immune checkpoints was also examined.
Materials and Methods
Expression and Survival Analyses of LCAT in HCC
We downloaded the uniformly normalized pan-cancer dataset from the UCSC (https://xenabrowser.net/) database including 371 TCGA HCC tumor tissues, and 50 TCGA paired normal tissues. We calculated the difference in expression between paired tumor and adjacent normal tissues as well as normal and tumor samples in indicated tumor types using R software (version 3.6.4). CCLE (https://sites.broadinstitute.org/ccle) was used to validate the expression levels in different cancer cell lines. Sangerbox 3.0 (http://vip.sangerbox.com/home.html) was used to perform the survival analyses and the association between the expression of LCAT and different pathologic states of HCC.
Functional Enrichment Analysis
We downloaded the dataset from the UCSC (https://xenabrowser.net/) which included 424 samples. We extracted the expression level of LCAT in tumor tissues and normal tissues based on the row count expression matrix and FPKM expression matrix of the TCGA-LIHC cohort. Correlation analysis was conducted between LCAT expression and related gene expression and then we performed GO and KEGG enrichment analysis based on the correlation analysis results.
Human Studies
Serum samples and 10 pairs of HCC tissues and adjacent tissues were obtained from Sir Run Run Hospital Affiliated with Nanjing University in Nanjing, China. All patients aged less than 45 years and no other anticancer treatment measures were performed before surgery, including radio chemotherapy, immunotherapy, and percutaneous ablation. Informed consent for the human study was provided by all participants, and study protocols were reviewed and approved by the Ethical Committee of Nanjing University, Ethics Audit No. (2024–1029-01).
Animals
Mice with the C57BL/6J background were used in this study. The Alb-Cre transgenic mice were purchased from the GemPharmatech (China). Mice were maintained on a 12-h/12-h light/dark cycle on a regular chow diet (Xietong Bio, XTI01ZJ-009,Nanjing, Jiangsu, China, containing ≥18% protein, ≥4% fat, ≤5% fiber, and ≤8% ash by weight, with no added cholesterol (<0.02%). All the mouse experiments were performed by the Guide for the Animal Care and Use Committee of the Model Animal Research Center of Nanjing Medical University.
Generation of Alb-Cre; Lcat Fl/Fl Mice
The Lcat-floxed (Lcatfl/fl) mouse line was generated by using CRISPR/Cas9 genome editing. The Alb-Cre mouse was back crossed to C57BL/6 wild type (WT) for at least six generations. Liver-specific Lcat knockout mice were generated by crossing Lcatfl/fl mice with Alb-Cre transgenic mice. To generate Lcat cKO mice, Lcatfl/fl were bred with Alb-Cre to obtain Alb-Cre; Lcatfl/+. The latter were then crossed to Lcatfl/fl to generate Alb-Cre; Lcatfl/fl (Lcat cKO) and Lcatfl/fl (control) mice.
Genotyping
The genotype of Lcat cKO mice was identified by PCR using genomic DNA from their tails. Briefly, crude genomic DNA was extracted from mouse tails using NaOH (50 mM) at 99 °C for 30 min. 1μL of the digested DNA was used as a template for a 20μL reaction mixture including specific primers as well as Taq Master Mix (P112-01, Vazyme Biotech., China). All PCR products were visualized by gel electrophoresis using 1.2% agarose with GelRed (TSJ003, Tsingke Biotech, China). The primer sequence used was as follows. For Lcatfl/fl, the forward primer was CAGCCAGAGATACCCAGCTATCC, and the reverse primer was GGCTCCATTCTTACTGTCCCAC. For Alb-Cre, the forward primer was GGGCAGTCTGGTACTTCCAAGCT, and the reverse primer was TAGCTACCTATGCGATCCAAACAAC.
DEN-Induced HCC Model
For DEN-induced mouse HCC, 10-day-old Lcatfl/f or Lcat cKO mice were intraperitoneally injected once with 50 mg/kg DEN (N0756, Sigmal-Aldrich,) and the mice were checked for the development of HCC by ultrasound regularly after feeding for 6 months.
Cell Culture
Huh7 cell was purchased at Shanghai cell bank of Chinese Academy of Sciences. The cells were cultured in DMEM medium (TD-JC001-YP500A, T&D Bio) with 10% fetal bovine serum (FBSSR-01021-500, Oricell) and 1% penicillin/streptomycin (15140122, Gibco) at 37 °C in a 5% CO2 incubator.
Cell Transfection and Knock-Down of Lcat
For cell transfection, Lcat-shRNA and scramble-shRNA plasmids (OBio, China) were transfected into Huh7 cells. Cells were transfected with 1 µg of each plasmid in six-well plates with Lipofectamine® 2000 (Thermo Fisher Scientific, Inc.) following the instructions. After 48 h of cell culture, the knockdown efficiency was examined by Western blot analysis.
Cell Proliferation Assays, Colony-forming Assays, Wound Healing Assays, Transwell Assay
The Cell Counting Kit-8 (CCK-8) assay was performed to assess the proliferative capacity after knockdown of Lcat. Briefly, a total of 3000 cells were seeded in each well of the 96-well plates. At 24, 48, and 72 h following transfection, 10 μL CCK-8 solution was added into each well and incubated for 1 h. Absorbance at 450 nm was measured after incubation at 37 °C for 4 h.
For wound healing migration assay, the transfected cells were seeded onto 6-well plates. When cells grew to 95%–100%, a 200 μL pipette tip was used to inflict a wound. After removing the debris, the cells were incubated in a serum-free medium for 24 h, 48 h, and 72 h. The images were taken under an inverted microscope (Olympus, Tokyo, Japan). For the migration assay, briefly, 200 μL serum-free medium containing 1×10⁴ transfected cells was plated in the upper compartment of the chamber (Corning, New York, NY, USA) and 500 μL culture medium containing 10% FBS was added to the lower chamber as a chemoattractant. After incubation at 37 °C for 24 h, the cells in the upper chamber were gently wiped off with cotton swabs, and the migrated cells were fixed with methanol and stained with 0.1% crystal violet. For the invasion assay, the transwell chamber was coated with matrigel (Bection Dickinson, U.S.) before the cells were plated in the chamber and the remaining steps are consistent with the migration assay. More than three fields were captured randomly under an inverted microscope (Olympus, Japan).
Quantitative Real-Time PCR (qRT‑PCR)
Total RNAs of HCC tissues and cells were isolated using an RNA-easy Isolation Reagent (R701-01, Vazyme, China). The concentration and purity of each DNA sample were evaluated spectrophotometrically. 1 μg of total RNA samples were mixed with the HiScript® II Q RT SuperMix (R223, Vazyme, China) for reverse transcription. cDNAs were diluted with DEPC water at 1:2. 1 μL sample and the ChamQ Universal SYBR qPCR Master Mix (Q711, Vazyme, China) were used for each qPCR experiment. Lcat expression levels were normalized to the β-actin gene using the 2−∆∆Ct method and the primers are as follows. For Lcat, the forward primer was ACCTGGTCAACAATGGCTACG, and the reverse primer was TAGAGCAAGTGTAGACAGCCG. For β-actin, the forward primer was CATGTACGTTGCTATCCAGGC, and the reverse primer was CTCCTTAATGTCACGCACGAT.
Western Blot
Liver tissues and cells were lysed with radio-immunoprecipitation assay (RIPA) (PC101, Epizyme Biotech, China) prior to BCA quantification (Thermo). 30 µg of total protein were loaded and separated with a 10% SDS-PAGE gel. Proteins in an electrophoresis gel were transferred to polyvinylidene fluoride membranes (Roche). After blocking with 5% skim milk, primary antibodies against LCAT (Boster, M00906, Dilution:1:1000), ERK1/2 (CST, 4695, Dilution:1:5000), p-ERK1/2 (CST, 4370, Dilution:1:1000) and β-actin (Bioworld, BS1002, Dilution:1:5000) were utilized to incubate the membranes throughout the night at 4 °C. Horseradish peroxidase (HRP)-conjugated secondary antibody were added the following day for 1 h at room temperature. After PBST washed 3 times ×10 min, ECL chemiluminescence was used for band development. ImageJ was used to quantify intensities for targeted protein bands.
Elisa
LCAT serum concentrations were measured according to the instructions of commercial sandwich enzyme immunoassay kits (SEJ516Hu, Cloud-clone Corp, China). Briefly, the serum samples and standards were diluted to 1:1000, and 100 μL was added to the microplate and incubated for 1 hour at 37 °C. After removing the contents, a biotinylated LCAT antibody was added and incubated for 1 hour at 37 °C. Thereafter, HRP-labeled avidin was added into the medium and incubated for 30 minutes at 37 °C. After thorough washing, the substrate TMB was added for color development. Absorbance was measured at 450 nm using spectrophotometry.
Histological Analysis
Liver samples were fixed in paraformaldehyde, embedded in paraffin, and cut into 6 µm sections. Sections were stained with hematoxylin and eosin (H&E) or Sirius red for morphometric analysis or fibrosis evaluation. Images for HE staining were captured using an Olympus microscope. Three images were selected for each mouse. At least three mice were used in each group.
Immunofluorescence
The cultured cells were fixed with 4% polyformaldehyde for 30 min after the cells were washed with PBS three times. Next, the cells were permeabilized for 30 min with 0.1% TritonX-100 and then washed with PBS three times. Then the cells were blocked with 5% goat serum at room temperature for 30 min and incubated with anti-Ki67 (Proteintech, 27309, Dilution:1:500) antibody in a humidified chamber overnight at 4 °C. The cells were washed with PBS 3 times, incubated with the corresponding fluorescence-labeled secondary antibody for 2 h, and stained with DAPI for 5 min at room temperature. Samples were photographed with an OLYMPUS Spin SR (Tokyo, Japan).
Immunohistochemistry (IHC)
Liver slices were dewaxed in xylene and rehydrated in decreasing concentrations of ethanol, washed with distilled water. Antigen retrieval was completed by microwaving the slides in citrate buffer (2 mM citrate acid, 0.01 M sodium citrate, pH 6.0) for 10 min and then incubated in 3% H2O2 for 15 min at room temperature to eliminate endogenous peroxidase activity. The slices were then blocked with goat serum albumin (BOSTER, USA) for 1 h at room temperature, and incubated overnight with a primary antibody specific for LCAT (Boster, M00906,Dilution:1:200),α-SMA (Proteintech, 14395-1-AP.
Dilution:1:3000), Ki67 (Proteintech, 27309,Dilution:1:5000) at 4 °C. The next day, following three times PBS washes, these slices were incubated with horseradish peroxidase (HRP)-conjugated secondary antibodies for 2 h at room temperature and rinsed with PBS. Finally, the slices were incubated with DAB chromogen and an Olympus VS200 slide scanner was used to obtain overview images.
Statistical Analysis
Statistical analysis was performed using GraphPad Prism 8.0 software (GraphPad Software, La Jolla, CA, USA). All data are presented as mean ± standard deviation (SD). Statistical significance was considered with p value less than 0.05.
Results
Aberrant Cholesterol Metabolism in HCC Patients
To further confirm this abnormal cholesterol metabolism in HCC patients. We collected the information on the biochemical parameters for blood samples pooled from 32 normal people and 642 HCC patients. ALT, AST, ALP and GGT levels were unsurprisingly increased in HCC patients (Figure 1A–D). Moreover, we also found total bilirubin level was increased (Figure 1E); however, direct bilirubin level (Figure 1F) and TG (Figure 1G) level were not change in HCC patients. While the total cholesterol level was decreased in HCC patients (Figure 1H). All the above results suggested that HCC patients showed an aberrant cholesterol metabolism and may correlate with HCC development. Cholesterol always plays an important role in cancer development. And HCC is strongly associated with abnormal cholesterol metabolism.24 Thus, we firstly investigated the expression of different cholesterol metabolism makers (cholesterol biosynthesis, HMGCR; cholesterol intake, LDLR and NPC1L1; cholesterol efflux, ABCA1, ABCG1, ABCG5 and ABCG8; cholesterol metabolism, CYP7A1) based on ICGC database. We found HMGCR expression was slightly increased in tumor tissues. LDLR, NPC1L1, ABCA1, ABCG5 and ABCG8 expressions were down-regulated in tumor tissues. Besides, an increased level of CYP7A1 was observed in tumor tissues (Figure 1I).
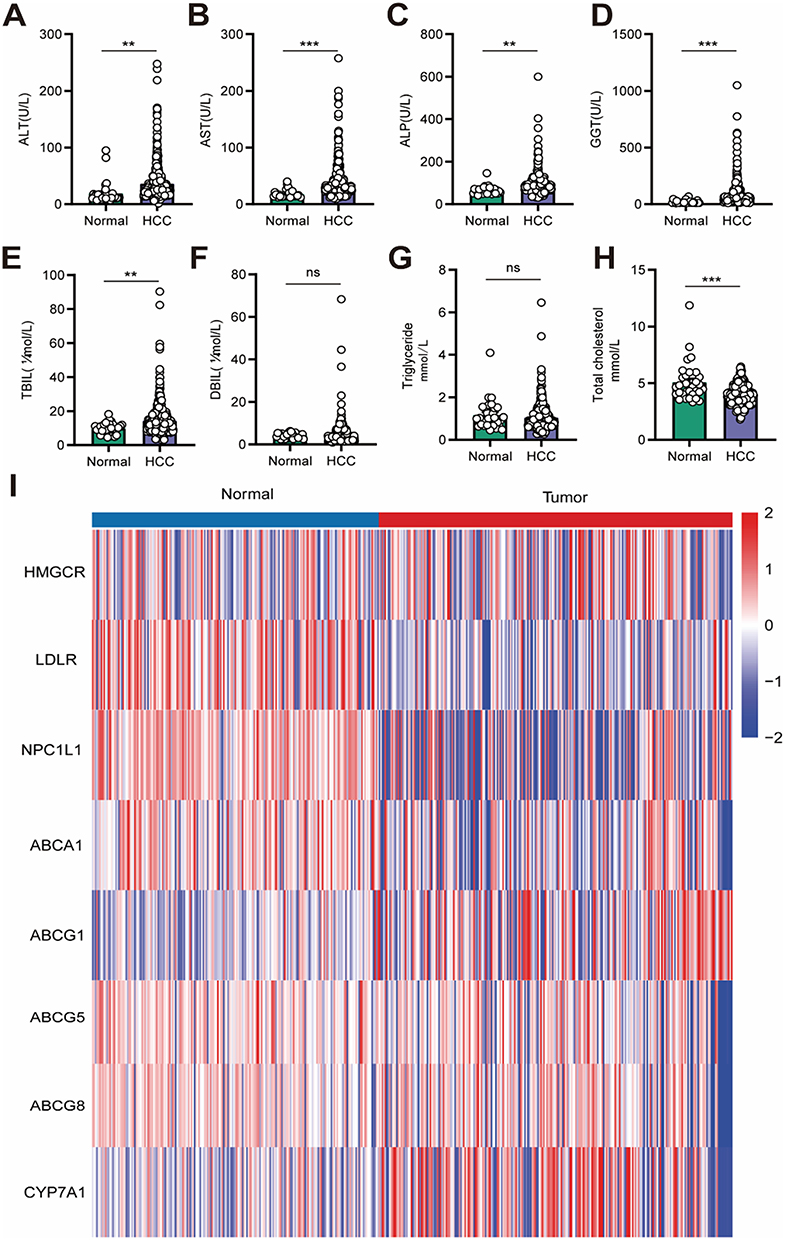 |
Figure 1 Abnormal cholesterol metabolism in HCC patients. (A) Serum ALT level in normal people (n=32) and HCC patients (n=642). (B) Serum AST level in normal people and HCC patients. (C) Serum ALP level in normal people and HCC patients. (D) Serum GGT level in normal people and HCC patients. (E) Serum TBIL level in normal people and HCC patients. (F) Serum DBIL level in normal people and HCC patients. (G) Serum TG level in normal people and HCC patients. (H) Serum TC level in normal people and HCC patients. (I) Expression of different cholesterol metabolism makers in normal and tumor tissues based on ICGC database analysis. ns: Not significant p ≥ 0.05,**P < 0.01, ***P < 0.001. |
LCAT Was Down-Regulated in HCC and Decreasing Levels of LCAT Predicted a Poor Prognosis in HCC Patients
We first investigated the pan-cancer expression patterns of LCAT based on the Cancer Genome Atlas (TCGA) and Genotype-Tissue Expression (GTEx) datasets. LCAT showed a decreased level in many malignant tumors including BRCA (Breast Cancer), CHOL (Cholangiocarcinoma), KICH (Kidney Chromophobe), LIHC (Liver hepatocellular carcinoma), LUAD (Lung adenocarcinoma), LUSC (Lung squamous cell carcinoma), PRAD (Prostate adenocarcinoma), THCA (Testicular Germ Cell Tumors), UCEC (Uterine Corpus Endometrial Carcinoma) (Figure 2A). LCAT also presented different expression levels in different cancer cell lines via the screening of expression data from the Cancer Cell Lineage Encyclopedia (CCLE) dataset (Figure 2B). Considering that LCAT is ubiquitously expressed and particularly abundant and secreted from the liver. We explored the expression profiles of LCAT in HCC by evaluating the 369 samples (Figure 2C) and the 50 paired tissues (Figure 2D) in the TCGA database and found that LCAT was significantly down-regulated in HCC. We next analyzed the expression of LCAT in different pathologic states (stage I, II, III and IV). LCAT expression was significantly decreased in stage II which indicated that LCAT may be involved in the early progression of HCC (Figure 2E). As shown in (Figure 2F and G) lower LCAT expression was correlated with poorer Overall survival (OS) and disease-specific survival (DSS) analyze by the Kaplan–Meier survival curve. Besides, a univariate analysis was performed and showed that LCAT expression, the M stage, the N stage, and race were associated with OS (Figure 2H). Those results indicated that LCAT may be an independent risk predictor for HCC. Functional enrichment analysis revealed that LCAT is significantly associated with chemical carcinogenesis, cytochrome P450-mediated drug metabolism, fatty acid degradation, and glycine, serine and threonine metabolism (Figure S1A). KEGG pathway analysis further demonstrated LCAT’s involvement in α-amino acid degradation, fatty acid β-oxidation, and monocarboxylic acid catabolic processes (Figure S1B). Intriguingly, additional evidence suggests that LCAT may contribute to HCC progression via immunomodulatory mechanisms, potentially facilitating tumor immune evasion (Figure S2).
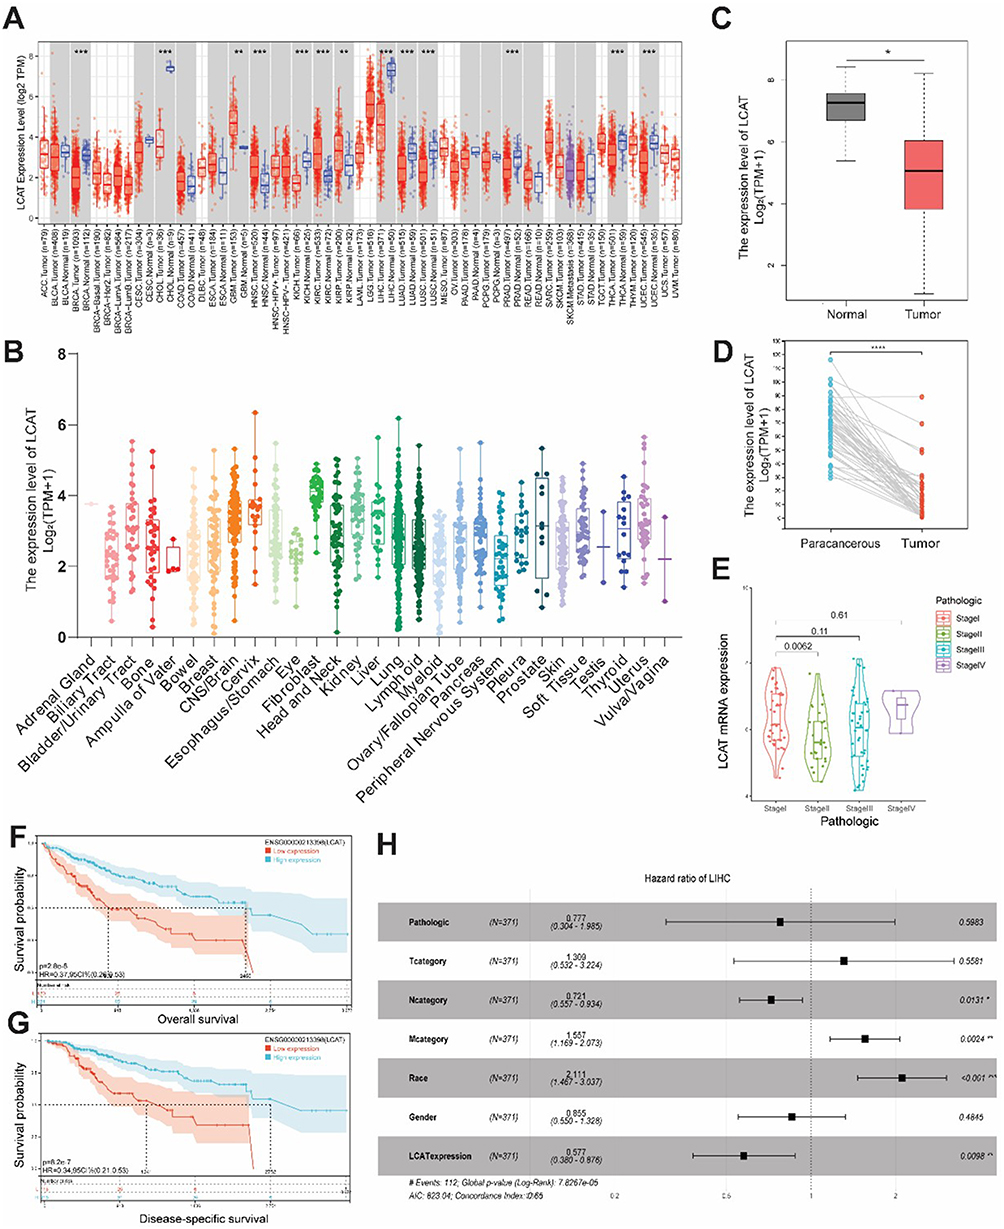 |
Figure 2 LCAT was down-regulated in HCC based on the TCGA database and predicted a poorer prognosis for HCC patients. (A) The expression of LCAT mRNA in pan-cancer using the TCGA tumor database. (B) The expression of LCAT in tumor cell lines, based on the CCLE database. (C) LCAT mRNA expression in 371 HCCs, and 160 adjacent normal tissues from the TCGA and GTEx databases. (D) LCAT mRNA expression in paired tumor and adjacent normal tissues of 50 patients with HCC in TCGA. (E) LCAT expression in different pathological stages. (F and G) Survival curves of OS and DSS between high and low LCAT expression subgroups in HCC. (H) Univariate Cox regression analysis of LCAT. *P < 0.05, **P < 0.01, ***P < 0.001,****P < 0.0001. |
LCAT Expression Was Associated with the Clinicopathologic Parameters
Based on the previous results of bioinformatics analysis, 10 paired tumors, and adjacent non-tumor liver tissues were finally collected for further detection of LCAT expression in practical samples. We found that LCAT expression level was significantly decreased both in protein and mRNA levels (Figure 3A–D). Research suggests where overexpression of oncogenic proteins like Vav1 correlates with poor prognosis. Meanwhile, the profileation, invasion and migration ability of HCC when knockdown PRDX6 and KIF5B.25–27 Our discovery of LCAT downregulation in tumor tissues suggests another layer of metabolic regulation in HCC pathogenesis. In this study, we also collected serum samples from 10 healthy individuals and assessed the changes in LCAT levels in comparison to those of HCC patients, as a secretory protein, LCAT was mainly synthesized in the liver. Consistent with our expectations, the serum LCAT expression showed a small but significant reduction (Figure 3E).
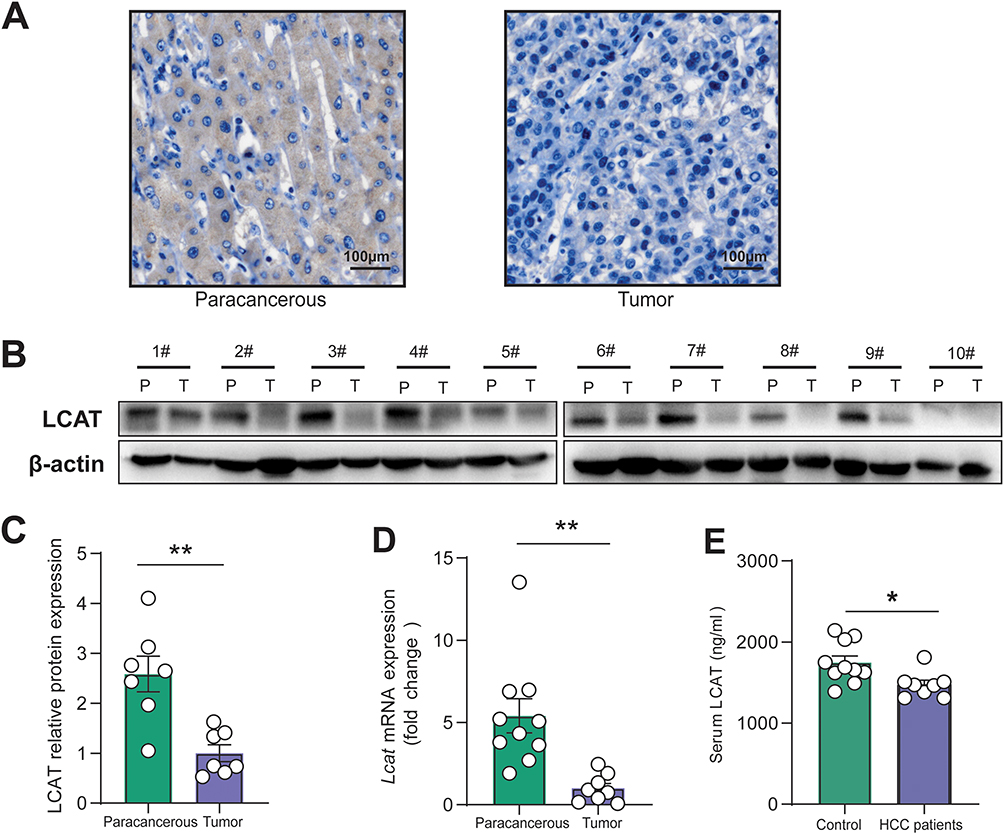 |
Figure 3 LCAT expression was down-regulated in clinical samples. (A) Immunohistochemical staining of LCAT levels was performed using cancer tissue and adjacent non-tumor tissue, and representative images are shown. (B) Representative immunoblots of LCAT expression in 10 cases of HCC and paired non-tumor tissues. (C) Representative quantification of Western blots (n = 7 in total) of LCAT expression in liver tissues. (D) qRT-PCR of relative Lcat mRNA levels of the paracancerous and tumor tissues, with the level in the tumor group arbitrarily set to 1. (E) Detection of serum LCAT expression level by ELISA. *P < 0.05, **P < 0.01,1#—10# Patient No.1-Patient No.10. |
Liver-Specific Lcat Knockout Mice Promoted DEN-Induced Carcinogenesis
To further evaluate the role of LCAT in HCC development, we successfully generated Liver-specific Lcat knockout mice by crossing Lcat-floxed mice with Alb-Cre transgenic mice. To construct the DEN-induced hepatocarcinogenesis model, a single intraperitoneal injection of DEN (20 μg/g body weight) was injected into Lcatfl/fl (Lcat cKO) and Lcatfl/fl (control) mice on day 10 after birth. All of the Lcat cKO and Lcatfl/fl mice mice developed liver tumors by 8 months of age and Lcat cKO mice developed more tumors (Figure 4A and B). We detected the expression level of LCAT both in tumor and adjacent tissues and found that LCAT was significantly decreased in tumor tissues (Figure 4C–E). This result was consistent with previous clinical observations. LCAT is an important enzyme involved in the maintenance of tissue and plasma cholesterol equilibrium. It removes the cholesterol from peripheral macrophage foam cells via HDL and then transports the CE to the liver, where it is utilized by hepatocytes for energy metabolism through RCT. Our previous work proved that LCAT could enhance the translocation of bone-derived cholesterol to the injured liver and alleviate liver impairment in mice with CCl4 treatment.28 α-SMA immunohistochemical staining and sirius red staining showed more severe fibrosis in the liver of Lcat cKO mice which indicated that decreased expression of LCAT in the liver renders the mice more susceptible to DEN-induced injury (Figure 4F). And further Ki67 immunohistochemistry revealed that the Lcat cKO tumors showed moderate levels of anti-Ki67 staining, whereas the levels of anti-Ki67 staining in the Lcatfl/fl tumors were diminished (Figure 4F). Numerous signaling pathways are involved in the occurrence and development of HCC, our results indicated that the p-ERK expression in adjacent tissues of Lcat cKO mice were significantly induced compared with the adjacent tissues of Lcatfl/fl mice. Further analysis showed that ERK phosphorylation status was further activated in tumor tissues of Lcat cKO mice (Figure 4G). In vitro experiments using Huh7 cells demonstrated that knockdown of LCAT expression by siRNA resulted in a marked increase in phosphorylated ERK protein levels, a finding consistent with observations made at the animal level. Importantly, this effect was effectively reversed upon treatment with recombinant LCAT protein (Figure S3D–E). Furthermore, in Huh7 cells transfected with shRNA targeting Lcat (sh-Lcat), application of the ERK inhibitor SCH772984 (at a concentration of 20 μM) significantly attenuated the sh-Lcat-induced proliferative response, as assessed by the CCK-8 assay (Figure S3F–G). Taken together, these data suggested that LCAT deficiency exacerbated DEN-induced liver damage and promoted HCC progression by activating the ERK signaling pathways.
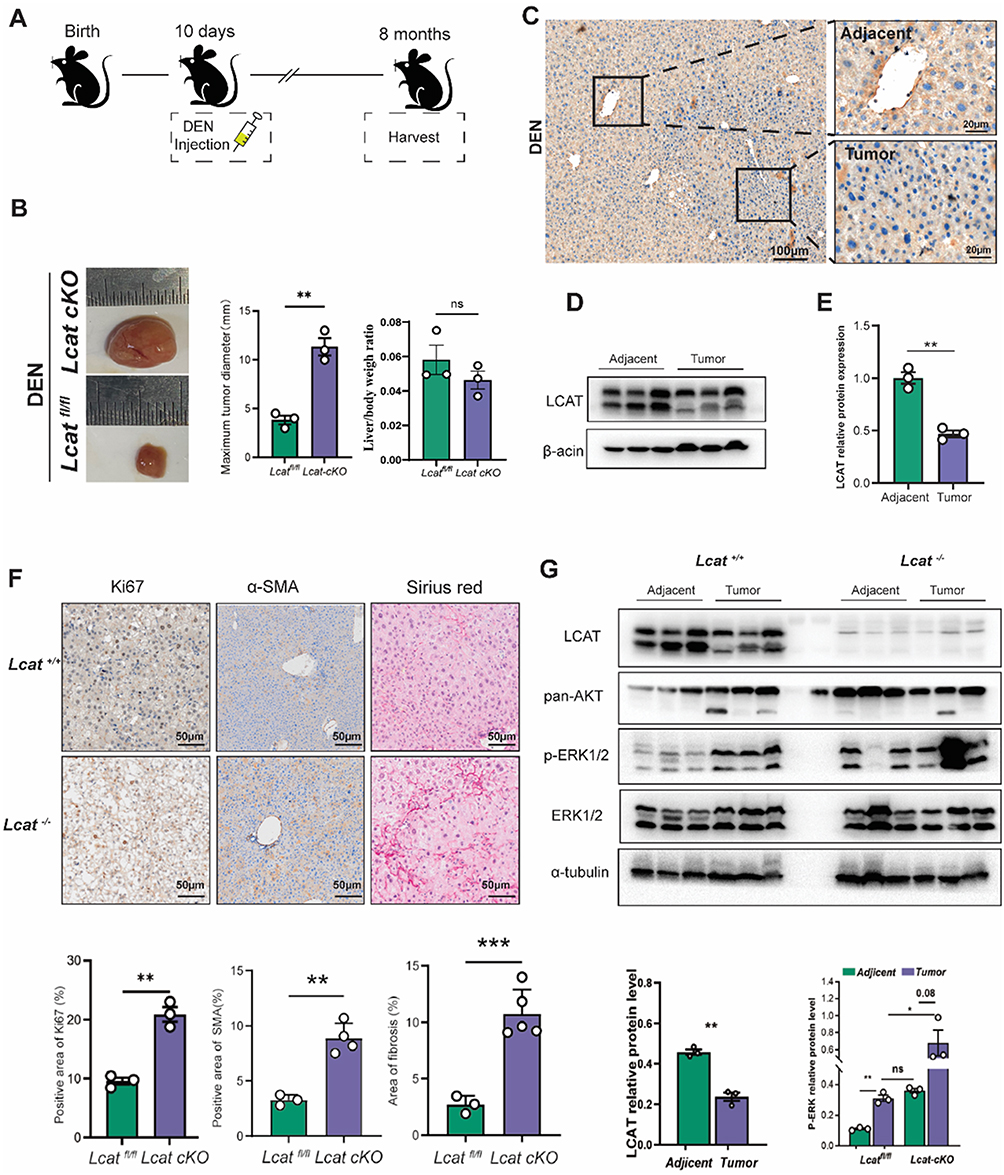 |
Figure 4 Knockout of Lcat promote tumor proliferation via activating ERK pathway. (A) Schematic diagram of HCC model construction. (B) Representative images and maximum tumor diameter of liver cancer tumors in Lcatfl/fl and Lcat cKO mice induced by DEN in HCC. (C) Immunohistochemical staining of LCAT levels was performed using cancer tissue and adjacent non-tumor tissue, and representative images are shown. (D and E) Representative immunoblotting and quantitative analysis of LCAT expression in adjacent non-tumor tissues and tumor tissues of Lcatfl/fl mice. (F) The representative pictures of Ki 67 IHC staining, α-SMA IHC staining, and sirius red staining. (G) Representative immunoblots of LCAT expression, ERK expression, p-ERK expression, and ERK expression in adjacent non-tumor tissue and tumor tissues in Lcatfl/fl mice and Lcat cKO mice. ns: Not significant, *P < 0.05,**P < 0.01, ***P < 0.001. |
Liver-Specific Lcat Silencing Induced Cholesterol Imbalance
In order to explore the effect of LCAT gene knockout on cholesterol levels, we first examined the serum and liver total cholesterol levels of Lcat knockout mice. We found that total intrahepatic cholesterol was unchanged after liver-specific LCAT knockdown, but increased after DEN injection-induced liver injury, consistent with active cholesterol metabolism in malignant tumours (Figure 5A). Blood cholesterol decreased after DEN-induced liver injury, which means that the synthesis of cholesterol in the liver decreased after liver injury (Figure 5B). Cholesterol metabolism is a complex process, including de novo hepatic synthesis of cholesterol, dietary cholesterol uptake, and excretion through bile and free cholesterol. HMGCR serves as the key enzyme in regulating cholesterol synthesis in the liver by controlling the de novo production of cholesterol from acetyl-CoA. SREBP2 acts as a regulatory factor for genes involved in cholesterol synthesis. Our research indicates that following liver damage caused by DEN, there is a decrease in cholesterol synthesis (Figure 5C and D). LDLR is the receptor for low-density lipoprotein and is responsible for the uptake of low-density lipoprotein in the blood by the liver, while NPC1L1 is a key factor in the uptake of dietary cholesterol from intestinal epithelial cells. We found that after DEN damages the liver, the body takes up cholesterol from food. The potential is reduced, but the ability to absorb cholesterol in the blood is increased (Figure 5E and F). In mice, ABCG1 and ABCA1 are regulatory factors that secrete cholesterol from the liver into the blood and promote the production of high-density lipoprotein, while ABCG5 and ABCG8 directly promote the efflux of cholesterol into the bile. Our results indicate that after DEN damages the liver and liver cholesterol, the flow of high-density lipoproteins into the blood increases, and the elimination of cholesterol from the body through bile acids also increases. (Figure 5G–J). Since we found that cholesterol has an increased potential to be excreted from the body through bile acid metabolism, and CYP7A1 and FXR are key factors that control bile synthesis and secretion, we found that after DEN injury, bile synthesis increases, and the potential for more cholesterol to be excreted from the body increases (Figure 5K and L). In summary, we found that DEN damages the liver and causes cholesterol metabolism disorders, which will promote the development of HCC.
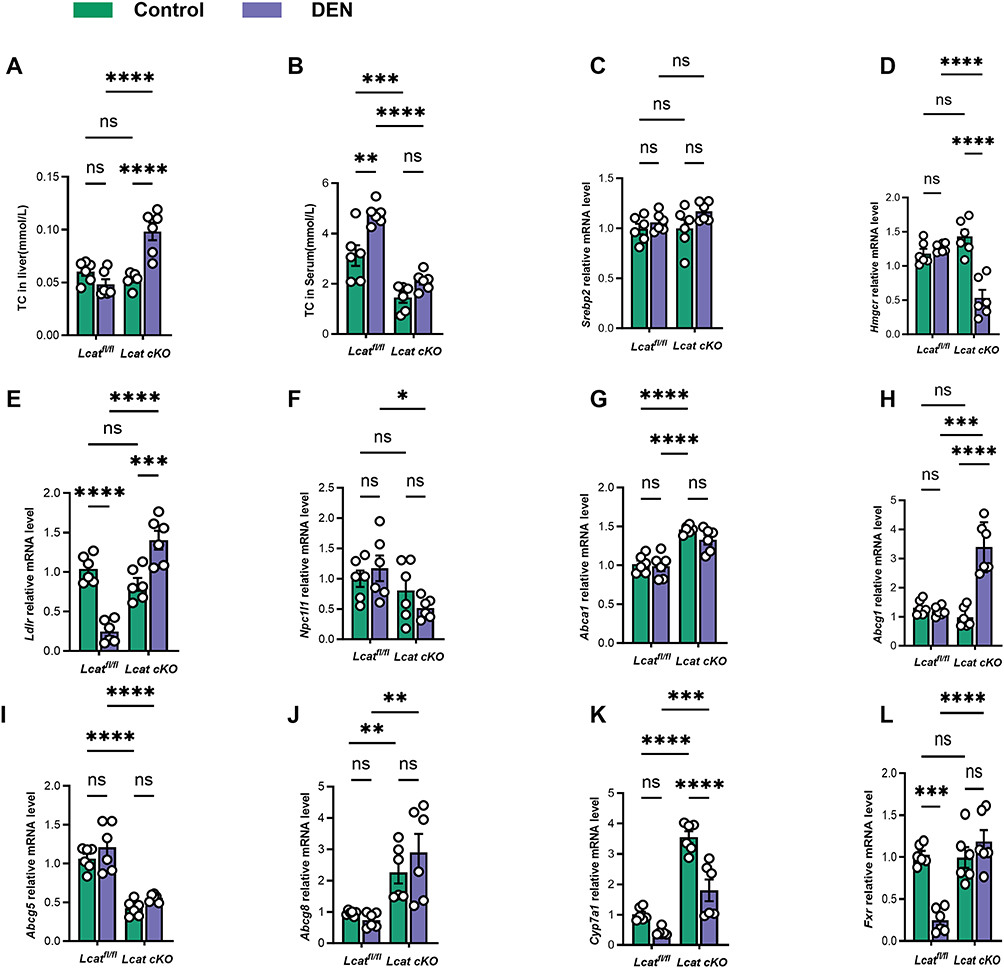 |
Figure 5 The downregulation of LCAT facilitates the dysregulation of cholesterol metabolism in hepatocellular carcinoma. (A and B) Total cholesterol levels in mice. (C and D) The mRNA levels of the cholesterol synthesis factors Hmgcr1 and Srebp2 were detected by qRT-PCR. (E and F) The mRNA levels of the cholesterol synthesis factors Ldlr and Npc1l1 were detected by qRT-PCR. (G–J) The mRNA levels of cholesterol efflux factors Abca1, Abcg1, Abcg5 and Abcg8 were measured using qRT-PCR. (K and L) qRT-PCR The mRNA levels of cholesterol and bile acid metabolism factors Cyp7a1 and Fxr were detected by qRT-PCR. ns: Not significant,*P < 0.05, **P < 0.01, ***P < 0.001.****P < 0.0001. |
LCAT Deficiency Promoted Proliferation and Migration in Huh7 Cell Line
To further investigate the functionality of LCAT in the proliferation, migration, and invasion of hepatoma cells, we first evaluated LCAT protein expression levels in various cell lines and found that Huh 7, HepG2, and Hep3B showed a low expression level compared to normal LO2 cells and in particular, Huh7 cells showed the highest level of LCAT expression (Figure 6A and B). Then, Huh7 cells were transfected with sh-Lcat as described previously and knockdown was confirmed by immunoblotting (Figure 6C and D). CCK8 assay showed that the downregulation of LCAT promoted cell proliferation (Figure 6E). This result was also confirmed by immunofluorescence microscopy which was presented by the increased Ki67-positive cells after LCAT knockdown (Figure 6F and G). Moreover, we also detected colony forming ability of different numbers of LCAT knockdown cells (500,1000, and 1500 per well) by plate clone formation assay in vitro. The results showed that the number of clone formation of Huh7 cells increased after knockdown of LCAT (Figure 6H). Besides, we examined the effects of LCAT on the invasion and migration of Huh7 cells. Transwell migration and invasion assays demonstrated that knockdown of LCAT in Huh7 can remarkably promote its migration and invasion ability (Figure 6I–K). In parallel, wound healing assay indicated that LCAT knockdown promoted the wound closure speed of Huh7 cells (Figure 6L and M). We further validated our findings in the MHCC-97L cell line (Figure S3A–C).
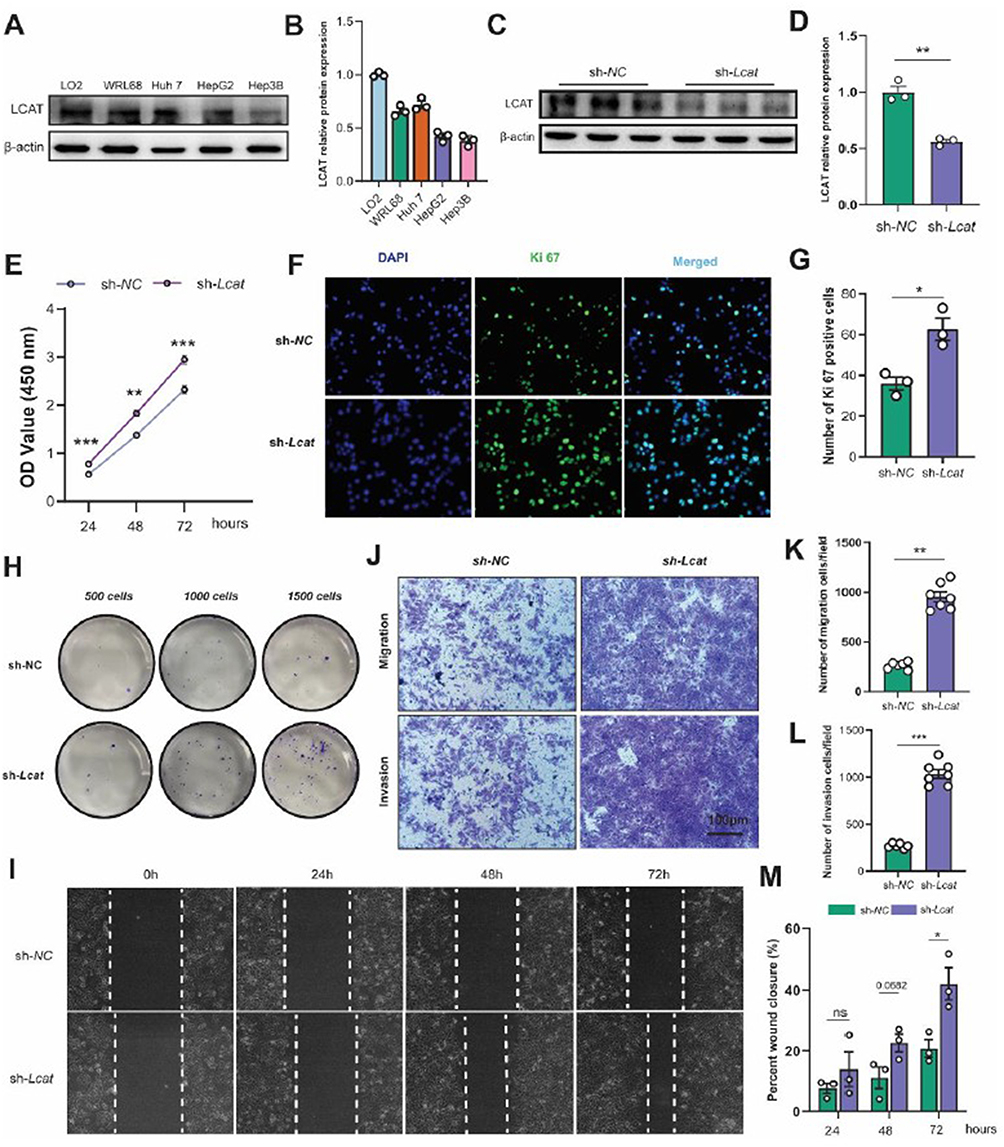 |
Figure 6 LCAT deficiency promoted Huh7 cell proliferation and migration in vitro. (A and B) LCAT protein expression levels in various cell lines (LO2, WRL68, Huh7 HepG2, and Hep3B) and quantitative analysis. (C and D) The knockdown efficiency of LCAT in Huh7 was assessed by WB and quantitative analysis. (E) Huh7 cell proliferation after knockdown of LCAT was examined by CCK8 assay. (F and G) Ki67 immunostaining and quantification of Ki67 positive cells. (H) The clone formations of the indicated group were determined by plate clone assay. (I and M) Representative images of wound healing assay after knockdown of LCAT (0 h, 24 h, 48 h, 72 h) and quantitative analysis. (J–L) Representative images of Transwell migration assay and Transwell invasion assay and quantitative analysis. ns: Not significant,*P < 0.05, **P < 0.01, ***P < 0.001. |
LCAT Inhibited Huh7 Proliferation in vitro
In order to verify the inhibitory effect of LCAT on Huh7 proliferation, we established the tumor spheroidization model for further investigation. Decreased LCAT-level HCC patients might lead to tumor deterioration.29 Therefore, we considered whether hepatogenic factor LCAT could inhibit the development of HCC, and tested whether LCAT had an effect on the proliferation of tumor spheres by Huh7 cell tumor pellet formation assay. (Figure 7A). We used the tumor sphere volume as the evaluation of tumor size. ImageJ software was used to measure the longest side as length a, the side perpendicular to a as width b, and the sphere volume as S, S=(a*b)2/2. By comparing the tumor volume at the same time point, we found that the tumor sphere volume treated with LCAT recombinant protein was significantly smaller than that of the control group on the eighth day (Figure 7B). Our results show that when we treat Huh7 cell tumor spheres with LCAT recombinant protein, the growth rate of tumor sphere volume is inhibited. Certainly, the results of tumor spheroid formation experiments seem to indicate that LCAT is promising as a therapeutic target for HCC and as one of the new markers of poor prognosis. But in vivo therapeutic studies, either gene therapy or protein delivery is needed before considering clinical translation.
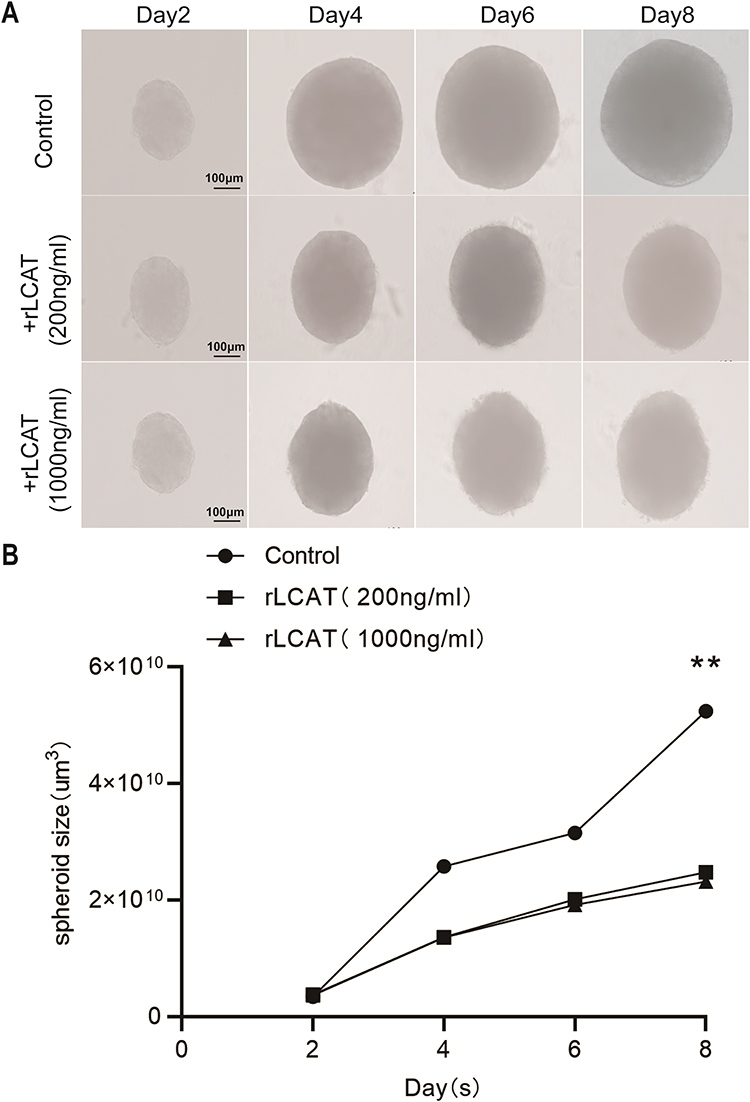 |
Figure 7 In vitro addition of recombinant LCAT protein inhabited the growth of Huh7 tumor cell spheroid. (A) The tumor spheres of Huh7 cells were treated with recombinant LCAT protein and the volume of tumor spheres was detected at (2D, 4D, 6D, 8D). (B) Statistical analysis of tumor spheroid volume at different time points, Volume statistical formula:S=(a*b)2/2, the longest diameter a represents the length, b perpendicular to a represents width, S stands for size, **P < 0.01. |
Discussion
HCC is the major pathological type of liver cancer, one of the most devastating tumors worldwide.30 Although molecular targeted therapies have emerged as promising treatments by selectively kills tumor cells with minimal harm to normal tissues, offering safety and fewer side effects,31,32 the clinical management of HCC continues to face significant challenges. Late diagnosis and poor prognosis are hallmarks of this disease, driven by its complex pathogenesis involving dysregulated tumor metabolism, immunosuppressive microenvironment, and aberrant signaling pathways.33–35 An increasing number of studies regard cholesterol metabolic reprogramming as a critical component in the progression of HCC.36,37 Specifically, tumor cells exploit cholesterol homeostasis pathways to sustain proliferation, membrane integrity, and signal transduction, making cholesterol metabolism an attractive therapeutic target. Our retrospective study of 642 HCC patients and 32 healthy controls revealed significant cholesterol metabolism dysregulation in HCC. Within this metabolic landscape, hepatokines have garnered attention for their roles in modulating HCC progression and prognosis.38,39 LCAT is abundantly expressed in the liver and also expressed in small amounts in astrocytes in the brain as well as in the testes.40 As an important hepatokine, LCAT catalyzed the cholesterol esterification and promoted cholesterol efflux from macrophages, which is a critical step in RCT.41 Additionally, Xiuzhi Zhang et al42 reported significantly reduced LCAT activity in the serum of HCC patients. Given this, the association between LCAT and liver diseases could not be ignored. In this study, we systematically described the presentation and prognosis of LCAT in HCC and found that LCAT can regulate HCC proliferation both in vivo and in vitro. These findings suggest that LCAT may contribute to the regulation of HCC progression via the modulation of cholesterol metabolism.
During the RCT process, the HDL particles transport cholesterol from peripheral tissues via LDL to the liver, and the excess cholesterol were then excreted by bile acid metabolism.43 Therefore, given the nonnegligible role of LCAT in modulating cholesterol metabolism, scientists should consider the relationship between LCAT and liver disease. In early studies, plasma LCAT activity tended to be decreased in parenchymal liver disease.44 Moreover, LCAT has also been identified as a potential biomarker for breast cancer and colorectal cancer.18,20 However, few studies elucidated the exact mechanism of LCAT in HCC, although studies had shown that LCAT was downregulated in HCC based on the previous bioinformatics analysis.
Through further analysis of the TCGA database, we identified the clinical significance of down-regulating LCAT among 9 tumor types.45 Considering that LCAT was secreted primarily by the liver, we focused on its relationship with the prognosis in HCC and found lower LCAT level was significantly associated with survival in HCC patients. To verify the bioinformatics analysis results, we used clinical paired samples to verify the analysis results. In addition to decreased LCAT level in tumor tissue, serum LCAT level was also reduced in HCC patients. Lower serum levels of LCAT are associated with an increased risk of hepatocellular carcinoma incidence. Hepatic factor LCAT shows considerable promise for early prediction of HCC and is expected to become a novel serum biomarker for early screening of HCC. Abnormal metabolism always occurs in HCC tissues such as lipid metabolism disorders, glucose metabolism disorders, inflammatory infiltrate, and hypoxic conditions.46 Therefore, further researches are still necessary to study the detailed mechanism of reduced level of LCAT in HCC.
LCAT abounds in the liver. Thus, we generated liver-specific Lcat knockout mice rather than systemic Lcat depletion. Through the construction of DEN induced HCC model, we further investigated the role of LCAT in vivo. Unsurprisingly, all Lcatfl/fl mice and Lcat cKO mice developed HCC after 8 months. Moreover, Lcat deficiency promoted tumor growth in the HCC model. LCAT level was down-regulated in tumor tissues, which were consistent with clinical results. LCAT is responsible for the essential step of RCT and mediated cholesterol metabolism. In the study by Zan Huang et al, LCAT-induced enhancement of HDL-C uptake was shown to impair the maturation of SREBP2, a key regulator of cholesterol synthesis, thereby reducing endogenous cholesterol biosynthesis and suppressing HCC cell proliferation. Treatment with HDL-C alone inhibited HCC growth, with an efficacy comparable to that of the cholesterol-lowering drug lovastatin; moreover, overexpression of SREBF2 counteracted the inhibitory activity of LCAT.44,47 Our recent study revealed for the first that LCAT could augment the osteoblast activity and inhibit the osteoclast by regulating cholesterol metabolism.28 Exogenous supplementation with LCAT also relieves liver fibrosis and increases BMD in the mouse hepatic osteodystrophy model by promoting the reversal of cholesterol transport from the bone to the liver via the liver-bone axis. It is worth noting that liver tissues are more likely to be injured after Lcat knockout. This serves to highlight the role of LCAT in the protection of liver injury. It was reported that LCAT was negatively correlated with the fibrosis area, which suggests that LCAT could be exploited as a specific biomarker for detecting liver fibrosis.48 Indeed, as an essential component in mammalian membranes, cholesterol is known to be involved in the facilitating repair of the injured cell membrane.49 Hence, we speculated that knockout of LCAT limited the transportation of cholesterol to the liver and led the liver more susceptible to a multitude of injuries.
Activation of several signaling pathways has been implicated in human hepatocarcinogenesis.50 In this study, we found that the deficiency of LCAT not only exacerbates liver cancer but also activates the ERK signaling pathway. In addition to directly regulating these pathways, our results showed that LCAT is also involved in multiple biological processes including fatty acid β oxidation, and α-amino acid catabolic process. Therefore, targeting certain metabolism processes induced by LCAT may provide a novel therapeutic strategy for HCC treatment.51
The tumor microenvironment (TME) contains various cells including a large proportion of infiltrating immune cells. The infiltration of immune cells in the TME is a critical component of antitumor immune responses.52,53 Recent studies revealed that intratumoral T cells exhibit cholesterol depletion and low cholesterol levels inhibit T cell proliferation and cause autophagy-mediated apoptosis, particularly for cytotoxic T cells.54,55 Based on TIMER2, we found LCAT level showed a close correlation to infiltrations of immune cells. Besides, LCAT was negatively correlated with immunosuppressive cells including regulatory T cells (Tregs), M2 macrophages, and myeloid-derived suppressor cells (MDSCs). Thus, LCAT may promote the progression of HCC by influencing immune suppressive cells by mediating liver cholesterol content.
Limitation
Although our research provided multi-level evidence for the importance of LCAT in the development and progression of HCC, the main limitation of our study still existed. A larger number of clinical samples should be included in further investigations as well as the individual serum lipid profile. More experiments should be performed to validate the regulation of immunosuppressive cells by LCAT.
Conclusion
In conclusion, our results demonstrate that LCAT serves as a promising biomarker for prognosis assessment, clinical treatment optimization, and immunotherapy response prediction in HCC, highlighting the critical role of cholesterol homeostasis and modulate immune cell infiltration.
Data Sharing Statement
The datasets generated for this analysis are available from the corresponding author Bin Xue upon reasonable request.
Ethics Statement
The study was conducted in accordance with the local legislation and institutional requirements. All procedures performed in this study were in accordance with the ethical standards of the institutional and/or national research committees and with the 1964 Helsinki Declaration and its later amendments or comparable ethical standards. This study protocol was reviewed and approved by the Ethics Committees of: Ethical Committee of Nanjing University, Ethics Audit No. (2024-1029-01). All animal experiments were approved by the Institutional Animal Care and Use Committee of Nanjing Medical University (Approval No. IACUC-2310046) and conducted in accordance with the National Research Council’s Guide for the Care and Use of Laboratory Animals (8th edition, 2011). Following the NIH Guide for the Care and Use of Laboratory Animals.
Acknowledgments
We greatly appreciate all the authors for their endeavors.
Author Contributions
All authors made a significant contribution to the work reported, whether that is in the conception, study design, execution, acquisition of data, analysis and interpretation, or in all these areas; took part in drafting, revising or critically reviewing the article; gave final approval of the version to be published; have agreed on the journal to which the article has been submitted; and agreed to be accountable for all aspects of the work.
Funding
This work was supported by the Chinese National Science Foundation (grant 32271187, 32300646 & 32571329); Noncommunicable Chronic Diseases-National Science and Technology Major Project (grant 2024ZD0521200 & 2024ZD0521206); the Ministry of Science and Technology of China (MOST; grant 2024YFA1107700 & 2024YFA1107704); the Nature Science Foundation of Jiangsu Province (grant BK20230300); Natural Science Foundation of Xinjiang Uygur Autonomous Region (grant 2023D01D05); Medical research project of Jiangsu Provincial Health Commission (H2023103); Anhui Provincial Key Laboratory of Active Biomacromolecules Autonomous Research Project of Wannan Medical College (NO. LAB202401); High-level Talent Scientific Research Start up Foundation of Wannan Medical College (WYRCQD2025016); Science Youth Research Project of the Education Department of Anhui Province (2025AHGXZK40721).
Disclosure
The authors report no conflicts of interest in this work.
References
1. Bray F, Ferlay J, Soerjomataram I, et al. Global cancer statistics 2018: GLOBOCAN estimates of incidence and mortality worldwide for 36 cancers in 185 countries. CA Cancer J Clin. 2018;68(6):394–18. doi:10.3322/caac.21492
2. Chen H, Li Z, Wu F, et al. BCL10 correlates with bad prognosis and immune infiltration of tumor microenvironment in hepatocellular carcinoma. IUBMB Life. 2023;75(3):207–224. doi:10.1002/iub.2581
3. Sung H, Ferlay J, Siegel RL, et al. Global Cancer Statistics 2020: GLOBOCAN estimates of incidence and mortality worldwide for 36 cancers in 185 countries. CA Cancer J Clin. 2021;71(3):209–249. doi:10.3322/caac.21660
4. Younossi ZM, Koenig AB, Abdelatif D, et al. Global epidemiology of nonalcoholic fatty liver disease-meta-analytic assessment of prevalence, incidence, and outcomes. Hepatology. 2016;64(1):73–84. doi:10.1002/hep.28431
5. Foerster F, Gairing SJ, Ilyas SI, et al. Emerging immunotherapy for HCC: a guide for hepatologists. Hepatology. 2022;75(6):1604–1626. doi:10.1002/hep.32447
6. Shen W, Chen Y, Lei P, et al. Immunotherapeutic approaches for treating hepatocellular carcinoma. Cancers. 2022;14(20). doi:10.3390/cancers14205013
7. Maus M, Cuk M, Patel B, et al. Store-Operated Ca(2+) entry controls induction of lipolysis and the transcriptional reprogramming to lipid metabolism. Cell Metab. 2017;25(3):698–712. doi:10.1016/j.cmet.2016.12.021
8. Ray K. NAFLD-HCC: target cholesterol. Nat Rev Gastroenterol Hepatol. 2018;15(7):390. doi:10.1038/s41575-018-0029-2
9. Tang L, Wei R, Chen R, et al. Establishment and validation of a cholesterol metabolism-related prognostic signature for hepatocellular carcinoma. Comput Struct Biotechnol J. 2022;20:4402–4414. doi:10.1016/j.csbj.2022.07.030
10. Ossoli A, Simonelli S, Vitali C, et al. Role of LCAT in atherosclerosis. J Atheroscler Thromb. 2016;23(2):119–127. doi:10.5551/jat.32854
11. Glomset JA, Norum KR, King W. Plasma lipoproteins in familial lecithin: cholesterol acyltransferase deficiency: lipid composition and reactivity in vitro. J Clin Invest. 1970;49(10):1827–1837. doi:10.1172/jci106400
12. Vitali C, Bajaj A, Nguyen C, et al. A systematic review of the natural history and biomarkers of primary lecithin:cholesterol acyltransferase deficiency. J Lipid Res. 2022;63(3):100169. doi:10.1016/j.jlr.2022.100169
13. Vitali C, Rader DJ, Cuchel M. Novel therapeutic opportunities for familial lecithin:cholesterol acyltransferase deficiency: promises and challenges. Curr Opin Lipidol. 2023;34(2):35–43. doi:10.1097/mol.0000000000000864
14. Kuroda M, Bujo H, Yokote K, et al. Current status of familial LCAT deficiency in Japan. J Atheroscler Thromb. 2021;28(7):679–691. doi:10.5551/jat.RV17051
15. Sasaki M, Delawary M, Sakurai H, et al. Novel LCAT (Lecithin:cholesterol acyltransferase) activator DS-8190a prevents the progression of plaque accumulation in atherosclerosis models. Arterioscler Thromb Vasc Biol. 2021;41(1):360–376. doi:10.1161/atvbaha.120.314516
16. Gao M, Zhang W, Li X, et al. LCAT in cancer biology: embracing epigenetic regulation, immune interactions, and therapeutic implications. Int J Mol Sci. 2025;26(4). doi:10.3390/ijms26041453
17. Sugasini D, Yang P, Ng D, et al. Potential role of hepatic lipase in the accretion of docosahexaenoic acid (DHA) by the brain. Biochim Biophys Acta Mol Cell Biol Lipids. 2021;1866(10):159002. doi:10.1016/j.bbalip.2021.159002
18. Wang Y, Yang Z, Li Z, et al. Proteomics-driven discovery of LCAT as a novel biomarker for liver metastasis in colorectal cancer. BMC Cancer. 2025;25(1):480. doi:10.1186/s12885-025-13882-x
19. Mazzuferi G, Bacchetti T, Islam MO, et al. High density lipoproteins and oxidative stress in breast cancer. Lipids Health Dis. 2021;20(1):143. doi:10.1186/s12944-021-01562-1
20. Park HM, Kim H, Kim DW, et al. Common plasma protein marker LCAT in aggressive human breast cancer and canine mammary tumor. BMB Rep. 2020;53(12):664–669. doi:10.5483/BMBRep.2020.53.12.238
21. Mihajlovic M, Gojkovic T, Vladimirov S, et al. Changes in lecithin: cholesterol acyltransferase, cholesteryl ester transfer protein and paraoxonase-1 activities in patients with colorectal cancer. Clin Biochem. 2019;63:32–38. doi:10.1016/j.clinbiochem.2018.11.010
22. Russell MR, Graham C, D’Amato A, et al. Diagnosis of epithelial ovarian cancer using a combined protein biomarker panel. Br J Cancer. 2019;121(6):483–489. doi:10.1038/s41416-019-0544-0
23. Zheng S, Su Z, He Y, et al. Novel prognostic signature for hepatocellular carcinoma using a comprehensive machine learning framework to predict prognosis and guide treatment. Front Immunol. 2024;15(1454977). doi:10.3389/fimmu.2024.1454977
24. Du D, Liu C, Qin M, et al. Metabolic dysregulation and emerging therapeutical targets for hepatocellular carcinoma. Acta Pharm Sin B. 2022;12(2):558–580. doi:10.1016/j.apsb.2021.09.019
25. Ye W, Wang J, Zheng J, et al. Association between higher expression of Vav1 in hepatocellular carcinoma and unfavourable clinicopathological features and prognosis. Protein Pept Lett. 2024;31(9):706–713. doi:10.2174/0109298665330781240830042601
26. Qi L, Tan Y, Zhou Y, et al. Proteogenomic identification and analysis of KIF5B as a prognostic signature for hepatocellular carcinoma. Curr Gene Ther. 2025;25(4):532–545. doi:10.2174/0115665232308821240826075513
27. Gudivada IP, Amajala KC. Integrative bioinformatics analysis for targeting hub genes in hepatocellular carcinoma treatment. Curr Genomics. 2025;26(1):48–80. doi:10.2174/0113892029308243240709073945
28. Lu K, Shi TS, Shen SY, et al. Defects in a liver-bone axis contribute to hepatic osteodystrophy disease progression. Cell Metab. 2022;34(3):441–457.e447. doi:10.1016/j.cmet.2022.02.006
29. Li Y, Jiang LN, Zhao BK, et al. Lecithin-cholesterol acyltransferase is a potential tumor suppressor and predictive marker for hepatocellular carcinoma metastasis. World J Gastrointest Oncol. 2024;16(8):3651–3671.
30. Ding SY, Wang MT, Dai DF, et al. Salidroside induces apoptosis and triggers endoplasmic reticulum stress in human hepatocellular carcinoma. Biochem Biophys Res Commun. 2020;527(4):1057–1063. doi:10.1016/j.bbrc.2020.05.066
31. Zhu HD, Li HL, Huang MS, et al. Transarterial chemoembolization with PD-(L)1 inhibitors plus molecular targeted therapies for hepatocellular carcinoma (CHANCE001). Signal Transduct Target Ther. 2023;8(1):58. doi:10.1038/s41392-022-01235-0
32. Limousin W, Laurent-Puig P, Ziol M, et al. Molecular-based targeted therapies in patients with hepatocellular carcinoma and hepato-cholangiocarcinoma refractory to atezolizumab/bevacizumab. J Hepatol. 2023;79(6):1450–1458. doi:10.1016/j.jhep.2023.08.017
33. Oura K, Morishita A, Tani J, et al. Tumor immune microenvironment and immunosuppressive therapy in hepatocellular carcinoma: a review. Int J Mol Sci. 2021;22(11). doi:10.3390/ijms22115801
34. Chen C, Wang Z, Ding Y, et al. Tumor microenvironment-mediated immune evasion in hepatocellular carcinoma. Front Immunol. 2023;14(1133308). doi:10.3389/fimmu.2023.1133308
35. Zhang X, Ding J, Feng L, et al. Development of novel nitric oxide-releasing quinolinedione/furoxan hybrids as NQO1 inhibitors for intervention of drug-resistanthepatocellular cancer. Bioorg Chem. 2022;129(106174). doi:10.1016/j.bioorg.2022.106174
36. Chen J, Ding C, Chen Y, et al. ACSL4 reprograms fatty acid metabolism in hepatocellular carcinoma via c-Myc/SREBP1 pathway. Cancer Lett. 2021;502:154–165. doi:10.1016/j.canlet.2020.12.019
37. Chen T, Yuan Z, Lei Z, et al. Hippocalcin-Like 1 blunts liver lipid metabolism to suppress tumorigenesis via directly targeting RUVBL1-mTOR signaling. Theranostics. 2022;12(17):7450–7464. doi:10.7150/thno.75936
38. Peixoto SÁ, Moreno MF, Castro É, et al. Hepatocellular carcinoma induced by hepatocyte Pten deletion reduces BAT UCP-1 and thermogenic capacity in mice, despite increasing serum FGF-21 and iWAT browning. J Physiol Biochem. 2023;79(4):731–743. doi:10.1007/s13105-023-00970-4
39. Kucukoglu O, Sowa JP, Mazzolini GD, et al. Hepatokines and adipokines in NASH-related hepatocellular carcinoma. J Hepatol. 2021;74(2):442–457. doi:10.1016/j.jhep.2020.10.030
40. Pavanello C, Calabresi L. Genetic, biochemical, and clinical features of LCAT deficiency: update for 2020. Curr Opin Lipidol. 2020;31(4):232–237. doi:10.1097/mol.0000000000000697
41. Yang K, Wang J, Xiang H, et al. LCAT- targeted therapies: progress, failures and future. Biomed Pharmacother. 2022;147(112677). doi:10.1016/j.biopha.2022.112677
42. Zhang X, Liu X, Zhu K, et al. CD5L-associated gene analyses highlight the dysregulations, prognostic effects, immune associations, and drug-sensitivity predicative potentials of LCAT and CDC20 in hepatocellular carcinoma. Cancer Cell Int. 2022;22(1):393. doi:10.1186/s12935-022-02820-7
43. Ouimet M, Barrett TJ, Fisher EA. HDL and reverse cholesterol transport. Circ Res. 2019;124(10):1505–1518. doi:10.1161/circresaha.119.312617
44. He W, Wang M, Zhang X, et al. Estrogen induces LCAT to maintain cholesterol homeostasis and suppress hepatocellular carcinoma development. Cancer Res. 2024;84(15):2417–2431. doi:10.1158/0008-5472.Can-23-3966
45. Li H, Qian F, Bao S. Identification and functional analysis of lactic acid metabolism-related differentially expressed genes in hepatocellular carcinoma. Front Genet. 2024;15(1390882). doi:10.3389/fgene.2024.1390882
46. Mossmann D, Müller C, Park S, et al. Arginine reprograms metabolism in liver cancer via RBM39. Cell. 2023;186(23):5068–5083.e5023. doi:10.1016/j.cell.2023.09.011
47. Xu M, Xie P, Liu S, et al. LCAT deficiency promotes hepatocellular carcinoma progression and lenvatinib resistance by promoting triglyceride catabolism and fatty acid oxidation. Cancer Lett. 2025;612(217469). doi:10.1016/j.canlet.2025.217469
48. Tahara D, Nakanishi T, Akazawa S, et al. Lecithin-cholesterol acyltransferase and lipid transfer protein activities in liver disease. Metabolism. 1993;42(1):19–23. doi:10.1016/0026-0495(93)90166-l
49. Lasunción MA, Martínez-Botas J, Martín-Sánchez C, et al. Cell cycle dependence on the mevalonate pathway: role of cholesterol and non-sterol isoprenoids. Biochem Pharmacol. 2022;196(114623). doi:10.1016/j.bcp.2021.114623
50. Tian LY, Smit DJ, Jücker M. The role of PI3K/AKT/mTOR signaling in hepatocellular carcinoma metabolism. Int J Mol Sci. 2023;24(3). doi:10.3390/ijms24032652
51. Xu K, Xia P, Liu P, et al. A six lipid metabolism related gene signature for predicting the prognosis of hepatocellular carcinoma. Sci Rep. 2022;12(1):20781. doi:10.1038/s41598-022-25356-2
52. Kumar S, Singh SK, Rana B, et al. Tumor-infiltrating CD8(+) T cell antitumor efficacy and exhaustion: molecular insights. Drug Discov Today. 2021;26(4):951–967. doi:10.1016/j.drudis.2021.01.002
53. Chen Z, Liu W, Yang Z, et al. Sonodynamic-immunomodulatory nanostimulators activate pyroptosis and remodel tumor microenvironment for enhanced tumor immunotherapy. Theranostics. 2023;13(5):1571–1583. doi:10.7150/thno.79945
54. Tang W, Zhou J, Yang W, et al. Aberrant cholesterol metabolic signaling impairs antitumor immunosurveillance through natural killer T cell dysfunction in obese liver. Cell Mol Immunol. 2022;19(7):834–847. doi:10.1038/s41423-022-00872-3
55. Yan C, Zheng L, Jiang S, et al. Exhaustion-associated cholesterol deficiency dampens the cytotoxic arm of antitumor immunity. Cancer Cell. 2023;41(7):1276–1293.e1211. doi:10.1016/j.ccell.2023.04.016
 © 2026 The Author(s). This work is published and licensed by Dove Medical Press Limited. The
full terms of this license are available at https://www.dovepress.com/terms
and incorporate the Creative Commons Attribution
- Non Commercial (unported, 4.0) License.
By accessing the work you hereby accept the Terms. Non-commercial uses of the work are permitted
without any further permission from Dove Medical Press Limited, provided the work is properly
attributed. For permission for commercial use of this work, please see paragraphs 4.2 and 5 of our Terms.
© 2026 The Author(s). This work is published and licensed by Dove Medical Press Limited. The
full terms of this license are available at https://www.dovepress.com/terms
and incorporate the Creative Commons Attribution
- Non Commercial (unported, 4.0) License.
By accessing the work you hereby accept the Terms. Non-commercial uses of the work are permitted
without any further permission from Dove Medical Press Limited, provided the work is properly
attributed. For permission for commercial use of this work, please see paragraphs 4.2 and 5 of our Terms.