Back to Journals » Diabetes, Metabolic Syndrome and Obesity » Volume 12
Abdominal subcutaneous fat thickness and homeostasis model assessment of insulin resistance as simple predictors of nonalcoholic steatohepatitis
Authors Hegazy MA ![]() , Samy MA, Tawfik A, Naguib MM, Ezzat A
, Samy MA, Tawfik A, Naguib MM, Ezzat A ![]() , Behiry ME
, Behiry ME ![]()
Received 21 January 2019
Accepted for publication 22 May 2019
Published 11 July 2019 Volume 2019:12 Pages 1105—1111
DOI https://doi.org/10.2147/DMSO.S202343
Checked for plagiarism Yes
Review by Single anonymous peer review
Peer reviewer comments 2
Editor who approved publication: Dr Konstantinos Tziomalos
Mona A Hegazy,1 Maysa A Samy,2 Afaf Tawfik,2 Mervat M Naguib,1 Ahmed Ezzat,1 Mervat E Behiry1
1Department of Internal Medicine, School of Medicine, Cairo University, Cairo, Egypt; 2National Nutrition Institute, Cairo, Egypt
Background: Obesity, insulin resistance, and diabetes are major risk factors for nonalcoholic fatty liver disease (NAFLD). This study aims to evaluate the association between different grades of NAFLD and abdominal subcutaneous fat thickness with the homeostasis model assessment of insulin resistance (HOMA-IR).
Methods: In this pilot study, 59 obese nondiabetic participants with NAFLD were enrolled. Total cholesterol, HbA1c, and HOMA-IR were measured. Abdominal subcutaneous fat thickness in the midline just below the xiphoid process in front of the left lobe of the liver (LSFT) and in the umbilical region (USFT), and the degree of hepatic steatosis, were evaluated by ultrasound scans, and their correlation with the degree of steatosis and the NAFLD Activity Score in liver biopsy was assessed.
Results: Of the 59 studied participants, 15 had mild, 17 had moderate, and 27 had severe hepatic steatosis by abdominal ultrasound. Themean ± SD HOMA-IR level in NAFLD patients was 5.41±2.70. The severity of hepatic steatosis positively correlated with body mass index (P<0.001), HOMA-IR (P<0.001), serum triglycerides (P=0.001), LSFT (P<0.001), and USFT (P<0.001). Receiver operating characteristics analysis showed that LSFT at a cut-off of 3.45 cm is the most accurate predictor of severe hepatic steatosis, with 74.1% sensitivity and 84.4% specificity. The best cut-off of USFT for identifying severe hepatic steatosis is 4.55 cm, with 63% sensitivity and 81.3% specificity.
Conclusion: Abdominal subcutaneous fat thicknesses in front of the left lobe of the liver and in the umbilical region, together with HOMA-IR, are reliable indicators of the severity of NAFLD in obese nondiabetic individuals.
Keywords: hepatic steatosis, abdominal subcutaneous fat thickness, insulin resistance, obesity
Introduction
Obesity is a major health problem worldwide. Egypt has a very high prevalence rate of obesity, reaching 35.3%.1 Epidemiological studies have identified obesity as a major risk factor for a growing group of chronic illnesses, including cardiovascular disease, diabetes mellitus, and several malignancies.2
Nonalcoholic fatty liver disease (NAFLD), characterized by increased fat deposition in the liver, is the most common cause of abnormal liver function tests and imaging as detected by ultrasonography (US).3,4 NAFLD is a wide-ranging disease, from simple steatosis, through nonalcoholic steatohepatitis (NASH), to liver cirrhosis.5 NAFLD is strongly associated with the metabolic syndrome and it has been suggested to be a part of its spectrum and to pave the way to its future development.6 Obesity and insulin resistance are among the major contributing factors linked to the presence of NAFLD.7
Although liver biopsy has long been the gold standard to evaluate hepatic steatosis and fibrosis, this procedure is invasive and costly as a screening tool. Usually, the diagnosis of NAFLD is suggested by elevated liver enzymes and the detection of fatty infiltration in the liver parenchyma by imaging.8 Liver US with the homeostasis model assessment of insulin resistance (HOMA-IR) was found to be a sensitive and noninvasive method in assessing the severity of NAFLD.9
Abdominal fat thickness measurement as a predictor of hepatic steatosis has been previously evaluated by computed tomography or magnetic resonance imaging.10 The assessment of abdominal fat thickness by US, which is a simple and cheap method, is still under evaluation.10
There are not enough data about the epidemiology of NAFLD in Egypt; however, there are scarce studies, which have concluded that fatty liver was prevalent in schoolchildren (15.8%) and increased significantly with age.11,12 In addition, NAFLD was noted in more than 50% of female obese individuals.12
Accordingly, the present study was carried out to determine whether abdominal subcutaneous fat thickness, as measured by US in the midline in front of the left lobe of the liver just below the xiphoid process (LSFT) and in the umbilical region (USFT) and HOMA-IR could be used as a noninvasive tool to detect NASH and to predict the severity of NAFLD in Egyptian obese non-diabetic individuals.
Materials and methods
This is a pilot cross-sectional study. It was conducted from September 2017 to January 2018 and included 59 overweight and obese nondiabetic subjects who were employees of the National Nutrition Institute, Egypt, as a survey conducted under the name “Your Weight Is Predictor Of Your Health”. Body mass index (BMI) was used to identify overweight (BMI 25–29.5 kg/m2) and obese (BMI ≥30 kg/m2) people. Exclusion criteria included patients with 1) diabetes (fasting glucose ≥126 mg/dL or 2-hour plasma glucose ≥200 mg/dL or HbA1c ≥6.5%); 2) chronic liver disease other than NAFLD; or 3) a history of alcohol intake or medications that might affect liver function.
All subjects provided informed written consent to participate in this study. The study protocol and procedures conform to the ethical guidelines of the 1975 Declaration of Helsinki.1013 The protocol was revised and approved by the Research Committee at the National Nutrition Institute.
All participants underwent a full medical history and clinical examination, serum biochemistry profile, and liver US. The weight and height of each participant were measured while the participant was clothed only in a light gown, and the BMI was calculated (kg/m2).
Blood samples were collected from each individual after a period of 10–12 hours for measurement of fasting glucose, insulin, total cholesterol, high-density lipoprotein, low-density lipoprotein, triglycerides, serum aspartate and alanine aminotransferases, γ-glutamyltransaminase, alkaline phosphatase, and serum calcium. Hepatitis C virus antibody and hepatitis B virus surface antigen tests were conducted to exclude hepatitis C and B virus infection. The clinical chemistry analysis was performed on a Dimension RxL Max (Siemens, Philadelphia, PA,, USA), while serum insulin was assayed on a Cobas e411 analyzer (Roche Diagnostics, Mannheim, Germany).
Assessment of hepatic steatosis and abdominal subcutaneous fat thickness by US
All participants underwent US examination after fasting overnight. All US scans were performed by the same operator (MH) using a high-resolution multifrequency B-mode scanner (SDD-5500; Aloka, Tokyo, Japan) 2.5–5.0 MHz transducer. The following data were recorded: diameter of the right lobe of the liver, spleen size (length of its longest axis), and diameter of the portal vein.
The role of US in the diagnosis of steatosis in obese patients is well documented.14
The severity of NAFLD was stratified as mild, moderate, or severe fatty liver based on US findings. Steatosis was mild if there was little increase in liver echogenicity. In moderate steatosis, there were visual images associated with intrahepatic vessels and the presence of increased liver organ echogenicity. Severe steatosis was identified as the marked increase in hepatic echogenicity, poor penetration of the posterior segment from the right lobe of the liver, or poor or any visual images from the hepatic vessels.15
In this study, we adopted the US classification of steatosis instead of liver biopsy, as US correlates well with the NAFLD activity score of liver biopsy. Thus, mild steatosis by US conforms to stage 1 steatosis by liver biopsy, while severe steatosis by US correlates with stage 3 steatosis by liver biopsy. Liver damage assessed according to the NAFLD activity score (NAS), which is the sum of steatosis (scale from 0-3), lobular inflammation (scale from 0-3), and hepatocellular ballooning (scale from 0-2) , so <3 is not NASH, 3–4 is borderline NASH, and ≥5 defines NASH. Therefore, if severe steatosis by US correlates 100% with stage 3 steatosis by liver biopsy, this means a NAFLD activity score ≥3, and with the presence mostly or even absence of inflammation and ballooning the patient might be 3 only (borderline NASH) or above 3, reaching up to 6 (NASH).16
Abdominal subcutaneous fat thickness was measured by a 5 MHz linear probe at two sites. The first site was in the midline just below the xiphoid process in front of the left lobe of the liver (LSFT). The second site was just to the right of the umbilicus (USFT).
Statistical analysis
Data were coded and entered using the statistical package SPSS version 24 (IBM Corp., Armonk, NY, USA). Data were summarized using the mean and SD for quantitative variables, and frequencies (number of cases) and relative frequencies (percentages) for categorical variables. Comparisons between groups were made using ANOVA with the multiple comparisons post-hoc test for normally distributed quantitative variables, while the nonparametric Kruskal–Wallis test and Mann–Whitney test were used for nonnormally distributed quantitative variables. To compare categorical data, the chi-squared test was performed. The exact test was used instead when the expected frequency was less than 5. Correlations between quantitative variables were assessed using Spearman's correlation coefficient. P-values less than 0.05 were considered statistically significant. Receiver operating characteristics (ROC) analysis was used to determine the optimum cut-off value of the selected variable in predicting the grade of NAFLD.
Results
Clinical, biochemical, and ultrasonographic characteristics of obese nondiabetic subjects
The present study enrolled 59 individuals, 55 females and four males. Their age ranged from 18 to 57 years. Their mean BMI was 34.21±6.51 kg/m2 and their HOMA-IR ranged from 1.38 to 13.19 (5.41±2.70). Fatty liver grade as detected by US was severe in 27 (45.8%), moderate in 17 (28.8%), and severe in 15 (25.4%) individuals. Mean USFT and LSFT were 4.60±1.90 cm and 3.36±1.07 cm, respectively. Anthropometric, biochemical, and US data of participants are presented in Table 1.
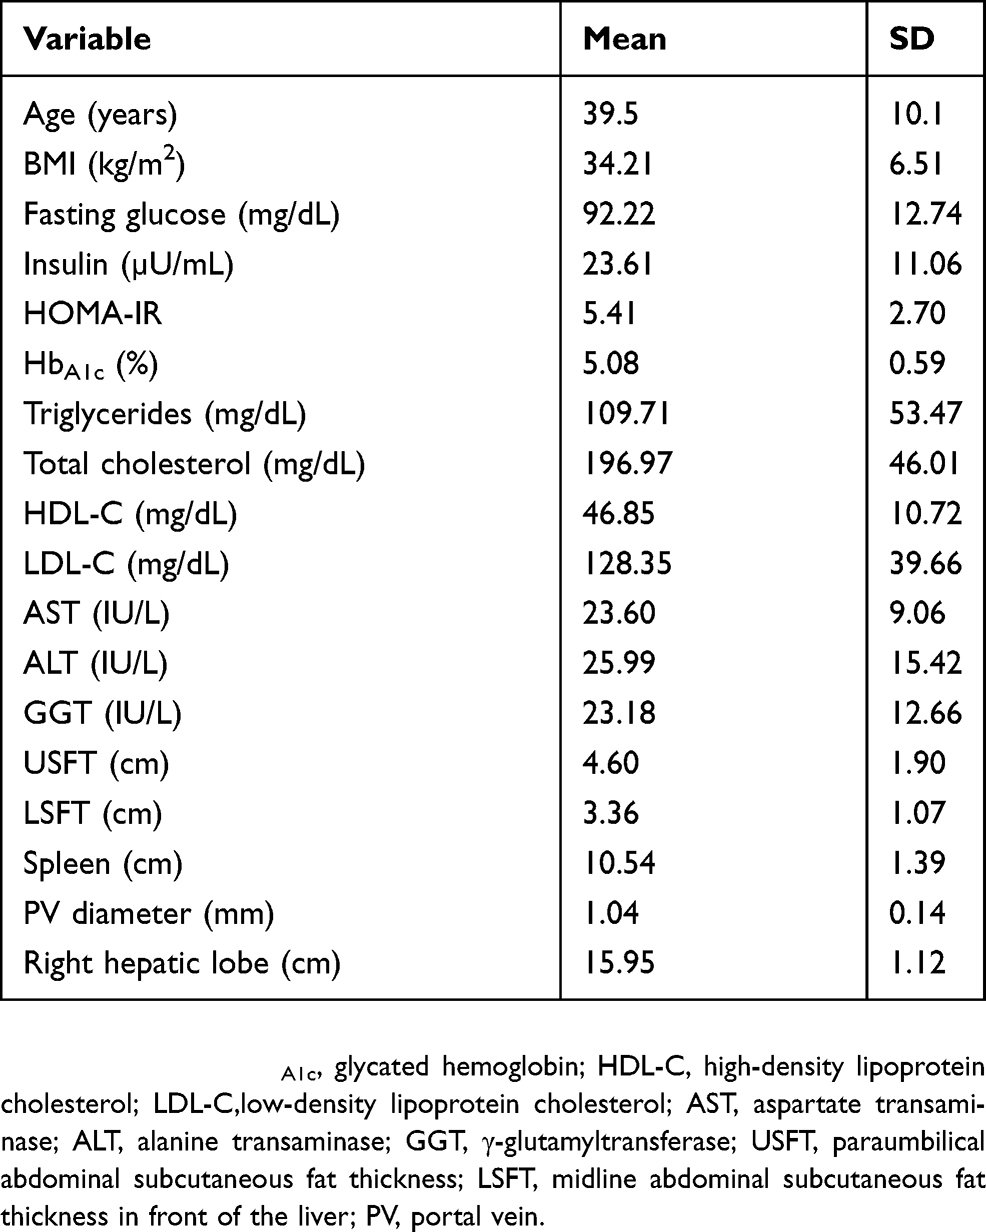 |
Table 1 Clinical and biochemical characteristics of obese nondiabetic participants |
Analyses of factors associated with fatty liver grade in obese nondiabetic subjects
Spearman’s correlation showed that severity of fatty liver was significantly associated with BMI (P<0.001), HOMA-IR (P<0.001), triglycerides (P=0.001), ALT (P<0.001), LSFT (P<0.001), USFT (P<0.001), portal vein diameter (P=0.004), and liver diameter (P<0.001) (Table 2).
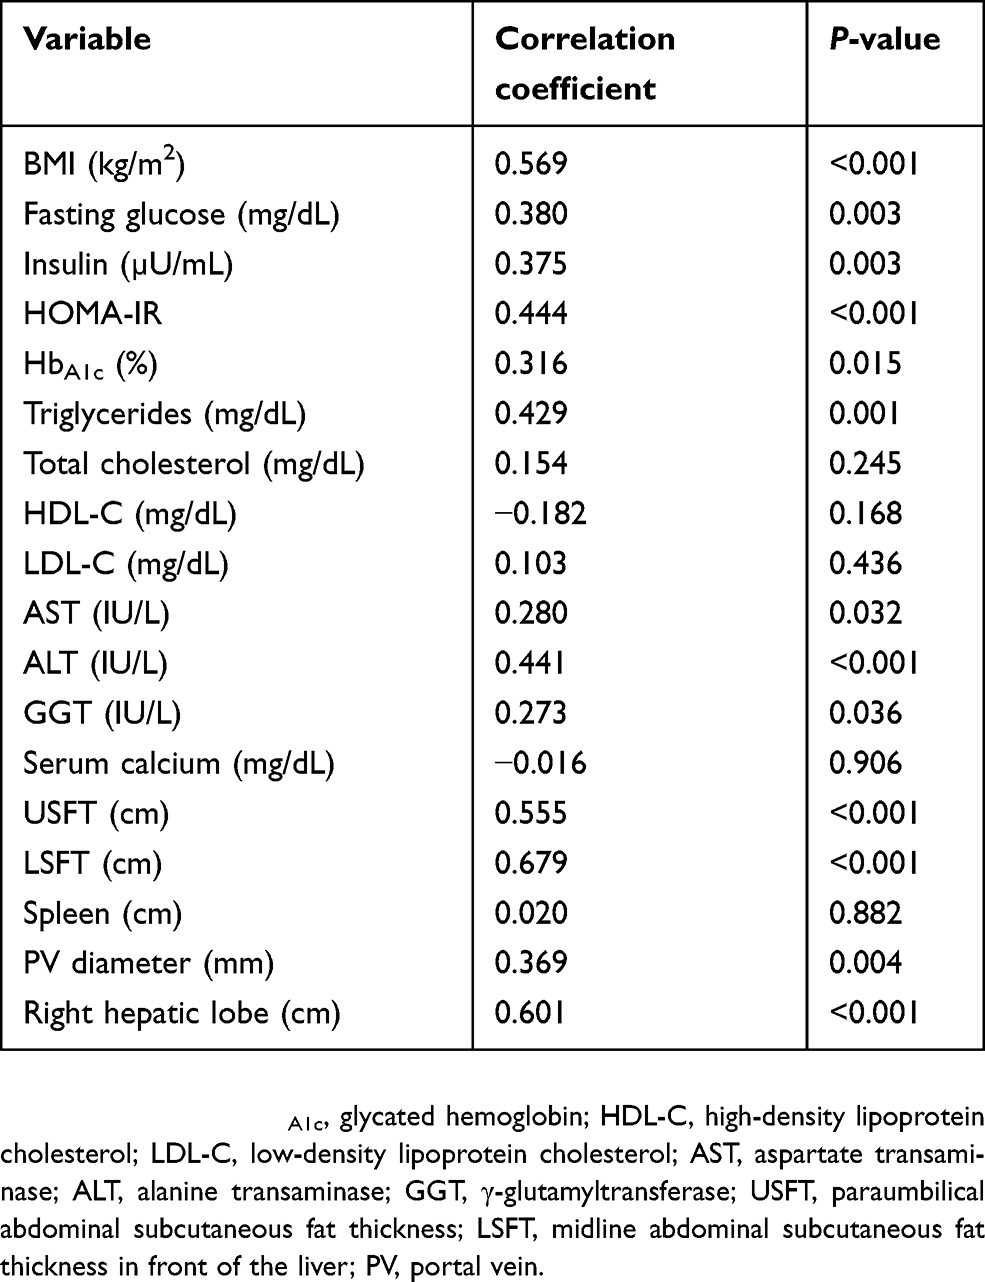 |
Table 2 Correlation between grade of nonalcoholic fatty liver disease and other variables |
Abdominal fat thickness and HOMA-IR as indicators of degree of hepatic steatosis
By means of ROC curve analyses, we evaluated the accuracy of LSFT, USFT, and HOMA-IR in detecting the degree of NAFLD in obese nondiabetic participants.
For detection of severe hepatic steatosis, the identified cut-off values for LSFT, USFT, and HOMA-IR were 3.45 cm, 4.55 cm, and 5.819, respectively. From a statistical point of view, LSFT had the highest diagnostic accuracy (area under the curve [AUC] 0.856, 95% CI 0.759–0.954), with 74.1% sensitivity and 84.4% specificity. The AUC for USFT was 0.777 (95% CI 0.656–0.897), with 63% sensitivity and 81.3% specificity; and for HOMA-IR the AUC was 0.750 (95% CI 0.619–0.881), with 70.4% sensitivity and 81.3% specificity (Figure 1).
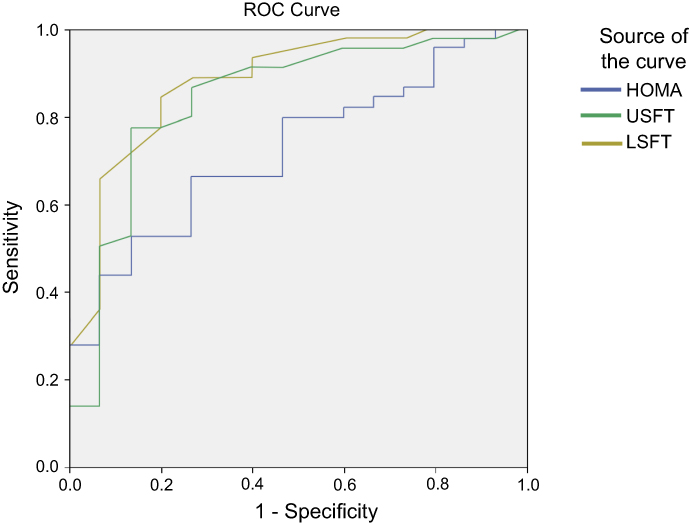 |
Figure 1 ROC curves for detection of severe grade of nonalcoholic fatty liver disease. Abbreviations: ROC, receiver operating characteristics; HOMA, homeostasis model assessment; USFT, paraumbilical abdominal subcutaneous fat thickness; LSFT, midline abdominal subcutaneous fat thickness in front of the liver. |
For detection of moderate hepatic steatosis, the AUC for LSFT was 0.879 (95% CI 0.776–0.981), which was higher than 0.838 (95% CI 0.710–0.966) for USFT and 0.718 (95% CI 0.581–0.855) for HOMA-IR (Figure 2).
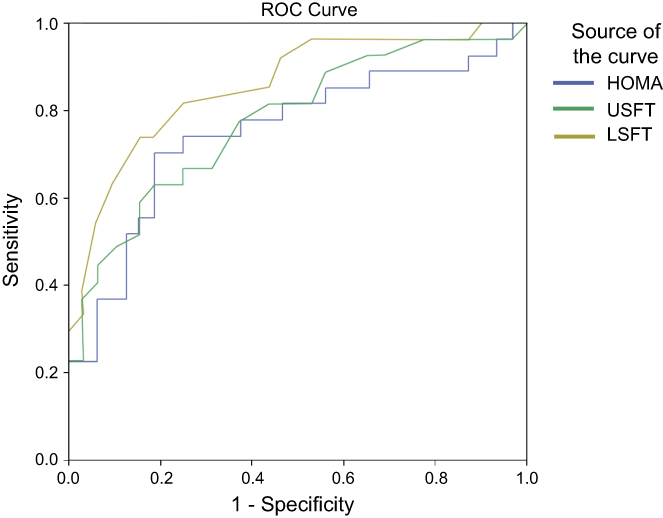 |
Figure 2 ROC curves for detection of moderate grade of nonalcoholic fatty liver disease. Abbreviations: ROC, receiver operating characteristics; HOMA, homeostasis model assessment; USFT, paraumbilical abdominal subcutaneous fat thickness; LSFT, midline abdominal subcutaneous fat thickness in front of the liver. |
Discussion
We studied the predictors of severity of NAFLD in obese nondiabetic subjects and found that abdominal subcutaneous fat thicknesses in front of the left lobe of the liver and in the umbilical region and HOMA-IR are reliable indicators of NASH and predictors of severity of NAFLD.
The global prevalence of NAFLD is 25.24%, with the highest prevalence in the Middle East.17 Obesity is among the commonest causes of NAFLD and about 51.34% of patients with fatty liver are obese.17 Percutaneous liver biopsy is the gold standard method for the assessment of parenchymal liver disease. However, ethical and medical considerations limit its use in many cases of NAFLD. US scanning is considered as the first-line imaging investigation in patients with suspected liver disorder. Highly significant direct correlations between the US grading of steatosis, grading of liver steatosis by histology, and the presence or absence of NASH by the NAFLD activity score were found in previous studies.14,16,18
In the present study, we examined the clinical significance of LSFT and USFT as simple noninvasive variables measured by US to predict the severity of NAFLD in obese people.
In our study, about half of the obese nondiabetic participants had severe hepatic steatosis. Insulin resistance and abdominal obesity play a pivotal role in the pathogenesis of NAFLD. The grade of hepatic steatosis has previously been correlated with the degree of obesity.19 Although BMI is an independent predictor of fatty liver, many studies have indicated that body composition reflects an individual’s health status better than body weight or BMI.20 Moreover, abdominal obesity is associated with more health problem than peripheral obesity.21 In the present study, BMI, LSFT, and USFT were correlated with the grade of NAFLD. Furthermore, LSFT and USFT were accurate indicators for the detection of fatty liver. Previous results showed that abdominal subcutaneous adipose tissue was greater in patients with NASH than in those without.22 Gaba et al reported that anterior subcutaneous fat as measured by computed tomography had a moderate correlation with the presence of liver steatosis.23 Lee et al found that abdominal subcutaneous fat thickness as measured by US was significantly related to the grade of hepatic steatosis in obese children.24
Conversely, Parente et al concluded that there was no correlation between the subcutaneous fat thickness and the grade of steatosis among type 2 diabetic obese individuals,25 and this result is in accordance with other previous studies which suggested that visceral fat, not subcutaneous fat, is a reliable predictor of NAFLD.26,27
These contradictory results may be due to the different ethnic population studied, and to the fact that they examined diabetic patients, in whom visceral fat is more dangerous than subcutaneous fat for the secretion of different proinflammatory adipokines,27 whereas our patients were nondiabetics.
In the current study, we also found a significant correlation between portal vein diameter and the grade of NAFLD. This could be explained by the severe grades of hepatic steatosis being associated with increased hepatic stiffness, leading to increased portal pressure and portal vein dilatation.
Insulin resistance is a common feature of type 2 diabetes mellitus, obesity, and hypertension, and is better evaluated by HOMA-IR.28 However, there is great variability in the threshold HOMA-IR levels used to define insulin resistance among different populations.29,30 HOMA-IR level was much higher in our nondiabetic patients than previously found in patients with metabolic syndrome of different ethnicity.28,30 Also, in a previously published study on nondiabetic Egyptian patients, HOMA-IR levels were markedly elevated in obese individuals with hepatic steatosis compared to those without steatosis, as detected by US.31 Insulin resistance is associated with impaired suppression of lipolysis in the adipose tissue, leading to an increased influx of free fatty acids to the liver and the development of hepatic steatosis.5 In the current study, HOMA-IR had a strong positive correlation with the severity of hepatic steatosis assessed by US (P>0.001). In addition, HOMA-IR was a sensitive and specific indicator of the presence of NASH. A study using US to detect steatosis reported an independent relationship between insulin resistance and the severity of hepatic steatosis in obese people.32 Moreover, another study found that obese subjects with NAFLD had higher HOMA-IR compared to obese subjects without NAFLD.33
We also evaluated the association between serum lipid concentrations and NAFLD in this obese nondiabetic population, and found no significant correlations except for between triglycerides and NAFLD. Although dyslipidemia has been reported in up to 80% of patients with NAFLD, previous studies found no significant difference in the cholesterol or triglyceride levels between patients with different degrees of NAFLD.34,35 Similarly, another study showed that biopsy-proven NAFLD correlated with hepatic inflammation but did not correlate with lipid parameters.36
Some limitations of the study should be mentioned: first, the relatively small number of patients included; and second, that most of the participants were female.
Given the fact that the diagnosis of NASH is challenging, this study has a great strength as it showed that measurement of subcutaneous abdominal fat by US with a high level of HOMA-IR among nondiabetic obese participants could provide an easy means of screening obese nondiabetics for NASH, as well as a simple measure of steatosis grading. We recommend further studies on a larger scale and the construction of a model that merges the different US parameters to increase accuracy.
Conclusion
Abdominal subcutaneous fat thickness as evaluated by US, along with insulin resistance as measured by HOMA-IR, can be used as simple, reliable, and noninvasive tools to screen and detect NASH and to predict the grades of NAFLD in obese nondiabetic subjects.
Acknowledgment
We would like to thank all the participants of this work.
Disclosure
The authors report no conflicts of interest in this work.
References
1. The GBD 2015 Obesity Collaborators, Afshin A, Forouzanfar MH, Reitsma MB, Sur P, Estep K, et al. Health effects of overweight and obesity in 195 countries over 25 years. N Engl J Med. 2017;377(1):13–27. doi:10.1056/NEJMoa1614362
2. Lauby-Secretan B, Scoccianti C, Loomis D, Grosse Y, Bianchini F, Straif K. Body fatness and cancer — viewpoint of the IARC working group. N Engl J Med. 2016;375:794–798. doi:10.1056/NEJMsr1606602
3. Angulo P. Nonalcoholic fatty liver disease. N Engl J Med. 2002;346:1221–1231. doi:10.1056/NEJMra011775
4. Jessica B, Michele D, Brent AN, et al. Clinical model for NASH and advanced fibrosis in adult patients with diabetes and NAFLD: guidelines for referral in NAFLD. Diabetes Care. 2015;38:1347–1355. doi:10.2337/dc14-1239
5. Petäjä EM, Yki-Järvinen H. Definitions of normal liver fat and the association of insulin sensitivity with acquired and genetic NAFLD-a systematic review. Int J Mol Sci. 2016;17:E633. doi:10.3390/ijms17050633
6. Younossi ZM, Koenig AB, Abdelatif D, Fazel Y, Henry L, Wymer M. Epidemiology of nonalcoholic fatty liver disease-Meta-analytic assessment of prevalence, incidence, and outcomes. Hepatology. 2016;64:73–84. doi:10.1002/hep.28431
7. Kahal H, Abouda G, Rigby AS, Coady AM, Kilpatrick ES, Atkin SL. Glucagon-like peptide-1 analogue, liraglutide, improves liver fibrosis markers in obese women with polycystic ovary syndrome and nonalcoholic fatty liver disease. Clin Endocrinol (Oxf). 2014;81:523–528. doi:10.1111/cen.12369
8. Bayard M, Holt J, Boroughs E. Nonalcoholic fatty liver disease. Am Fam Physician. 2006;73:1961–1968.
9. Bohte AE, van Werven JR, Bipat S, Stoker J. The diagnostic accuracy of US, CT, MRI and 1H-MRS for the evaluation of hepatic steatosis compared with liver biopsy: a meta-analysis. Eur Radiol. 2011;21:87–97. doi:10.1007/s00330-010-1905-5
10. Ducluzeau PH, Manchec-Poilblanc PM, Roullier V, et al. Distribution of abdominal adipose tissue as a predictor of hepatic steatosis assessed by MRI. Clin Radiol. 2010;65:695–700. doi:10.1016/j.crad.2010.03.013
11. Alkassabany YM, Farghaly AG, El-Ghitany E. Prevalence, risk factors, and predictors of nonalcoholic fatty liver disease among schoolchildren: a hospital-based study in Alexandria, Egypt. Arab J Gastroenterol. 2014;15(2). doi:10.1016/j.ajg.2014.05.002
12. Zaki M, Ezzat W, Elhosary Y, Saleh O. Predictors of non-alcoholic fatty liver disease in Egyptian obese adolescents. Int Scholarly Sci Res Innovation. 2014;8(9):657–660.
13. World Medical Association. World Medical Association Declaration of Helsinki ethical principles for medical research involving human subjects. Jama. 2013;310:2191–2194. doi:10.1001/jama.2013.281053
14. Mottin CC, Moretto M, Padoin AV, et al. The role of ultrasound in the diagnosis of hepatic steatosis in morbidly obese patients. Obes Surg. 2004;14:635–637. doi:10.1381/096089204323093408
15. Rumack CM. Diagnostic ultrasound. In: Rumack CM, editor. General Adult Ultrasound. St Louis: Mosby; 1998;110–112.
16. Hegazy M, Mostafa A. Liver ultrasound scanning in the detection of hepatic steatosis and fibrosis in NASH patients. Egypt J Intern Med. 2012;24:27–31.
17. Younossi ZM, Koenig AB, Abdelatif D, Fazel Y, Henry L, Wymer M. Global epidemiology of nonalcoholic fatty liver disease-meta-analytic assessment of prevalence, incidence, and outcomes. Hepatology. 2016;64:73–84. doi:10.1002/hep.28431
18. Hegazy M, Abdel Samie R, Ezzat A, Ramadan N, Rashed L, ElSayed A. PNPLA3 and TNF-α G238A genetic polymorphisms in Egyptian patients with different grades of severity of NAFLD. OJGas. 2016;6:53–64. doi:10.4236/ojgas.2016.63008
19. Holterman AX, Guzman G, Fantuzzi G, et al. Nonalcoholic fatty liver disease in severely obese adolescent and adult patients. Obesity (Silver Spring). 2013;21:591–597. doi:10.1002/oby.20174
20. Nuttall FQ. Body mass index: obesity, BMI, and health: a critical review. Nutr Today. 2015;50:117–128. doi:10.1097/NT.0000000000000092
21. Wajchenberg BL. Subcutaneous and visceral adipose tissue: their relation to the metabolic syndrome. Endocr Rev. 2000;21:697–738. doi:10.1210/edrv.21.6.0415
22. Yano K, Hosokawa K, Nakai K, Kubo T, Matsuo Y. Regional differences in ultrasonic assessment of subcutaneous fat thickness in the abdomen: effects on the TRAM flap. Ann Plast Surg. 2003;51:130–135. doi:10.1097/01.SAP.0000058503.46432.96
23. Gaba RC, Knuttinen MG, Brodsky TR, et al. Hepatic steatosis: correlations of body mass index, CT fat measurements, and liver density with biopsy results. Diagn Interv Radiol. 2012;18:282–287. doi:10.4261/1305-3825.DIR.4958-11.2
24. Lee SH, Kim D, Baek MY, et al. Abdominal subcutaneous fat thickness measured by ultrasonography correlates with hyperlipidemia and steatohepatitis in obese children. Pediatr Gastroenterol Hepatol Nutr. 2015;18:108–114. doi:10.5223/pghn.2015.18.2.108
25. Parente DB, Oliveira N, Brasil P, et al. Preperitoneal fat as a non-invasive marker of increased risk of severe non-alcoholic fatty liver disease in patients with type 2 diabetes. J Gastroenterol Hepatol. 2018;33(2):511–517. doi:10.1111/jgh.13903
26. van der Poorten D, Milner KL, Hui J, et al. Visceral fat: a key mediator of steatohepatitis in metabolic liver disease. Hepatology. 2008;48:449–457. doi:10.1002/hep.v48:2
27. Fukuda K, Seki Y, Ichihi M, et al. Usefulness of ultrasonographic estimation of preperitoneal and subcutaneous fat thickness in the diagnosis of nonalcoholic fatty liver disease in diabetic patients. J Med Ultrason. 2015;42:357–363. doi:10.1007/s10396-015-0615-7
28. Rader DJ. Effect of insulin resistance, dyslipidemia, and intra-abdominal adiposity on the development of cardiovascular disease and diabetes mellitus. Am J Med. 2007;120:S12–S18. doi:10.1016/j.amjmed.2007.01.003
29. Geloneze B, Repetto EM, Geloneze SR, Tambascia MA, Ermetice MN. The threshold value for insulin resistance (HOMA-IR) in an admixture population. IR in the Brazilian metabolic syndrome study. Diabetes Res Clin Pract. 2006;13:219–220. doi:10.1016/j.diabres.2005.10.017
30. Summer AE, Cowie CC. Ethnic differences in the ability of triglyceride levels to identify insulin resistance. Atherosclerosis. 2008;13:696–703. doi:10.1016/j.atherosclerosis.2006.12.018
31. Hegazy M, Abdel-Rahman M, El-Gayar Dina AH. Liver ultrasound is more sensitive in assessing the severity of nonalcoholic fatty liver disease with homeostasis model assessment-insulin resistance. Eglj. 2012;12:41–46.
32. Isaksen VT, Larsen MA, Goll R, Florholmen JR, Paulssen EJ. Hepatic steatosis, detected by hepatorenal index in ultrasonography, as a predictor of insulin resistance in obese subjects. BMC Obes. 2016;20(3):39. doi:10.1186/s40608-016-0118-0
33. De Barros F, Setúbal S, Martinho JM, Ferraz L, Gaudêncio A. Correlation of non-alcoholic fatty liver disease and features of metabolic syndrome in morbidly obese patients in the preoperative assessment for bariatric surgery. Arq Bras Cir Dig. 2016;29:260–263. doi:10.1590/0102-6720201600040011
34. Souza MR, Diniz Mde F, Medeiros-Filho JE, Araújo MS. Metabolic syndrome and risk factors for non-alcoholic fatty liver disease. Arq Gastroenterol. 2012;49:89–96. doi:10.1590/S0004-28032012000100015
35. Gupte P, Amarapurkar D, Agal S, et al. Non-alcoholic steatohepatitis in type 2 diabetes mellitus. J Gastroenterol Hepatol. 2004;19:854–858. doi:10.1111/jgh.2004.19.issue-8
36. Ong JP, Elariny H, Collantes R, et al. Predictors of nonalcoholic steatohepatitis and advanced fibrosis in morbidly obese patients. Obes Surg. 2005;15:310–315. doi:10.1381/0960892053576820
 © 2019 The Author(s). This work is published and licensed by Dove Medical Press Limited. The
full terms of this license are available at https://www.dovepress.com/terms
and incorporate the Creative Commons Attribution
- Non Commercial (unported, 3.0) License.
By accessing the work you hereby accept the Terms. Non-commercial uses of the work are permitted
without any further permission from Dove Medical Press Limited, provided the work is properly
attributed. For permission for commercial use of this work, please see paragraphs 4.2 and 5 of our Terms.
© 2019 The Author(s). This work is published and licensed by Dove Medical Press Limited. The
full terms of this license are available at https://www.dovepress.com/terms
and incorporate the Creative Commons Attribution
- Non Commercial (unported, 3.0) License.
By accessing the work you hereby accept the Terms. Non-commercial uses of the work are permitted
without any further permission from Dove Medical Press Limited, provided the work is properly
attributed. For permission for commercial use of this work, please see paragraphs 4.2 and 5 of our Terms.