")
Back to Journals » International Journal of Nanomedicine » Volume 14
A versatile endosome acidity-induced sheddable gene delivery system: increased tumor targeting and enhanced transfection efficiency
Authors Zhao M, Li J, Ji H, Chen D, Hu H
Received 10 May 2019
Accepted for publication 29 July 2019
Published 14 August 2019 Volume 2019:14 Pages 6519—6538
DOI https://doi.org/10.2147/IJN.S215250
Checked for plagiarism Yes
Review by Single anonymous peer review
Peer reviewer comments 4
Editor who approved publication: Professor Lei Yang
Ming Zhao, Ji Li, Hongrui Ji, Dawei Chen, Haiyang Hu
Department of Pharmaceutics, School of Pharmacy, Shenyang Pharmaceutical University, Shenyang 110016, People’s Republic of China
Background: Polycation carriers show great foreground in the developing efficient and safe gene delivery; nevertheless, they are cytotoxic and unstable in vivo because of the excess cationic charge. PEGylation improves the biocompatibility and stability of polycation, whereas PEGylation restrains the endosomal escape to some extent.
Materials and methods: To address this issue and promote the transfection in vivo, a pH-sensitive conjugate folate-polyethylene glycol-carboxylated chitosan (shorten as FA-PEG-CCTS) was designed and coated on the surface of PEI/NLS/pDNA (PNDs), forming a versatile gene carrier FA-PEG-CCTS/PEI/NLS/pDNA (FPCPNDs). The novel carrier exhibited a few picturesque characteristics, including (i) neutral surface charge to restrain nonspecific interactions; (ii) folate receptors (FR)-mediated endocytosis to augment cellular uptake; (iii) dual proton sponge effect to realize endosome escape, and (iv) nuclear localization sequences (NLS) to enhance the transfection of pDNA.
Results: FPCPNDs could compress and protect pDNA from degradation. FPCPNDs energetically targeted tumor cells because of their high binding affinity between FA and highly expressed FR on the tumor surface, accordingly enhancing the cellular uptake. In the acidic endosomes, FA-PEG-CCTS segment dissociated from PNDs. Then, PNDs realized endosomal escape through the proton sponge effect of PEI. Furthermore, FPCPNDs showed admirable transfection efficiency with the aid of NLS peptides. What’s more, in vivo studies revealed that FPCPNDs had supreme antitumor activity among the whole preparations.
Conclusion: In vitro and in vivo assays thus demonstrate that FPCPNDs is a hopeful strategy for gene delivery.
Keywords: gene delivery, PEI, gene transfection, NLS, shell–core structure, CCTS
Introduction
Gene therapy holds tremendous potentials toward the treatment of inherited diseases.1–3 The key challenge in the clinical application remains the establishment of efficient and safe delivery carriers.4–7 To date, considerable efforts have been devoted to the development of gene carries.8,9 Non-viral vectors attract increasing attention on account of low immunogenicity, safety and flexible structural modification.10 Polyethyleneimine (PEI), as the representative non-viral vector, has been extensively applied due to the excellent gene expression and “proton sponges” effect.11–15 However, the transfection efficiency is far from satisfactory in vivo. In some ways, the unsatisfied expression is owing to the positive charges on polycations, which will lead to nonspecific interaction with cells, aggregation with plasma proteins, recognition and clearance by the reticuloendothelial system (RES).16 Hence, how to eliminate the nonspecific interaction and extend the circulation time becomes an urgent question in the gene delivery.
In order to overcome these problems, polyethylene glycol (PEG) has been broadly applied for modifying polycations to reduce the cytotoxicity and prolong the circulation time in vivo.17,18 Unfortunately, modification of polycations with PEG restrains the capability of DNA compression and endosomal escape, which leads to an obviously reduced transfection efficiency.19 Previous research showed that pH-sensitive anionic materials were used as a shell in the gene delivery.20 Carboxylated chitosan (CCTS) is a pH-responsive biomaterial with negative charge, which can combine with polycations/pDNA complexes through the electrostatic interaction. As a result, it can reduce the ζ-potential of complexes, avoiding the aggregation and clearance by blood components. In addition, the carboxyl groups of CCTS could be protonated in the lysosomes, which would make CCTS separate from the cationic complexes.21–23
To further lower the side effects on normal cells, it is essential to increase the cell-specific and intracellular delivery via attaching the targeting ligands on the surface. One of the most widely used small molecules is folic acid (FA). Folate receptors (FR) are over-expressed on many tumor cells surface, yet are hardly expressed on normal cells.24 FA possesses a high binding affinity for FR and the carriers conjugated with FA will be subsequently internalized into tumor cells via the receptor-mediated endocytosis.25
It has been reported that delivery of exogenous DNA relies on several steps: internalization into the cells, endosomal escape and nucleus transport.26 The nucleus import is an obviously restricted process, while many nucleoproteins possess the ability to freely enter the nucleus. Common nucleoproteins generally carry some nucleus targeting signal peptides, which are named nuclear localization sequences (NLS).27,28 NLS could facilitate the transfection of DNA.29 On the side, tumor suppressor gene p53 could regulate normal cell growth at the level of DNA replication, while its signal transduction pathway acts a predominant part in cell growth, senescence and malignancy.30 When p53 gene is affected by some undesirable factors, like excessive UV radiation, it will mutate. Mutant p53 not only loses its original tumor-suppressing function, but also leads to tumorigenesis and invasiveness in vivo.31 In the case, we set out to bring in p53 gene to perform the antitumor experiment in vivo.
Taken together, we herein constructed a core–shell structure, which was consisted by pH-sensitive polymer FA-PEG-CCTS shell and PEI/NLS/pDNA (PNDs) core, to be a versatile gene delivery FA-PEG-CCTS/PEI/NLS/pDNA (FPCPNDs) (Figure 1). When FPCPNDs was intravenous administration into the blood system, they would reduce the nonspecific interaction and extend the circulation time due to the neutral surface charge and the PEG chains. Meanwhile, they could target the tumor regions via the enhanced permeability and retention (EPR) effect effect owing to their nano-sizes.32–34 FPCPNDs would be internalized into tumor cells via the FR-mediated endocytosis. In the acidic endosomes (pH 5.5), FA-PEG-CCTS segment would dissociate from PNDs and then PNDs escaped from endosomes via the proton sponge hypothesis of PEI. Eventually, DNA is transported to the nucleus with the aid of NLS peptides. In order to validate these hypotheses, a series of in vitro and in vivo experiments were carried out to investigate the antitumor effects of FPCPNDs.
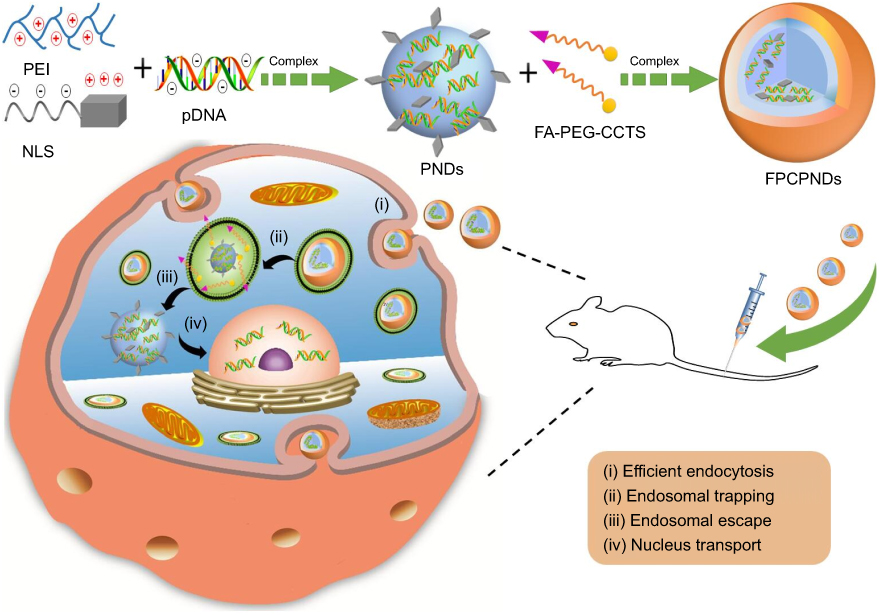 |
Figure 1 Schematic illustration of the formation of FPCPNDs and the extracellular and intracellular trafficking for the systemic delivery of plasmid DNA to tumors. FPCPNDs were internalized by folate receptor-mediated endocytosis. FA-PEG-CCTS dissociates from PNDs in the acidic endosomes and then PNDs escapes from endosomes through the proton sponge effect. Finally, the plasmid DNA is transported to the nucleus with the aid of NLS due to its nuclear locating ability.Abbreviations: FPCPNDs, FA-PEG-CCTS/PEI/NLS/pDNA; PNDs, PEI/NLS/pDNA; FA, folate acid; PEG, polyethylene glycol; CCTS, carboxylated chitosan; PEI, polyethyleneimine; NLS, nuclear localization sequences. |
Materials and methods
Materials
NH2-PEG-COOH (Mw=3 kDa), CCTS (Mw=50 kDa, carboxylation 60.0%), 1-(3-dimethylaminopropyl)-3-ethylcarbodiimide hydrochloride (EDC), PEI (Mw=1.8 kDa) and N-hydroxyl-succinimide (NHS) were obtained from Aladdin Biochemical Technology Co. Ltd. (Shanghai, China). Lipofectamine 2000 was purchased from Invitrogen Life Technologies (USA). Fluorescein isothiocyanate (FITC) and FA were bought from Sigma-Aldrich (St. Louis, MO, USA). LysoTracker Red, agarose and Hoechst 33258 were all gained from Meilun Biotechnology Co. Ltd. (Dalian, China). The NLS peptide of the SV40 T antigen (CGGGPKKKRKVED) and a scrambled sequence (NLS(scr), CGGGPKTKRKVED) were synthesized by GenScript Corporation (Shanghai, China). FBS and RPMI-1640 medium were bought from Gibco (Waltham, MA, USA). Enhanced chemiluminescence was bought from Thermo Scientific (USA). Wild p53 (5ʹ-GGCTCTGACTGTACCACCATCCA-3ʹ) was designed from miaoling.bio (Beijing, China) extracted using the EndoFree Plasmid Kit from Qiagen (Germany). The plasmids pEGFP-C1, pGL3-Control and pDsRed-M-N1 were purchased from Promega (Fitchburg, WI, USA). 4T1 cells and HepG2 cells were bought from Nanjing KeyGen Biotech Co. Ltd. (China). Female BALB/c mice (20±2 g) were obtained from Shenyang Changsheng Biotechnology Co. Ltd. All animal experiments were pursuant to the rules of Experimental Animal Administrative Committee of Shenyang Pharmaceutical University and the committee approved the experiments.
Synthesis of FA-PEG-CCTS
The synthetic routes are presented in Figure S1, FA-PEG-CCTS were synthesized according to the research before.35,36 In brief, FA (0.44 g, 1 mmol), triethylamine (0.51 g, 5 mmol), EDC (0.23 g, 1.2 mmol) and NHS (0.14 g, 1.2 mmol) were added in the anhydrous dimethyl sulfoxide (DMSO) solution and adequately reacted for 6 hrs. Then, the product FA-NHS was depurated via sediment in cold diethyl ether. After that proper FA-NHS and COOH-PEG3000-NH2 were added into 5 mL DMSO solution and reacted for 36 hrs. Then, for activation of FA-PEG-COOH, the same proportion of NHS, EDC and TEA were added in the solution, respectively. After 6 hrs reaction, FA-PEG-NHS was depurated by sediment in cold diethyl ether. Then, CCTS and FA-PEG-NHS were added into 5 mL distilled water and reacted for 48 hrs. Finally, the resultant product FA-PEG-CCTS was depurated through dialysis (MWCO 10 kDa) against distilled water for 2 days and lyophilized. The products were characterized by 1H NMR.
Preparation of FPCPNDs complexes
FPCPNDs complexes were prepared with PEI/NLS/pDNA (PNDs) and FA-PEG-CCTS at different N/P ratios (molar ratio of PEI-nitrogen atoms to pDNA-phosphate). Briefly, pEGFP-C1 was mixed with NLS (SV40) at a molar ratio of 1:1. Then, PEI was added into the solution at different proportions. FA-PEG-CCTS which was dissolved in the distilled water was added into the above mixture (at different weight ratios of FA-PEG-CCTS to PEI) and then incubated for 0.5 hr. PEI/pDNA (PDs), PEI/NLS/pDNA (PNDs), PEI/NLS(scr)/DNA (PN(scr)Ds), CCTS/PEI/NLS/pDNA (CPNDs), PEG-CCTS/PEI/NLS/pDNA (PCPNDs) and FA-PEG-CCTS/PEI/NLS/pDNA (FPCPNDs) complexes were prepared.
Hoechst 33258 intercalation assay
The encapsulation efficiency (EE%) was determined by the ultrafiltration method. The complexes solutions at different N/P ratios were added into filter devices (50 kD) and centrifuged (speed: 4000 rpm, time: 10 mins). Solutions being centrifuged which contained unencapsulated pDNA were collected. Then, solutions were mixed with Hoechst 33258 solution and quantified by microplate reader. The fluorescence intensity was assessed at 457 nm (em) and 353 nm (ex), and calculated the EE through the following equation:

where Ft and Fu were defined as the concentration of total and unloaded pDNA, respectively.
Agarose gel electrophoresis
For the pDNA condensation assay, 10 μL PDs, PNDs, CPNDs, PCPNDs and FPCPNDs were added into 0.7% agarose gel and electrophoresed, respectively. Then, gel was stained by ethidium bromide (10 μg/mL) and pictures were obtained by Tanon 2500R automatic digital gel image analysis system.
For the heparin replacement experiment, 5 μL heparin (10 U/μL) was mixed with the 10 μL PDs, PNDs, CPNDs, PCPNDs and FPCPNDs (containing 0.2 μg pDNA) at various N/P ratios, respectively. Then, samples were incubated for 30 mins, followed by electrophoresis. Meanwhile, the DNase I degradation assay was performed as reported previously.37 PDs, PNDs, CPNDs, PCPNDs and FPCPNDs complexes at various N/P ratios were incubated with 10 μL DNase I digestion system at 37°C for 15 mins. Then, the mixtures were incubated with 5 μL termination solution for 10 mins at room temperature. After replacing with 5 μL of SDS solution (10%), the integrity of pDNA was assessed by agarose gel electrophoresis.
Particle size and ζ-potential measurement
A dynamic light scattering instrument (Zetasizer Nano ZS; Malvern Instruments, Malvern, UK) was utilized to characterize the ζ-potential and particle size of different complexes. The morphologies of complexes were scanned through the transmission electron microscopy (TEM, Gatanmodel 794 CCD, bottom mounted). Briefly, complexes were suspended in PBS solution and then placed on the copper grid. Excess liquid was blotted out and the grids were allowed to dry overnight at room temperature. Samples were imaged using an FEI TecnaiG220 TEM (Gatanmodel 794 CCD, bottom mounted).
Immunogenicity assay
The concentration of IL-12 in blood was determined by ELISA to investigate the immunogenicity of FPCPNDs. According to the operation steps of ELISA kit instructions, standard IL-12 and standard interferon-β (IFN-β) were diluted to a certain concentration (0.5, 1, 2, 4, 8, 50, 100, 200, 400, 800 pg/mL) respectively, and absorbance was measured at wavelength of 450 nm with multifunctional microplate reader (Tecan, Austria). The concentration was treated by linear regression with absorbance. After intravenous injection of the FPCPNDs, the blood was taken from the mice eye and whole blood was collected into a heparin-treated centrifuge tube. The mixture was allowed to stand at room temperature for 30 mins until the blood agglutinated, and the blood was centrifuged at a low temperature (3000 r/min, 15 mins) and the upper serum sample was collected. Using blank serum as control, 50 μL standard was added to the standard hole of the coated ELISA plate. 40 μL buffer was first added to the sample hole, and then 10 μL sample to be tested was added. After sealing the plate with microplate sealers, the samples were incubated at 37°C for 30 mins. Subsequently, the sealing plate was carefully peeled off and the liquid was discarded and spun dry. Each hole was filled with diluted detergent, discarded after standing about 30 s. This step was repeated for 5 times, and then air dried. Except for the blank holes, each hole was added with 50 μL ELISA reagent to repeat the above operation. Color developing agent was added to render without light for 10 mins, and then the stop solution was added to terminate the reaction. The absorbance of each hole was determined and the concentration of cytokines was calculated by the standard curve.
In vitro cytotoxicity
HepG2 and 4T1 cells were cultured in RPMI 1640 medium with 10% heat-inactivated FBS at 37°C in an atmosphere of 5% CO2 humidified atmosphere, respectively. The cells were maintained in 96-well plate at an initial density of 5×10³ cells per well. After 12 hrs attachment, a) FPCPNDs at various N/P ratios and b) PNDs, PDs, CPNDs, PCPNDs and FPCPNDs (N/P=15) were added into the plates, respectively. 20 μL MTT (5 mg/mL) was added to each well after incubation for 24, 48 and 72 hrs. Then, the plates were further incubated for 4 hrs. Before 150 μL DMSO was added, the wells were shaken for 5 mins, and all of the culture medium was removed. The absorbance of each sample was evaluated at 490 nm.
Cellular uptake of complexes
To study the cellular uptake of complexes, PEI was labeled with FITC. HepG2 cells and 4T1 cells were seeded in 6-well plates (5×10⁵ cells per well) overnight to allow attachment, respectively. Then, the plates were cultured with PNDs, CPNDs, PCPNDs and FPCPNDs (N/P=15, weight ratio of FA-PEG-CCTS to PEI was 10) for 4 hrs, respectively. Cells treated free pDNA were set as control. The cells were washed twice with precooled PBS, trypsinized and resuspended. Finally, the samples were detected by BD flow cytometer.
Intracellular trafficking study
Laser scan confocal microscope (LSCM; Olympus, Tokyo, Japan) was used to evaluate the intracellular trafficking of FPCPNDs. 4T1 cells were seeded into 6-well plates (5×10⁴ cells per well) and incubated for 24 hrs. FPCPNDs (10 μg/mL) were added into wells at different time points, respectively. The cells were mixed with 50 nM Lysotracker Red for 30 mins and washed with PBS three times. Then, the plates were treated with Hoechst 33258 (10 μg/mL). The images were observed by LSCM (Olympus).
In vitro transfection
4T1 cells were seeded into 6-well plates (1×10⁵ cells per well) and incubated in RPMI 1640 medium overnight to allow attachment. Then, medium was displaced by serum-free medium prior to adding the 120 μL complexes containing 0.5 μg pEGFP-C1 plasmid. After 4 hrs incubation, the medium was replaced with fresh medium. After an incubation for another 24 hrs, plates were washed with precooled PBS and treated with Hoechst 33258 (10 μg/mL) for 0.5 hrs. The transfection of green fluorescence protein (GFP) was determined by LSCM. For luciferase activity assay, the pGL-3 plasmid was used as the reporter gene. Luciferase gene expression was quantified with Luciferase Assay System (Promega) and a luminometer (Tecan, Switzerland).
In vivo transfection
Female BALB/c mice were injected with 4T1 cell suspension (5×10⁶ cells in 0.2 mL PBS) which was subcutaneously inoculated into the right axillary fossa of mice. When the tumor reached approximately 100 mm3, different formulations (0.2 mL) were injected via the tail vein at a dosage of 5 μg pDsRed-M-N1 plasmid per tumor-bearing mouse, respectively. The expression of pDsRed-M-N1 was examined by IVIS image system (Carestream Health, Rochester, NY, USA) after 24 hrs of injection.
In vivo antitumor activity studies
In the present study, tumor suppressor p53 gene was introduced to investigate the in vivo antitumor study. Tumor-bearing mice were randomly separated into 5 groups (n=6): saline, free p53, PNDs, PCPNDs and FPCPNDs groups. Mice were injected with 0.2 mL of formulation via the tail vein every 2 days for 5 times, while the dosage of p53 gene was 3 mg/kg. The body weight and tumor size of the mice were measured every 2 days. The tumor volume was calculated as follows:

At the 14th day, all mice were sacrificed. The tumors were harvested and weighed. The inhibition rate (IR%) was calculated according to the following formula:

where Ws and Wt represent the tumor weight of control group and treatment group, respectively. Then, p53 protein expression in tumors was analyzed by Western blotting. Meanwhile, tumor tissues were fixed, embedded and cut into slides. The slides were stained using H&E.
Statistics
Data are presented as mean ± SD of at least five independent samples and each measurement was performed in triplicate. Statistical analysis was determined using Student’s t-test. ***P<0.001, **P<0.01 and *P<0.05 were applied for revealing statistical significance.
Results and discussion
Characteristics of FA-PEG-CCTS and preparation of FPCPNDs
FA-PEG-CCTS was characterized by 1H NMR. In the spectrum (Figure S2), the signals in accordance with PEG (δ=3.23–3.60 ppm), CCTS (δ=2.39, 3.43, 4.50 ppm), and FA (δ=8.65, 7.65, 6.64, 4.49 ppm) were detectable, suggesting FA-PEG-CCTS conjugates were successfully prepared. In the present study, we designed a core–shell structure, which consisted anionic FA-PEG-CCTS shell and cationic PEI/NLS/pDNA (PNDs) core, to be a versatile gene delivery FA-PEG-CCTS/PEI/NLS/pDNA (FPCPNDs). FPCPNDs were prepared via the electrostatic interaction. NLS peptides have the ability to interact with the nucleus transport system to facilitate the transfection of plasmid DNA. Herein, NLS was incorporated with plasmid DNA and PEI to form ternary complexes PNDs. There is no doubt that PEI provided the prime surface charge of PNDs and supported the electrostatic adsorption to the negatively charged FA-PEG-CCTS conjugates, accordingly forming the FA-PEG-CCTS/PEI/NLS/pDNA complexes (FPCPNDs).
DNA condensation analysis
The pDNA EE% was evaluated by Hoechst 33258 intercalation and gel retardation assay. As illustrated in Figure 2A, the EE% of FPCPNDs exhibited upward trend with the increasing N/P ratio. The EE% of PNDs, CPNDs, PCPNDs and FPCPNDs were all above 90% (N/P ratio above 8) and there was no evident difference among them (P>0.05) (Figure 2B).
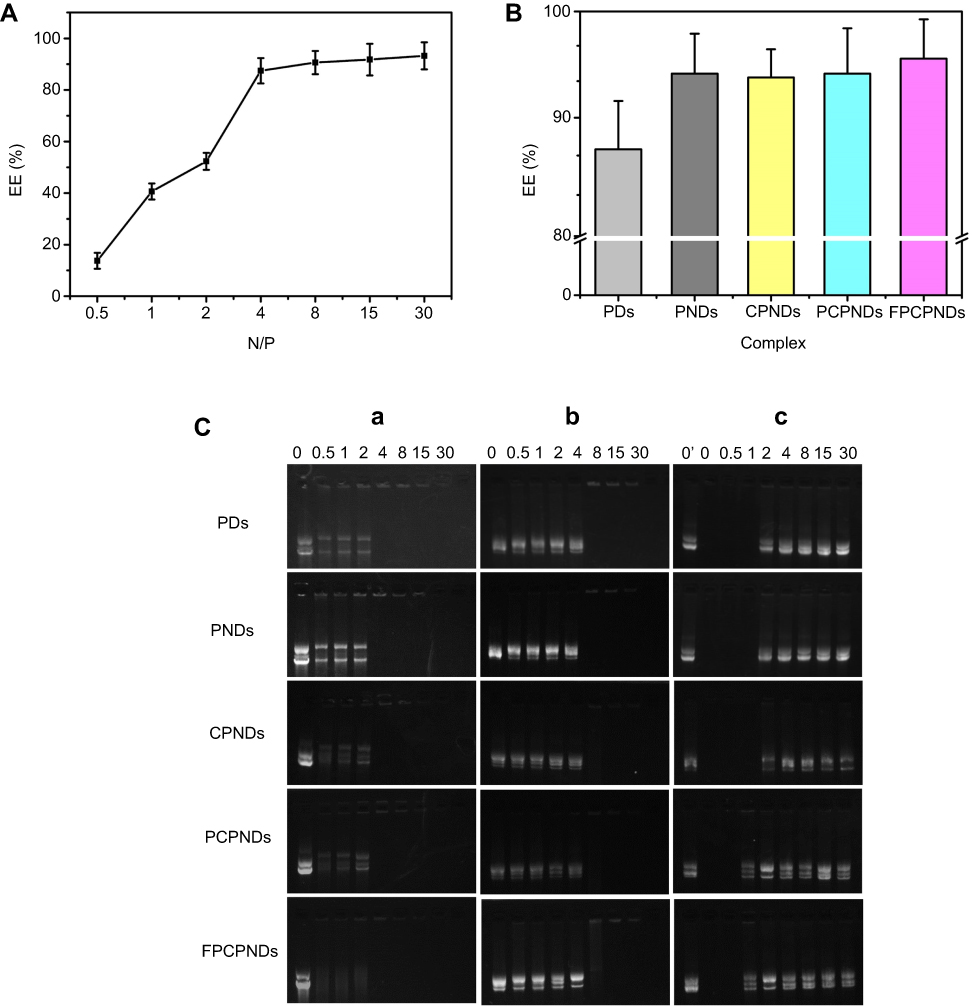 |
Figure 2 DNA condensation and protection of complexes by Hoechst 33258 intercalation and gel retardation assay. Encapsulation efficiency of (A) FPCPNDs at N/P ratios ranging from 0 to 30 (weight ratio of FA-PEG-CCTS to PEI was 10) and (B) encapsulation efficiency of different complexes (fixed N/P ratio at 10, weight ratio of FA-PEG-CCTS to PEI was 10). (C) Stability and DNA protection efficiency of FPCPNDs by electrophoresis. Complexes were tested after being treated with nothing (column a), heparin (column b) and DNase I (column c). In column c, 0ʹ represents naked DNA without DNase I digestion.Abbreviations: FPCPNDs, FA-PEG-CCTS/PEI/NLS/pDNA; PNDs, PEI/NLS/pDNA; PDs, PEI/pDNA; PCPNDs, PEG-CCTS/PEI/NLS/pDNA; CPNDs, CCTS/PEI/NLS/pDNA; FA, folate acid; PEG, polyethylene glycol; CCTS, carboxylated chitosan; PEI, polyethyleneimine; NLS, nuclear localization sequences; EE, encapsulation efficiency. |
Given that the cationic vectors could deprive the motility of pDNA in the electric field, we performed the gel retardation assay to evaluate the binding capability of pDNA. Figure 2C shows that there was no retardation with pDNA alone. It is worthwhile mentioning that the retardation of PDs initiated at an N/P ratio of 4. (Figure 2C, a). pDNA in PDs was substituted by heparin until N/P ratio was above 8 (Figure 2C, b). Moreover, PDs could not be resistant to DNase I digestion until the N/P ratio was above 4 (Figure 2C, c). Conversely, FPCPNDs had the ability to resist DNase I digestion when N/P ratio was above 1, which was better than the other formulations. Hence, our findings lead us to draw the conclusion that chitosan derivatives could condense and protect the pDNA to some extent.
Particle size and ζ-potential measurement
As we all know, particle size and size distribution are key arguments for the design of appropriate nanoparticles; they could influence the targeting capacity and in vivo distribution.38 Meanwhile, suitable size, ζ-potential and morphology of complexes are also essential for benign cellular uptake and excellent gene transfection.39 As illustrated in Figure 3A, when the N/P ratio ranged from 1 to 30, the ζ-potential of PNDs increased from 1.03±0.67 to 25.21±1.75 mV, while particle size decreased from 263.11±8.05 to 69.4±3.54 nm. This indicated that condensation efficiency relied on the proportion of PEI in the preparation. Once the ratio of PEI increased, the compression effect on pDNA enhanced accordingly. In addition, Figure 3B implied ζ-potential and particle size of CPNDs relied on the CCTS segment. In comparison to PNDs, ζ-potential of complexes containing CCTS decreased by ~20 mV, while the size increased by ~95 nm (Figure 3C). Furthermore, there is a distinct size reduction of FPCPNDs when the pH value dropped from 7.4 to 5.5 (Figure 3D), suggesting the electrostatic interaction between FA-PEG-CCTS and PNDs diminished. This was probably attributed to the protonation of carboxyl groups in CCTS under acidic conditions, which facilitated the process of FA-PEG-CCTS conjugates separating from PNDs. The morphology of FPCPNDs was visually confirmed via TEM (Figure 3F). The spherical complexes were in well-defined shapes. While the particle size around 200 nm (Figure 3E and F) could have an enhanced effect on the passive targeting of tumor tissues by the EPR effect. Meanwhile, after incubated with FBS for 24 h, the size of FPCPNDs was stable with no distinct change (Figure S5).
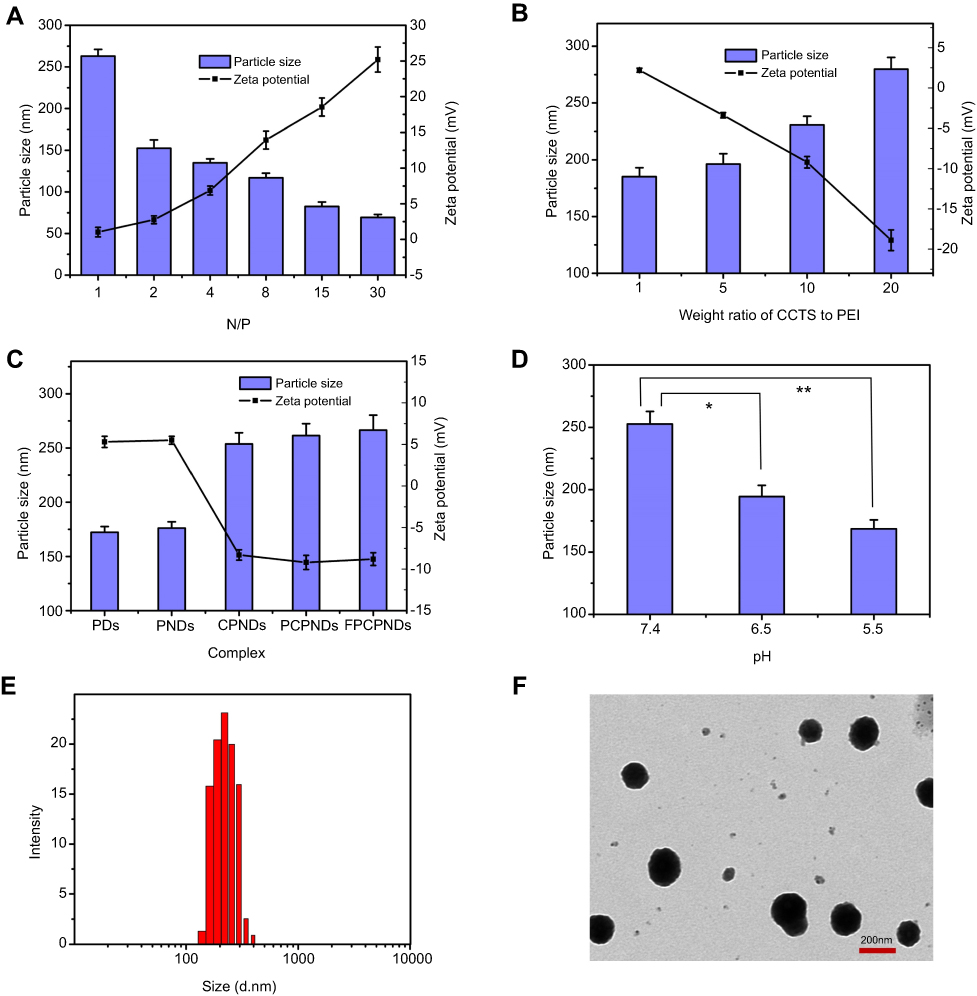 |
Figure 3 Particle size (columns) and ζ-potential (lines) assessments of complexes. (A) PNDs at N/P ratios ranging from 1 to 30, (B) CPNDs at different weight ratios of CCTS to PEI ranging from 1 to 20, (C) FPCPNDs and its reference formulations, (D) FPCPNDs at pH 7.4, 6.0 and 5.5 were examined. (E) Histogram of particle size distribution of prepared FPCPNDs (N/P was 15; weight ratio of FA-PEG-CCTS to PEI was 10, pH 7.4). (F) TEM image of FPCPNDs (N/P was 15; weight ratio of FA-PEG-CCTS to PEI was 10, pH 7.4). *P<0.05, **P<0.01.Abbreviations: FPCPNDs, FA-PEG-CCTS/PEI/NLS/pDNA; PND, PEI/NLS/pDNA; PDs, PEI/pDNA; PCPNDs, PEG-CCTS/PEI/NLS/pDNA; CPNDs, CCTS/PEI/NLS/pDNA; FA, folate acid; PEG, polyethylene glycol; CCTS, carboxylated chitosan; PEI, polyethyleneimine; NLS, nuclear localization sequences; TEM, transmission electron microscopy. |
It is generally accepted that ζ-potential of gene delivery system was usually more than 20 mV.40 The positive surface charge may lead to aggregation, nonspecific interaction with cells, adsorption to plasma proteins, cytotoxicity and recognition by the immune system.41,42 By taking the above matters into account, we coated PNDs with negatively charged CCTS for the sake of preventing the nonspecific interaction. CCTS modified with PEG chains can protect complexes from being recognized by RES, thereby increasing the circulation time and accordingly enhancing the tumor accumulation via the EPR effect.43
Immunogenicity study
As previously reported, IL-12, a 70-kDa heterodimeric cytokine, was demonstrated to activate inflammatory and immune responses.44 IFN-β, a glycoprotein secreted by leukocytes and fibroblasts, is considered to exert immunomodulatory effects.45 Therefore, IL-12 and IFN-β can be considered as indicators to detect immunogenicity. Herein, we detect the content change of IL-12 and IFN-β in blood in order to check the immunogenicity of FPCPNDs (pEGFP-C1 was set as model DNA). After intravenous injection, the concentrations of IL-12 and IFN-β in blood were detected, respectively. FPCPNDs showed similar content with saline (Figure 4A and B). As far as we know, the IL-12 family of cytokines plays as an immunological leader, shaping immune responses by directly inducing the development of T cells and altering the function of many cell populations that command disease result.46 Therefore, the result indicates that FPCPNDs has low immunogenicity as a gene carrier.
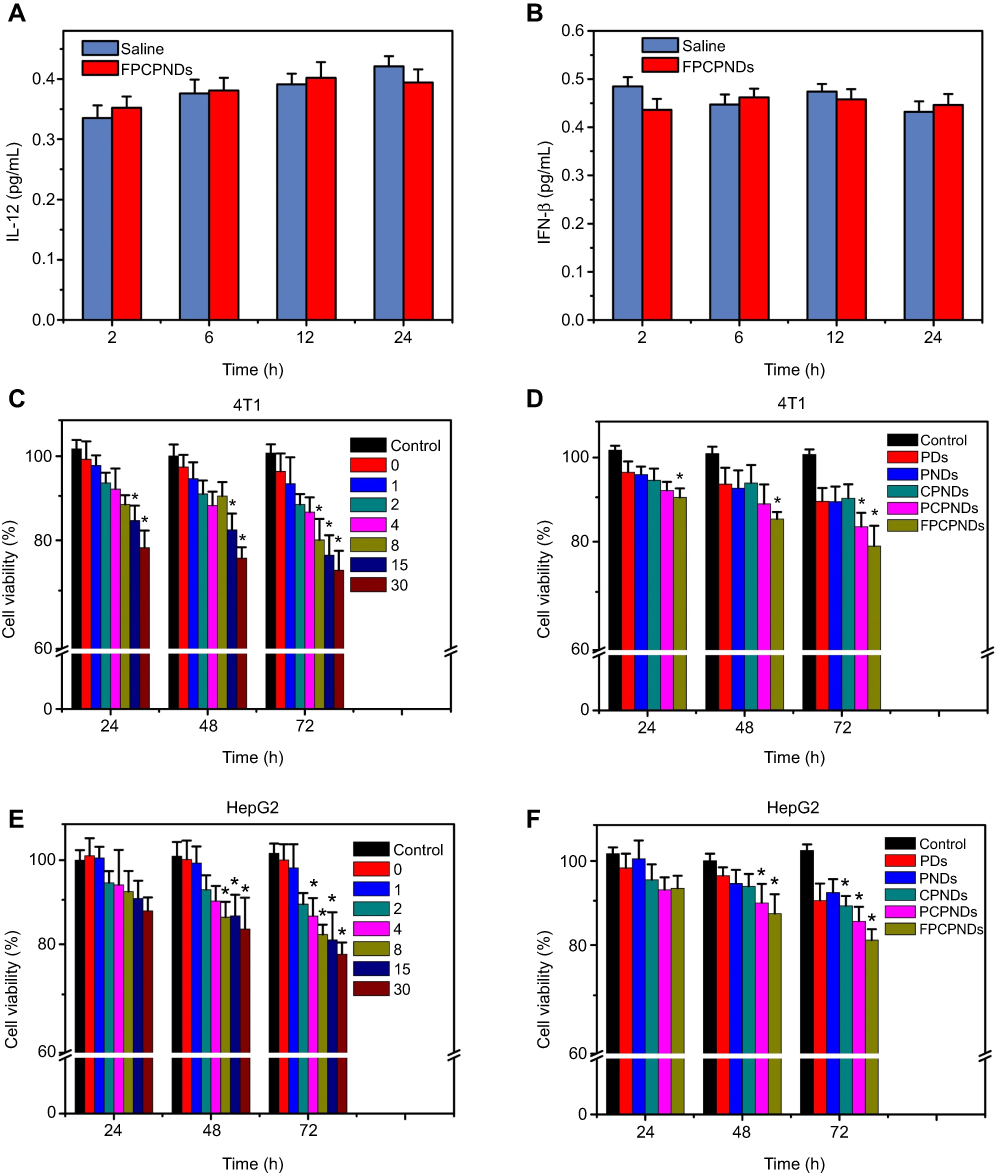 |
Figure 4 Evaluation of immunogenicity in vivo and cytotoxicity in vitro. The content change of (A) IL-12 and (B) IFN-β in mice after injected with FPCPNDs (N/P=15). In vitro cytotoxicity study of (C, E) FPCPNDs at different N/P ratios, and (D, F) different formulations at an N/P ratio of 15 against HepG2 and 4T1 cells by MTT assay. *P<0.05. Abbreviations: FPCPNDs, FA-PEG-CCTS/PEI/NLS/pDNA; PND, PEI/NLS/pDNA; PDs, PEI/pDNA; PCPNDs, PEG-CCTS/PEI/NLS/pDNA; CPNDs, CCTS/PEI/NLS/pDNA; FA, folate acid; PEG, polyethylene glycol; CCTS, carboxylated chitosan; PEI, polyethyleneimine; NLS, nuclear localization sequences; IFN-β, interferon-β. |
Cytotoxicity of FPCPNDs in vitro
Besides transfection efficiency, cytotoxicity is another significant factor to be deliberated during the design of gene carriers. Herein, cytotoxicity of FPCPNDs and reference formulations were investigated on HepG2 and 4T1 cells by the MTT assay. As illustrated in Figure 4C, while the N/P ratio was above 15 at 24 hrs, an obvious difference (P<0.05) was found in 4T1 cells, implying that FPCPNDs had more cytotoxic to 4T1 cells at the same time point. On the contrary, FPCPNDs exhibited no significant cytotoxicity in HepG2 cells at 24 hrs (P>0.05, Figure 4E). Similarly, no remarkable difference was found between each preparation against HepG2 cells at 24 hrs (P>0.05) (Figure 4F), while FPCPNDs were apparently more cytotoxic than PNDs against 4T1 cells (P<0.05). Notably, FPCPNDs exhibited more cytotoxic than reference preparations against 4T1 cells at all time points (Figure 4D). Increased cytotoxicity of FPCPNDs could be ascribed to the FR-mediated endocytosis.47 What needs to be pointed out is that the cell viability was still over 70% even if treated with FPCPNDs (N/P=30) for 72 hrs, implying that FPCPNDs is a low cytotoxicity gene delivery system.
Cell uptake study
HepG2 and 4T1 cells were cultured to research the cellular uptake of FITC-labeled complexes. The mean fluorescence intensity of various formulations was measured by flow cytometry. As illustrated in Figure 5A–B, FPCPNDs showed stronger fluorescent signal than PCPNDs in FR-positive 4T1 cells (P<0.05), indicating FA-mediated targeting enhanced the cellular uptake of FPCPNDs. In contrast, there was no significant difference among CPNDs, PCPNDs and FPCPNDs in FR-negative HepG2 cells (P>0.05) (Figure 5C–D). Therefore, it could be speculated that the FA segment might promote the cellular uptake of FPCPNDs via the FR-modified endocytosis. It should be pointed out that the influence of FA on cellular uptake and transfection needs further verification.
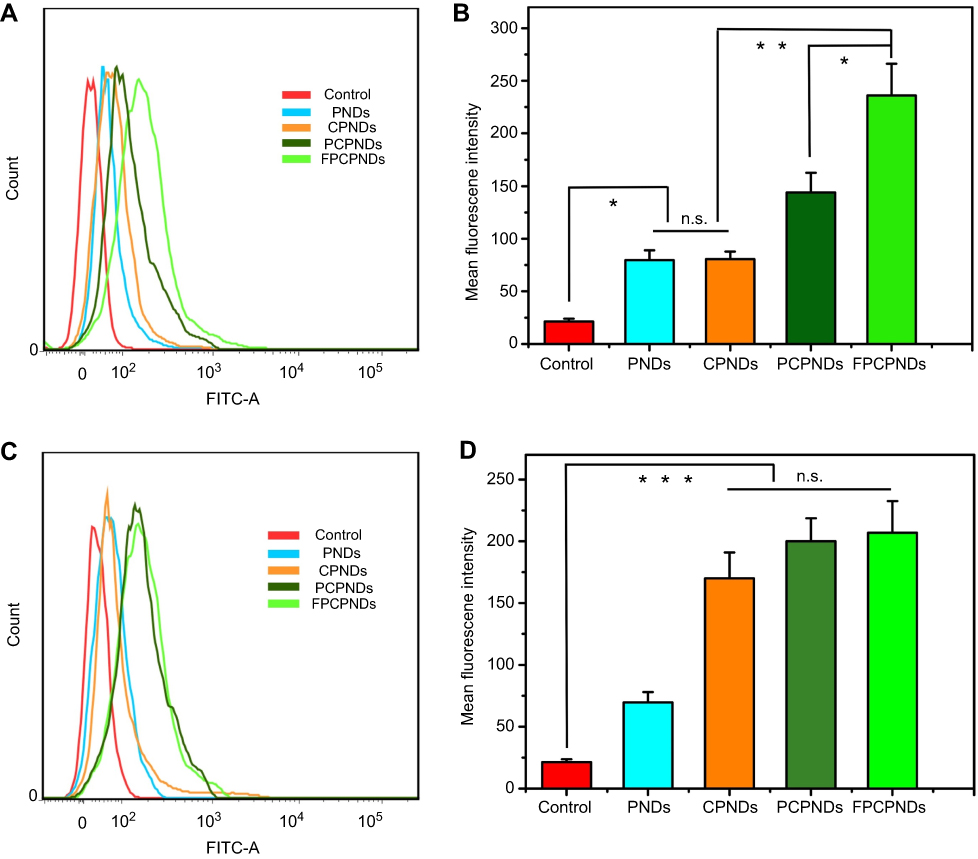 |
Figure 5 Flow cytometry measurement of the cellular uptake of different formulations against 4T1 cells (A, B) and HepG2 cells (C, D). *P<0.05, **P<0.01, and ***P<0.001.Abbreviations: FPCPNDs, FA-PEG-CCTS/PEI/NLS/pDNA; PND, PEI/NLS/pDNA; PDs, PEI/pDNA; PCPNDs, PEG-CCTS/PEI/NLS/pDNA; CPNDs, CCTS/PEI/NLS/pDNA; FA, folate acid; PEG, polyethylene glycol; CCTS, carboxylated chitosan; PEI, polyethyleneimine; NLS, nuclear localization sequences; FITC, fluorescein isothiocyanate; n.s., not significant. |
Intracellular trafficking
After successful cellular internalization, endosomal escape is a major intracellular barrier for DNA delivery.48 To explore the intracellular distribution of complexes, we used FITC to label FPCPNDs. As illustrated in Figure 6, nucleus and lysosomes were labeled with blue and red fluorescence separately. At 0.5 hr, part of FPCPNDs had already entered the cells, the yellow fluorescence merged by red and green color was clearly seen. However, the quantity and intensity of yellow fluorescence gradually decreased at 1 hr. At 4 hrs, only little yellow fluorescence was visible. In addition, the green fluorescence was partly superposed with the nucleus. This interesting phenomenon indicated that FPCPNDs were captured in endosomes first, escaped later and consequently transported to the nucleus. The quick endosomal escape could be caused by the “proton sponge” effect of PEI, resulting in the release of carriers. Herein, FA-PEG-CCTS was coated on the surface of PNDs. The pKa value of FA-PEG-CCTS conjugates was determined to be around 6.0 through acid–base titration (Figure S3) and the buffering capacity was shown in Table S1. Consequently, the carboxyl groups of CCTS would be protonated in the acidic endosome environment and separate from PNDs, leading to a relatively smaller size for endosomal escape.
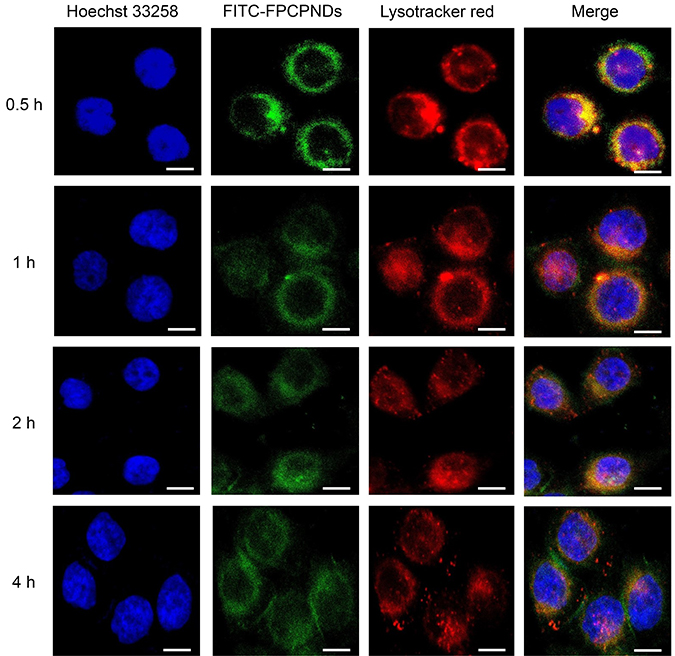 |
Figure 6 Intracellular trafficking of FPCPNDs in 4T1 cells at different time intervals, scale bar =20 μm. The fluorescence signals were examined by LSCM with three channels: blue fluorescence from nuclei stained with Hoechst 33258, green fluorescence from FITC-labeled FPCPNDs and red fluorescence from the lysotracker stained endo-lysosomes (colocalization indicated by yellow fluorescence).Abbreviations: FPCPNDs, FA-PEG-CCTS/PEI/NLS/pDNA; PND, PEI/NLS/pDNA; FA, folate acid; PEG, polyethylene glycol; CCTS, carboxylated chitosan; PEI, polyethyleneimine; NLS, nuclear localization sequences; FITC, fluorescein isothiocyanate; LSCM, laser scan confocal microscope. |
In vitro transfection
It is widely reported that valid transfection of complexes is obligatory for gene delivery. Herein, LSCM was used to evaluate the in vitro transfection and expression of GFP. After treated with PNDs for 24 hrs, the fluorescence intensity enhanced when the N/P ratio raised from 1 to 15 (Figure 7A). Nevertheless, the fluorescence intensity slightly decreased while the N/P ratio was up to 30. This phenomenon was possibly due to the excessive compression by PEI. pDNA could not completely dissociate from the complexes, thus affecting gene expression. Similar result was found in the luciferase activity study (Figure 7C). Moreover, as shown in Figure 7B and D, compared with PDs, PNDs exhibited greater gene transfection level (P<0.05). This phenomenon might be ascribed to the presence of NLS peptides. As reported, NLS peptides have been widely applied for gene delivery owing to the capability of improving the nuclear transfer for DNA.49 To further confirm the role of NLS peptides upon transfection, we introduced a scrambled sequence NLS(scr) to form the complex PEI/NLS (scr)/DNA (PN(scr)Ds). As revealed in Figure 7B and D, it is worth noting that PNDs showed a higher transfection efficiency than PN(scr)Ds (P<0.05), which stressed the importance of NLS peptide again. In addition, FPCPNDs exhibited better transfection efficiency than PCPNDs (P<0.05) before our eyes. This result would be attributed to the existence of the FA moiety, which possessed benign combination with FR-positive 4T1 cells. Meanwhile, FPCPNDs showed preferable transfection than positive control group (Lipofectamine 2000, P<0.05). The results above showed that FPCPNDs owned favorable transfection efficiency.
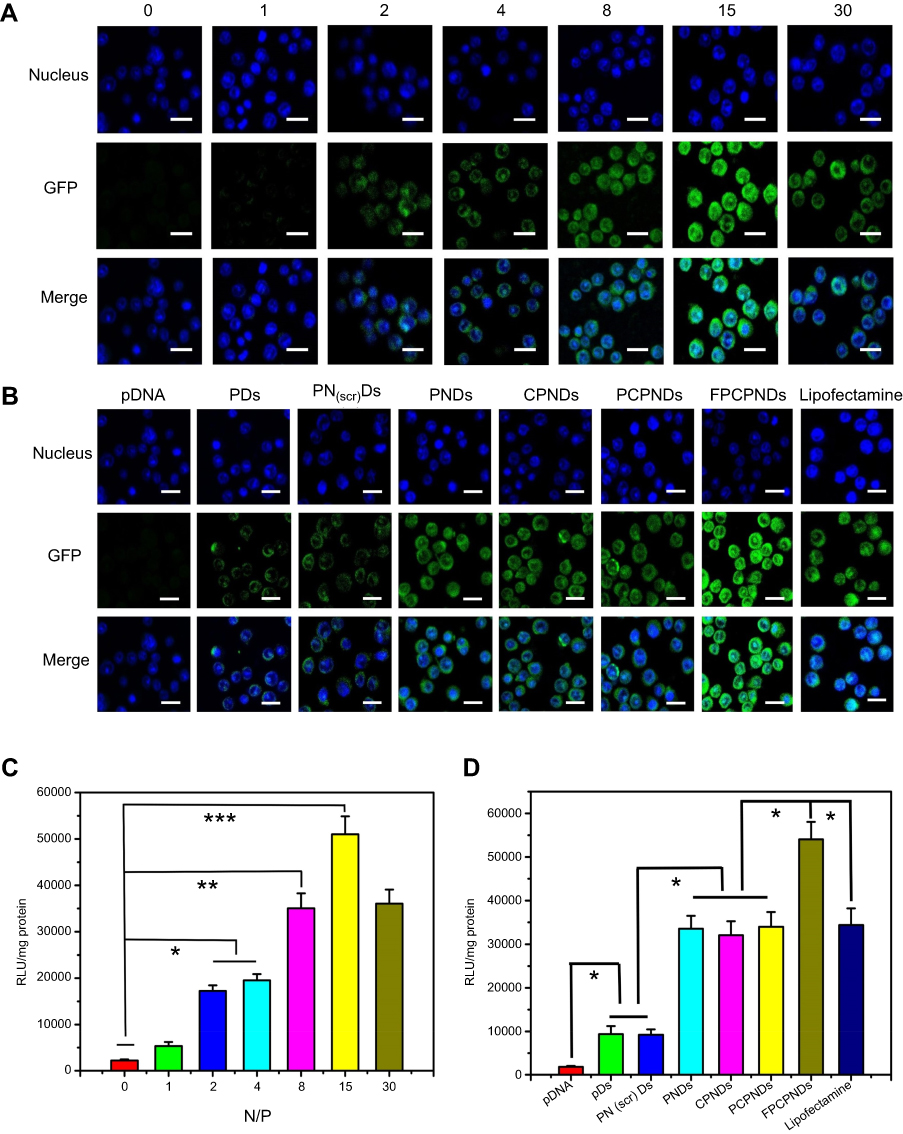 |
Figure 7 In vitro transfection and expression of GFP was analyzed by LSCM and luciferase activity in 4T1 cells. (A, C) FPCPNDs at different N/P ratios for 24 hrs. (B, D) Different complexes at an N/P ratio of 15 for 24 hrs. Results were expressed as mean ± SD (n=3). *P<0.05, **P<0.01, and ***P<0.001. Scale bars =40 µm.Abbreviations: FPCPNDs, FA-PEG-CCTS/PEI/NLS/pDNA; PND, PEI/NLS/pDNA; PDs, PEI/pDNA; PCPNDs, PEG-CCTS/PEI/NLS/pDNA; CPNDs, CCTS/PEI/NLS/pDNA; FA, folate acid; PEG, polyethylene glycol; CCTS, carboxylated chitosan; PEI, polyethyleneimine; NLS, nuclear localization sequences; GFP, green fluorescence protein; LSCM, laser scan confocal microscope. |
Targeting ability of FPCPNDs
To deeply evaluate the targeting ability of FPCPNDs, HepG2 and 4T1 cells were treated with FPCPNDs in medium without or with free FA, respectively. There is no denying that luciferase activity in 4T1 cells treated with FPCPNDs was higher than that in HepG2 cells (P<0.001) (Figure 8B). Additionally, as shown in Figure 8A, only little green fluorescence was visible, which indicated only a small amount of GFP expressed in HepG2 cells. Oppositely, GFP in 4T1 cells exhibited an intense green fluorescence. When treated with 1 mM FA, the fluorescence obviously disappeared and there was no significant difference between HepG2 and 4T1 cells (P>0.05). In addition, there was rare expression under the free FA condition (P>0.05) (Figure 8B). The interesting phenomenon demonstrated FPCPNDs showed higher expression in FR-positive 4T1 cells than that in FR-negative HepG2 cells.
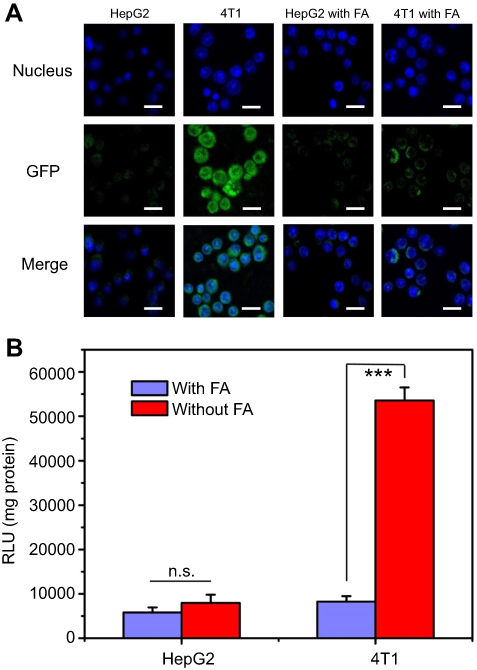 |
Figure 8 Targeting ability of FPCPNDs and competitive inhibition of free folic acid. (A) Fluorescence intensity of GFP expressed in HepG2 and 4T1 cells treated with FPCPNDs, with or without the presence of free folic acid. Cells were treated with 1 mM folic acid medium or folic acid-free medium before incubating with FPCPNDs. Scale bar in all pictures indicates 40 µm. (B) Luciferase activity. ***P<0.001.Abbreviations: FPCPNDs, FA-PEG-CCTS/PEI/NLS/pDNA; FA, folate acid; PEG, polyethylene glycol; CCTS, carboxylated chitosan; PEI, polyethyleneimine; NLS, nuclear localization sequences; GFP, green fluorescence protein; n.s., not significant. |
In vivo expression of FPCPNDs
From the in vitro assays above, we found FPCPNDs possessed favorable tumor-targeting ability and transfection efficiency. To evaluate whether these features would be fulfilled in vivo, the expressed efficiency of red fluorescence protein (RFP) in tumor-bearing mice was investigated by NIR fluorescence imaging system at 24 hrs post-administration. Figure 9 exhibits the images, which were treated with various formulations containing 5 μg plasmid pDs-Red-M-N1 into 4T1 tumor-bearing mice, respectively. There is an evident difference among FPCPNDs and reference formulations. As we can see, PDs group showed no fluorescence, while PNDs group exhibited little fluorescence in the tumor. This results could be attributed to the relative instability of PNDs in vivo, they may aggregate with to plasma proteins, nonspecific interact with cells, or be recognized and cleared by RES. In comparison with PNDs, CPNDs and PCPNDs groups, the RFP expression of FPCPNDs group remarkably enhanced in tumor tissue, suggesting the excellent tumor targeting ability and desirable feature for long-term gene therapy. For FPCPNDs, CCTS modified with PEG chains could protect complexes from recognized by RES, thereby increasing the circulation time and accordingly enhancing the tumor accumulation via the EPR effect. Meanwhile, FPCPNDs had the capability of actively targeting tumor cells due to the existence of FA.
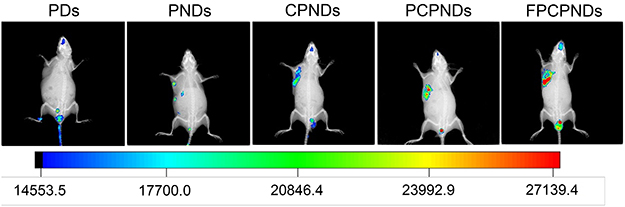 |
Figure 9 In vivo image of RFP gene expression delivered by FPCPNDs and its reference formulations injected into bearing 4T1 tumor xenografts BALB/c mice monitored by an NIR fluorescence imaging system 24 hrs after injection.Abbreviations: FPCPNDs, FA-PEG-CCTS/PEI/NLS/pDNA; PND, PEI/NLS/pDNA; PCPNDs, PEG-CCTS/PEI/NLS/pDNA; PDs, PEI/pDNA; CPNDs, CCTS/PEI/NLS/pDNA; FA, folate acid; PEG, polyethylene glycol; CCTS, carboxylated chitosan; PEI, polyethyleneimine; NLS, nuclear localization sequences; RFP, red fluorescence protein. |
In vivo antitumor activity
Female BALB/c mice bearing 4T1 tumor xenografts were used to evaluate the in vivo antitumor activity of complexes. As shown in Figure 10A, all groups showed no remarkable difference in tumor volume in the first few days, while treatment groups exhibited growth inhibition after 4 days. We measured and weighed tumors (Figure 10C), and then calculated the IR%. There was no obvious difference between free p53 group and saline group (Figure 10D). Most probably, the naked pDNA would be readily degraded in the blood circulation and thus had an indistinctive effect on tumors. PCPNDs group showed moderate antitumor efficiency (IR%=47.3%), such a result thus demonstrated that the PEG-CCTS shell could avoid the clearance by RES to some extent. In contrast, FPCPNDs displayed a highest inhibition rate (IR%=59.6%), this could due to the presence of the FA moiety, which stressed the importance of FA moiety on tumor targeting. As far as we know, the changes in body weight are regarded as a direction for safety. As shown in Figure 10B, the body weight of treatment groups was heavier than the saline group, suggesting the excellent compatibility of complexes. To prove that the tumor growth inhibition was attributed to p53 gene, p53 protein expression in tumors was detected by Western blotting. As shown in Figure 10E and F, there was an obvious up-regulation in the p53 protein expression level,which was consistent with the result in vitro (Figure S4). FPCPNDs group was 6.7-fold higher than the control group, where tumors were treated with saline. Furthermore, H&E staining was used to analyze the histological changes. Figure 10G illustrates that FPCPNDs had the largest apoptosis/necrosis region in comparison with other formulations.
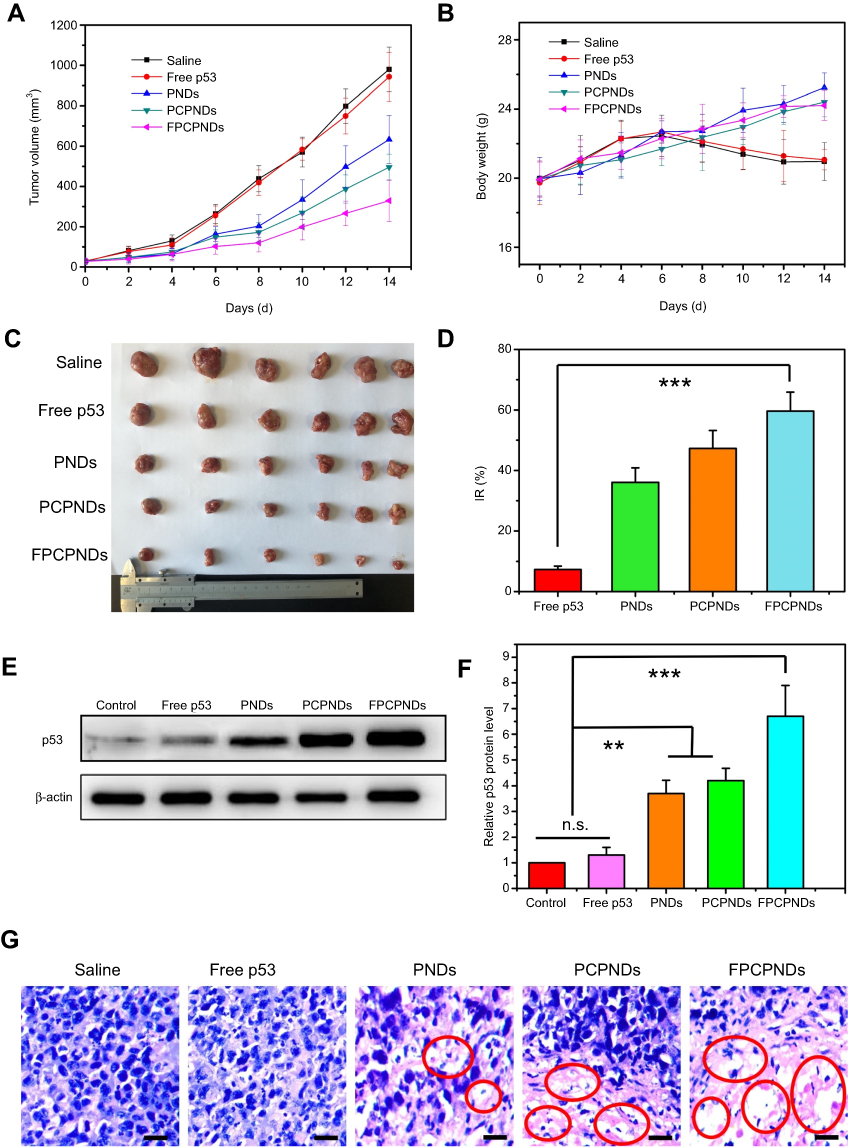 |
Figure 10 In vivo antitumor activity. The mean (A) tumor volume, (B) body weight, (C) tumor graph and (D) inhibition rate of BALB/c mice bearing 4T1 tumor xenografts, after intravenous administration of saline, free p53, PNDs, PCPNDs and FPCPNDs (n=6). (E, F) Western blotting analysis of p53 protein expression in tumor xenografts transfected with different formulations, while tumors treated with PBS were served as control. (G) H&E staining of tumors of different groups. Blue and pink represent nucleic and cytoplasm, respectively. Red circle indicated apoptosis/necrosis regions and scale bars represent 100 μm. **P<0.01 and ***P<0.001.Abbreviations: FPCPNDs, FA-PEG-CCTS/PEI/NLS/pDNA; PND, PEI/NLS/pDNA; PCPNDs, PEG-CCTS/PEI/NLS/pDNA; FA, folate acid; PEG, polyethylene glycol; CCTS, carboxylated chitosan; PEI, polyethyleneimine; NLS, nuclear localization sequences; n.s., not significant. |
Conclusion
In this paper, a multifunctional endosome acidity-induced sheddable gene delivery system was successfully constructed. FPCPNDs promoted the circulation time and accumulated in tumor tissues through the EPR effect. Then, FPCPNDs actively targeted tumor cells because of high-affinity interactions between FA and highly expressed FR, accordingly enhancing the cellular uptake. In the acidic endosomes, FA-PEG-CCTS segment dissociated from PNDs and then PNDs realized endosomes escape through the proton sponge effect of PEI. Furthermore, FPCPNDs exhibited admirable transfection efficiency with the help of NLS. In vivo antitumor study demonstrated FPCPNDs possessed the highest therapeutical effect and p53 protein expression level among all preparations. The favorable targeting ability and transfection efficiency in vitro and in vivo imply that this novel carrier is a suitable strategy for gene delivery.
Disclosure
The authors report no conflicts of interest in this work.
References
1. Kanasty R, Dorkin JR, Vegas A, Anderson D. Delivery materials for siRNA therapeutics. Nat Mater. 2013;12:967. doi:10.1038/nmat3765
2. Akinc A, Zumbuehl A, Goldberg M, et al. A combinatorial library of lipid-like materials for delivery of RNAi therapeutics. Nat Biotechnol. 2008;26:561. doi:10.1038/nbt1402
3. Jiepin Y, Qiang Z, Hong C, Yiyun C. Surface-engineered dendrimers in gene delivery. Chem Rev. 2015;115(11):5274–5300. doi:10.1021/cr500542t
4. Zhou D, Cutlar L, Gao Y, et al. The transition from linear to highly branched poly(β-amino ester)s: branching matters for gene delivery. Sci Adv. 2016;2(6):e1600102–e1600102. doi:10.1126/sciadv.1600375
5. Jordan JG, Robert L, Daniel G. A combinatorial polymer library approach yields insight into nonviral gene delivery. Acc Chem Res. 2008;41(6):749–759. doi:10.1021/ar7002336
6. Chen C, Zheng P, Cao Z, et al. PEGylated hyperbranched polyphosphoester based nanocarriers for redox-responsive delivery of doxorubicin. Biomater Sci. 2016;4(3):412–417. doi:10.1039/c5bm00440c
7. Islam MA, Reesor EKG, Xu Y, Zope HR, Zetter BR, Shi J. Biomaterials for mRNA delivery. Biomater Sci. 2015;3(12):1519–1533. doi:10.1039/c5bm00198f
8. Lv H, Zhang S, Wang B, Cui S, Yan J. Toxicity of cationic lipids and cationic polymers in gene delivery. J Control Release. 2006;114(1):100–109. doi:10.1016/j.jconrel.2006.04.014
9. Luo D, Saltzman WM. Synthetic DNA delivery systems. Nat Biotechnol. 2000;18:33. doi:10.1038/79501
10. Zhang J, Wang C, Lu M, et al. Intracellular distribution and internalization pathways of guanidinylated bioresponsive poly(amido amine)s in gene delivery. Asian J Pharm Sci. 2018;13(4):360–372. doi:10.1016/j.ajps.2018.02.008
11. Wang M, Liu H, Li L, Cheng Y. A fluorinated dendrimer achieves excellent gene transfection efficacy at extremely low nitrogen to phosphorus ratios. Nat Commun. 2014;5:3053. doi:10.1038/ncomms5972
12. Pierrat P, Wang R, Kereselidze D, et al. Efficient in vitro and in vivo pulmonary delivery of nucleic acid by carbon dot-based nanocarriers. Biomaterials. 2015;51:290–302. doi:10.1016/j.biomaterials.2015.02.017
13. Zhou J, Liu J, Cheng CJ, et al. Biodegradable poly(amine-co-ester) terpolymers for targeted gene delivery. Nat Mater. 2011;11:82. doi:10.1038/nmat3187
14. Nam J-P, Nah J-W. Target gene delivery from targeting ligand conjugated chitosan–PEI copolymer for cancer therapy. Carbohydr Polym. 2016;135:153–161. doi:10.1016/j.carbpol.2015.08.053
15. Nia AH, Amini A, Taghavi S, Eshghi H, Abnous K, Ramezani M. A facile Friedel–Crafts acylation for the synthesis of polyethylenimine-grafted multi-walled carbon nanotubes as efficient gene delivery vectors. Int J Pharm. 2016;502(1):125–137. doi:10.1016/j.ijpharm.2016.02.034
16. Zhang X, Tang W, Yang Z, et al. PEGylated poly(amine-co-ester) micelles as biodegradable non-viral gene vectors with enhanced stability, reduced toxicity and higher in vivo transfection efficacy. J Mater Chem B. 2014;2(25):4034–4044. doi:10.1039/c4tb00439f
17. Qiao Y, Huang Y, Qiu C, et al. The use of PEGylated poly [2-(N,N-dimethylamino) ethyl methacrylate] as a mucosal DNA delivery vector and the activation of innate immunity and improvement of HIV-1-specific immune responses. Biomaterials. 2010;31(1):115–123. doi:10.1016/j.biomaterials.2009.09.032
18. Huang R-Q, Qu Y-H, Ke W-L, Zhu J-H, Liu Y, Jiang C. Efficient gene delivery targeted to the brain using a transferrin-conjugated polyethyleneglycol-modified polyamidoamine dendrimer. Faseb J. 2007;21(4):1117–1125. doi:10.1096/fj.06-7380com
19. Hatakeyama H, Akita H, Harashima H. A multifunctional envelope type nano device (MEND) for gene delivery to tumours based on the EPR effect: a strategy for overcoming the PEG dilemma. Adv Drug Deliv Rev. 2011;63(3):152–160. doi:10.1016/j.addr.2010.09.001
20. Gu J, Wang X, Jiang X, et al. Self-assembled carboxymethyl poly (l-histidine) coated poly (β-amino ester)/DNA complexes for gene transfection. Biomaterials. 2012;33(2):644–658. doi:10.1016/j.biomaterials.2011.09.076
21. Hashida M, Mahato RI, Kawabata K, Miyao T, Nishikawa M, Takakura Y. Pharmacokinetics and targeted delivery of proteins and genes. J Control Release. 1996;41(1):91–97. doi:10.1016/0168-3659(96)01360-0
22. Jevprasesphant R, Penny J, Jalal R, Attwood D, McKeown NB, D’Emanuele A. The influence of surface modification on the cytotoxicity of PAMAM dendrimers. Int J Pharm. 2003;252(1):263–266.
23. He C, Yin L, Tang C, Yin C. Size-dependent absorption mechanism of polymeric nanoparticles for oral delivery of protein drugs. Biomaterials. 2012;33(33):8569–8578. doi:10.1016/j.biomaterials.2012.07.063
24. Elechalawar CK, Sridharan K, Pal A, et al. Cationic folate-mediated liposomal delivery of bis-arylidene oxindole induces efficient melanoma tumor regression. Biomater Sci. 2017;5(9):1898–1909. doi:10.1039/c7bm00405b
25. Wu B, Yu P, Cui C, et al. Folate-containing reduction-sensitive lipid–polymer hybrid nanoparticles for targeted delivery of doxorubicin. Biomater Sci. 2015;3(4):655–664. doi:10.1039/c4bm00462k
26. Soniat M, Chook YM. Nuclear localization signals for four distinct Karyopherin-beta nuclear import systems. Biochem J. 2015;468:353–362. doi:10.1042/BJ20150368
27. Leung HM, Chan MS, Liu LS, et al. Dual-function, cationic, peptide-coated nanodiamond systems: facilitating nuclear-targeting delivery for enhanced gene therapy applications. ACS Sustainable Chem Eng. 2018;6(8):9671–9681. doi:10.1021/acssuschemeng.8b00446
28. Hao X, Li Q, Ali H, et al. POSS-cored and peptide functionalized ternary gene delivery systems with enhanced endosomal escape ability for efficient intracellular delivery of plasmid DNA. J Mater Chem B. 2018;6(25):4251–4263. doi:10.1039/C8TB00786A
29. Alvisi G, Poon IKH, Jans DA, et al. Tumor-specific nuclear targeting: promises for anti-cancer therapy? Drug Resist Updates. 2006;9(1):40–50. doi:10.1016/j.drup.2006.02.003
30. Vogelstein B, Lane D, Levine AJ. Surfing the p53 network. Nature. 2000;408(6810):307–310. doi:10.1038/35042675
31. Levine AJ, Hu W, Feng Z. The P53 pathway: what questions remain to be explored? Cell Death Differ. 2006;13(6):1027. doi:10.1038/sj.cdd.4401910
32. Aliaga C, Bravo-Moraga F, Gonzalez-Nilo D, et al. Location of TEMPO derivatives in micelles: subtle effect of the probe orientation. Food Chem. 2016;192:395–401. doi:10.1016/j.foodchem.2015.07.036
33. Cheng F, Guan X, Cao H, et al. Characteristic of core materials in polymeric micelles effect on their micellar properties studied by experimental and dpd simulation methods. Int J Pharm. 2015;492(1):152–160. doi:10.1016/j.ijpharm.2015.07.031
34. Moraes C, Anjos J, Maruno M, Alonso A, Rocha-Filho P. Development of lamellar gel phase emulsion containing baru oil (Dipteryx alata Vog.) as a prospective delivery system for cutaneous application. Asian J Pharm Sci. 2018;13(2):183–190. doi:10.1016/j.ajps.2017.09.003
35. Rutnakornpituk M, Ngamdee P, Phinyocheep P. Synthesis, characterization and properties of chitosan modified with poly(ethylene glycol)–polydimethylsiloxane amphiphilic block copolymers. Polymer. 2005;46(23):9742–9752. doi:10.1016/j.polymer.2005.08.051
36. Wang H, Zhao P, Liang X, et al. Folate-PEG coated cationic modified chitosan–cholesterol liposomes for tumor-targeted drug delivery. Biomaterials. 2010;31(14):4129–4138. doi:10.1016/j.biomaterials.2010.01.089
37. Liang X, Ren X, Liu Z, et al. An efficient nonviral gene-delivery vector based on hyperbranched cationic glycogen derivatives. Int J Nanomed. 2014. 2014;9:(1):419–435.
38. Han L, Zhou X. Synthesis and characterization of liposomes nano-composite-particles with hydrophobic magnetite as a MRI probe. Appl Surf Sci. 2016;376:252–260. doi:10.1016/j.apsusc.2016.03.164
39. Hu Y, Zhao N, Yu B, Liu F, Xu F-J. Versatile types of polysaccharide-based supramolecular polycation/pDNA nanoplexes for gene delivery. Nanoscale. 2014;6(13):7560–7569. doi:10.1039/c4nr01590h
40. Luo K, Li C, Li L, She W, Wang G, Gu Z. Arginine functionalized peptide dendrimers as potential gene delivery vehicles. Biomaterials. 2012;33(19):4917–4927. doi:10.1016/j.biomaterials.2012.03.030
41. Dash PR, Read ML, Barrett LB, Wolfert MA, Seymour LW. Factors affecting blood clearance and in vivo distribution of polyelectrolyte complexes for gene delivery. Gene Ther. 1999;6:643. doi:10.1038/sj.gt.3300843
42. Plank C, Mechtler K, Szoka F, Wagner E. Activation of the complement system by synthetic DNA complexes: a potential barrier for intravenous gene delivery. Hum Gene Ther. 1996;7(12):1437–1446. doi:10.1089/hum.1996.7.12-1437
43. Kibria G, Hatakeyama H, Sato Y, Harashima H. Anti-tumor effect via passive anti-angiogenesis of PEGylated liposomes encapsulating doxorubicin in drug resistant tumors. Int J Pharm. 2016;509(1):178–187. doi:10.1016/j.ijpharm.2016.05.047
44. Yin H, Kanasty RL, Eltoukhy AA, Vegas AJ, Dorkin JR, Anderson DG. Non-viral vectors for gene-based therapy. Nat Rev Genet. 2014;15:541. doi:10.1038/nrg3763
45. Remoli ME, Giacomini E, Lutfalla G, et al. Selective expression of Type I IFN genes in human dendritic cells infected with mycobacterium tuberculosis. J Immunol. 2002;169:366–374. doi:10.4049/jimmunol.169.1.366
46. Vignali DAA, Kuchroo VK. IL-12 family cytokines: immunological playmakers. Nat Immunol. 2012;13:722. doi:10.1038/ni.2366
47. Sabharanjak S, Mayor S. Folate receptor endocytosis and trafficking. Adv Drug Deliv Rev. 2004;56(8):1099–1109. doi:10.1016/j.addr.2004.01.010
48. Varkouhi AK, Scholte M, Storm G, Haisma HJ. Endosomal escape pathways for delivery of biologicals. J Control Release. 2011;151(3):220–228. doi:10.1016/j.jconrel.2010.11.004
49. Sun Y, Xian L, Xing H, et al. Factors influencing the nuclear targeting ability of nuclear localization signals. J Drug Target. 2016;24(10):927–933. doi:10.1080/1061186X.2016.1184273
Supplementary materials
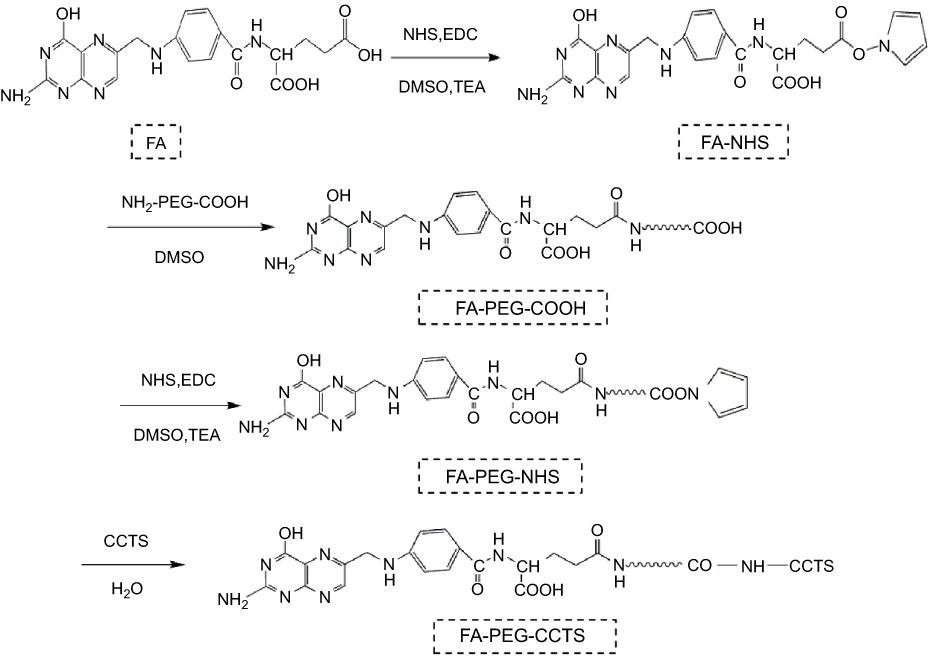 |
Figure S1 Synthesis of FA-PEG-CCTS conjugates.Abbreviations: FA, folate acid; PEG, polyethylene glycol; CCTS, carboxylated chitosan. |
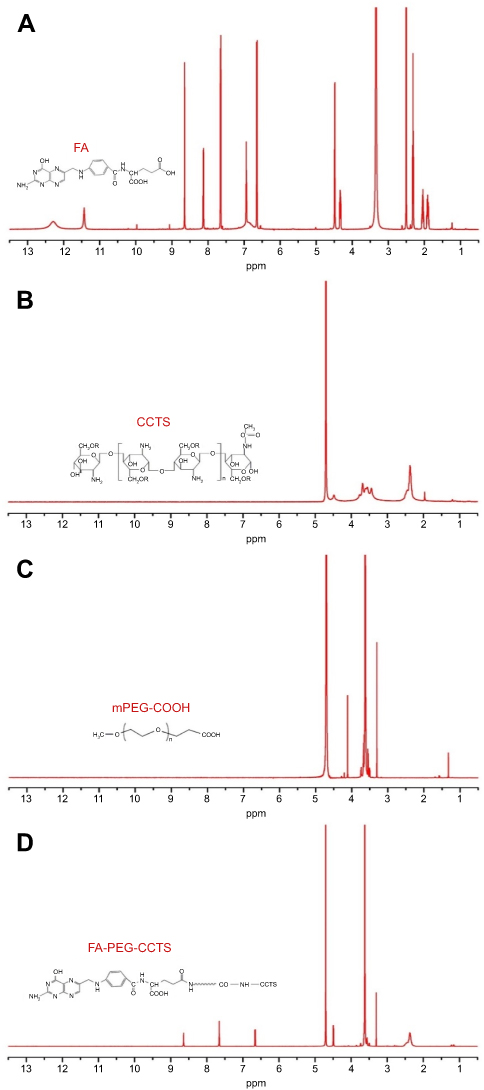 |
Figure S2 1H-NMR analysis of (A) FA, (B) CCTS, (C) mPEG-COOH, and (D) FA-PEG-CCTS.Abbreviations: FA, folate acid; PEG, polyethylene glycol; CCTS, carboxylated chitosan. |
Acid–base titration
The buffering capacity of FA-PEG-CCTS from pH 7.4 to 5.0 was evaluated by acid–base titration. In brief, FA-PEG-CCTS conjugates were dissolved in 0.01 M NaCl (4 mg/mL) and the solution was adjusted to pH 12 with 1 M NaOH. The diluted solution was titrated by the stepwise addition of 0.01 M HCl to obtain the titration profile. The pKa of FA-PEG-CCTS was determined by the primary derivative method and the buffering capacity was defined as the percentage of amino groups from pH 7.4 to 5.0.
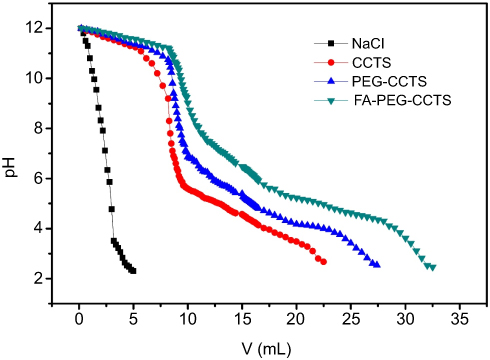 |
Figure S3 Titration curves obtained by titrating aqueous solutions of PEG-CCTS and FA-PEG-CCTS (4 mg/mL) in 0.01 M NaCl (pH 12, adjusted with NaOH) with 0.01 M HCl.Abbreviations: FA, folate acid; PEG, polyethylene glycol; CCTS, carboxylated chitosan. |
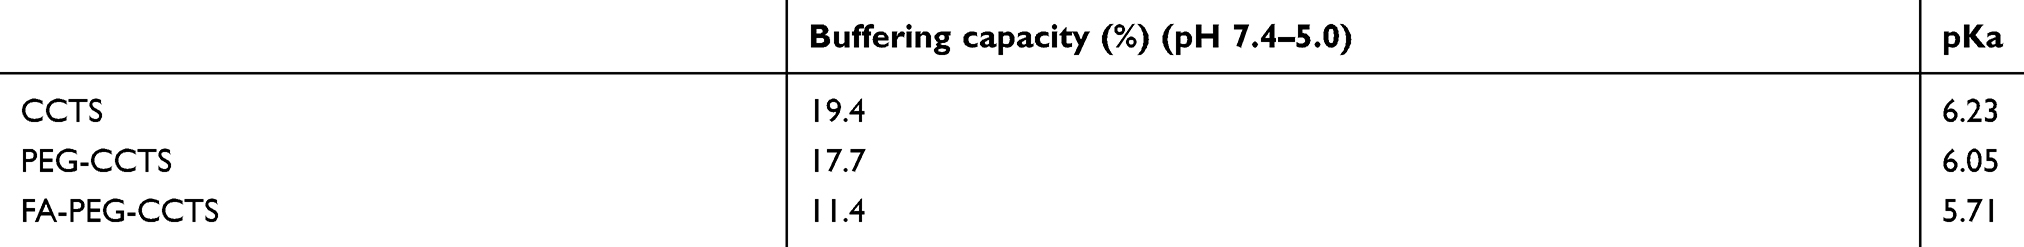 |
Table S1 Buffering capacity and pKa determination by acid–base titration |
Western blotting
To evaluate the p53 protein expression level of FPCPNDs, 4T1 cells (1×10⁵ cells/well) were seeded on glass cover slips in 6-well plates and cultured overnight. FPCPNDs were subsequently added to each well and incubated for 4 hrs. After incubation for 48 hrs, the medium was removed and washed with PBS. Afterward, the cells were collected, followed by RIPA lysed on ice for 30 mins. The lysates were centrifuged at 16,000 r/min for 4 mins and the supernatant was determined with an enhanced BCA protein assay kit. Each sample was adjusted to get an identical protein concentration. In brief, each sample was fractionated and concentrated in the spacer gel during SDS-PAGE. Subsequently, the separated protein bands were electrically transferred onto polyvinylidene difluoride (PVDF) membranes. p53 and β-actin primary antibodies and horseradish peroxidase (HRP) conjugated Goat anti-Rabbit IgG were sequentially incubated with the PVDF membranes. The ECL Western blotting substrate was added onto the PVDF membranes and the designated protein bands were visualized by exposed and photographed with MicroChemi 4.2 Gel Imager (DNR, Israel).
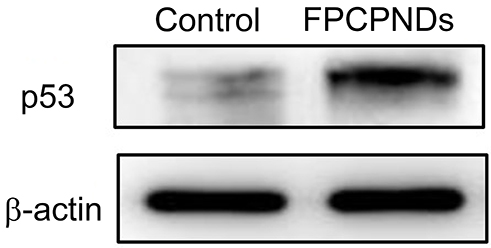 |
Figure S4 The p53 protein expression level of FPCPNDs was examined by Western blotting on 4T1 cells. Cells treated with PBS were set as control.Abbreviations: FPCPNDs, FA-PEG-CCTS/PEI/NLS/pDNA; PND, PEI/NLS/pDNA; PCPNDs, PEG-CCTS/PEI/NLS/pDNA; FA, folate acid; PEG, polyethylene glycol; CCTS, carboxylated chitosan; PEI, polyethyleneimine. |
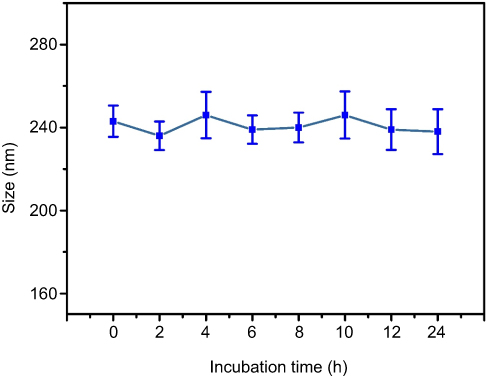 |
Figure S5 Changes in size of the FPCPNDs following incubation with RPMI-1640 medium containing 10% FBS for 24 hrs.Abbreviations: FPCPNDs, FA-PEG-CCTS/PEI/NLS/pDNA; PND, PEI/NLS/pDNA; PCPNDs, PEG-CCTS/PEI/NLS/pDNA; FA, folate acid; PEG, polyethylene glycol; CCTS, carboxylated chitosan; PEI, polyethyleneimine. |
 © 2019 The Author(s). This work is published and licensed by Dove Medical Press Limited. The full terms of this license are available at https://www.dovepress.com/terms.php and incorporate the Creative Commons Attribution - Non Commercial (unported, v3.0) License.
By accessing the work you hereby accept the Terms. Non-commercial uses of the work are permitted without any further permission from Dove Medical Press Limited, provided the work is properly attributed. For permission for commercial use of this work, please see paragraphs 4.2 and 5 of our Terms.
© 2019 The Author(s). This work is published and licensed by Dove Medical Press Limited. The full terms of this license are available at https://www.dovepress.com/terms.php and incorporate the Creative Commons Attribution - Non Commercial (unported, v3.0) License.
By accessing the work you hereby accept the Terms. Non-commercial uses of the work are permitted without any further permission from Dove Medical Press Limited, provided the work is properly attributed. For permission for commercial use of this work, please see paragraphs 4.2 and 5 of our Terms.