Back to Journals » Clinical Epidemiology » Volume 12
A Validation of Methods for the Evaluation of Observational Studies of Screening Mammography: An Exploratory Analysis Based on Simulating Screening Cohorts
Authors Giannakeas V, Sopik V, Narod S
Received 26 June 2020
Accepted for publication 30 September 2020
Published 27 October 2020 Volume 2020:12 Pages 1161—1169
DOI https://doi.org/10.2147/CLEP.S267584
Checked for plagiarism Yes
Review by Single anonymous peer review
Peer reviewer comments 2
Editor who approved publication: Dr Eyal Cohen
Vasily Giannakeas,1,2 Victoria Sopik,1,3 Steven Narod1– 3
1Women’s College Research Institute, Toronto, Ontario, Canada; 2Dalla Lana School of Public Health, University of Toronto, Toronto, Ontario, Canada; 3Institute of Medical Science, University of Toronto, Toronto, Ontario, Canada
Correspondence: Steven Narod
Women’s College Research Institute, Toronto, Ontario, Canada
, Tel +1 416-351-3765
Email [email protected]
Background: The degree of confidence one should place on non-randomised observational trials studies which estimate the benefit of screening depends on the validity of the analytic method employed. As is the case for all observational trials, screening evaluation studies are subject to bias. The objective of this study was to create a simulated data set and to compare four analytic methods in order to identify the method which was the least biased in terms of estimating the underlying hazard ratio.
Methods: We simulated a cohort of 100,000 women who were accorded US national rates of breast cancer incidence and breast cancer mortality over their lifetime. We assigned at random one-half of them to initiate mammography screening between ages 50 and 60. We used four different analytic approaches to estimate the hazard ratio under a null model (true HR = 1.0) and under a protective model (true HR = 0.80). Two models used the entire data set (with and without including mammography as a time-dependent covariate) and two models invoked matching of screened women with unscreened women (with and without excluding of women who had a mammogram after study initiation). For each of the four analytic methods, we compared the observed hazard ratio with the true hazard ratio. We considered an analytic method to be valid if the observed hazard ratio was close to the true hazard ratio.
Results: Two simple analytic methods generated biased results that led to spurious protective effects observed when none was there. The least biased method was based on matching screened and unscreened women and which emulated a randomized trial design, wherein the unexposed control had no mammogram prior to study entry, but she was not excluded or censored if she had a mammogram after the index date.
Conclusion: There is no single ideal method to analyze observational data to evaluate the effectiveness of screening mammography (ie, which generates an unbiased estimates of the underlying hazard ratio) but designs which emulate randomised trials should be promoted.
Keywords: observational studies, bias, mammography
Introduction
The goal of screening mammography is to reduce the risk of dying of breast cancer among women who attend a screening clinic. The benefit of screening can be expressed in terms of the underlying hazard ratio for deaths from breast cancer associated with attending screening over a specified follow-up period (eg, twenty years) or until a given age (eg, age 80). Screening effectiveness has been evaluated by randomised trials,1,2 but the results of these have been conflicting. In the Swedish two-county randomised trial, invitation to screening was associated with a prolonged reduction of 30% in breast cancer mortality, compared to those who were not invited (hazard ratio = 0.69).1 The Canadian National Breast Cancer Screening Study showed no difference in breast cancer mortality at 30 years among women who were screened (up to five times) and those who were not screened by mammography (HR = 1.05).2 In the recent UK Age trial3 screening women aged 40 to 48 was associated with a hazard ratio of 0.88 in the 24-year follow-up period (95% CI 0.74 to 1.03).
Authors have suggested that the data from the randomised trials are outdated and that we should also consider findings from non-randomised observational studies.4,5 These studies compare mortality rates in screened versus unscreened women or in women invited to screening or not invited.6–15 The approach is appealing, but the reports of these studies may be difficult to follow, and key methodologic details and results may be missing. Further, non-randomised studies may be influenced by lead-time bias, length time bias and selection biases; some of these may be difficult to detect but may have a profound impact on the results.17 It is important to ensure that women with prior breast cancer are excluded from both the screened group and the unscreened comparison at the beginning of the follow-up period. It is also important to ensure that the probability of being screened is not correlated with survival without breast cancer (duration of follow-up). That is a woman who has her first mammogram ten years after the study starts is a priori a ten-year survivor. The different types of observational studies of screening and the various sources of bias have been reviewed by Broeders et al.8
We have taken a novel approach to evaluate potential sources of bias in observational studies which involves simulating a cohort of women at risk for breast cancer and randomly assigning them to mammography or not. Our goal was to quantify the potential magnitude of selection biases on the true hazard ratio associated with screening under various methods. We simulated a cohort of women at risk for breast cancer from birth to age 80. Some were screened, and some were not screened. We simulated breast cancer-specific mortality rates among women with a breast incident cancer event. We assumed either no beneficial effect (the null model HR = 1.0) or a modest beneficial effect (the preventive model, HR = 0.80). We then estimated the hazard ratios using four analytic approaches. Under the null model, any observed ‘protective’ effect would be due to bias in the study design. Under the preventive model, bias would result in an estimated hazard ratio that deviated from 0.80. We estimated the hazard ratio for both models using four different analytic methods. Our goal was to find an analytic method that was able to identify the true (unbiased) hazard ratio under both the null model and the preventive model.
Methods
Our goal was to identify a study design that results in an unbiased hazard ratio by creating a simulated dataset that mimics real-world screening programs. A cohort was first simulated using age-specific incidence and mortality rates from the general population of the USA. The cohort was constructed applying published rates of breast cancer incidence and of cancer survival (case-fatality) using SEER incidence and mortality data.17 The data were based on invasive cancer only (not DCIS). We then simulated a screening program whereby one half of the women in the cohort were offered screening and one-half were not. Simulated datasets were created under a null model (HR =1.0) and a protective model (HR = 0.80) and analyzed under multiple study designs and hazard ratios were estimated. The extent of selection bias for each study design can be quantified as the difference between the observed hazard ratio and the underlying (simulated) hazard ratio. The approach is presented in detail below.
Construction of the Cohort
We considered a theoretical cohort of 100,000 women age 25 followed until age 80 for death from breast cancer. We applied age-specific annual breast cancer incidence rates to the members of the cohort from age 25 to age 80. The age-specific annual breast cancer rate was applied to the cancer-free women for each day of simulated follow-up, according to her age. For women who developed an incident breast cancer, we then applied annual cancer mortality rates for each day of simulated follow-up from the date of diagnosis until 20 years post-diagnosis or age 80, whichever occurred first. The mortality rate was both age- and time-specific (ie, varied according to age at diagnosis and the time passed since diagnosis). We also applied the mortality rates for American women between ages 25 and 80 for causes of death other than breast cancer.18 These rates were applied to women with and without breast cancer. For the sub-cohort of women with breast cancer, we recorded the date of diagnosis, date of death and cause of death. We follow the cohort from age 25 until age 80 for death from breast cancer or death from any cause.
Simulating Mammography: The Null Model
We wished to emulate the situation where screening had no effect on mortality (the null model). We assumed that 50% of the women would receive one or more screening mammograms. We selected at random 50% of the 100,000 women to create the mammogram exposed sub-cohort. Each of these women had a first mammogram assigned at random between age 50 and age 60, and a subsequent mammogram every two years until their seventieth birthday. No mammogram was done prior to age 50 or after age 70.
To emulate the actual screening situation, we excluded any screening mammograms that occur after a breast cancer diagnosis; that is, if the woman had been diagnosed with breast cancer (step 1 above) and was assigned to mammogram group (step 2) and if one or more screening mammograms were done after the date of diagnosis of breast cancer, then the mammograms were removed (ie, once diagnosed with breast cancer a woman was no longer eligible for screening). If the date of diagnosis preceded the first screening mammogram, the woman was transferred to the no mammogram group. Next, we extended the screening paradigm by assuming a lead time of 18 months. That is, any cancer diagnosed in the cohort within the 18-month period following a mammogram was considered to be mammogram-detected and the date of diagnosis was back-dated to the date of the most recent mammogram. The date of death for that woman was not altered.
Simulating Mammography: The Preventive Model
We wanted to model the preventive effect of having a mammogram (ever/never) on breast cancer mortality assuming an underlying preventive effect. We chose to model the level of prevention at 20% (ie, a hazard ratio of 0.80 on breast cancer-specific mortality rates). In this model, for all women who were diagnosed with breast cancer in the mammogram group, we applied age- and time-specific mortality rates that were 0.8 times that of the no mammogram group.
Analysis
We analyzed the (two) cohorts in four different ways:
- The crude method. We compared the crude breast cancer mortality rate in the screened versus unscreened cohorts from age 50 to age 80 (or death). We estimated the hazard ratio using the Cox proportional hazard model.
- Time-dependent method. We followed the entire cohort from age 50 to age 80 or death and considered mammogram exposure as a time-dependent covariate. We considered the subject to transfer from the unexposed to the exposed group on the date of the first mammogram. We calculated the hazard ratio using the Cox proportional hazards model with time-dependent covariates.
- Matching with no screening ever. We matched women who were screened one-to-one to women who were never screened. We first select a woman who has been screened (exposed). To be eligible to be a control, the woman was never screened women and was not diagnosed with breast cancer prior to the date of the initial mammogram in the screened woman (the index date). For each matched pair we began follow-up on the date of first screen of the screened subject. We analyzed the data as the survival of the cohort from the index date to age 80, comparing mortality in screened versus unscreened women.
- Matching with no prior screening. In this analysis, we matched women who were screened to a control who had not been screened at or prior to the screening date of the exposed women. The control had no breast cancer prior to the initial screening date of the screened women. Controls were selected with replacement. In this situation, a proportion of the women in the control group will have been screened at some point after the index date. For each matched pair we began follow-up on the date of first screen of the screened subject. We analyzed the data as the survival of the cohort from the index date to age 80.
The initial simulation was based on 100,000 women for clarity and used for descriptive purposes. To minimize spurious results due to chance, we repeated our null and protective simulations using a cohort of three million women and these results were used in the final evaluation of the various analytic models.
Results
We simulated a cohort of 100,000 women under the null model (no screening benefit) (Table 1). There were 11,109 incident cases of breast cancer in the cohort, of whom 2268 died of breast cancer (2.3%) by age 80. There were 38,925 other causes of death in the cohort. The cumulative risk of breast cancer to age 80 was 12.9%. The cumulative mortality from breast cancer to age 80 was 2.7% (Figure 1). The five-year survival after breast cancer was 87.6% and the ten-year survival after breast cancer was 80.6% (Supplementary Figure S1). Of the 50,000 women randomly assigned to receive a screening mammogram, 45,545 of the women had a mammogram.
 |
Table 1 Simulated Cohort of 100,000 Women Under the Null Model |
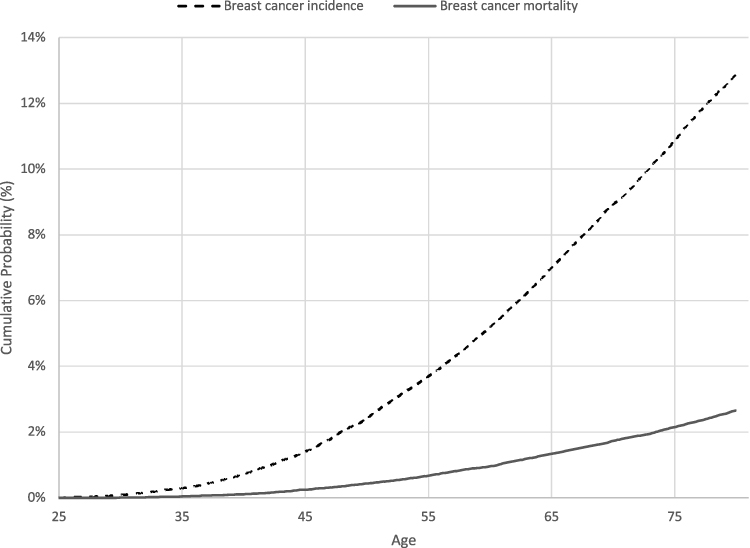 |
Figure 1 Cumulative probability curves of simulated cohort, null model. |
Of the 11,109 breast cancers in the cohort, 7297 were diagnosed in women who never had a mammogram and 3812 were diagnosed in women who had a mammogram. Of the 3812 women with breast cancer who had a mammogram, 1863 were mammogram-detected, 570 were interval cancers and 1379 were diagnosed after the last scheduled mammogram. In total, 1863 of the 11,109 breast cancer cases were mammogram-detected (17%).
The cohort was analysed four ways to estimate the hazard ratio associated with mammography (for these analyses, we simulated cohorts of three million women). The data set was generated under a null model (HR = 1.0) and a protective model (HR = 0.80). The results of the simulation are presented in Table 2 and Supplementary Tables S1–S3. Under the null model, analytic approaches 1 to 3 generated a hazard ratio below 1.0; that is a spurious protective effect (Table 2). Under the protective model, all analytic approaches generated a hazard ratio more extreme than the actual protective effect except analysis 4. In analysis 4, the calculated hazard ratio of 0.86 underestimated the benefit of screening (true hazard ratio = 0.80). This is expected given the extent of misclassification in this model whereby 30% of the controls had a mammogram after (pseudo)-randomisation (Supplementary Table S2).
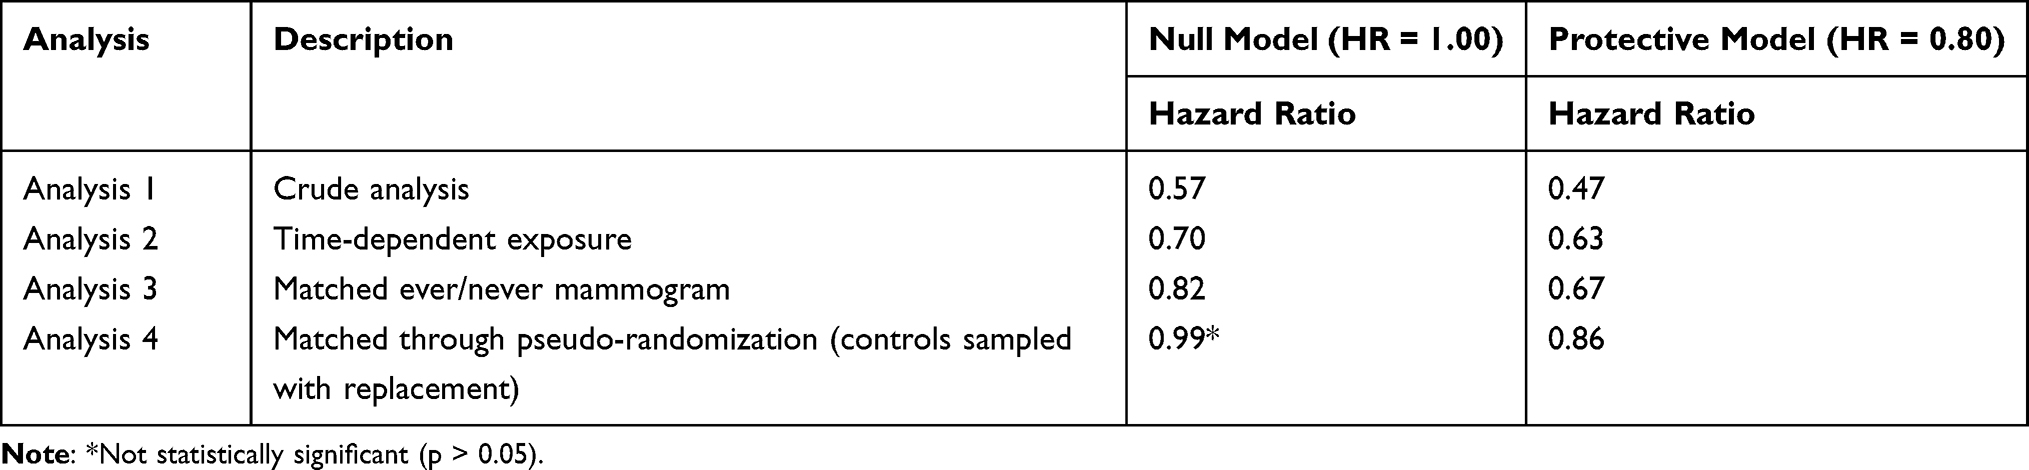 |
Table 2 Regression Results Using Simulated Cohort of 3 Million Women |
The results of each analysis are described in detail below.
- The null model
- The crude comparison. This was a crude comparison of breast cancer deaths to age 80 in the 1,363,796 (45.5%) women who had a mammogram and the 1,636,204 (54.5%) women who had no mammogram (Table 1). There were 18,649 deaths from breast cancer in the screened group and 47,282 deaths from breast cancer in the unscreened group. The observed hazard ratio associated with screening (ever/never) was 0.57.
- Time-dependent analysis. All women were initially considered unexposed to mammography. In the follow-up period, 136,204 of the three million women (8.3%) transferred from the unscreened group to the screened group. The mean age at first mammogram was 54.9 years. The hazard ratio for exposure to screening and breast cancer death was 0.70 when mammography was treated as a time-dependent variable. The age-specific mortality rates for women in the mammography group and no mammography group are presented in Figure 2.
- Matching with no screening ever. There were 1,363,537 matched pairs generated from the 3 million women. The mean age at the index date was 54.9 years (range 50 to 60 years). The cumulative mortality from breast cancer for the unscreened women from the index date to age 80 was 2.45%. The cumulative mortality from breast cancer for the screened women from the index date to age 80 was 2.12%. Using the Cox survival model the hazard ratio associated with screening (index date to death) was 0.82. The mean time of follow-up for the control women was 21.2 years.
- Matching with no prior screening. There were 1,363,796 matched pairs. The mean age at the index date was 54.9 years (range 50–60 years). Among the control women, 30.3% had a screening mammogram at some point after the index date (mean 1.9 years later). The average age of first mammogram among the controls was 56.8 years. Among the women who were in the screened cohort, there were 18,649 deaths from breast cancer. Among the controls, there were 18,842 deaths from breast cancer. The cumulative mortality from breast cancer for the unscreened women from the index date to age 80 was 2.17%. The cumulative mortality from breast cancer for the screened women from the index date to age 80 was 2.12%. The hazard ratio was 0.99.
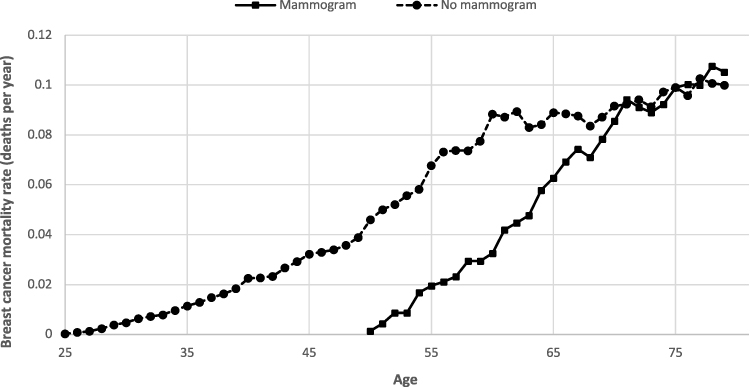 |
Figure 2 Age-specific breast cancer mortality rates by mammography group, analysis 2 (null model). |
This model was similar to the null model but the cohort was generated under the assumption that initiation of screening was associated with a 20% reduction in breast cancer mortality (HR = 0.80). All other parameters remained the same.
- The crude comparison. There were 15,221 deaths from breast cancer in the screened group and 46,839 deaths from breast cancer in the unscreened group. The hazard ratio associated with screening (ever/never) was estimated to be 0.47.
- Time-dependent analysis. The hazard ratio for screening and breast cancer death was 0.63 when mammography was treated as a time-dependent variable.
- Matching with no screening ever. The cumulative mortality from breast cancer for the unscreened women from the index date to age 80 was 2.40%. The cumulative mortality from breast cancer for the screened women from the index date to age 80 was 1.74%. The hazard ratio was 0.67.
- Matching with no prior screening. Among the women who were in the screened cohort, there were 15,221 deaths from breast cancer. Among the women who were controls, there were 17,625 deaths from breast cancer. The cumulative mortality from breast cancer for the unscreened women from the index date to age 80 was 2.01%. The cumulative mortality from breast cancer for the screened women from the index date to age 80 was 1.74%. The hazard ratio was 0.86.
Discussion
The purpose of this study was to identify a valid method of evaluating observational breast screening data for estimating the underlying hazard ratio for death from breast cancer associated with screening. Our approach was to simulate a data set of women at risk for breast cancer, based on known incidence and mortality rates and to apply a hypothetical screening program and to estimate the hazard ratio associated with screening with various methods. It was not our intention to address whether or not screening was beneficial, rather we wished to compare different approaches to data analysis. We conclude that the optimum design may be a pseudo-randomised trial.
The simplest ways to evaluate the benefit of screening mammography in a population are inherently biased. In our cohort, when we compare crude mortality in screened and unscreened women under the null model, the observed hazard ratio associated with ever/never screening was 0.57, far less than the true hazard ratio of 1.0. A woman is only eligible for screening if she is cancer-free, ie, a woman who has had breast cancer before the age of screening (eg, age 50) will not be eligible to enter the screened arm, but in the crude comparison, her cancer and death from cancer will be counted in the unscreened arm.
In reality, few investigators would propose to compare crude mortality in screened and unscreened women. In using the time-dependent method, a woman switches from the unexposed group to the exposed group at the time of her first mammogram. In the second method, we included mammography as a time-dependent variable but the residual bias remained substantial (HR = 0.70) due to women with prevalent breast being included in the control arm. That is, a woman who has had breast cancer will not accept an invitation to screening and this bias is not eliminated by doing a time-dependent analysis. This is referred to elsewhere as bias of choice.16
In an attempt to eliminate the bias, we conducted a matched-pair design. In this design we ensure that neither the screened or unscreened woman had cancer diagnosed prior to screening; the exposed and unexposed women were matched for age and date of first screen (in the exposed) and were followed for the same duration. It seems logical that women who were ever screened at any time should be excluded from the unexposed group, but this exclusion also introduces a form of immortal time bias— under the null model the observed hazard ratio for the matched, never-screened analysis was 0.82 (analysis 3). This bias arises because the longer a woman lives without a diagnosis of breast cancer, the more likely she is to have a screening mammogram. For example, a woman who lives to age 59 without breast cancer may have a first screening mammogram at age 59 but a woman who develops breast cancer at age 58 cannot enter the screening program at age 59. The longer a woman is cancer-free, the more likely she is to have at least one mammogram and to be assigned to the mammogram arm.
In an attempt to eliminate immortal time bias, we sought to emulate a randomised trial (analysis 4). Under this paradigm, women were assigned to exposed or unexposed groups at one point in time; all were cancer-free at the time of pseudo-randomisation (the date of first mammography in the exposed woman). A subject was eligible to be a control if she did not have a mammogram at the date of, or prior to, the date of the mammography of the matched exposed woman. However, she may have had a mammogram after the date of assignment. This is rational because in a randomised trial, the cohorts of exposed and unexposed women are defined at the time of randomisation and are followed thereafter. One would not exclude a control from a randomised trial based on an event that occurred after randomisation, nor would one transfer a subject from an unexposed to exposed group. In this approach, a high proportion of controls had a screening mammogram after the index date (30.2%). Under the null model, this method generated an unbiased hazard ratio of 0.99. However, as a result of misclassification of the controls, under the protective model, the method produced a hazard ratio biased towards the null (HR = 0.86).
Based on these results, we favor the last method, which closely emulates a randomised trial. The drawback of this method is that a proportion of the unexposed group will become exposed during the follow-up period (misclassification) and this will attenuate to some extent, the actual relative risk, depending on the extent of misclassification. Nevertheless, this provides a degree of assurance that a true effect of mammography is likely to be as great or greater than the observed effect when this analysis is used. The other models are less conservative in that the true effect is likely to be smaller than the observed effect.
Most authors who have used an observational design to assess the effectiveness of mammography screening in reducing breast cancer mortality recognize the necessity to restrict their analyses to women free from breast cancer at entry6–15 but it is often difficult to ensure this is the case. Commonly, women are followed from the time they become eligible for screening (usually age 50 years) for a specified time period and breast cancer mortality from breast cancers diagnosed during that period are examined in relation to individual screening participation or non-participation. Analyses are performed in a time-dependent manner, which is similar to analysis 2 (unmatched) and analysis 3 (matched) in the current study.7,9,11,12 These published studies report a significant mortality risk reduction (average 40% reduction) associated with mammography screening6–15 similar to the 30% reduction we saw under the null model in analysis 2. We show here that there are intrinsic biases in both the time-dependent approach (analysis 2) and in the unmatched approach when controls are excluded if they ever had a mammogram (analysis 3). One previous study implemented a design similar to a randomized trial (our analysis), with “never attenders” defined as those who did not respond to any of the first two invitations; in that study, 16% of the women who were classified as ‘never’ subsequently attended a screening test.7 The matched design (analysis 4) emulates a randomisation with analysis by ‘intention to treat’. The similarities between observational study designs and analysis of randomised trial data by ‘target trial’ approach has been summarized by Hernan et al.19 These authors have come to similar conclusions about emulation of randomised trials in analysis of large observational datasets.20
Our study is intended to provide a guideline to help readers interpret observational studies of screening. The methods employed were chosen because they illuminate the potential for several types of selection bias. The methods for some studies may be far more complex and more challenging.
It is important to ask if the authors clearly delineated if and how prevalent cancers were excluded from the control group (these will always be excluded from the exposed group). In particular, authors should provide details on the index date, the years of diagnosis and the ages of diagnosis of the breast cancers, and the years of death in all study subjects to reassure us that no cases were diagnosed prior to the inception of screening and that follow up was equal. This will ensure that the ages and dates of diagnosis for cases included in the analysis were not diagnosed above the age of screening cessation or outside of the screening period under evaluation. The authors should indicate if women who were ever-screened were excluded from the control group and should provide details about the screening histories of the controls.
There are limitations to our study. The study data were simulated using incidence and mortality in the SEER Registry and we did not have information on mammography screening in SEER. The screening parameters we chose were somewhat arbitrary and provide data on a single scenario, ie, screening every two years from age 50 to 70 with 75% sensitivity and 50% uptake of screening. We staggered the uptake of first screen between age 50 and 60 and this may not be an accurate reflection of screening behaviors. We also chose to analyze the data under models which incorporated no benefit to screening (the null model) and a modest benefit of screening (the protective model). One could generate similar cohorts under different assumptions, ie, wider age eligibility, higher sensitivity, higher compliance, etc., and incorporate different benefit sizes. Our study was designed to bring clarity to the sources of bias and not to evaluate whether screening was effective or not. We also wished to show that simulation was a helpful method of evaluating bias in observational studies. We did not address bias in other types of studies such as case–control studies and trend studies, these have been reviewed by Broeders et al.
Under the model we employed, only 17% of breast cancer cases were detected by mammogram. This is based on our conservative model which had screening initiation at age 50 until 70, with 50% compliance and 75% test sensitivity. The proportion of cancers detected by screening would of course be greater than this if compliance were upwards of 50%, if the age of screening onset was lower than the 55-year average in our study and if test sensitivity exceeded 75%. Nevertheless, of the 11,109 cancers in the cohort, 1471 occurred in women over age 70 (13%) and these are not amenable to screening. In the SEER database of all breast cancers diagnosed from 2012 to 2016, 31% occurred after age 70.1
Conclusions
In summary, we conclude that simulation of a screening cohort under conditions which emulate a specific analytic strategy is a good way to uncover biases that are not otherwise apparent. We recommend the pseudo-randomised matched study design as a relatively bias-free method which reliably recapitulates the true underlying hazard ratio in studies which evaluate the mortality benefit associated with screening.
Funding
Vasily Giannakeas is supported by the Canadian Institutes of Health Research Frederick Banting and Charles Best Doctoral Research Award.
Disclosure
The authors declare that they have no conflicts of interest.
References
1. Tabár L, Vitak B, Chen TH, et al. Swedish two-county trial: impact of mammographic screening on breast cancer mortality during 3 decades. Radiology. 2011;260(3):658–663. doi:10.1148/radiol.11110469
2. Miller AB, Wall C, Baines CJ, Sun P, To T, Narod SA. Twenty five year follow-up for breast cancer incidence and mortality of the Canadian National Breast Screening Study: randomised screening trial. BMJ. 2014;348(feb11 9):g366. doi:10.1136/bmj.g366
3. Duffy SW, Vulkan D, Cuckle H, et al. Effect of mammography screening from age 40 years on breast cancer mortality (UK age trial): final results of a randomized, controlled trial. Lancet Oncol. 2020;21(9):1165–1172. doi:10.1016/S1470-2045(20)30398-3
4. IARC Working Group on The Evaluation of Cancer-Preventive Strategies. Breast Cancer Screening. Lyn, France: IARC Press; 2016.
5. Harris RP. How best to determine the mortality benefit from screening mammography: dueling results and methodologies from Canada. J Natl Cancer Inst. 2014;106(11):dju317. doi:10.1093/jnci/dju317
6. Morrison AS, Brisson J, Khalid N. Breast cancer incidence and mortality in the breast cancer detection demonstration project. J Natl Cancer Inst. 1988;80(19):1540–1547. doi:10.1093/jnci/80.19.1540
7. Puliti D, Miccinesi G, Zappa M, Manneschi G, Crocetti E, Paci E. Balancing harms and benefits of service mammography screening programs: a cohort study. Breast Cancer Res. 2012;14(1):R9. doi:10.1186/bcr3090
8. Broeders M, Moss S, Nystrom L, et al. The impact of mammographic screening on breast cancer mortality in Europe: a review of observational studies. J Med Screen. 2012;19(Suppl 1):14–25. doi:10.1258/jms.2012.012078
9. Hofvind S, Ursin G, Tretli S, Sebuødegård S, Møller B. Breast cancer mortality in participants of the Norwegian Breast Cancer Screening Program. Cancer. 2013;119(17):3106–3112. doi:10.1002/cncr.28174
10. Coldman A, Phillips N, Wilson C, et al. Pan-Canadian study of mammography screening and mortality from breast cancer. J Natl Cancer Inst. 2014;106(11):dju261. doi:10.1093/jnci/dju261
11. Morrell S, Taylor R, Roder D, Robson B, Gregory M, Craig K. Mammography service screening and breast cancer mortality in New Zealand: a national cohort study 1999–2011. Br J Cancer. 2017;116(6):828–839. doi:10.1038/bjc.2017.6
12. Johns LE, Coleman DE, Swerdlow AJ, Moss SM. Effect of population breast screening on breast cancer mortality up to 2005 in England and Wales: and individual-level cohort study. Br J Cancer. 2017;116(2):246–252. doi:10.1038/bjc.2016.415
13. Tabár L, Dean PB, Chen TH, et al. The incidence of fatal breast cancer measures the increased effectiveness of therapy in women participating in mammography screening. Cancer. 2018;125(4):515–523. doi:10.1002/cncr.31840
14. Dibden A, Offman J, Duffy SW, Gabe R. Worldwide review and meta-analysis of cohort studies measuring the effect of mammography screening programmes on incidence-based breast cancer mortality. Cancers (Basel). 2020;12(4):976. doi:10.3390/cancers12040976
15. Duffy SW, Tabár L, Yen AM, et al. Mammography screening reduces rates of advanced and fatal breast cancers: results in 549,091 women. Cancer. 2020;126(13):2971–2979. doi:10.1002/cncr.32859
16. Narod S. Countercurrents: the bias of choice. Curr Oncol. 2019;26(6):e712–e713. doi:10.3747/co.26.5165
17. “SEER*Explore”. Surveillance, epidemiology, and end results program, National Cancer Institute. Available from: https://seer.cancer.gov/explorer.
18. Surveillance Research Program. National Cancer Institute SEER*Stat software. Available from: seer.cancer.gov/seerstat. version 8.3.5.
19. Hernán MA, Hernández-Díaz S, Robins JM. Randomized trials analyzed as observational studies. Ann Intern Med. 2013;159(8):560–562.
20. Dickerman BA, García-Albéniz X, Logan RW, Denaxas S, Hernán MA. Avoidable flaws in observational analyses: an application to statins and cancer. Nat Med. 2019;25(10):1601–1606. doi:10.1038/s41591-019-0597-x
 © 2020 The Author(s). This work is published and licensed by Dove Medical Press Limited. The
full terms of this license are available at https://www.dovepress.com/terms
and incorporate the Creative Commons Attribution
- Non Commercial (unported, 3.0) License.
By accessing the work you hereby accept the Terms. Non-commercial uses of the work are permitted
without any further permission from Dove Medical Press Limited, provided the work is properly
attributed. For permission for commercial use of this work, please see paragraphs 4.2 and 5 of our Terms.
© 2020 The Author(s). This work is published and licensed by Dove Medical Press Limited. The
full terms of this license are available at https://www.dovepress.com/terms
and incorporate the Creative Commons Attribution
- Non Commercial (unported, 3.0) License.
By accessing the work you hereby accept the Terms. Non-commercial uses of the work are permitted
without any further permission from Dove Medical Press Limited, provided the work is properly
attributed. For permission for commercial use of this work, please see paragraphs 4.2 and 5 of our Terms.