Back to Journals » Cancer Management and Research » Volume 14
A Tumoral and Peritumoral CT-Based Radiomics and Machine Learning Approach to Predict the Microsatellite Instability of Rectal Carcinoma
Authors Yuan H ![]() , Peng Y, Xu X, Tu S, Wei Y, Ma Y
, Peng Y, Xu X, Tu S, Wei Y, Ma Y ![]()
Received 8 June 2022
Accepted for publication 29 July 2022
Published 9 August 2022 Volume 2022:14 Pages 2409—2418
DOI https://doi.org/10.2147/CMAR.S377138
Checked for plagiarism Yes
Review by Single anonymous peer review
Peer reviewer comments 2
Editor who approved publication: Dr Chien-Feng Li
Hang Yuan,1 Yu Peng,1 Xiren Xu,2 Shiliang Tu,1 Yuguo Wei,3 Yanqing Ma2
1Department of Colorectal Surgery, Zhejiang Provincial People’s Hospital (Affiliated People’s Hospital of Hangzhou Medical College), Hangzhou, People’s Republic of China; 2Department of Radiology, Zhejiang Provincial People’s Hospital (Affiliated People’s Hospital of Hangzhou Medical College), Hangzhou, People’s Republic of China; 3GE Healthcare, Precision Health Institution, Hangzhou, People’s Republic of China
Correspondence: Yanqing Ma, Department of Radiology, Zhejiang Provincial People’s Hospital (Affiliated People’s Hospital of Hangzhou Medical College), Hangzhou, People’s Republic of China, Email [email protected]
Objective: To predict the status of microsatellite instability (MSI) of rectal carcinoma (RC) using different machine learning algorithms based on tumoral and peritumoral radiomics combined with clinicopathological characteristics.
Methods: There were 497 RC patients enrolled in this retrospective study. The tumoral and peritumoral CT-based radiomic features were calculated after tumor segmentation. The radiomic features from two radiologists were compared by way of inter-observer correlation coefficient (ICC). After methods of variance, correlation, and dimension reduction, six machine learning algorithms of logistic regression (LR), Bayes, support vector machine, random forest, k-nearest neighbor, and decision tree were conducted to develop models for predicting MSI status of RC. The relative standard deviation (RSD) was quantified. The radiomics and significant clinicopathological variables constituted the radiomics-clinicopathological nomogram. The receiver operator curve (ROC) was made by DeLong test, and the area under curve (AUC) with 95% confidence interval (95% CI) was calculated to evaluate the performance of the model.
Results: The venous phase of CT examination was selected for further analysis because the proportion of radiomic features with ICC greater than 0.75 was higher. The tumoral and peritumoral model by LR algorithm (M-LR) with minimal RSD showed good performance in predicting MSI status of RC with the AUCs of 0.817 and 0.726 in the training and validation set. The radiomic-clinicopathological nomogram performed better in both the training and validation set with AUCs of 0.843 and 0.737.
Conclusion: The radiomics-clinicopathological nomogram demonstrated better predictive performance in evaluating the MSI status of RC.
Keywords: rectal carcinoma, microsatellite instability, computed tomography, machine learning, radiomics, nomogram
Introduction
Rectal carcinoma (RC) is the third most frequent malignancy worldwide, with significant differences in clinical characteristics, prognosis, and individual treatment response.1 Preoperative chemotherapy is recommended for patients with resectable advanced RC with the advantages of down-staging, enhancing the rate of curative surgeries, and permitting sphincter preservation in patients with low-lying tumors.2 Microsatellite instability (MSI) is an important biomarker for predicting the response to chemotherapy and clinical outcomes of RC, which is always tested by immunohistochemistry displaying loss of one or more mismatch repair (MMR) proteins.3 Whereas, tumors with intact MMR proteins are collectively referred to as microsatellite stability (MSS) status.4 Patients with MSI status did not benefit from 5-fluorouracil adjuvant treatment and had a better prognosis than patients with MSS.5 Therefore it is important to develop a noninvasive and reproducible approach to identify the MSI status of RC.6
Radiomics is considered a high throughput method to convert conventional medical images into quantitative radiomics features,7 and is gaining increasing attention in cancer-related research.8 CT is the most frequently used radiological technique in evaluating clinical staging and guiding therapy, and its sensitivity and specificity for T- and N-category classification of rectal cancer have been reported to be similar to MRI.9 A previous publication using the CT-based radiomics method reported that radiomics features combined with clinical features helped to evaluate the MSI status of colorectal carcinoma.10 The clinical-radiomics nomogram illustrated that radiomic features, tumor location, age, high-density lipoprotein expression, and platelet counts showed good performance in assessing MSI status of colorectal cancer.11
To the best of our knowledge, there has been no tumoral and peritumoral radiomics based machine learning study in predicting MSI status of RC patients. In this article, we developed a machine learning model with tumoral and peritumoral CT radiomics features to identify MSI status of RC.
Methods
Patient Enrollment
This study was conducted with the permission of the institutional review board of Zhejiang Provincial People’s Hospital (No. 2021QT339). The ethics committee waived the requirement for informed consent. This study covered patient data confidentially and complied with the Declaration of Helsinki. Between January 2017 and January 2021, 497 patients who were pathologically confirmed as having RC were enrolled. The patients who underwent preoperative CT examinations within two weeks before surgeries, those with confirmed classical adenocarcinoma RC, those who did not receive preoperative chemotherapy or chemoradiotherapy, who did not have other cancers, and had undergone MSI testing were chosen. The flowchart of patients’ enrollment was listed in Figure 1. Finally, 497 RC patients including 96 patients with MSI status and 401 patients with MSS status were retrospectively selected in this study.
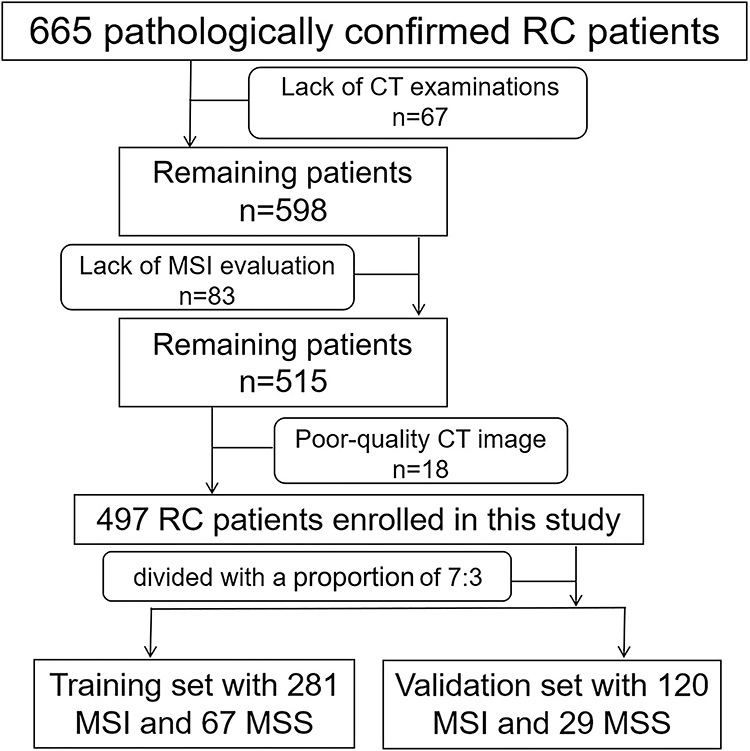 |
Figure 1 The flowchart of patient selection. |
CT Examination
All the patients underwent triphasic CT examinations on a 64 slice (127 patients) or 128 slice (370 patients) CT scanner (Somatom Definition AS, Siemens, Germany) including unenhanced phase, arterial phase, and venous phase. The triphasic CT scanning was conducted after injecting a dose of 1.3 mL/Kg contrast media (iomeprol 350) at a a rate of 3.0 mL/s. Then the arterial phase and venous phase were scanned after 15 seconds and 30 seconds of unenhanced phase. The uniform parameters were as follows: tube voltage 120 Kv, tube current 200mA, field of view 360mm, rotation time 0.75s, collimation 64*0.625mm, interval thickness 5mm.
Evaluation of the Clinicopathological Characteristics and MSI Status
The clinicopathological characteristics of RC patients comprised age, gender, CT-displayed diameter, location, carcinoembryonic antigen (CEA), carbohydrate 19–9 (CA19-9), lymph node metastasis ratio (LNR, LNR= positive lymph node count/lymph node count*100%), perineural invasion (PNI), extramural venous invasion (EMVI), history of smoking, drinking, diabetes, and hypertension. The tumor location was divided into low-lying which referred to the lesion being located within 5cm from anal margin, middle-lying which referred to the lesion being located between 5cm to 10cm from anal margin, and high-lying which referred to the lesion being located more than 10cm from anal margin. And tumor located in the rectosigmoid junction was classified as high-lying RC. The threshold values of CEA and CA19-9 were 5.0 ng/mL and 37.0 U/mL. When the tumor histopathologically invaded the surrounding tissues including perineural structure12 and extramural venous13 it was defined as PNI and EMVI. The MSI status was assessed by the method of immunohistochemistry to test MMR proteins including MLH1, MSH2, MSH6, and PMS2. Then the RC patients were divided into MSI and MSS groups based on whether they were deficient in one or more MMR proteins.
Tumor Segmentation and Radiomic Features’ Selection
The process of tumor segmentation was divided into three steps: 1) before tumor segmentation, the DICOM images were reconstructed into the voxel of 1.0 in X/Y/Z axes and the gray scale into 1 to 32 in A.K. software (Artificial Intelligence Kit, GE Healthcare) for standardization, automatically. 2) The tumoral volume of interest (VOI-t) was depicted in itk-SNAP software (Version 3.4.0. https://www.itksnap.org/) by two radiologists with about 10 years of diagnostic experience, manually (Figure 2A). 3) The peritumoral VOI (VOI-pt) was acquired after expanding 5mm from the VOI-t in A.K. software, automatically (Figure 2B). The regions of intraluminal air, peritumoral structures including bone, bowl, prostate, and uterus were eliminated from the contours of VOI-pt.
 |
Figure 2 The VOI-t was manually depicted in the itk-SNAP software (A). The VOI-pt was delineated after expanding 5mm from the margin of tumor, automatically (B). |
The selection of radiomic features was divided into four steps: 1) after the segmentation of VOI-t and VOI-pt, the radiomics features were calculated in A.K. software, automatically. 2) The radiomic features from two radiologists were compared by the method of inter-observer correlation coefficient (ICC). An ICC greater than 0.75 is considered to indicate good reliability and accuracy. So the phase with more radiomic features with ICC greater than 0.75 was chosen for analysis. 3) The cohort was randomly assigned to the training set and validation set with a proportion of 7:3 (Supplementary Material-Part 1, Table S1). 4) The dimension reduction of radiomic features was performed by the method of pre-processing, variance, correlation analysis, and least absolute shrinkage and selection operator (LASSO). Specific information was reported in Supplementary Materials-Part 2/3.
Radiomics-Based Machine Learning
After the selection of radiomic features, six machine learning algorithms including logistic regression (LR), Bayes, support vector machine (SVM), random forest (RF), k-nearest neighbor (KNN), and decision tree (DT) were conducted to construct radiomics models. The 100 Bootstrap replication and its relative standard deviation (RSD) was taken to quantify the stability of six algorithms. The equation of RSD was: (the standard deviation of the 100 AUC values of each machine learning algorithm)/(the corresponding mean value of the 100 AUC values)*100%.14 The lower the RSD value, the higher the stability of the algorithm. Therefore the algorithm with minimal RSD value was selected for further analysis. Finally, the radiomics score (Rad-score) was calculated to quantify the radiomics-based machine learning algorithm for predicting the MSI status of RC.
Integration of Radiomics and Clinicopathological Characteristics Analysis
The method of multivariate logistic regression of backward stepwise selection was used to analyze the integration of radiomic features and significant clinicopathological characteristics, and the integrative model was built. The receiver operator curve (ROC) was made by DeLong test and the area under curve (AUC) with 95% confidence interval (95% CI) was calculated to evaluate the performance of the model. The Hosmer-Lemeshow test was used to evaluate the goodness-of-fit and accuracy of the model.
Statistical Analysis
All statistical analyses for the radiomic features’ selection and machine learning algorithm were performed in R software (Version 3.5.1, https://www.r-project.org/) and Python (Version 3.5.6, https://www.python.org/). The methods to analyze the clinicopathological characteristics including independent t-test and Pearson’s Chi-squared test were implemented in SPSS software (Version 22, https://spss-64bits.en.softonic.com/). The DeLong test and ROC were carried out in MedCalc software (Version 18.2, https://www.medcalc.org/). A two-tailed p value <0.05 indicated statistical significance.
Results
General Clinicopathological Characteristics
The clinicopathological characteristics such as gender, age, CT-displayed diameter, location, CA19-9, PNI, EMVI, history of smoking, drinking, diabetes, and hypertension were not statistically different (p=0.054–0.768). While, statistical difference was noted in clinicopathological variables: CEA (p=0.007), LNR (p=0.003), and history of drinking (p=0.016). The specific data of clinicopathological characteristics were shown in Table 1.
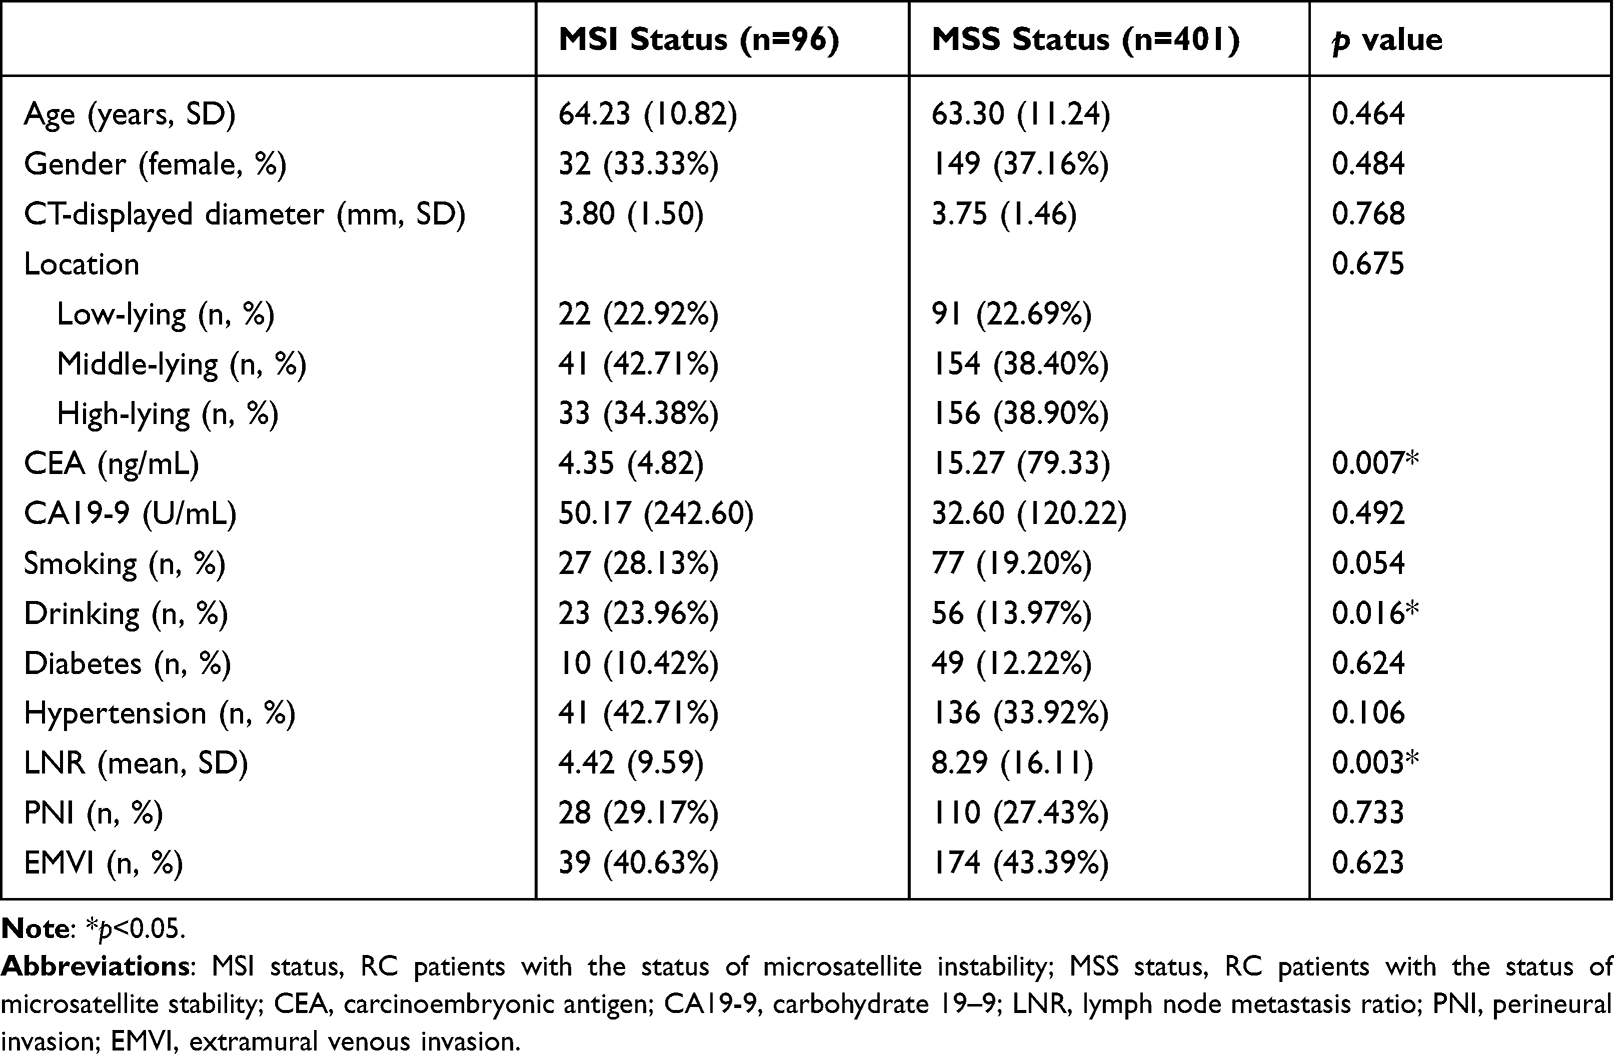 |
Table 1 The Characteristics of RC Patients with MSI and MSS Status |
Radiomics and Machine Learning Analysis
After implementing the method of ICC between radiomic features from two radiologists, 72.3% radiomic features had ICC greater than 0.75 in venous phase compared with 60.1% in unenhanced phase and 69.4% in arterial phase. Therefore we chose the venous phase and the mean values of radiomic features from two radiologists were calculated for further analysis. The cohort of 497 RC patients were separated into the training set (67 MSI and 281 MSS) and validation set (29 MSI and 120 MSS) with a proportion of 7:3.
Of the 792 tumor and peritumoral radiomic features, 51 radiomic features including 19 tumoral and 32 peritumoral radiomic features were selected after method of dimension reduction. The LASSO path plot in the training set was illustrated in Figure 3. These features were listed in the Supplementary Materials. After the method of 100 Bootstrap replication, the RSD of six machine learning algorithms was quantified (Supplementary Material-Part 4, Table S2). The RSD value (mean±SD) of LR (3.05%, 0.820±0.025) was the minimum compared with that of Bayes (3.10%, 0.773±0.024), SVM (27.95%, 0.755±0.211), RF (7.26%, 0.895±0.065), KNN (4.68%, 0.727±0.034), and DT (8.20%, 0.610±0.050). Hence, we selected the machine learning algorithm of LR to construct tumoral and peritumoral radiomics model (M-LR), and the specific statistical information of M-LR was listed in Supplementary Material-Part 5, Table S3. The AUCs of M-LR in the training set and validation set (Supplementary Material-Part 5, Figure S1) were 0.817 (95% CI, 0.772–0.856) and 0.726 (95% CI, 0.648–0.796). The equation of M-LR and specific information was listed in Supplementary Material-Part 5 and the Rad-score was calculated.
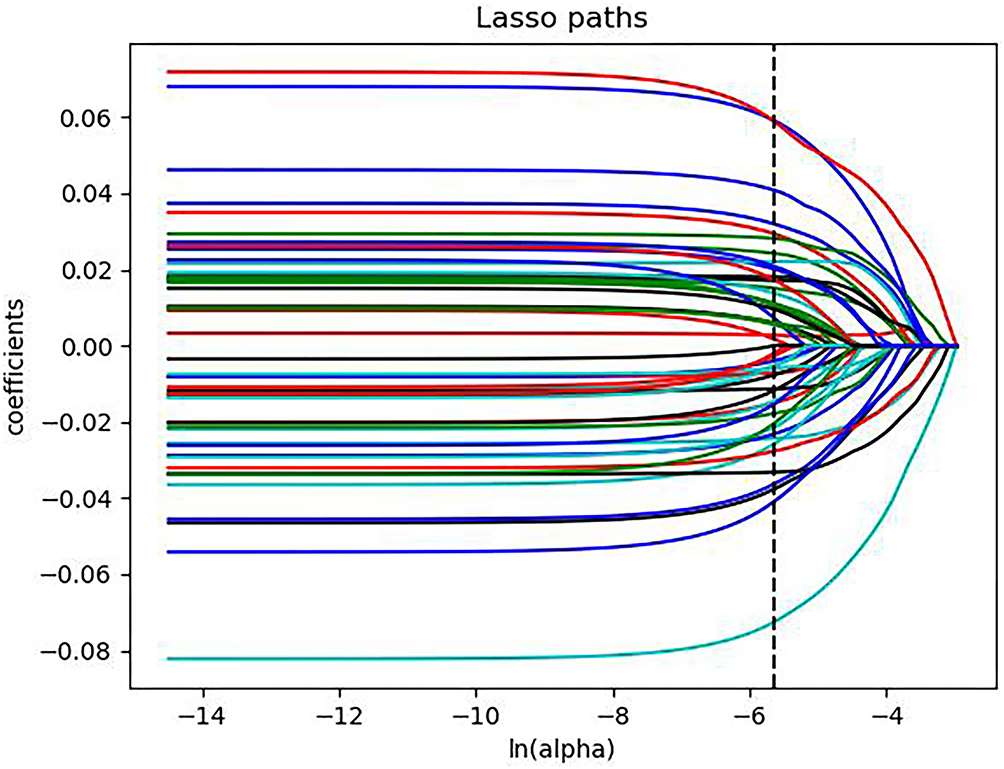 |
Figure 3 The LASSO path plot of the M-LR in the training set. After the dimension reduction method of LASSO, there were 51 radiomic features left. |
Performance of Radiomics-Clinicopathological Nomogram
The significant clinicopathological characteristics CEA (p=0.007), LNR (p=0.003), and drinking history (p=0.016) combined with Rad-score were used to develop a visual nomogram to evaluate the MSI status of RC patients (Figure 4). The calibration curves of this integrative model demonstrated good agreement with the ideal curve in both the training set and the validation set which were illustrated in Supplementary Material-Part 6, Figure S2. The non-significant Hosmer-Lemeshow test (X2=6.178, df=8, p=0.627) indicated the goodness-of-fit of the radiomics-clinicopathological model in evaluating the MSI status of RC patients. Moreover, this integrative model performed better with the AUC of 0.843 (95% CI, 0.800–0.880) in the training set and with the AUC of 0.737 (95% CI, 0.659–0.805) in the validation set (Supplementary Material-Part 6, Figure S3). The comparison of AUCs in M-LR and radiomics-clinicopathological nomogram in the training set (Figure 5A) and validation set (Figure 5B) showed the better prediction value of radiomics-clinicopathological nomogram.
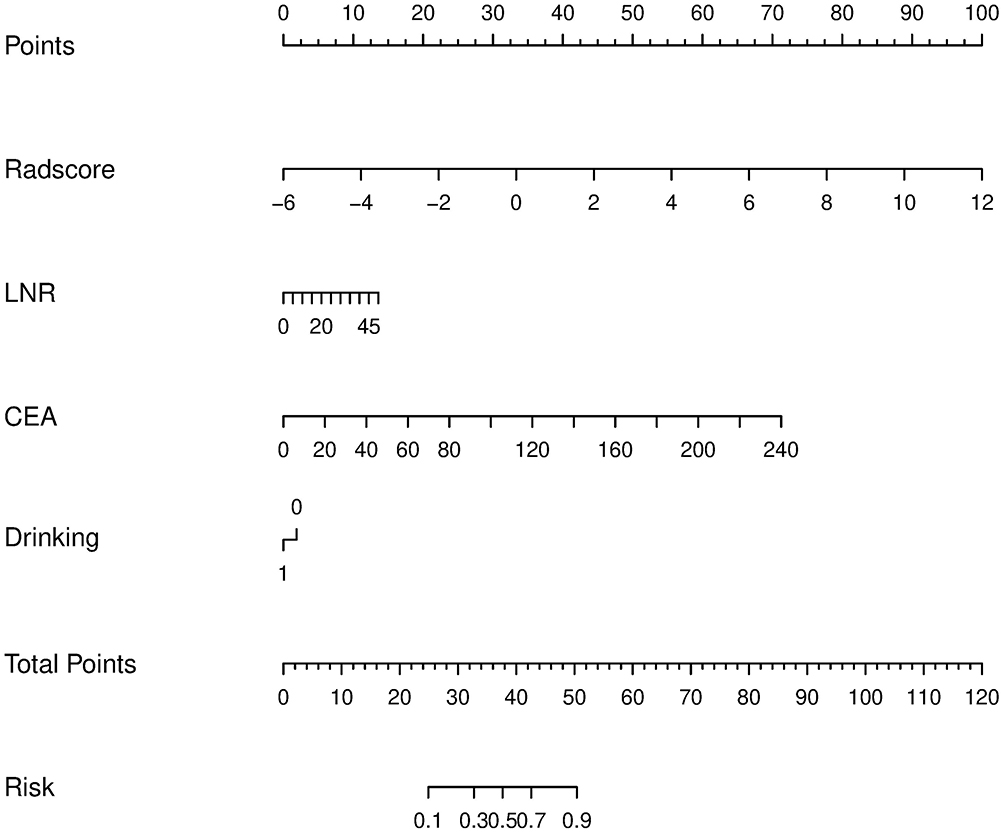 |
Figure 4 The radiomics-clinicopathological nomogram including Rad-score and significant clinicopathological characteristics CEA, LNR, and drinking history. |
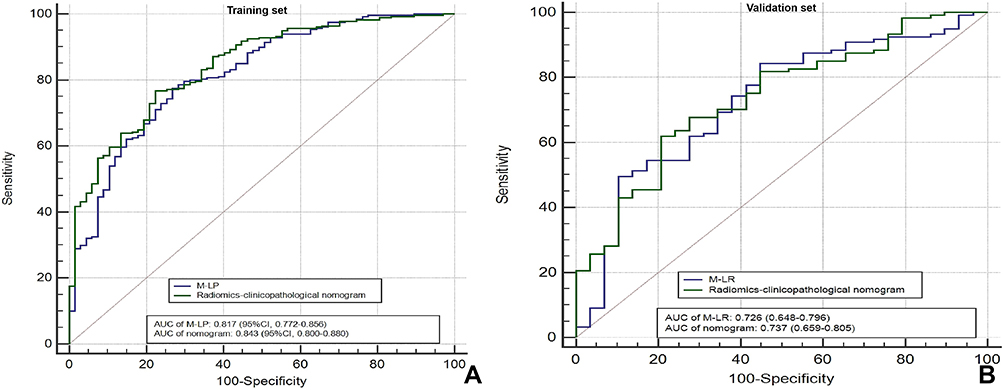 |
Figure 5 The comparison of AUCs in M-LR and radiomics-clinicopathological nomogram in the training set (A) and validation set (B). The AUCs of radiomics-clinicopathological were higher in the training and validation set than those of M-LR. |
Discussion
We selected the venous phase of CT examination for analysis after comparing the ratio of ICC greater than 0.75 of radiomic features from two radiologists in three phases (72.3% of venous phase vs 60.1% of unenhanced phase and 69.4% of arterial phase). Existing research has suggested that the venous phase was superior to arterial phase for lymph node assessment and the arterial phase was better for local tumor staging.15 We chose the venous phase to analyze the MSI status of RC patients. According to the guidelines of National Comprehensive Cancer Network, patients with MSI status have a better prognosis and obtain no benefit from 5-FU-based adjuvant chemotherapy in stage II colorectal carcinoma.16 Therefore, it is significant to noninvasively and preoperatively predict the MSI status of RC patients. Recent developments in the field of radiomics have reported that combining radiomics with clinical factors could achieve better predictive performance in predicting MSI status of patients with stage II colorectal carcinoma.17 While, to the best of our knowledge, there has been no research focused on tumoral and peritumoral radiomics to evaluate the MSI status of RC patients.
It has been published that the nomogram combined with tumoral radiomics and clinical radiomics feature could help predict the MSI status of colorectal cancer.18 While ignoring the effect of peritumoral tissues and the bias between rectal carcinoma and colon carcinoma. We conducted tumoral and peritumoral CT-based radiomics analysis and developed six machine learning algorithms to predict the MSI status of RC patients. We took the indicator of RSD of 100 Bootstrap replication to assess the different performance of algorithms. The lower the RSD value of the algorithm, the more stable its performance. So we selected the algorithm of LR (RSD: 3.05%) to construct an integrative model of tumoral and peritumoral radiomics to assess the MSI status of RC patients compared with the algorithms of Bayes (RSD: 3.10%), SVM (RSD: 27.95%), RF (RSD: 7.26%), KNN (RSD: 4.68%), and DT (RSD: 8.20%). After the dimension reduction of radiomic features, there were 51 radiomic features that remained to construct the M-LR. The AUCs of M-LR were 0.817 (95% CI, 0.772–0.856) in the training set and 0.726 (95% CI, 0.648–0.796) in the validation set. The MRI-based radiomics and machine learning showed that the Bayes-based radiomics signature performed better compared with other LR-based, SVM-based, KNN-based, and RF-based radiomics signature to predict the extramural venous invasion in RC patients.19 The deep learning based on high-resolution T2-weighted magnetic resonance images showed good predictive performance for MSI status in RC patients.20 The multivariate analysis of a previous study to predict the treatment response of RC patients found that RF and KNN achieved the highest AUC among pre-treatment and post-treatment features.21 In our study, the algorithm of LR with the minimal RSD showed the best performance in predicting the MSI status of RC patients.
Previous studies indicated that colorectal carcinoma with MSI status have distinct clinicopathological and pathological characteristics compared with MSS status, including proximal colon predominance, poor differentiation, and abundant tumor infiltrating lymphocytes.22 Therefore, we integrated the 51 selected radiomic features and significant clinicopathological variables CEA, LNR, and drinking to construct a visual nomogram for predicting the MSI status of RC patients. The preoperative prediction of MSI status via CT-based radiomics adds specificity to clinical assessment and could contribute to personalized therapy.10 The radiomics nomogram incorporating radiomics signatures and clinical indicators of tumor location, patient age, high-density lipoprotein expression, and platelet counts could potentially be used to facilitate the individualized prediction of MSI status in patients with colorectal carcinoma.11 To the best of our knowledge, there has been no machine learning research incorporating CT-based radiomics and clinicopathological variables to predict the MSI status of RC. Our integrated radiomics-clinicopathological nomogram showed better performance with AUCs of 0.843 (95% CI, 0.800–0.880) in the training set and 0.737 (95% CI, 0.659–0.805) in the validation set than the simple M-LR.
There were several limitations in this article. First, this retrospective study collected cases of classical adenocarcinoma, ignoring other types such as signet-ring cell carcinoma and mucinous carcinoma. The comprehensive and stratified analysis of RC is impending. Second, we constructed the radiomics-clinicopathological nomogram in a cohort of patients without validation. The external multi-central verification of this model is conducive to more accurately predict the MSI status of RC. Third, the CT and MRI radiomics should be incorporated for better analysis, with consideration of their different advantages.
In conclusion, the present research explored, for the first time, the effects of CT-based tumoral and peritumoral radiomics with the machine learning algorithm of LR which could help predict the MSI status of RC patients. Moreover, the visual radiomics-clinicopathological nomogram incorporating radiomics and significant clinicopathological variables CEA, LNR, and drinking performed better in prediction of MSI status of RC patients.
Author Contributions
All authors made a significant contribution to the work reported, whether that is in the conception, study design, execution, acquisition of data, analysis and interpretation, or in all these areas; took part in drafting, revising or critically reviewing the article; gave final approval of the version to be published; have agreed on the journal to which the article has been submitted; and agree to be accountable for all aspects of the work.
Funding
The study was supported by the fund of Medical and Health Research Project of Health Commission of Zhejiang Province (No. 2022KY040).
Disclosure
The authors declare that they have no disclosures relevant to the subject matter of this article.
References
1. Mattiuzzi C, Lippi G. Current Cancer Epidemiology. J Epidemiol Glob Health. 2019;9(4):217–222. doi:10.2991/jegh.k.191008.001
2. Sauer R, Becker H, Hohenberger W, et al. Preoperative versus postoperative chemoradiotherapy for rectal cancer. N Engl J Med. 2004;351(17):1731–1740. doi:10.1056/NEJMoa040694
3. Sinicrope FA, Sargent DJ. Molecular pathways: microsatellite instability in colorectal cancer: prognostic, predictive, and therapeutic implications. Clin Cancer Res. 2012;18(6):1506–1512. doi:10.1158/1078-0432.CCR-11-1469
4. Trojan J, Stintzing S, Haase O, et al. Complete pathological response after neoadjuvant short-course immunotherapy with ipilimumab and nivolumab in locally advanced MSI-H/dMMR rectal cancer. Oncologist. 2021;26(12):e2110–e2114. doi:10.1002/onco.13955
5. Oh CR, Kim JE, Kang J, et al. Prognostic value of the microsatellite instability status in patients with stage II/III rectal cancer following upfront surgery. Clin Colorectal Cancer. 2018;17(4):e679–e685. doi:10.1016/j.clcc.2018.07.003
6. Kenneth A, Miles M, Balaji GB, et al. Colorectal cancer: texture analysis of portal phase hepatic CT images as a potential marker of survival. Radiology. 2009;250(2):444–452. doi:10.1148/radiol.2502071879
7. Baeßler B, Weiss K, Santos D. Robustness and reproducibility of radiomics in magnetic resonance imaging: a phantom study. Invest Radiol. 2018;54(4):221–228. doi:10.1097/RLI.0000000000000530
8. Gillies RJ, Kinahan PE, Hricak H. Radiomics: images are more than pictures, they are data. Radiology. 2016;278(2):563–577. doi:10.1148/radiol.2015151169
9. Bogach J, Tsai S, Zbuk K, et al. Quality of preoperative pelvic computed tomography (CT) and magnetic resonance imaging (MRI) for rectal cancer in a region in Ontario: a retrospective population-based study. J Surg Oncol. 2018;117(5):1038–1042. doi:10.1002/jso.25000
10. Golia Pernicka JS, Gagniere J, Chakraborty J, et al. Radiomics-based prediction of microsatellite instability in colorectal cancer at initial computed tomography evaluation. Abdom Radiol. 2019;44(11):3755–3763. doi:10.1007/s00261-019-02117-w
11. Pei Q, Yi X, Chen C, et al. Pre-treatment CT-based radiomics nomogram for predicting microsatellite instability status in colorectal cancer. Eur Radiol. 2022;32(1):714–724. doi:10.1007/s00330-021-08167-3
12. Liebig C, Ayala G, Wilks JA, et al. Perineural invasion in cancer: a review of the literature. Cancer. 2009;115(15):3379–3391. doi:10.1002/cncr.24396
13. Inoue A, Sheedy SP, Heiken JP, et al. MRI-detected extramural venous invasion of rectal cancer: multimodality performance and implications at baseline imaging and after neoadjuvant therapy. Insights Imaging. 2021;12(1):110. doi:10.1186/s13244-021-01023-4
14. Parmar C, Grossmann P, Bussink J, et al. Machine learning methods for quantitative radiomic biomarkers. Sci Rep. 2015;5(1):13087. doi:10.1038/srep13087
15. Hundt W, Braunschweig R, Reiser M. Evaluation of spiral CT in staging of colon and rectum carcinoma. Eur Radiol. 1999;9(1):78–84. doi:10.1007/s003300050632
16. Piredda ML, Ammendola S, Sciammarella C, et al. Colorectal cancer with microsatellite instability: right-sided location and signet ring cell histology are associated with nodal metastases, and extranodal extension influences disease-free survival. Pathol Res Pract. 2021;224:153519. doi:10.1016/j.prp.2021.153519
17. Fan S, Li X, Cui X, et al. Computed tomography-based radiomic features could potentially predict microsatellite instability status in stage II colorectal cancer: a preliminary study. Acad Radiol. 2019;26(12):1633–1640. doi:10.1016/j.acra.2019.02.009
18. Ying M, Pan J, Lu G, et al. Development and validation of a radiomics-based nomogram for the preoperative prediction of microsatellite instability in colorectal cancer. BMC Cancer. 2022;22(1):524. doi:10.1186/s12885-022-09584-3
19. Shu Z, Mao D, Song Q, et al. Multiparameter MRI-based radiomics for preoperative prediction of extramural venous invasion in rectal cancer. Eur Radiol. 2021;32(2):1002–1013. doi:10.1007/s00330-021-08242-9
20. Zhang W, Yin H, Huang Z, et al. Development and validation of MRI-based deep learning models for prediction of microsatellite instability in rectal cancer. Cancer Med. 2021;10(12):4164–4173. doi:10.1002/cam4.3957
21. Shayesteh S, Nazari M, Salahshour A, et al. Treatment response prediction using MRI-based pre-, post-, and delta-radiomic features and machine learning algorithms in colorectal cancer. Med Phys. 2021;48(7):3691–3701. doi:10.1002/mp.14896
22. Kloor M, Staffa L, Ahadova A, et al. Clinical significance of microsatellite instability in colorectal cancer. Langenbeck’s Arch Surg. 2014;399(1):23–31. doi:10.1007/s00423-013-1112-3
 © 2022 The Author(s). This work is published and licensed by Dove Medical Press Limited. The
full terms of this license are available at https://www.dovepress.com/terms
and incorporate the Creative Commons Attribution
- Non Commercial (unported, 3.0) License.
By accessing the work you hereby accept the Terms. Non-commercial uses of the work are permitted
without any further permission from Dove Medical Press Limited, provided the work is properly
attributed. For permission for commercial use of this work, please see paragraphs 4.2 and 5 of our Terms.
© 2022 The Author(s). This work is published and licensed by Dove Medical Press Limited. The
full terms of this license are available at https://www.dovepress.com/terms
and incorporate the Creative Commons Attribution
- Non Commercial (unported, 3.0) License.
By accessing the work you hereby accept the Terms. Non-commercial uses of the work are permitted
without any further permission from Dove Medical Press Limited, provided the work is properly
attributed. For permission for commercial use of this work, please see paragraphs 4.2 and 5 of our Terms.