Back to Journals » Risk Management and Healthcare Policy » Volume 13
A Triple-Difference Approach to Re-Evaluating the Impact of China’s New Cooperative Medical Scheme on Incidences of Chronic Diseases Among Older Adults in Rural Communities
Authors Chen Q ![]() , Chu X, Wang S, Zhang B
, Chu X, Wang S, Zhang B ![]()
Received 28 December 2019
Accepted for publication 19 May 2020
Published 24 June 2020 Volume 2020:13 Pages 643—659
DOI https://doi.org/10.2147/RMHP.S244021
Checked for plagiarism Yes
Review by Single anonymous peer review
Peer reviewer comments 2
Editor who approved publication: Dr Kent Rondeau
Qihui Chen,1 Xueling Chu,2 Suzhen Wang,3 Bo Zhang4
1Center for Food and Health Economic Research, College of Economics and Management, China Agricultural University, Beijing, People’s Republic of China; 2Foreign Economic Cooperation Center, Ministry of Agriculture, Beijing, People’s Republic of China; 3School of Public Health, Weifang Medical University, Weifang, Shandong, People’s Republic of China; 4Department of Neurology and ICCTR Biostatistics and Research Design Center, Boston Children’s Hospital and Harvard Medical School, Boston, MA, USA
Correspondence: Bo Zhang
Department of Neurology and ICCTR Biostatistics and Research Design Center, Boston Children’s Hospital and Harvard Medical School, 21 Autumn Street, Suite 323, Boston, MA 02115, U.S.A
Email [email protected]
Suzhen Wang
School of Public Health, Weifang Medical University, 7166 Baotong West Street, Weifang, Shandong 261053, People’s Republic of China
Email [email protected]
Background: This paper re-evaluates the impacts of China’s New Cooperative Medicine Scheme (NCMS), a social health insurance program targeting China’s rural population, on the incidences of chronic diseases among its enrollees. Although coverage under the NCMS expanded rapidly following its implementation in 2003, previous studies have failed to reach a consensus on its health impacts. Existing conflicting results may be due to methodological problems such as implausible identification assumptions and the failure to focus on the most relevant beneficiaries.
Methods: Drawing on data from a longitudinal sample from the China Health and Nutrition Survey (CHNS), we focus on a subgroup of patients over the age of 55 years to re-estimate the NCMS’s impact on incidences of chronic disease among enrollees. We adopt a triple-difference (difference-in-difference-in-differences) method, relaxing the parallel-trend assumption commonly invoked in the previous double-difference (difference-in-differences) studies.
Results: Our triple-difference estimates suggest that the NCMS has significantly reduced the incidences of apoplexy and diabetes among rural residents aged 55 years or older. The impacts of the NCMS on chronic disease are underestimated by the commonly adopted double-difference method. The triple-difference method allows evaluations to focus on the most relevant subgroups for detecting program impacts.
Conclusion: Our findings that the NCMS has significantly positive impacts on elderly enrollees’ incidences of chronic diseases also suggest the need for examining its impacts on other vulnerable groups, such as low-income individuals, young children, and individuals with poor health conditions.
Keywords: impact evaluation, China, social health insurance programs, chronic diseases, difference-in-differences estimation, difference-in-difference-in-differences estimation, triple-difference estimation
Introduction
The ultimate goal of any social health insurance (SHI) program is to improve population health, presumably by lowering out-of-pocket expenses of the previously uninsured and increasing their healthcare utilization. In the context of China, the rural population attracts considerable attention from both the academia and the policy circle, not only because of the significant urban-rural gaps in healthcare utilization and health outcomes favoring the urban population1–4 (for example, urban adults are found to be 2.2 and 4.8 times more likely to choose outpatient care and inpatient care, respectively, versus “no care”, than their rural counterparts;2 also, urban children have 0.29 higher height-for-age z-scores and 0.19 greater weight-for-age z-scores than rural children3) but also because of the fundamental reforms undertaken in China’s rural healthcare system in the past few decades that aim to close such gaps.
China’s old rural SHI system, the Cooperative Medical Scheme (CMS), was implemented with an emphasis on preventive and basic healthcare. Primarily financed by the village-level communal welfare fund, the CMS operated health stations, paid village doctors, and provided drugs to the insured, not only making basic healthcare accessible to farmers but also offering them financial protection against large medical expenses. On the eve of China’s rural reforms in 1978, over 90% of its rural population was covered by the CMS.5 However, coverage plummeted as China’s rural communes collapsed in the reform era. Throughout the 1990s, health insurance coverage never exceeded 10% of the rural population and remained only about 20% throughout the 2000s.6 The lack of health insurance coverage, in turn, significantly raised rural residents’ out-of-pocket medical costs, bringing them high financial and health risks. To address these problems, the Chinese government launched the New Cooperative Medical Scheme (NCMS) in 2003, basing this new rural SHI system on three principles: voluntary participation, county-level administration, and a focus on catastrophic illness (inpatient services).7,8 The program receives funding from both the government and individuals: the central government contributes 10 yuan (or approximately 1.2 US dollars) per enrollee, provided that local governments and enrollees contribute no less than 10 yuan. The NCMS rolled out rapidly, expanding its coverage from 333 counties in 2004 to 2489 counties in 2013, reaching 98.7% of the targeted population.9 By 2006, a total of 21.3 billion Chinese yuan, or approximately 2.6 billion US dollars, had been spent in financing the program nationwide.10 Given the extensiveness of its coverage, the great number of its enrollees, and the considerable amount of subsidy it receives, one naturally wonders: does the NCMS work as expected? More specifically, does it improve the health outcomes of its enrollees?
Although a series of impact evaluation studies have been conducted to answer these questions, thus far they have failed to reach a consensus on the impact of the NCMS on health-related outcomes in rural communities. Some findings are inconclusive while others are counterintuitive. For example, while Liu et al (2012),11 Yip et al (2008),12 and Yu et al (2010)13 found that the NCMS had little impact on utilization of outpatient services, Wagstaff et al (2009)14 and Qin et al (2014)15 provided evidence of increased utilization—to the extent that healthcare utilization improves health outcomes, these contradictive findings imply different impacts of the NCMS on the insureds’ health outcomes. Somewhat counterintuitive, Lei and Lin (2009)16 found that while the NCMS significantly increased utilization of preventive care, it did not improve the insureds’ health outcomes. This lack of conclusive evidence is particularly puzzling given the findings of significant impacts of the NCMS on outcomes that are not highly health-related, such as durable/nondurable consumption,17–19 self-employment,20 daily activities and cognitive function,21 and child education.22 In any case, these inconclusive findings render it difficult to derive useful lessons and policy recommendations regarding how the program can be further improved to achieve better population health outcomes or population well-being in other dimensions. Our study attempts to reconcile, at least partially, the apparent inconsistency in existing findings by examining two potential causes of it. More specifically, we seek to answer: are the discrepancies in previous findings (at least partly) driven by methodological issues? Our analysis on a panel dataset, the China Health and Nutrition Survey (CHNS) data, reveals two methodological flaws that exist in previous studies.
First, previous studies may have failed to focus on the most relevant (sub)population. For example, the four chronic diseases examined by Lei and Lin (2009)16—namely, apoplexy, diabetes, heart disease, and hypertension—are much more likely to occur among the elderly than younger individuals. The inclusion of a large number of young individuals in their analysis may have masked the true impact of the NCMS on incidences of chronic diseases among the elderly by bringing a substantial amount of noise into the health insurance-health outcome relationship. In fact, when we analyzed the dataset from Lei and Lin with a focus on individuals aged 55 or above, we found that an individual’s chance of being diagnosed with two (diabetes and apoplexy) of the four chronic diseases were significantly reduced following implementation of the NCMS.
Second, previous impact estimates may have been biased due to implausible identification assumptions. To address potential endogeneity issues raised by the voluntary nature of NCMS enrollment and unobserved confounding factors, most existing studies adopted the double-difference (difference-in-differences) method or its refined variations in their analyses.8,16-23 Yet to the best of our knowledge, only Bai and Wu (2014)17 and Su et al (2017)20 have tested the parallel-trend assumption needed for double-differencing to yield unbiased estimates. The falsification tests we perform in this re-evaluation study provide strong evidence against the plausibility of this identification assumption for a subset of chronic disease incidence outcomes. To relax this assumption, we apply the triple-difference (or “difference-in-differences-in-differences”) method proposed by Moffitt (1991)24 and Wagstaff (2010),25 which helps recover program impacts that cannot be identified by double-differencing.
Exploiting the longitudinal structure of the CHNS data, our triple-difference analysis uses two pre-NCMS datasets (collected in 2000 and 2004) to estimate and then control for differences in the time trends of health outcomes between the treatment and comparison groups in the absence of the NCMS. Our analysis suggests that the double-difference method adopted in most previous studies8,16,18,19,21-23 underestimates the impacts of the NCMS on incidences of chronic diseases among the elderly. Correcting potential biases in the double-difference estimates, our triple-difference estimates (some combined with propensity score matching) indicate that among the elderly, the NCMS reduced the incidences of apoplexy and diabetes by 3–6 and 3–4 percentage points, respectively. Analysis of another pre-program dataset collected in 1997 yielded similar estimates. These findings are robust to alternative empirical specifications and comparison groups used and help reconcile the discrepancy between the significant impact of the NCMS on healthcare utilization and the negligible impact on health outcomes found in previous studies. In this regard, our findings highlight the importance of collecting more pre-program data for testing key identification assumptions and the need for impact evaluations. They also echo the call for replication research for development impact evaluations,26 especially for programs that were not based on experimental designs. Moreover, although the program being examined, the NCMS, has been in place in more than a decade, our findings of its significant health impacts in its early stage suggest that other developing countries that are planning to implement universal health insurance programs (eg, Cambodia, Indonesia, Lao PDR, Malaysia, Myanmar, and the Philippines), may be able to benefit from China’s experience in reforming the national healthcare system.
Data
Survey and Sample
Our re-evaluation analysis is performed based on publicly and freely available data from the China Health and Nutrition Survey (CHNS, https://www.cpc.unc.edu/projects/china). The data do not include any private information of the study subjects and are not individually identifiable. Therefore, our data analysis would not involve any human subjects and would not have any ethical issues.
The China Health and Nutrition Survey (CHNS) is an ongoing survey project conducted in collaboration between the Caroline Population Center at the University of North Carolina and the National Institute of Nutrition and Food Safety at the Chinese Center for Disease Control and Prevention. The main survey covers nine provinces: Guangxi, Guizhou, Heilongjiang, Henan, Hubei, Jiangsu, Liaoning, and Shandong (the locations of which can be seen at: https://www.cpc.unc.edu/projects/china/about/proj_desc/chinamap). These provinces vary substantially in geographical, social, and economic features, and are usually considered to be broadly representative of China as a whole.
A multistage random sampling procedure was applied in 1989 to select target households. More specifically, counties in the nine provinces were stratified by income levels (low, middle, and high) and a weighted sampling scheme was used to randomly select four counties in each province. In addition, the provincial capital and a lower income city were selected whenever feasible, except that other large cities rather than provincial capitals had to be selected in two provinces. Villages and townships within the counties and urban/suburban neighborhoods within the cities were selected randomly. Currently, about 4400 households and 25,000 individuals are involved in the project. Follow-up surveys were conducted in 1991, 1993, 1997, 2000, 2004, 2006, 2009, 2011, 2013 and 2015. Information on quality control can be found on the official CHNS website at: https://www.cpc.unc.edu/projects/china/about/design/quality.
Since only individuals with a rural Hukou (permanent residential status) are eligible for NCMS enrolment, our analysis focuses on residents dwelling in rural survey sites. Our main analysis uses three consecutive panels collected in 2000, 2004, and 2006. Data collected in 1997 are also used for robustness checks. The resulting sample (involving four rounds of data) includes 3219 individuals and 10,404 individual-wave observations. As discussed in the Introduction section, in order to focus on the subpopulation that is the most vulnerable to chronic diseases, we exclude individuals who were under the age of 55 in 2004 (the baseline year) from the analysis. To avoid confounding the impacts of the NCMS with those of other programs, rural individuals enrolled in other health insurance programs are also excluded from the analysis. Finally, taking advantage of longitudinal structure of the CHNS data, we imputed missing information from the previous or later wave with available information to ensure that we have the maximum sample size available. These manipulations result in a main analytical sample of 1351 individuals and 3872 individual-wave observations.
Treatment and Comparison Groups
To facilitate impact evaluation, we define the treatment group as rural residents who were enrolled in the NCMS sometime between 2004 ( ) and 2006 (
 ) (although the NCMS was implemented in 2003, the CHNS data indicate that only 3% of rural residents participated in the program in 2004; thus, we chose 2004 rather than an earlier year as the baseline).
There are two potential comparison groups. The first consists of non-participants who resided in communities (villages) covered by the NCMS but had not participated in the program by 2006. The most obvious advantage of this group is that non-participants in this group share the same environment with the participants; thus, the time trend of health outcomes for this group should be similar to that for the treatment group in the absence of the NCMS. A potential disadvantage of this group is its relatively small sample size (Table 1: N = 419 in 2000, 2004, and 2006 combined). The relatively small sample size of this group is due to high take-up rates in the NCMS communities, which led to relatively small proportions of non-participants in those communities. The CHNS data suggest that in 2006, 62% of rural Hukou holders were enrolled in the NCMS and 10% were enrolled in other health insurance programs; only 28% were not enrolled in any program.
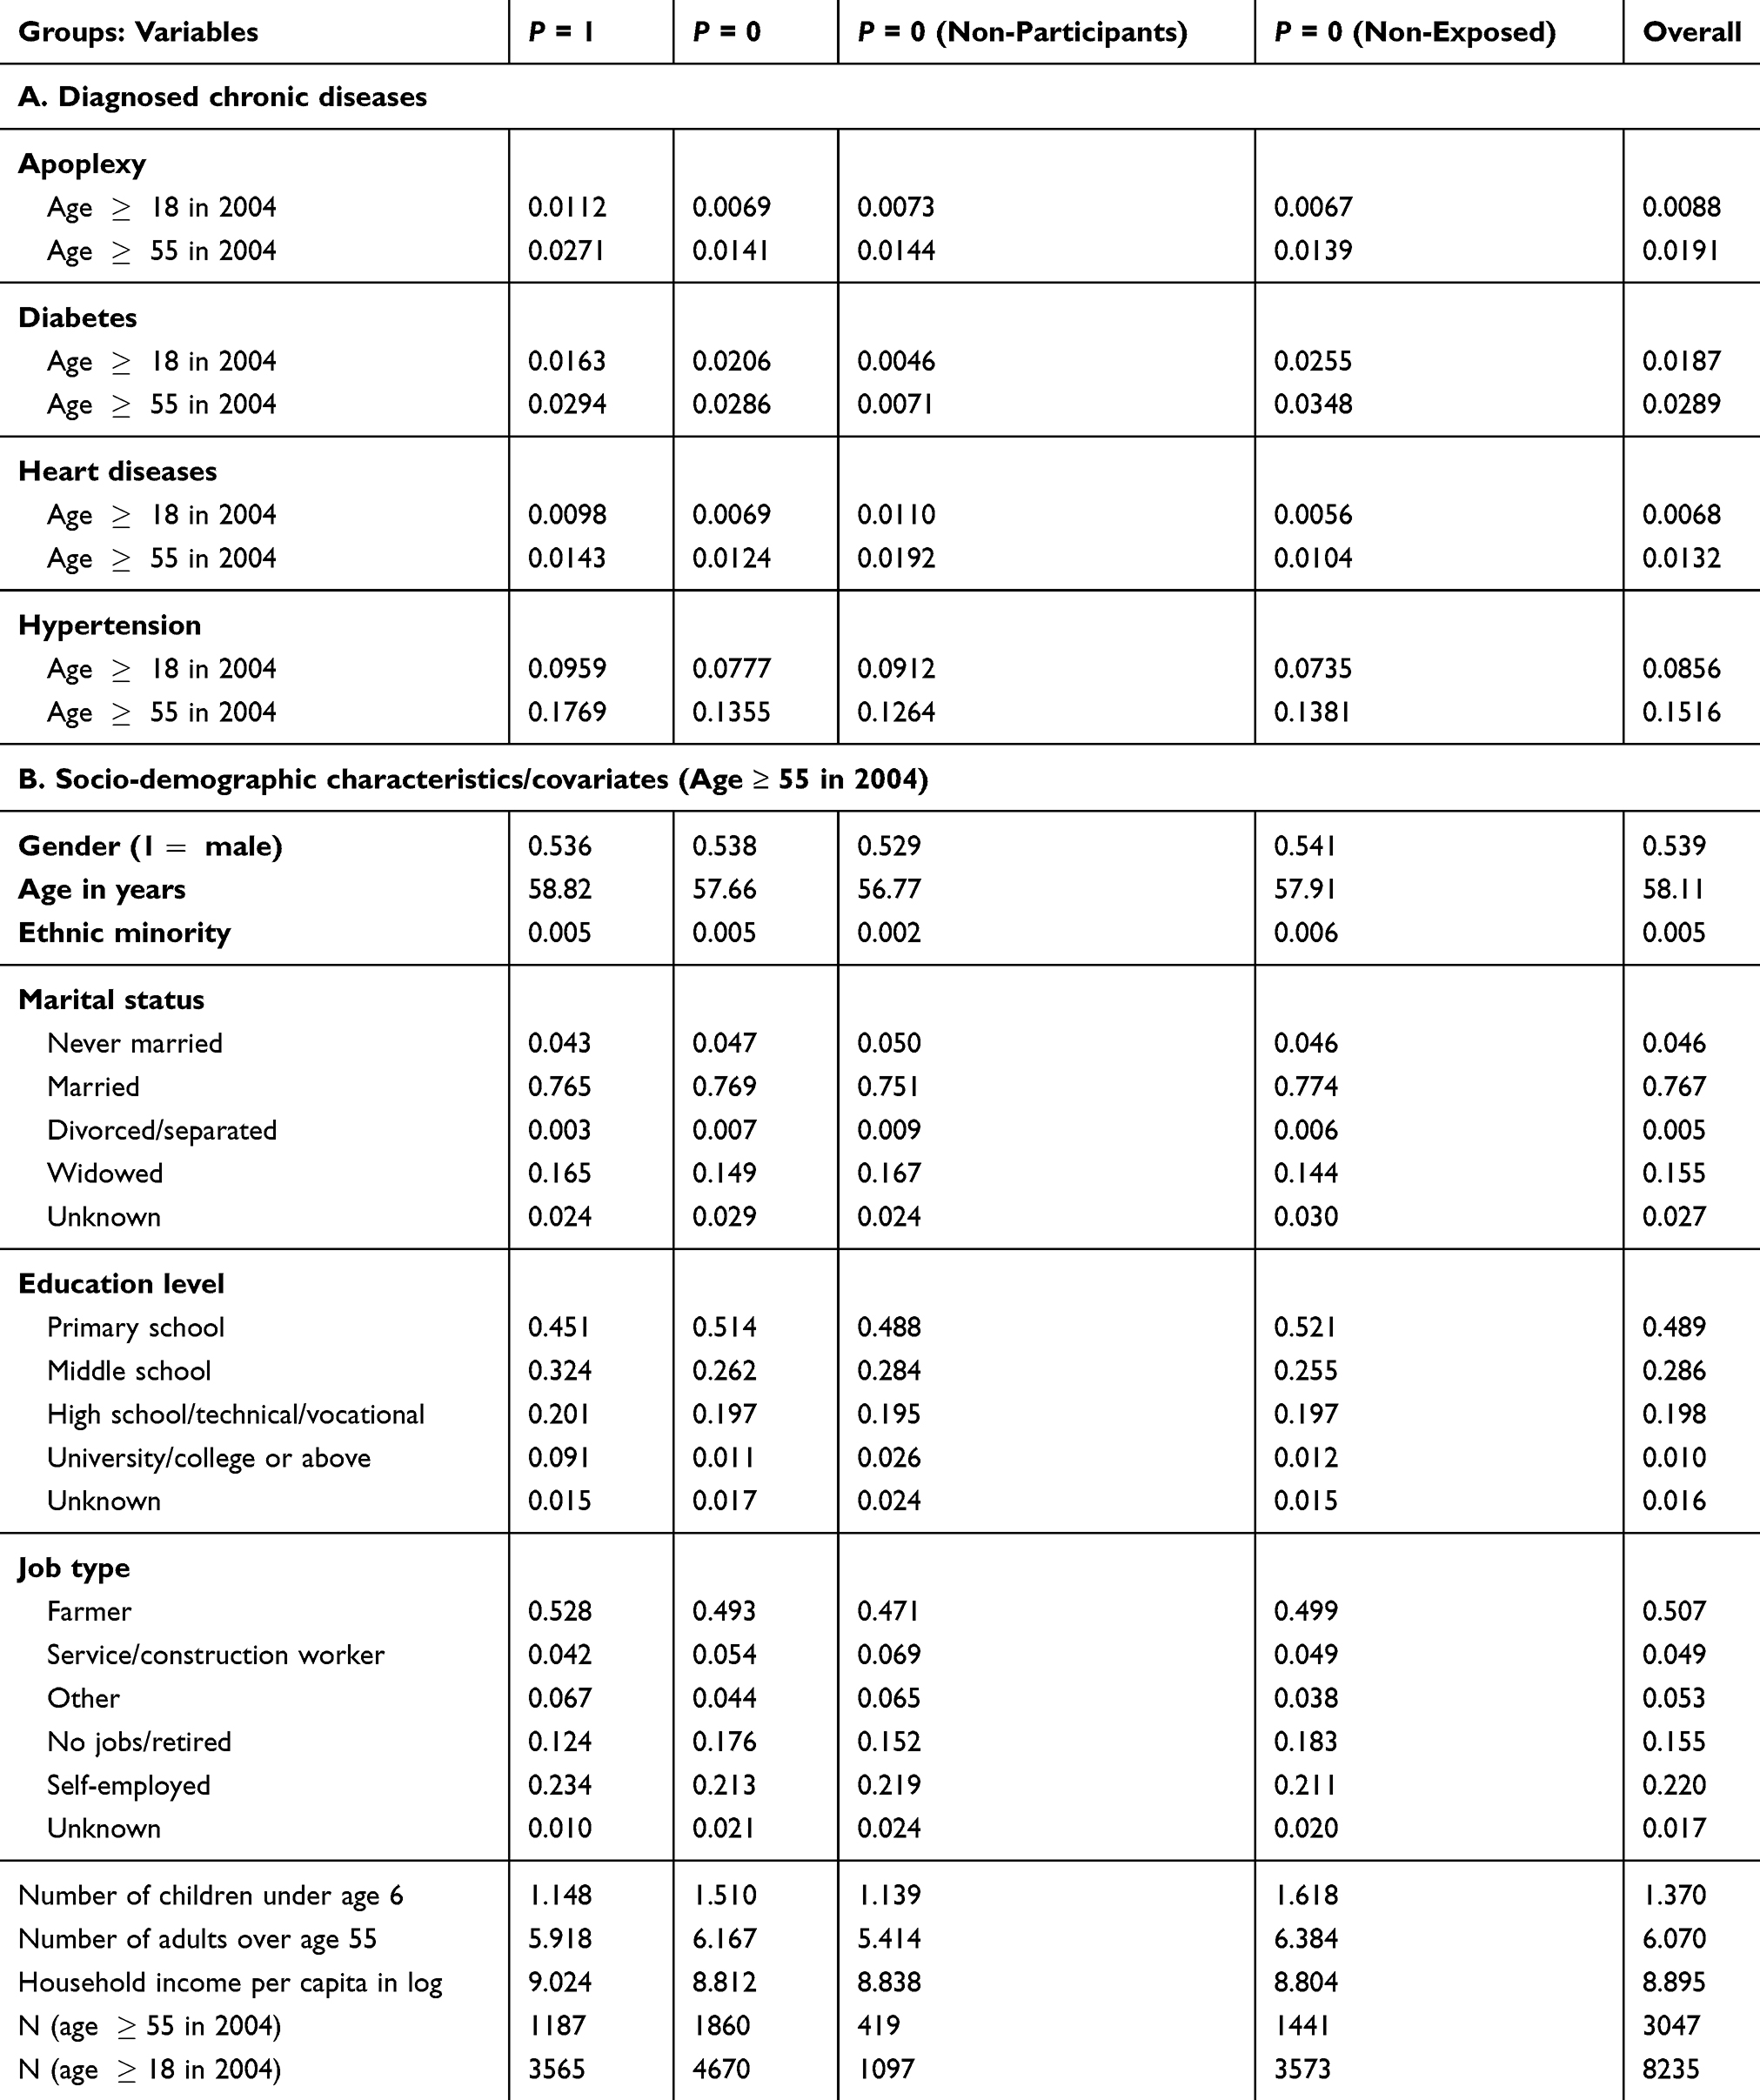 |
Table 1 Means of Variables Used in Estimation (2000, 2004, and 2006 Waves Combined) |
Another potential concern is that health outcomes of this group may be contaminated by spill-overs due to the improved medical environment in the NCMS communities. However, even if such spillovers exist, they are likely to cause underestimation of NCMS health impacts because, in the presence of positive spillovers, health outcomes of non-participants in NCMS communities would be better than their counterfactual outcomes had the NCMS not been implemented. Thus, health impacts estimated using the non-participant group as the comparison group can be viewed as lower bounds of the true impacts.
The second comparison group consists of individuals residing in communities that had not been covered by the NCMS by 2006. This non-exposed group never had the opportunity to enroll in the program during the entire study period, thus spill-over is unlikely to be a concern for this group. However, as Table 2 suggests, a major concern of this group is that non-NCMS communities may differ from NCMS communities in such aspects as communication and transportation conditions. Thus, health outcomes of individuals residing in these two types of communities may not evolve in a similar way in the absence of the program. Nevertheless, because our triple-differencing method (discussed in "Empirical Framework" section) allows for different time trends of untreated outcomes between the treatment and comparison groups, potential untreated differences between them still provide an opportunity for assessing the robustness of estimation results. Therefore, estimates obtained using both comparison groups will be compared below.
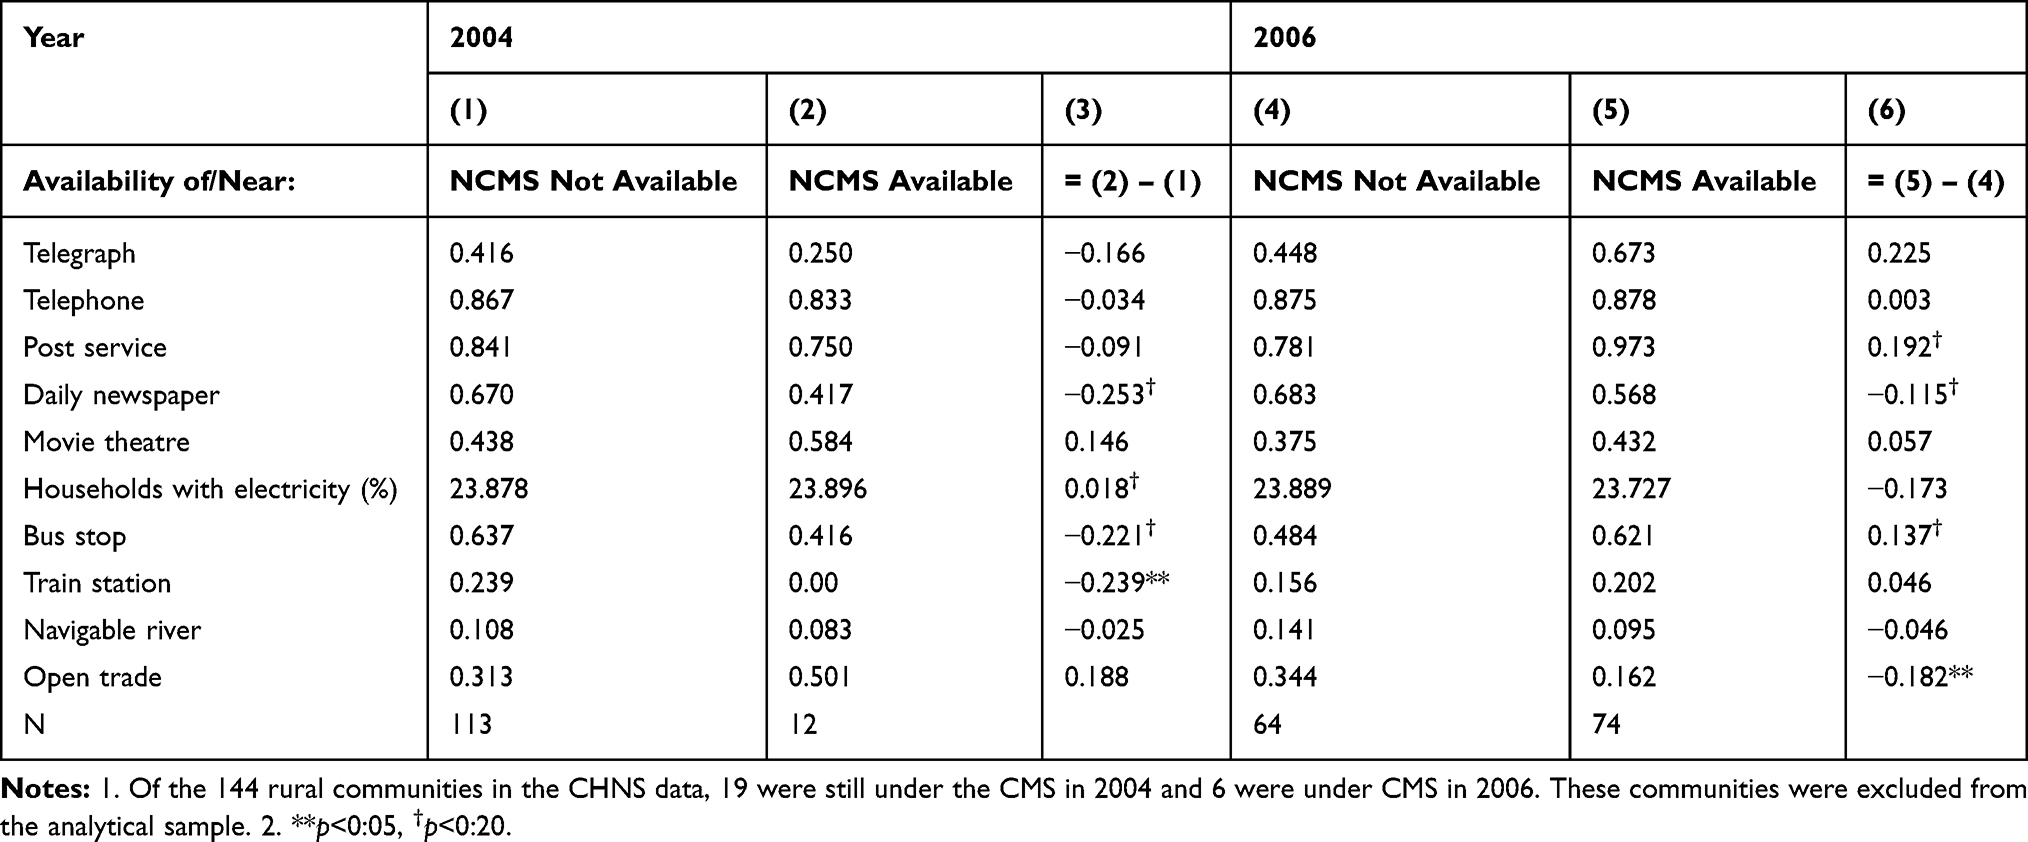 |
Table 2 Community Characteristics, NCMS and Non-NCMS Communities in 2004 and 2006 |
Outcomes of Interest
The outcome variables of interest in this study are the incidences of being diagnosed with the following four chronic diseases: apoplexy, diabetes, heart disease, and hypertension. The values of these variables are coded from answers to the following questions asked during the survey: “Has a doctor ever told you that you suffer from disease  ?”, where disease
  refers to “hypertension,” “diabetes,” “heart disease,” or “apoplexy”). While these diseases have been studied by Lei and Lin (2009),16 our analysis differs from theirs in three important ways. First, while their analysis involves all adults over age 18, we follow Wang et al (2009)23 and restrict the main analytical sample to include only individuals aged 55 and above in 2004 (the baseline), who are more likely to suffer from chronic diseases than younger individuals (Table 1). Analysis of all adults over age 18 is also performed for comparisons. Second, while Lei and Lin adopt double-differencing (combined with propensity score matching) as one of their key methods, our analysis is mainly based on triple-differencing (discussed in the next section). Third, while Lei and Lin use a single comparison group in their analysis, we use two (the non-participation group and the non-exposed group) for robustness checks.
Empirical Framework
Following Wagstaff’s evaluation of Vietnam’s SHI program,25 our study exploits the longitudinal structure of the CHNS data to implement a triple-difference estimation. Based on the potential-outcome framework laid by Rubin (1974),27 this section develops a triple-differencing method and illustrates how it may recover program impacts that cannot be identified by the commonly adopted double-difference method.
Let t denote time: the NCMS started sometime between the baseline ( (1) ) and the endline (
 ) of the study period. Let
  denote a sample individual’s enrollment status:
  if the individual enrolled in the program sometime during the study period (thus belonging to the treatment group) and
  if the individual has never enrolled (thus belonging to the comparison group). Corresponding to the two values of
  , there are two potential outcomes for a health outcome of interest (
 ):
):  is the treated outcome of an individual, observed only when
  ;
;  is the untreated outcome of the same individual, observed only when
  . Given this setup, the impact of the NCMS on outcome H for the enrollees (
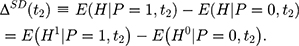
 )—the average treatment effect on the treated (ATT) evaluated at time
  —can be defined as:

Because only one of the potential outcomes,  or
or  , is observed at a given point in time for any individual,
  cannot be directly computed. Rather, it must be estimated.
Single-Differencing and Selection Bias
Double-differencing has been the workhorse method for evaluating the impacts of the NCMS.8,16–23 The most appealing feature of double-differencing is that it may address potential bias embedded in single-differencing (and some of its refined variants), which is the usual starting point of analysis when only non-experimental cross-sectional data are available. The single-difference method compares observed outcomes between the treatment and comparison groups at the endline ( (2) ):
):
However, (3) is likely to be a biased estimator for
  because the single treatment-comparison difference may capture the influences of unobserved factors (and the associated confounding effects) on
  . To see the bias, one can subtract
  from Equation 2, add it back, and rearrange terms to yield the following:
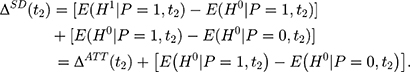
The selection bias involved in  , ie
, ie  , reflects the treatment-comparison difference in untreated outcomes (
 ’s) in the absence of the program. Clearly, only when this difference is zero, ie
  , can
, can  be an unbiased estimator for
  . However, voluntary enrollment into the NCMS may lead to a nonzero treatment-comparison difference in
  ’s. In addition, because the term
  in the selection bias is unobservable, it is difficult (if not impossible) to directly control for selection bias in estimation with only cross-sectional data. When there is only one cross-section of data, the hope is that, conditional on a set of observed characteristics,
  , selection bias can be eliminated, ie
  . Multiple regression or propensity score matching can then identify
  . However, whether such conditioning suffices to eliminate selection bias is open to question because it is silent on the issue of “selection on unobservables”.
Double-Differencing and the Parallel-Trend Assumption
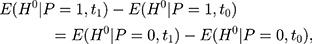
If baseline data are available, one can exploit pre-program information to eliminate (or at least reduce) selection bias. The double-difference estimator subtracts the observed baseline treatment-comparison difference, (4) , from the observed endline difference,
  , yielding the following:

To derive the identification assumption needed for double-differencing to work, we plug the corresponding realized outcome into each of the terms involving (5) in Equation 4, which leads to the following:
where the first equality uses the fact that no one was treated at the baseline (ie, (6) for everyone at
  ) and the last equality is a direct implication of Equation 3. Equation 5 implies that the double-difference estimator,
  , is unbiased for
  if and only if the following condition holds:
In other words, the endline treatment-comparison difference in untreated outcomes should be the same as their baseline counterpart for double-differencing to work (ie, the treatment-comparison difference should be fixed over time). Note that Equation 6 can be written as 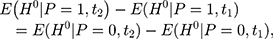 which is usually called the parallel-trend assumption. As line segments AB and A’B’ in Figure 1A illustrate, this assumption means that in the absence of the program, the changes in the mean untreated outcomes from
  to
to  are the same for the treatment and comparison groups.
 |
Figure 1 Double-difference and triple-difference estimators. Panel (A): Double-difference estimator. Panel (B): Triple-difference estimator. |
Under the parallel-trend assumption, the double-differencing estimator can be obtained by estimating the following regression model using both baseline and endline data:
(7)
where  is the observed outcome of interest,
  is a dummy for the participants group that participate at
  , and
, and  is a dummy for endline observations (ie,
  denotes baseline observations). The ordinary least-squares (OLS) estimate of the parameter
  is the double-difference estimate of program impact
  . The regression model often includes a set of covariates or is combined with propensity score matching (PSM).
The majority of existing studies on NCMS impacts invoke the parallel-trend assumption,8,16–23 under which double-differencing may recover program impacts that cannot be identified by single-differencing. However, this assumption fails if the treatment and comparison groups have different untreated time trends, as illustrated by segments ABC and A’B’C’ in Figure 1B. In that case, the bias in Equation 5, 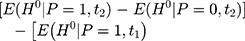
 , will not vanish and the double-difference estimator will be biased for
  . Although some observed characteristics can be added to the model to help control for the difference in the untreated time trends, this strategy cannot eliminate bias that is due to time-varying unobserved factors.
Triple-Differencing and Testing for Parallel Trends
The parallel-trend assumption cannot be tested with only data collected at (8) and
and  because the untreated outcome for the treatment group,
  , is unobservable at
  . But with another pre-program dataset collected at
  , we can assess the validity of this assumption by testing the following condition:
in which all terms are observable. The rationale behind this test is that if the untreated time trends of outcome H from (9) to
to  are parallel in the absence of the program, those from
  to
to  should also be parallel because the program is absent in that period. In practice, one can test this condition (Equation 8) by applying double-differencing to two pre-program datasets collected at
  and
and  , eg, by estimating the following model (perhaps with a set of covariates included):

where  is a dummy for observations at
  , the “placebo” post-program period. If the parallel-trend assumption holds, OLS estimates of
  should be close to zero.
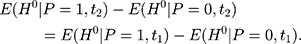
If the parallel-trend assumption is rejected, one can refine the double-difference estimator by using the two pre-program datasets to estimate and control for the treatment-comparison difference in untreated time trends. The assumption needed to eliminate the bias term in Equation 5 is that the treatment-comparison difference in untreated time trends from (10) to
to  is a direct extrapolation of that from
  to
to  :
:
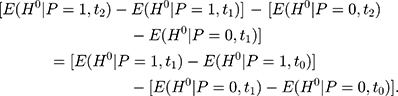
Or equivalently,
(11)
As illustrated in Figure 1B, Equation 11 means that the length difference between line segments C’D and DE for the treatment group is identical to that between segments CF and FG for the comparison group. In other words, the assumption in Equation 10 allows the treatment and comparison groups to have different untreated time trends, assuming that the untreated time trends of the two groups grow at the same rate.24
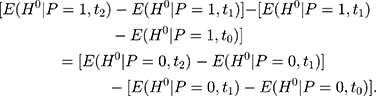
Note that the right-hand side of Equation 10 is indeed a double-difference estimator applied to the two pre-program datasets, (12) (since
  for all individuals at both
  and
and  ). Thus, under this condition, we can eliminate the bias term in Equation 5 by subtracting the double-differenced outcome observed in the period from
  to
to  .
.  , from the double-differenced outcome observed in the period from
  to
to  ,
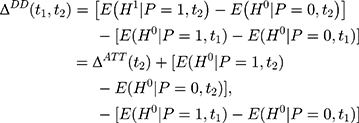
,  . This leads to the triple-difference estimator:
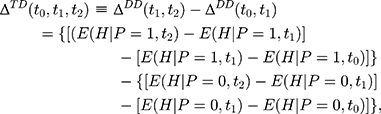
which is unbiased for (13) under the assumption in Equation 10. In practice, triple-differencing can be implemented by estimating the following model,
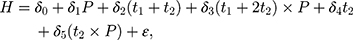
using data collected at  ,
,  , and
, and  . The OLS estimate of the parameter
  is the triple-difference estimate of the program impact on
  .
.
To assess the robustness of our triple-difference results, we include a set of individual-level and household-level covariates in some of our regressions below. These covariates include sampled individuals’ gender, age, ethnicity, marital status, education level, job type, number of children, and household income. Definitions and summary statistics of these covariates are reported in Table 1. To further isolate the impacts of the NCMS from those of community-level confounding factors (observed or unobserved), we include the full set of community fixed effects (dummy variables) as covariates.
To reiterate, our empirical method controls for the influence of potential confounders and the associated bias by (i) restricting the analytical sample to the subpopulation that is most vulnerable to chronic diseases, the outcomes of interest in this study, (ii) excluding individuals who were enrolled in health insurance programs other than the NCMS, the program of interest, (iii) applying triple-differencing to control for potentially different untreated time trends in incidences of chronic diseases, and (iv) including a set of individual/household-level covariates and the full set of community fixed effects (to eliminate the influence of any time-invariant confounders at the community level) in the estimation (combined with PSM).
Results
Patterns of Chronic-Disease Outcomes
Before turning to estimation results, it is helpful to first examine the patterns of chronic-disease outcomes. The needs to focus on elderly individuals and to allow for different time trends between the treatment and comparison groups are clearly suggested by the time-series plots in Figure 2, which trace out the incidences of disease diagnosis over time for both comparison groups. To be consistent with Lei and Lin’s definition, the comparison group used in the plots combines the non-participant and non-exposed groups defined above in "Treatment and Comparison Groups Treatment and Comparison Groups" section. The contrast between time-series patterns for all adults (Panel A) and those for the elderly (Panel B) suggests the need to focus on the latter. While time trends in Panel A and Panel B exhibit similar patterns, the treatment-comparison differences for all adults are much less pronounced than those for the elderly alone. The low incidences of chronic diseases among all adults render it difficult to detect impacts of the NCMS on the elderly.
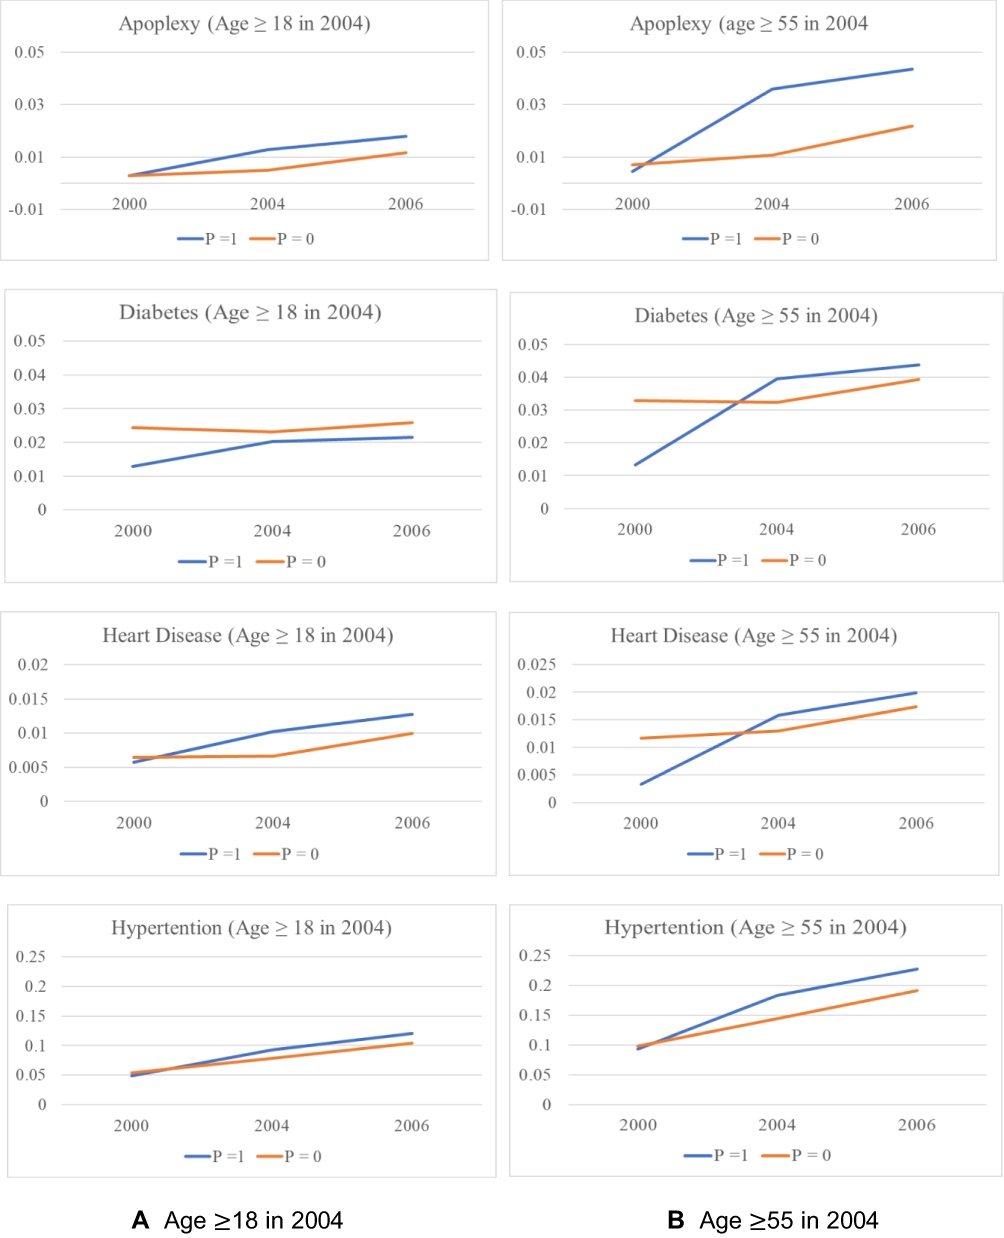 |
Figure 2 Time trends of diagnosed chronic diseases (2000–2006). Panel (A): Age |


The need to allow for different time trends between the treatment and comparison groups is suggested by the contrast in time-series patterns for the two groups. Note that Table 1 shows that the means of most of the individual/household-level characteristics are similar between the treatment and the two comparison groups, suggesting that the treatment-comparison differences in health outcomes revealed in Figure 2 are likely driven by NCMS enrolment and/or the between-community differences suggested by Table 2. Echoing these between-community differences, trends in chronic health outcomes in the pre-program period (2000–2004) are quite different between the two groups, especially among elderly individuals (Panel B), casting serious doubt on the validity of the parallel-trend assumption (which will be formally tested in "Testing the Parallerl-Trend Assumption" section). Our triple-difference estimation below relaxes this assumption.
Testing the Parallel-Trend Assumption
Although Figure 2 already provides some suggestive evidence against the parallel-trend assumption, especially for elderly individuals, it is helpful to formally test the plausibility of the parallel-trend assumption before discussing the main estimation results of this paper. We test this assumption by estimating Equation 9, applying double-differencing to the two pre-NCMS datasets collected in 2000 and 2004, while “pretending” the latter as the post-program period. If trends in untreated health outcomes are indeed parallel, one would expect double-difference estimates of γ3 in Equation 9 to be statistically insignificant. However, results of the test suggest that regardless of the comparison group being used and whether covariates are included in the regression, the “placebo” double-difference estimates are significantly positive for two (apoplexy and diabetes) of the four diseases among the elderly (Table 3), providing further evidence against the validity of the parallel-trend assumption for these two diseases.
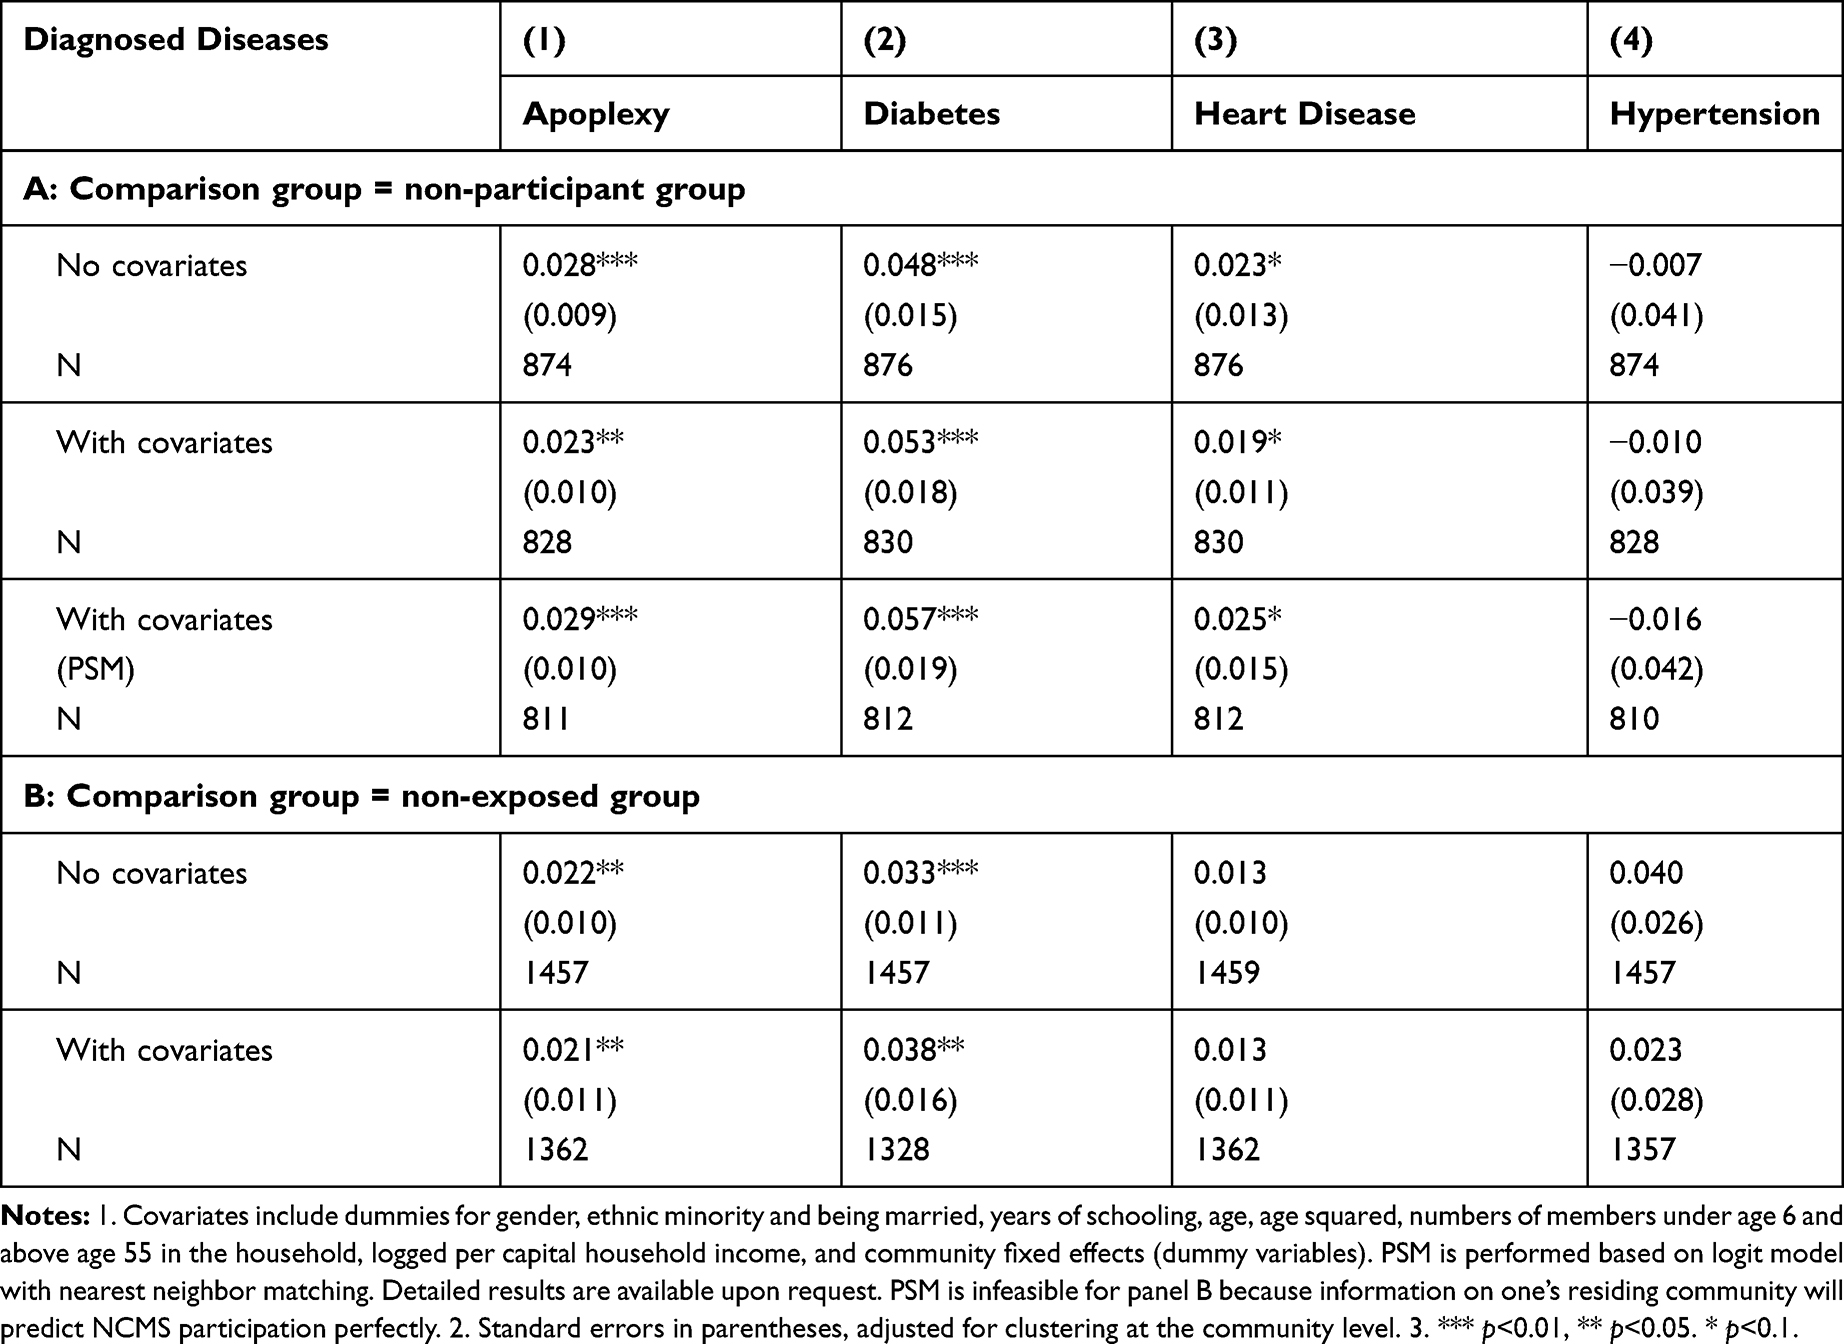 |
Table 3 Falsification Tests: Double-Differencing Using Two Pre-NCMS Datasets (Age ≥ 55 in 2004) |
The positive “placebo” double-difference estimates suggest that before the NCMS was implemented, apoplexy and diabetes developed more quickly among individuals in the treatment group than those in either comparison group. This in turn implies that the true impacts of the NCMS on apoplexy and diabetes diagnoses are likely to be underestimated by double-differencing. Since the parallel-trend assumption ignores the treatment-comparison differences in the untreated trends of these diseases, in estimation, part of the true impacts may have been offset by the more rapid development of these diseases in the treatment group in the absence of the NCMS.
Impacts of NCMS Enrolment on Chronic-Disease Diagnosis
Results reported in panels A-B of Table 4, which were obtained using the non-participants group as the comparison group, confirm the above expectation. Whereas the double-difference estimates (of  in Equation 7; Panel A of Table 4) reveal little impact of the NCMS on any of the four chronic diseases, the triple-difference estimates (of
  in Equation 13; Panel B of Table 4) indicate that the NCMS has significantly negative impacts on apoplexy and diabetes diagnoses. Specifically, the NCMS is found to reduce the incidences of being diagnosed with apoplexy and diabetes by 4 and 3–6 percentage points, respectively. Note also that the triple-difference estimates for apoplexy and diabetes (Panel B) are more than double their double-difference counterparts (Panel A), suggesting that double-differencing underestimates the role the NCMS plays in preventing these two diseases.
 |
Table 4 Estimated Impacts of the NCMS on Disease Diagnosis (Age |

Robustness Checks
To assess the robustness of the triple-difference results, we perform additional analyses to rule out a number of potential threats to our key identification assumption (Equation 10). Note first that the triple-difference estimates in Panel B of Table 4 are similar with and without covariates in estimation (although the estimates with covariates are in general slightly less significant, presumably due to smaller sample sizes resulting from missing values of some covariates)—results with PSM are also quite comparable with regression-based results. Such a similarity suggests that our triple-difference estimates are robust to the problem of “selection on observables”. However, concerns over “selection on unobservables” merit more in-depth investigations.
A. Sample attrition. The first concern is sample attrition: the sample used to obtain the triple-difference estimates in Panel B of Table 4 is unbalanced across time periods because some individuals dropped out of the survey in one or two of the waves. Sample attrition may lead to two problems. First, if individuals dropped out of the sample due to health-related reasons, attrition may itself lead to biased estimates. For example, if individuals with relatively poorer health dropped out at the endline, then the health status of individuals remaining in the sample will appear to be “improved” on average, which will lead to an overestimation of the health impacts of the NCMS. Second, with an unbalanced panel dataset, differencing methods cannot entirely eliminate unobserved individual/household fixed effects—say, genetic fitness—that may cause our key identification assumption (Equation 10) to fail. To see how sample attribution affects our estimates, we construct a real (balanced) panel that includes only individuals who showed up in all three waves in 2000, 2004, and 2006. The results obtained from this real panel (Table 4, panel C) are similar to their counterparts reported in Panel B of Table 4, suggesting that sample attrition is not a major threat to our identification strategy and findings.
B. Validity of the equal-change-rate assumption. The second concern is that the assumption in Equation 10, which requires equal growth rates of untreated outcomes between treatment and comparison groups,24 may also be too restrictive. We conduct two checks to assess the plausibility of this assumption. First, we replace the first pre-NCMS dataset collected in 2000 (ie, the  dataset needed to perform triple-differencing) with the dataset collected in 1997 and re-perform triple-differencing. The triple-difference estimates with
  (Table 4, panel D) are quite similar to those reported in Panel B of Table 4, lending further support to the plausibility of our identification assumption (Equation 10).
Second, we perform triple-differencing using another comparison group. Recall that the main advantage of triple-differencing over double-differencing is that the former allows for treatment-comparison differences in the untreated time trends—it estimates and then controls for them in estimation. Because equality in the time trends of untreated outcomes (required by double-differencing) is no longer required by triple-differencing, we have more flexibility in choosing the comparison group, which need not share many common features with the treatment group. The plausibility of our key identification assumption (Equation 10) can then be checked using estimates obtained using different comparison groups. Thus, we re-estimate all regressions reported in Table 4, this time using the non-exposed group as the comparison group. The new estimates (Table 5, Panels A-D) reveal two patterns that are similar to those found in Table 4 (although some estimates are slightly less significant): first, double-differencing underestimates NCMS impacts for apoplexy and diabetes; second, triple-differencing estimates are robust to different samples used in estimation.
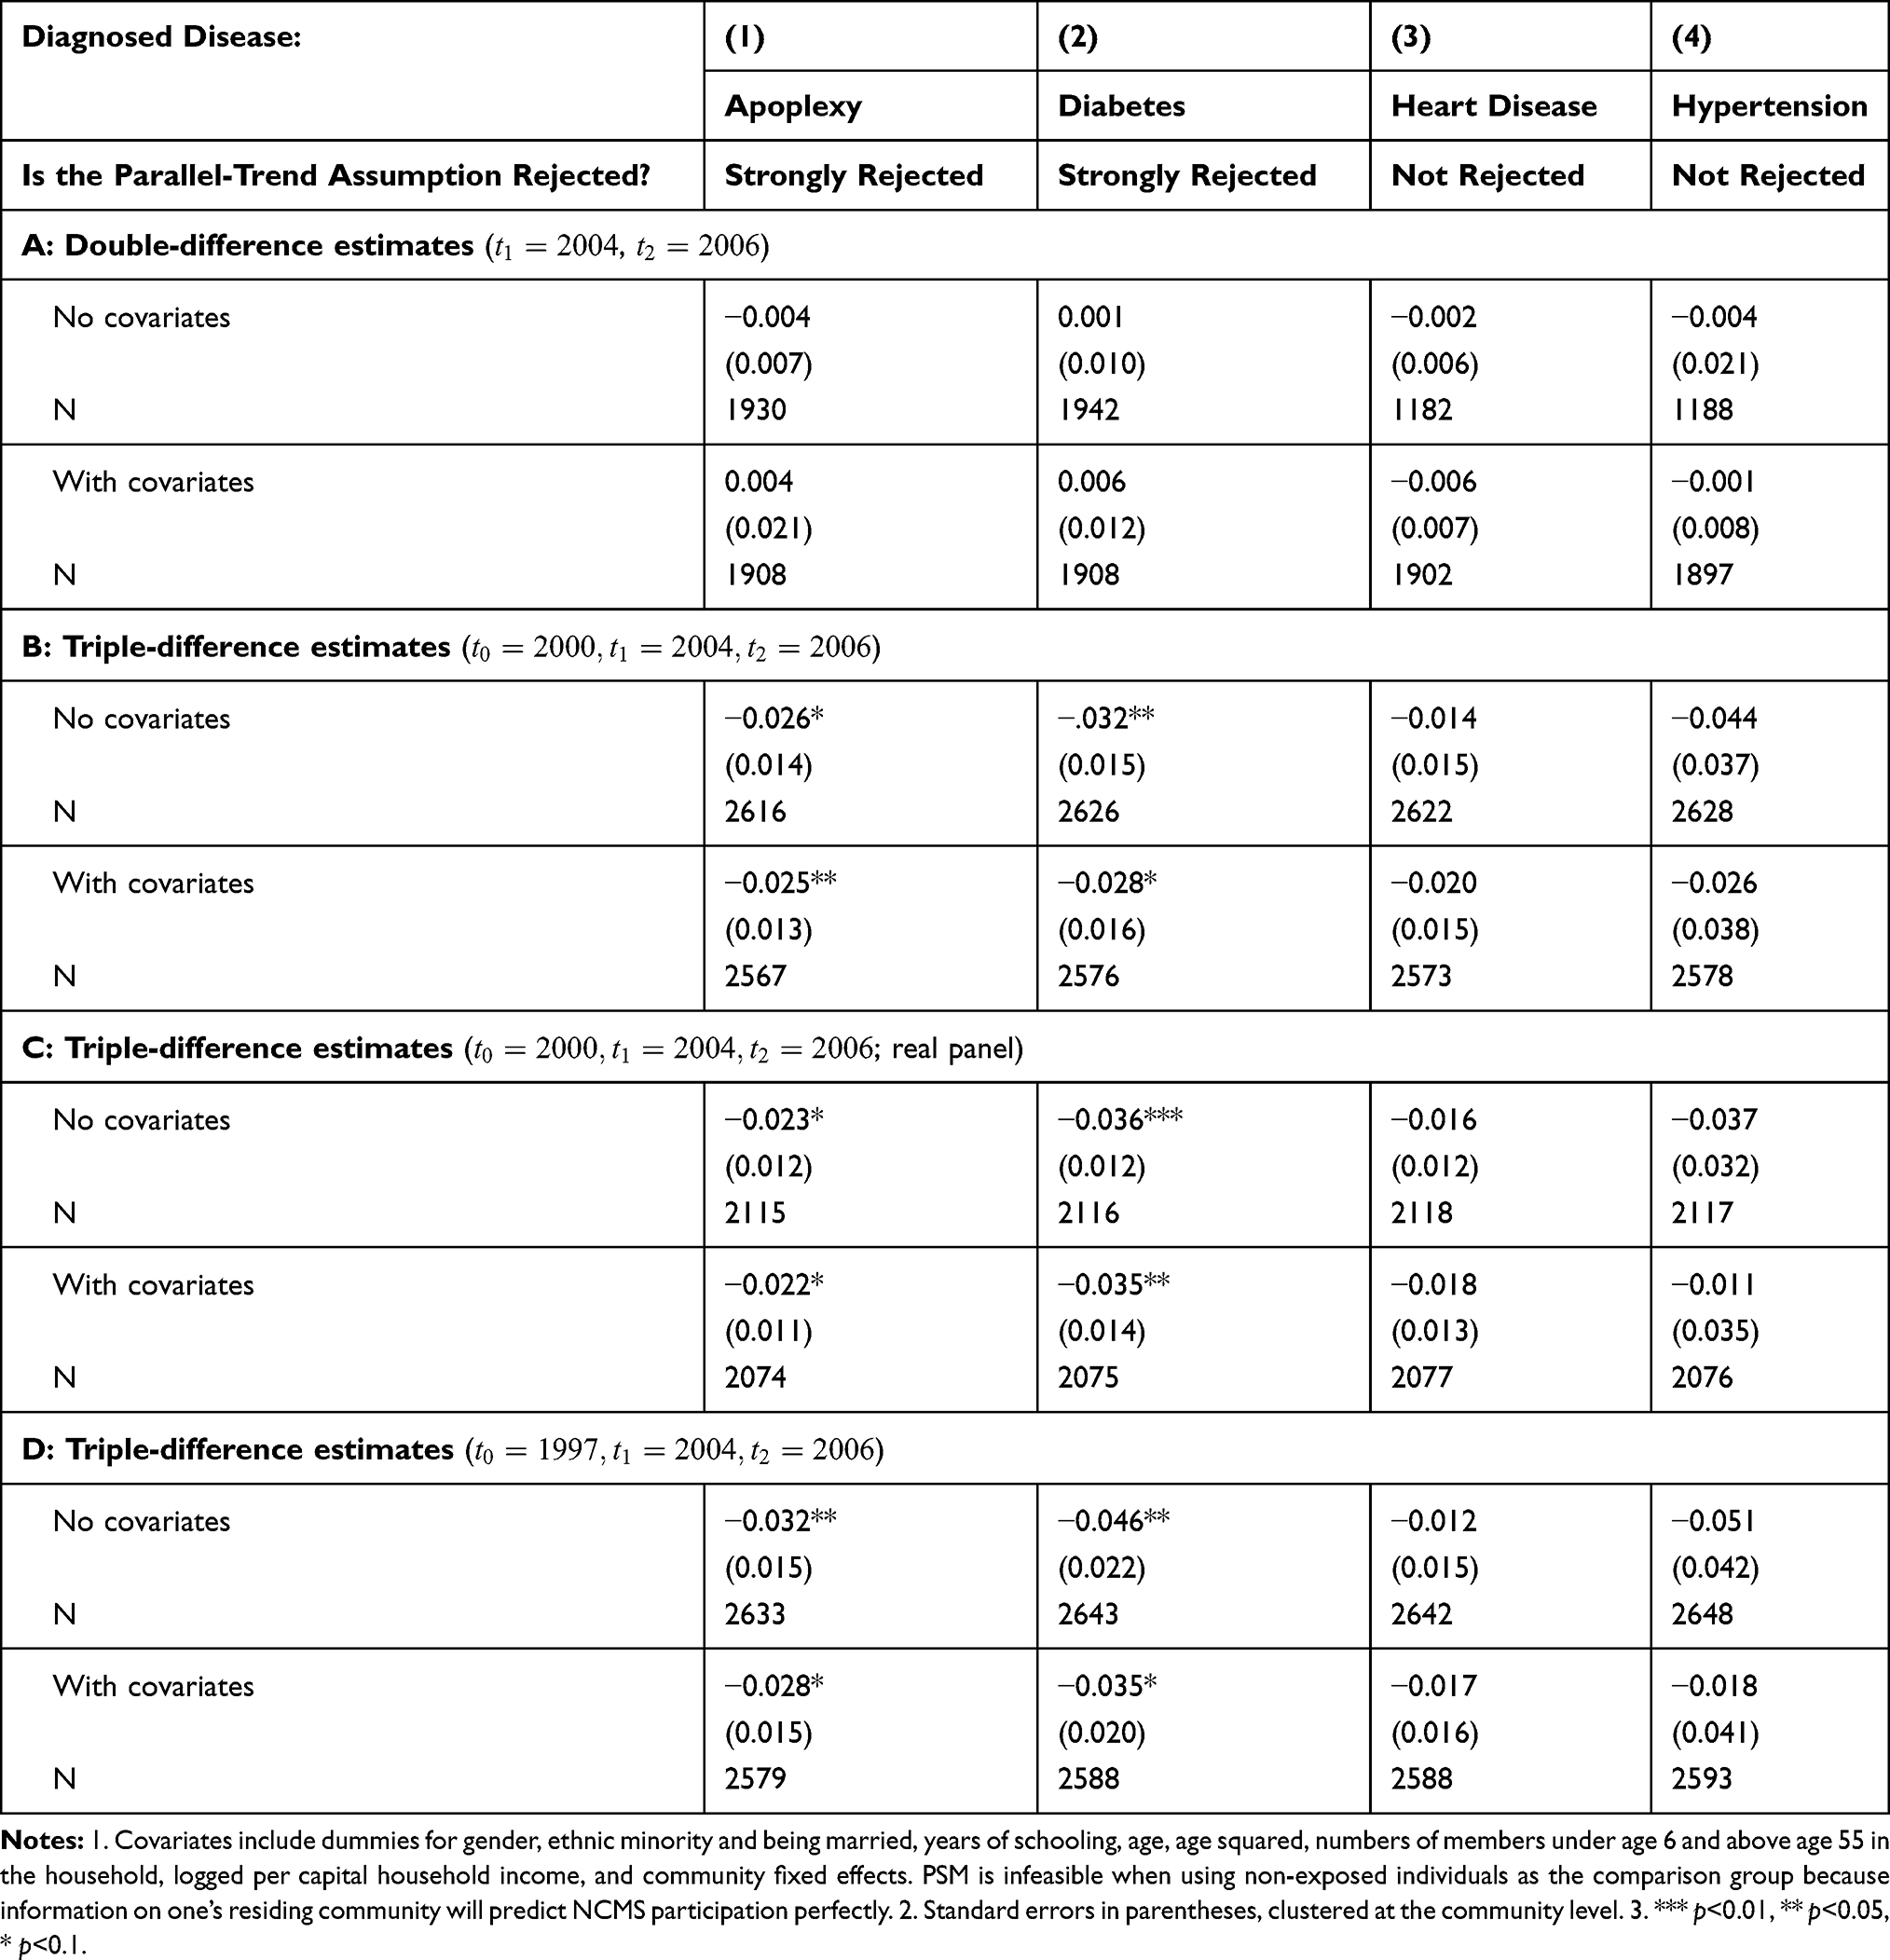 |
Table 5 Estimated Impacts of the NCMS on Diseases Diagnosis (Age |

C. Self-selection into healthcare utilization. While our triple-difference estimates survive a series of robustness checks, one might still be concerned with the possibility that an individual will be diagnosed for a disease only if he/she actually sees a doctor, thus confounding the estimated impacts of the NCMS on diagnosed diseases with its impacts on healthcare utilization. Indeed, Lei and Lin (2009)16 and Qin et al (2014)15 found that the NCMS significantly increases individuals’ utilization of preventative care and physical examination. However, the positive impact of the NCMS on an individual’s healthcare utilization helps strengthen our findings. Since the participants are more likely to utilize healthcare services, they will be more likely to be diagnosed with diseases even if the NCMS does not have any real impact on their health. Therefore, finding significantly negative impacts of the NCMS on disease diagnosis implies that the true impacts of the NCMS on individuals’ health outcomes are indeed larger than those reported in Table 4–5.
In summary, the checks performed in this section rule out a number of potential threats to the validity of our key identification assumption (Equation 10), helping to strengthen our triple-difference findings. These findings suggest that the NCMS did improve elderly enrollees’ health outcomes in rural China, at least for apoplexy and diabetes diagnoses. These impacts are likely to be underestimated by double-differencing, which invokes the implausible parallel-trend assumption.
Discussion
What Drives the Differences in Findings?
Our triple-difference analysis has recovered significant impacts on the incidences of chronic diseases (at least for apoplexy and diabetes) among elderly NCMS enrollees, which were not found in previous studies that employed the same dataset. Yet what is driving the differences in findings? Note that our analysis thus far differs from those in previous studies in both the sample used (all adults versus elderly adults) and the method employed (double-difference versus triple-difference). To further pin down the cause of different findings, we perform the same analyses discussed above, this time focusing on the sample that were examined most previous studies, ie rural adults above age 18.
Table 6 reports both double-difference and triple-difference estimates, based on both comparison groups. Since the estimates obtained with or without covariates are similar, we only report those with covariates for brevity. While the point estimates for all adults are in general smaller in magnitude compared to those for elderly individuals (Tables 3 and 4), triple-differencing still detects some significant impacts of the NCMS. For example, its impact on apoplexy diagnosis is detected using the non-participants comparison group (Panel A), and its impact on diabetes diagnosis is detected using the non-exposed comparison group (Panel B). In contrast, as with the findings of Lei and Lin (2009),16 double-differencing reveals essentially no impact. Consistent with these contrasts, falsification tests reject the plausibility of the parallel-trend assumption for apoplexy in Panel A and that for diabetes in Panel B. These findings suggest that even if one believes that the analytical sample should include all adults above age 18, the plausibility of the parallel-trend assumption should be checked before one can accept the credibility of double-difference estimates.
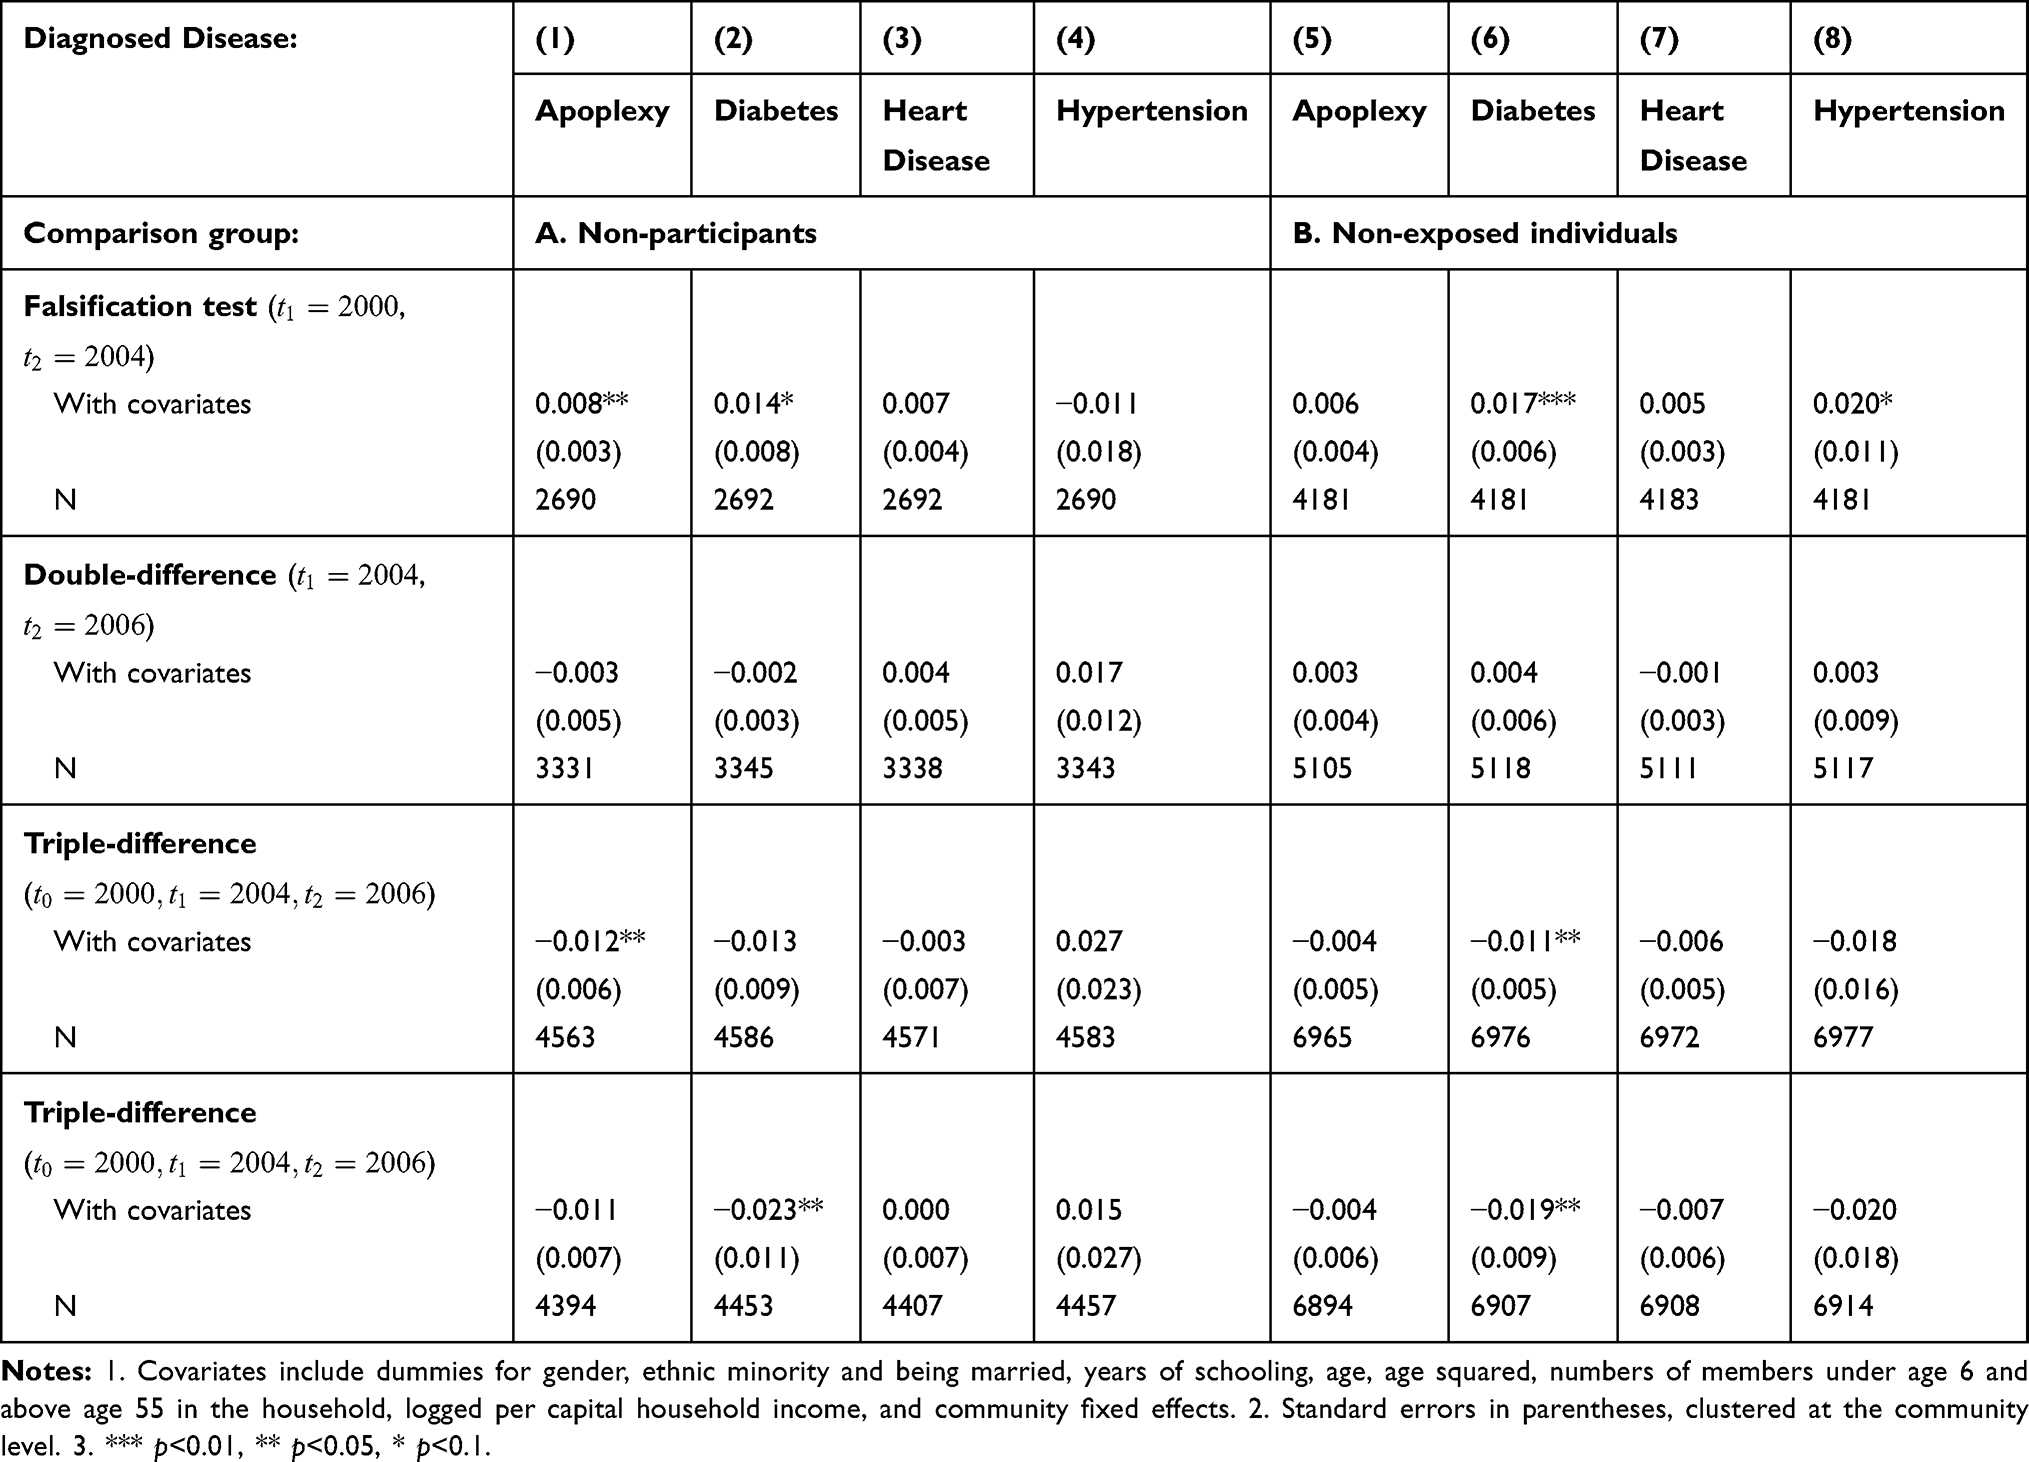 |
Table 6 Estimated Impacts of the NCMS on Disease Diagnosis (Age |

Limitations of the Present Study
While our triple-difference estimation recovers some health impacts of the NCMS that were not discovered by previous double-difference analyses, triple-differencing is not without limitations. Note that the key difference between triple-differencing and double-differencing lies in their identification assumptions. While triple-differencing relaxes the restrictive “parallel-trend” assumption required by double-differencing, it needs to assume that pre-program time trends in untreated outcomes can be safely extrapolated to later time periods; there is no guarantee that this will always hold.
There are also limitations to our data. First, while the CHNS might be the most comprehensive longitudinal survey on health issues in China, it covers only about one-third of provinces in China. Although the nine project provinces were chosen carefully to represent China a whole, the representativeness of the CHNS data might not be ideal. Second, the CHNS data do not contain sufficient information for us to pin down the causa channels of the health impacts of the NCMS, some of which are discussed in the next subsection.
What Is Driving the Health Impacts?
Although identifying the causal channels of the impacts of the NCMS on the “prevention” of chronic diseases is beyond the scope of our re-evaluation study, some discussions on the potential channels may be useful for future studies. While the CHNS data do not contain sufficient information for us to formally test these casual channels, we present them here in the hope that they can be tested when suitable data are available. First, as found in previous studies, the NCMS has increased healthcare utilization among its enrollees.14–16 Information on how one may prevent the development of chronic conditions provided to NCMS enrollees when they visit the hospital might help reduce the incidences of chronic diseases among them. Second, the NCMS has increased consumption among its enrollees.17–19 Better nutrition associated with more consumption might help reduce the incidences of chronic diseases. Third, different chronic diseases may have common causes. For example, smoking may cause both hypertension and heart diseases.28 Thus, when those NCMS enrollees who smoke visit their health providers for, say, hypertension treatments, their doctors might advise them to quit smoking, which in turn helps reduce their chance of developing heart disease. Again, due to data limitation, we defer more in-depth d investigations of these explanations to further research.
Conclusions
To help explain some conflicting findings in prior studies, this study re-evaluates the health impacts of the NCMS by focusing on the rural elderly population of China. Our triple-difference estimation, which relaxes the parallel-trend assumption invoked in many existing double-difference studies, shows that the NCMS significantly reduced the incidences of apoplexy and diabetes diagnoses for rural individuals aged 55 or above.
One methodological lesson that can be drawn from our analysis is the importance of collecting more pre-program data for impact evaluations that are not based on experimental designs, as they may facilitate tests for different identification assumptions. In particular, our triple-difference results suggest that the commonly adopted double-difference method underestimates the NCMS’s impact on chronic disease control among enrollees, which cannot be detected without data collected in earlier pre-program periods. In this regard, collecting more baseline data helps to produce more-compelling impact estimates.
However, more is not always better. When all rural adults above age 18 in the data are included in the analysis, the estimated impacts become much smaller and less significant, suggesting potential heterogenous effects of the NCMS on different subgroups of the rural population in China. Focusing on the most relevant subgroups, therefore, is also key for detecting program impacts. Our finding that the NCMS has significantly positive impacts on elderly enrollees’ incidences of chronic diseases suggests the need for examining its impacts on other vulnerable groups, such as low-income individuals, young children, and individuals with poor health conditions.
In closing, a number of policy implications are in order. First, given the significant role the NCMS plays in reducing the incidences of chronic diseases among its elderly enrollees, successful experiences in the implementation, operation and management of the NCMS can be shared with other health insurance programs in China, as well as with other countries that are planning to implement universal SHI programs. To that end, more in-depth investigations, both qualitative and quantitative ones, should be conducted to better understand the causal channels of the NCMS on health outcomes. Second, since the NCMS has achieved nearly universal coverage over China’s rural population, further improvements may be achieved by refining its program design, improving its program management, and enhancing its collaborations with other programs, to help achieve better population well-being targets. For example, rapid population aging in China and the national goal of ending poverty in the near future raise concerns about old-age poverty in China, among which the lack of social support is probably the most pressing. To fight old-age poverty and to raise Chinese elders’ living standards, improving their health outcomes through effective collaborations of the NCMS with poverty reduction initiatives in China may be a key step.
Acknowledgments
The authors thank Hans Binswanger, Xiangming Fang, Paul Glewwe, Wuyang Hu, Songqing Jin, Albert Park, participants of the 2013 AAEA annual meetings in Washington DC, USA, and two anonymous reviewers for their helpful comments on earlier versions of this paper. We also thank Chunchen Pei for her excellent research assistance. Dr. Suzhen Wang’s research was partially supported by the National Natural Science Foundation of China (No. 81872719), the National Bureau of Statistics Foundation Project (No. 2018LY79), the Natural Science Foundation of Shandong Province (No. ZR201807090257), and the Poverty Alleviation Fund project of Weifang Medical University (No. FP1801001). This research was conducted based upon the data from the China Health and Nutrition Survey (CHNS). We thank the National Institute of Nutrition and Food Safety, China Center for Disease Control and Prevention; the Carolina Population Center, University of North Carolina at Chapel Hill; the National Institutes of Health (NIH; R01-HD30880, DK056350, and R01-HD38700); and the Fogarty International Center, NIH, for financial support for the CHNS data collection and analysis files since 1989.
Disclosure
The authors report no conflicts of interest in this work.
References
1. Zhang S, Chen Q, Zhang B. Understanding healthcare utilization in China through The Andersen Behavioral Model: review Of evidence from the China health and nutrition survey. Risk Manag Healthc Policy. 2019;12:209–224. doi:10.2147/RMHP.S218661
2. Li J, Shi L, Liang H, et al. Urban-rural disparities in health care utilization among Chinese adults from 1993 to 2011. BMC Health Serv Res. 2018;18(1):102. doi:10.1186/s12913-018-2905-4
3. Liu H, Fang H, Zhao Z. Urban–rural disparities of child health and nutritional status in China from 1989 to 2006. Econ Hum Biol. 2013;11(3):294–309. doi:10.1016/j.ehb.2012.04.010
4. Wu Y, Qi D. Urban-rural and provincial disparities in child malnutrition in China. Soc Work Public Health. 2016;31(6):574–588. doi:10.1080/19371918.2015.1137524
5. Yip W, Hsiao W. China’s health care reform: a tentative assessment. China Econ Rev. 2009;20(4):613–619. doi:10.1016/j.chieco.2009.08.003
6. Yip W, Hsiao W. The Chinese health system at a crossroads. Health Aff (Millwood). 2008;27(2):460–468. doi:10.1377/hlthaff.27.2.460
7. Yi H, Zhang L, Singer K, Rozelle S, Atlas S. Health insurance and catastrophic illness: a report on the New Cooperative Medical System in rural China. Health Econ. 2009;18(Suppl 2):S119–127. doi:10.1002/hec.1510
8. You X, Kobayashi Y. The new cooperative medical scheme in China. Health Policy. 2009;91(1):1–9. doi:10.1016/j.healthpol.2008.11.012
9. Peng X, Conley D. The implication of health insurance for child development and maternal nutrition: evidence from China. Eur J Health Econ. 2016;17(5):521–534. doi:10.1007/s10198-015-0696-7
10. Ministry of Health and Ministry of Finance of China. Announcement for Accomplishing the New Cooperative Medical Scheme. Beijing, China. 2008.
11. Liu X, Tang S, Yu B, et al. Can rural health insurance improve equity in health care utilization? A comparison between China and Vietnam. Int J Equity Health. 2012;11(1):10. doi:10.1186/1475-9276-11-10
12. Yip W, Wang H, Hsiao W The impact of rural mutual health care on access to care: evaluation of a social experiment in rural China. Harvard Working Paper. 2008.
13. Yu B, Meng Q, Collins C, et al. How does the New Cooperative Medical Scheme influence health service utilization? A study in two provinces in rural China. BMC Health Serv Res. 2010;10(1):116. doi:10.1186/1472-6963-10-116
14. Wagstaff A, Lindelow M, Jun G, Ling X, Juncheng Q. Extending health insurance to the rural population: an impact evaluation of China’s new cooperative medical scheme. J Health Econ. 2009;28(1):1–19. doi:10.1016/j.jhealeco.2008.10.007
15. Qin X, Pan J, Liu GG. Does participating in health insurance benefit the migrant workers in China? An empirical investigation. China Econ Rev. 2014;30(C):263–278. doi:10.1016/j.chieco.2014.07.009
16. Lei X, Lin W. The New Cooperative Medical Scheme in rural China: does more coverage mean more service and better health? Health Econ. 2009;18(Suppl 2):S25–46. doi:10.1002/hec.1501
17. Bai C, Wu B. Health insurance and consumption: evidence from China’s New Cooperative Medical Scheme. J Comp Econ. 2014;42(2):450–469. doi:10.1016/j.jce.2013.07.005
18. Cheung D, Padieu Y. Heterogeneity of the effects of health insurance on household savings: evidence from rural China. World Dev. 2015;66:84–103. doi:10.1016/j.worlddev.2014.08.004
19. Ying M, Du Z. The effects of medical insurance on durables consumption in rural China. China Agric Econ Rev. 2012;4(2):176–187. doi:10.1108/17561371211224764
20. Su B, Thierry GH, Chen Q, Zhao Q. The New Cooperative Medical Scheme and self-employment in Rural China. Sustainability. 2017;9(2):1–10. doi:10.3390/su9020304
21. Cheng L, Liu H, Zhang Y, Shen K, Zeng Y. The impact of health insurance on health outcomes and spending of the elderly: evidence from China’s New Cooperative Medical Scheme. Health Econ. 2015;24(6):672–691. doi:10.1002/hec.3053
22. Chen Y, Jin GZ. Does health insurance coverage lead to better health and educational outcomes? Evidence from rural China. J Health Econ. 2012;31(1):1–14. doi:10.1016/j.jhealeco.2011.11.001
23. Wang H, Yip W, Zhang L, Hsiao WC. The impact of rural mutual health care on health status: evaluation of a social experiment in rural China. Health Econ. 2009;18(Suppl 2):S65–82. doi:10.1002/hec.1465
24. Moffit R. Program evaluation with nonexperimental data. Eval Rev. 1991;15(3):291–314. doi:10.1177/0193841X9101500301
25. Wagstaff A. Estimating health insurance impacts under unobserved heterogeneity: the case of Vietnam’s health care fund for the poor. Health Econ. 2010;19(2):189–208. doi:10.1002/hec.1466
26. Brown AN, Cameron DB, Wood BDK. Quality evidence for policymaking: I’ll believe it when I see the replication. J Dev Effect. 2014;6(3):215–235. doi:10.1080/19439342.2014.944555
27. Rubin D. Estimating causal effects of treatments in randomized and nonrandomized studies. J Educ Psychol. 1974;66(5):688–701. doi:10.1037/h0037350
28. U.S. Department of Health and Human Services. A Report of the Surgeon General. How Tobacco Smoke Causes Disease: What It Means to You. Atlanta: U.S. Department of Health and Human Services, Centers for Disease Control and Prevention, National Center for Chronic Disease Prevention and Health Promotion, Office on Smoking and Health; 2010.
 © 2020 The Author(s). This work is published and licensed by Dove Medical Press Limited. The
full terms of this license are available at https://www.dovepress.com/terms
and incorporate the Creative Commons Attribution
- Non Commercial (unported, 3.0) License.
By accessing the work you hereby accept the Terms. Non-commercial uses of the work are permitted
without any further permission from Dove Medical Press Limited, provided the work is properly
attributed. For permission for commercial use of this work, please see paragraphs 4.2 and 5 of our Terms.
© 2020 The Author(s). This work is published and licensed by Dove Medical Press Limited. The
full terms of this license are available at https://www.dovepress.com/terms
and incorporate the Creative Commons Attribution
- Non Commercial (unported, 3.0) License.
By accessing the work you hereby accept the Terms. Non-commercial uses of the work are permitted
without any further permission from Dove Medical Press Limited, provided the work is properly
attributed. For permission for commercial use of this work, please see paragraphs 4.2 and 5 of our Terms.