Back to Journals » International Journal of Nanomedicine » Volume 19
A Targeted Multi-Crystalline Manganese Oxide as a Tumor-Selective Nano-Sized MRI Contrast Agent for Early and Accurate Diagnosis of Tumors
Authors Yang G, Xia J, Dai X, Zhao H, Gao W, Ding W, Tao X, Zhu L
Received 31 October 2023
Accepted for publication 11 January 2024
Published 18 January 2024 Volume 2024:19 Pages 527—540
DOI https://doi.org/10.2147/IJN.S444061
Checked for plagiarism Yes
Review by Single anonymous peer review
Peer reviewer comments 2
Editor who approved publication: Dr Xing Zhang
Gongxin Yang,1,* Jikai Xia,2,* Xiaoqing Dai,1,* Hongbo Zhao,1 Weiqing Gao,1 Weilong Ding,1 Xiaofeng Tao,1 Ling Zhu1
1Department of Radiology, Shanghai Ninth People’s Hospital, Shanghai Jiao Tong University, School of Medicine, Shanghai, 200001, People’s Republic of China; 2Department of Radiology, Yantai Affiliated Hospital of Binzhou Medical University, Yantai, Shandong, 264100, People’s Republic of China
*These authors contributed equally to this work
Correspondence: Xiaofeng Tao; Ling Zhu, Department of Radiology, Shanghai Ninth People’s Hospital, Shanghai Jiao Tong University, School of Medicine, Shanghai, 200001, People’s Republic of China, Email [email protected]; [email protected]
Introduction: Magnetic resonance imaging (MRI) is an important tool for the accurate diagnosis of malignant tumors in clinical settings. However, the lack of tumor-specific MRI contrast agents limits diagnostic accuracy.
Methods: Herein, we developed αv integrin receptor-targeting multi-crystalline manganese oxide (MCMO) as a novel MRI contrast agent for accurate diagnosis of tumors by coupling iRGD cyclopeptide PEGylation polymer onto the surface of MCMO (iRGD-pMCMO).
Results: The MCMO consisted of numerous small crystals and exhibited an oval structure of 200 nm in size. The iRGD-pMCMO actively recognizes tumor cells and effectively accumulates at the tumor site, consequently releasing abundant Mn2+ ions in a weakly acidic and high-GSH-expressing tumor microenvironment. Subsequently, Mn2+ ions interact with cellular GSH to form Mn-GSH chelates, enabling efficient T1-weighted MR contrast imaging. In vivo experiments indicated that iRGD-pMCMO significantly improved T1-weighted images, achieving an accurate diagnosis of subcutaneous and orthotopic tumors. The results verified that the T1 contrast effect of iRGD-pMCMO was closely associated with the expression of GSH in tumor cells.
Conclusion: Altogether, the novel tumor-targeting, highly sensitive MRI contrast agent developed in this study can improve the accuracy of MRI for tumor diagnosis.
Keywords: multi-crystalline manganese oxide, MRI contrast agent, tumor targeting, tumor selectivity, accurate diagnosis
Graphical Abstract:

Introduction
As a clinical diagnostic tool, magnetic resonance imaging (MRI) offers several advantages, such as non-ionizing radiation, non-invasiveness, and assessment of functional information of diseased tissues.1–3 MRI primarily utilizes the changes in the signal of hydrogen (H) protons to generate images of tissues.4,5 Therefore, it has a high sensitivity for diagnosing soft tissue diseases, especially malignant tumors. MRI contrast agents (MRICAs) are usually used to improve the distinction between normal and tumor tissues.6–8 MRICAs are developed mainly based on paramagnetic gadolinium (Gd) and manganese complexes that have long electronic relaxation durations and abundant unpaired electrons.9,10 The Food and Drug Administration (FDA) has approved the use of magnetic iron oxide as a T2 MRICA; however, gadolinium (Gd)- and manganese (Mn)-based T1 MRICAs are predominantly used in clinical settings.11–13 Moreover, the majority of clinical MRICAs are non-targeted small molecules that readily enter the intravascular and interstitial spaces of normal tissues, resulting in an inaccurate diagnosis of tumors. The emergence of tumor-selective MRICAs has introduced novel avenues for improving the MRI diagnostic accuracy of tumors. Two strategies are primarily used for developing tumor-selective MRICAs: (1) Labeling the target ligand onto the surface of MRICAs; (2) Developing tumor microenvironment (TME)-responsive MRICAs.
For highly efficient imaging, MRICAs should have strong attenuation effects on the T1 or T2 relaxation time of H protons. As T1 MRICAs, individual Gd or manganese chelates have relatively weak attenuation effects on T1 relaxation time,14 resulting in low contrast enhancement. Gd chelates, such as Gd-DTPA, have been reported to cause nephrotoxic effects and accumulate in the brain in clinical settings.15,16 These harmful effects limit the applicability of Gd-based MRICAs. Manganese is an essential trace element for maintaining various life activities;17 therefore, manganese complexes such as MRICAs may have a better biosafety profile than Gd complexes. Developing novel nanoplatforms that accommodate a high payload of manganese ions can effectively improve the contrast of individual manganese chelates. In recent years, polymers,18 liposomes,19 and silica nanoparticles20 have been used to develop numerous manganese-labeled nanoplatforms as novel nano-MRICAs, which have demonstrated excellent T1 contrast performance. For example, Wu’s group developed manganese carbonate-deposited iron oxide nanoplatform (MCDION) as a TME responsive MRICAs. The MCDION is quickly dissolved in the weakly acidic TME and then releases the abundance of free Mn2+ ions, endowing MCDION with a tumor-specfic MRI contrast capability.21 On the basis of the classical Solomon-Bloembergen-Morgan (SBM) theory, the longitudinal relaxivity (r1) comprises three contributions: the inner sphere relaxivity, secondary sphere relaxivity, and outer sphere relaxivity.22,23 Water molecules directly coordinated to the paramagnetic center are responsible for inner sphere relaxation contribution. The number of coordinated water molecules and the rotational correlation time of H protons are two key parameters for enhancing the inner sphere relaxation of nano-MRICAs.24–26 In addition, optimizing the structure and morphology of nano-MRICAs significantly increases the number of coordinated water molecules around Mn centers and the rotational correlation time of H protons, thereby enhancing the efficiency of Mn-based nano-MRICAs.
In previous study, the high porosity and specific surface area significantly increased the number of water molecules around paramagnetic nanoparticles and then increased the T1 relaxivity of nano-sized MRICAs.27 In addition, these porosities have typical geometrical confinement effects,23 which could prolong the retention time of water molecules around paramagnetic nanoparticles because of the increase in effective viscosity of the aqueous solution trapped within the pores, which also increased T1 contrast performance. Considering water accessibility, porous structural nano-sized MRICAs platform might shorten T1 relaxation time of H proton more efficiently and possess better T1 contrast ability.28 Herein, we developed novel multi-crystalline manganese oxide (MCMO) nanoclusters as T1 MRICAs using the microwave-assisted thermal decomposition method. MCMO nanoclusters exhibited a porous structure, which accelerated the accessibility of water molecules and increased the number of water molecules around the nanoclusters. In addition, the iRGD-PEG-DSPE polymer was used to modify MCMO nanoclusters (iRGD-pMCMO) to develop tumor-targeting nano-MRICAs. The iRGD-pMCMO actively recognized tumor cells and was effectively internalized by tumor cells. In a weakly acidic and excessive GSH-containing TME, the iRGD-pMCMO rapidly released a larger number of Mn2+ ions that interacted with GSH to form Mn-GSH chelates, contributing to efficient T1-weighted imaging. The contrast performance of the iRGD-pMCMO was investigated using subcutaneous and orthotopic tumor models, validating the early and accurate diagnostic capability of iRGD-pMCMO for tumors. Therefore, as a novel nano-MRICA, the iRGD-pMCMO holds remarkable potential for the accurate diagnosis of tumors.
Materials and Method
Materials
All the reagents were used as received without further purification. Manganese acetylacetonate, polyvinylpyrrolidone (PVP-K30), and triethylene glycol were acquired from Aladdin Reagents Co. Ltd. (Shanghai, China). N-Hydroxy succinimide (NHS), 1-(3-dimethylaminopropyl)-3-ethylcarbodiimide (EDC), and dimethyl sulfoxide (DMSO) were obtained from the Sinopharm Chemical Reagent Co. Ltd. (Shanghai, China). iRGD cyclopeptide and 1.2-distearoyl-sn-glycero-3-phosphoethanolamine-N-[amino(polyethylene glycol)] (NH2-PEG-DSPE) were purchased from Shanghai Yuanye Biotech. Co. Ltd. (Shanghai, China). Deionized water was produced by Heal Force pure water system (CR-SP412, China). SD rats were used to evaluate the blood biocompatibility of iRGD-pMCMO and purchased from Beijing Vital River Laboratory Animal Technology Co., Ltd., Beijing, China. The balb/c mice were used to establish a subcutaneous tumor model. The transgenic adenocarcinoma of mouse prostatic (TRAMP) mice were purchased from the Jackson Laboratory in the United States.
Synthesis of MCMO
The MCMO nanoparticles were synthesized via microwave assisted thermal decomposition method (Discover 2.0, CEM, USA). Briefly, manganese acetylacetonate (0.43 g) and polyvinylpyrrolidone (PVP-K30, 1.5 g) were dissolved in triethylene glycol (TEG, 30 mL), and then heated to 80°C for 30 min under magnetic stirring. Afterwards, the mixed solution was transferred into a microwave tube, and then heated to 180°C. The detailed microwave parameters were as follows: power (200 W), temperature (180°C), running time (25 min), holding time (15 min), and pressure (200 psi). At the end of the reaction, the solution was cooled to room temperature and then the products were collected through high-speed centrifugation at 25,000 rpm/min. The product was washed with distilled water and alcohol for three times. Finally, the product was dispersed into the distilled water for further use.
Synthesis of iRGD-pMCMO
Firstly, iRGD-PEG-DSPE polymer was synthesized via a simple amide condensation reaction. Briefly, iRGD cyclopeptide (5 mg) was dissolved into DMSO solution (10 mL). Next, the NHS (20 mg) and EDC (20 mg) were added, and then the mixed solution was stirred for 4 h. Subsequently, the NH2-PEG-DSPE polymer (50 mg) was further added into the resulting solution, and then the solution was stirred overnight at room temperature. Based on the active coordination effect of DSPE polymer, the MCMO nanoparticles (25 mg) were subsequently dispersed into the resulting solutions under magnetic stirring (200 r/min). After 4 h, the solution was centrifuged at 14,000 r/min, and the product (iRGD-pMCMO) was collected.
Cell Culture
PC-3 cells, provided by the Institute of Biochemistry and Cell Biology of the Chinese Academy of Sciences, were seeded into 96-well plates with a density of 4000 cells/well and further incubated in the Dulbecco’s modified eagle medium (DMEM) supplemented with 10% fetal bovine serum and 1% penicillin/streptomycin in a humidified atmosphere of 5% CO2 at 37°C overnight.
Confocal Laser Scanning Microscopy (CLSM) Observation
The green fluorescence molecule fluorescein isothiocyanate (FITC) was labeled onto the MCMO to study the cellular internalization of the MCMO. Subsequently, the PC-3 cells were treated with different concentrations (10, 20, 40 μg/mL) of FITC labeled MCMO for 6 h, and then the cellular nuclei were stained by Hoechst 33,342 (10 μg/mL) in dark for 10 min. Finally, the fluorescence of PC-3 cells was captured under a confocal laser scanning microscope (CLSM). Similarly, the cell uptake of iRGD-pMCMO was also observed using CLSM after treatment for 2, 4, and 6 h.
Internalization of iRGD-pMCMO Analyzed by inductively coupled plasma optical emission spectrometer (ICP-OES)
Firstly, PC-3 cells were seeded into well plates and incubated in the DMEM supplemented with 10% fetal bovine serum. When the density of PC-3 cells reached to 1×10⁷ cells/well, the cells were treated with different concentrations of iRGD-pMCMO for 2, 4, and 6 h. After that, the cells were washed with cold fresh PBS to remove extracellular nanoparticles and nitrated into transparent solution using the concentrated nitric acid. Eventually, Mn content of the solution was measured by ICP-OES to quantitatively analyze the cellular content of iRGD-pMCMO.
Cell Transmission electron microscope (TEM) Observation
The PC-3 cells were seeded in 6-well plates and incubated in the DMEM supplemented with 10% fetal bovine serum. When the density of cells was 1×10⁶ cells/well, the cells were treated with iRGD-pMCMO at a concentration of 80 μg/mL for different times. Afterwards, the cells were collected by centrifugation at 2000 r/min, and then the cells were treated into spheres in tubes. Next, the cells were fixed using 3% glutaraldehyde overnight at 4°C. Subsequently, the cell aggregate was stained with 2% osmium tetroxide aqueous, and further dehydrated step by step by a standard process. After that, the specimens were placed in the mixture of propylene oxide/Araldite resin 2–3 days. After that, the specimens were cut into slices and then stained with 1% toluidine blue. Finally, the ultra-thin sections were stained for 25 min with saturated aqueous uranyl acetate, followed by lead citrate staining for 5 min. The slices were placed on a copper grid and observed using a bio-TEM.
Cytotoxicity Assay
The cells were seeded in 96 well/plate, and the density of the cells was 8000 cells/well. Next, the cells were incubated with different concentrations of MCMO and iRGD-pMCMO for 24 h. Afterwards, the culture media were discarded. The cells were washed using fresh cold PBS, and 200 µL of 10% cell counting kit (CCK-8) kit was added into 96 wells at 37 oC for 2 h. The cell viability was detected using a Fluostar Optima microplate reader (BMG Labtechnologies, Germany) at a wavelength of 450 nm.
Hemolysis Assay of iRGD-MCMO
Firstly, the fresh blood (5 mL) was collected from the rat and then centrifuged at 1500 rpm/min for 15 min. Afterwards, the supernatant was removed and then the red cells were collected and washed with cold PBS solution for three times. Subsequently, the red cells were treated with different concentrations of iRGD-pMCMO for 3, 6, and 12 h, respectively. Finally, solutions containing red cells were photographed, and then the absorbance in supernatant was measured using UV-vis spectrum at a wavelength of 570 nm.
In vitro and in vivo MRI
All MRI studies were performed on a 7.0 T scanner (Bruker Technologies, USA) using a volume RF coil (inner diameter 40 mm for mice). We utilized a series of inversion-prepared fast spin-echo profile to achieve longitudinal relaxation time (T1). This series is identical in all aspects (TR 6000 ms, effective TE 5.6 ms, BW 25 kHz, slice thickness 0.8 mm, matrix 96×96, 1 average) except for the 20 different inversion times (TIs) that varied linearly from 10 to 2500 ms. In vivo MRI experiment, the following acquisition parameters were chosen: the repetition time (TR) = 370 ms, echo time (TE) = 11.6 ms, field of view (FOV) = 40 mm × 40 mm, matrix size = 256 × 256, slice thickness = 1 mm (12 slices, gap = 0), 1 average, and bandwidth (BW) = 50 kHz. In addition, the obtained images could be analyzed using ImageJ software.
Statistical Analyses
Statistical analyses were performed using Student’s t-test, and the data were reported as mean ± standard deviation (SD). The significance level was represented as *P<0.05, **P<0.01, ***P<0.001, and ****P<0.0001 for the respective levels of statistical significance.
Results and Discussion
Synthesis and Characterization of iRGD-pMCMO
MCMO nanoclusters were synthesized through microwave-assisted thermal decomposition using manganese acetylacetonate as the precursor. Initially, the synthesis process was tested at different output powers of the reactor. As shown in Figure 1a, when the output power was 200 W, MCMO nanoclusters had an irregular shape and no complete morphology. High output power can lead to rapid decomposition of manganese acetylacetonate; consequently, MCMO nanoclusters cannot self-assemble into a complete shape. However, as the output power decreased, the small crystals gradually self-assembled into oval-shaped MCMO nanocrystals (Figure 1b–f). At low magnification, TEM images indicate that the nanoclusters had a uniform shape and a size of approximately 260 nm (Figure 1g). At high magnification, numerous cristate crystals were observed on the surface of the crystals (Figure 1h). In addition, high-resolution TEM images of the nanoclusters showed significant lattice fringes (Figure 1i), indicating that the nanoclusters had an excellent degree of crystallization. The interplanar spacing of MCMO nanocrystals was 0.249 nm, which corresponds to (211) plane of Mn3O4.
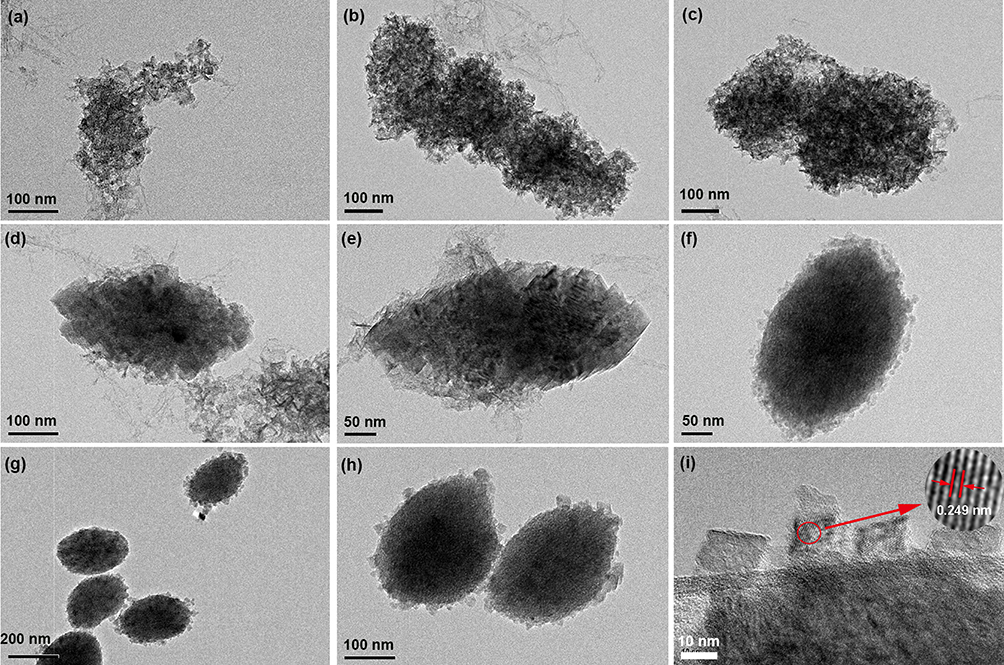 |
Figure 1 TEM observation for morphology of nanoparticles. TEM images of MCMO with different reaction powers (a) 220 W; (b) 200 W; (c) 180 W; (d) 160 W; (e) 140 W; (f) 120 W. TEM images of the MCMO with in (g) low magnification and (h) high magnification. (i) High-resolution image of the MCMO. |
The crystal structure of MCMO nanocrystals was further characterized via X-ray diffraction (XRD). As shown in Figure 2a, the XRD peaks appeared at 32.41° and 36.06°, corresponding to the (103) and (211) planes of hausmannite (Mn3O4). Moreover, the XRD pattern of MCMO nanocrystals was also consistent with that of Mn3O4 (PDF: 18–0803),29,30 which validated the crystal structure and composition of the nanocrystals. In addition, the nitrogen adsorption–desorption isotherms demonstrated that the nanocrystals had a porous structure (Figure 2b). When the relative pressure (P/P0) was 0.2–0.5, the absorption amount of the MCMO rapidly increased, suggesting that the nanocrystals had high porosity and were primarily mesoporous. Pore size distribution curves indicate that the pore diameters of the MCMO nanocrystals are dominantly distributed at 2–5 nm (inset of Figure 2b). These results indicate that a large number of water molecules might easily diffuse into the pore channels of MCMO nanocrystals, which is beneficial for improving T1 contrast performance.27,31 On the basis of the coordination effect of DSPE polymer with transition metal, the iRGD-PEG-DSPE polymer was used to modify MCMO nanocrystals to develop iRGD-pMCMO nanoplatforms with tumor-targeting ability. To verify successful conjugation, the changes in the zeta potential of the nanocrystals were analyzed after and before modification. As shown in Figure 2c, the zeta potential of MCMO nanocrystals was 17.7 ± 3.1 mV, whereas that of pMCMO and iRGD-pMCMO decreased to 10.3 ± 2.3 mV and 5.9 ± 1.4 mV, respectively. This decrease in zeta potential indicates that iRGD-PEG-DSPE polymers were successfully conjugated onto the surface of MCMO nanocrystals. DLS analysis indicates that the hydrodynamic size of the iRGD-MCMO was larger than that of MCMO nanocrystals (Figure 2d), further verifying the successful fabrication of the iRGD-MCMO. Subsequently, the colloidal stability of iRGD-MCMO nanoplatforms was assessed by monitoring changes in their hydrodynamic size at different storage periods. As shown in Figure 2e, the hydrodynamic size of the iRGD-MCMO in distilled water, phosphate-buffered solution (PBS), and 5% fetal bovine serum (FBS) did not significantly increase with an increase in storage periods. These results indicate that the iRGD-MCMO nanoplatforms had excellent colloidal stability, which promotes their applicability in vivo. Subsequently, we further investigated the release profile of iRGD-MCMO under different pH conditions (Figure 2f). The iRGD-MCMO almost did not release Mn2+ under neutral condition. However, at weak acidic environment, the release amount of Mn from iRGD-MCMO dramatically increased, and pH 5.5 condition induced more Mn release than pH 6.5, showing pH-dependent release behavior. These results demonstrate that the iRGD-MCMO is very sensitive for weak acidic TME.
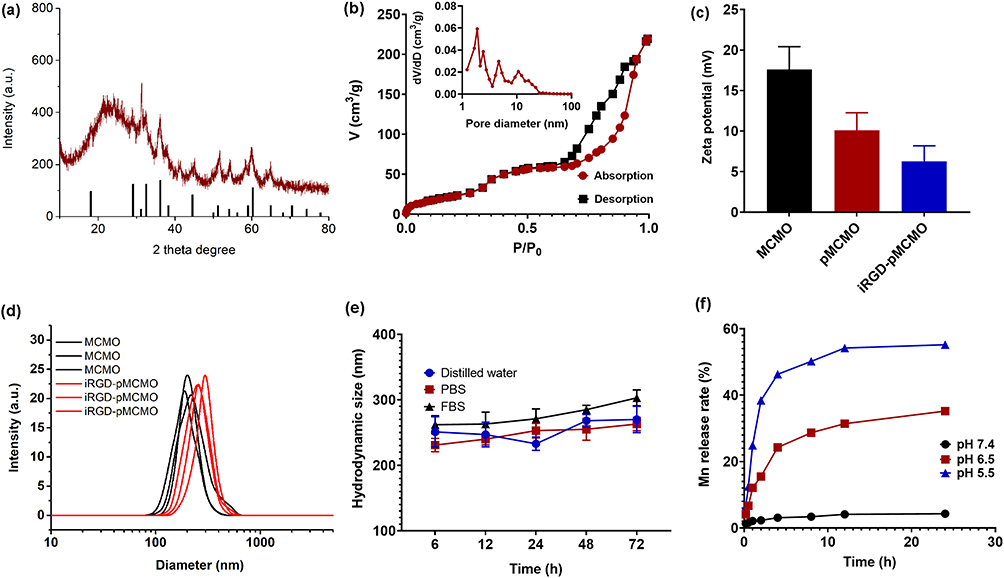 |
Figure 2 The characterization of physicochemical property of iRGD-pMCMO. (a) XRD spectra of MCMO. (b) N2 absorption-desorption isotherm of MCMO (inset: pore size distribution curve). (c) Zeta potential of MCMO, pMCMO, and iRGD-pMCMO. (d) Hydrodynamic size of MCMO and iRGD-pMCMO. (e) Hydrodynamic size change of iRGD-pMCMO in different media with standing time increasing. (f) Mn release profile of iRGD-pMCMO at different pH conditions. |
Cellular Internalization of iRGD-pMCMO
The cellular internalization efficiency of nano-MRICAs is a key factor that affects their diagnostic ability.32,33 Therefore, we assessed the cellular uptake of the iRGD-MCMO via confocal laser scanning microscopy (CLSM). As shown in Figure 3a, tumor cells treated with iRGD-pMCMO demonstrated enhanced green fluorescence with an increase in concentration, indicating that the internalization of the iRGD-pMCMO was dependent on concentration. Similarly, the green fluorescence of tumor cells treated with iRGD-pMCMO increased with an increase in incubation time, demonstrating time-dependent internalization behavior. Furthermore, the internalization of the pMCMO and the iRGD-pMCMO was also assessed via CLSM to verify their tumor-targeting abilities. As shown in Figure 3b, the green fluorescence of tumor cells treated with iRGD-pMCMO was significantly stronger than that with pMCMO, this was because the iRGD-pMCMO nanoplatforms actively recognized and entered tumor cells. These results demonstrate excellent tumor-targeting ability of the iRGD-pMCMO.
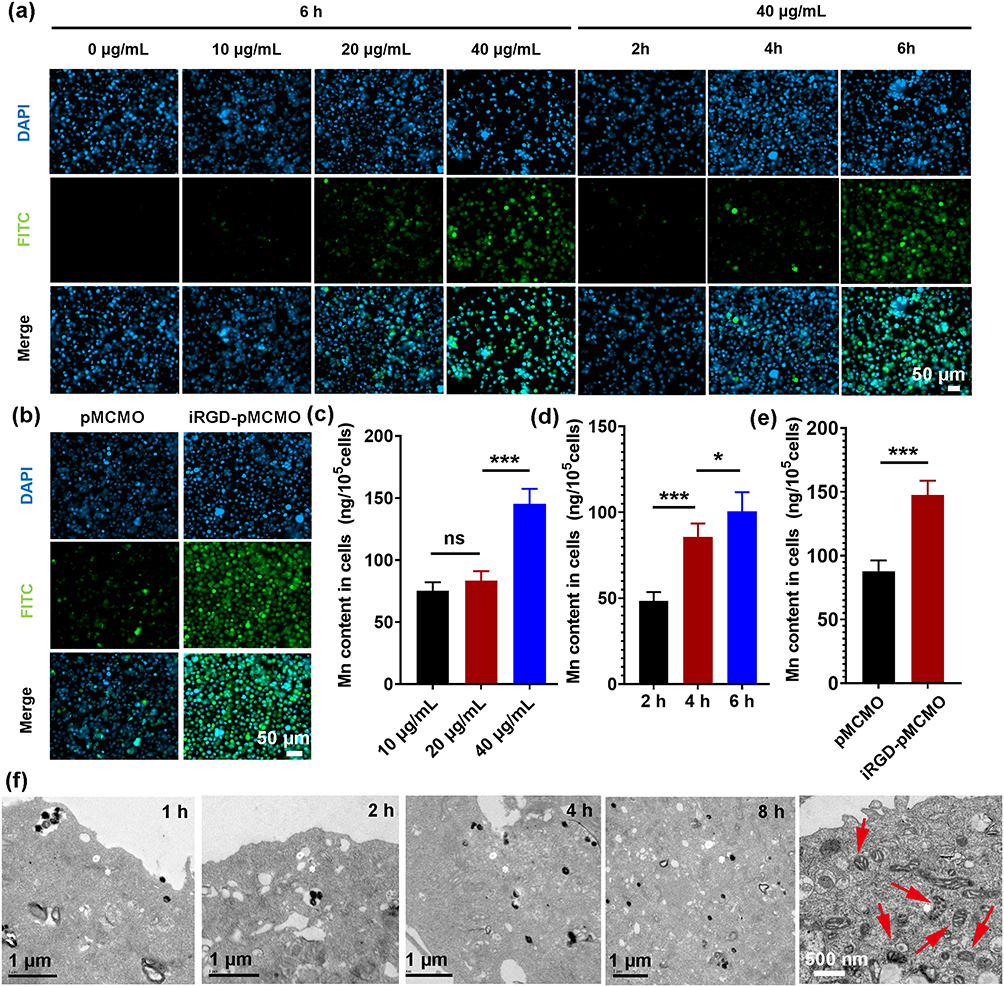 |
Figure 3 Internalization evaluation of iRGD-pMCMO. (a) CLSM images of PC-3 cells treated with different concentrations of iRGD-pMCMO for different time. (b) CLSM images of PC-3 cells treated with pMCMO and iRGD-pMCMO for 4 h. ICP analysis for the internalization of iRGD-pMCMO at (c) different treatment concentrations and (d) different treatment time. (e) ICP analysis for the internalization of pMCMO and iRGD-pMCMO. (f) Cell TEM observation for the uptake process of iRGD-pMCMO and corresponding cell damage (red arrows indicate mitochondria). Data are presented as mean ± SEM. *p < 0.05; ***p < 0.001; ns, not significant. |
The cellular uptake of the iRGD-pMCMO was quantitatively analyzed through inductively coupled plasma optical emission spectroscopy (ICP-OES). As shown in Figure 3c, the content of Mn in cells treated with the iRGD-pMCMO gradually increased from 76.3 ± 6.1 ng/105 cells to 147.5 ±10.7 ng/105 cells with an increase in concentration from 10 μg/mL to 40 μg/mL, respectively. Similarly, the content of Mn in cells treated with the iRGD-pMCMO significantly changed with an increase in incubation time (Figure 3d). These results validate that the internalization of the iRGD-pMCMO was dependent on concentration and time. In addition, the Mn content of pMCMO-treated PC-3 cells was only 88.7±7.2 ng/105cells, however iRGD-pMCMO-treated PC-3 cells reached up to be 147.1±9.6 ng/105 cells (Figure 3e), indicating that iRGD-pMCMO had outstanding tumor-targeting ability. Furthermore, the internalization of iRGD-pMCMO was observed via TEM (Figure 3f). After 1 h of incubation, the iRGD-pMCMO nanoparticles were mainly distributed around the surface of cancer cells. After 2 h of incubation, the nanoparticles permeated across the cell membrane and penetrated the cytosolic space. In addition, the content of iRGD-pMCMO nanoparticles in the cytosolic space gradually increases with an increase in incubation time. Notably, after 24 h of incubation, the morphology of cancer cells remained intact and the cristae of mitochondria was clearly visible, indicating that iRGD-pMCMO had excellent biocompatibility and did not cause mitochondrial damage. In order to further verify the biocompatibility of iRGD-pMCMO, mitochondrial membrane potential (MMP) change of PC-3 cells treated with iRGD-pMCMO was observed by CLSM. As shown in Figure S1, the MMP of iRGD-pMCMO-treated PC-3 cells had a significant decrease at the concentration rang from 0 to 80 μg/mL, further confirming that iRGD-pMCMO cannot cause mitochondrial damage and show excellent cell biocompatibility. These results demonstrate that the high internalization efficacy of iRGD-pMCMO only enhances MRI contrast performance and cannot cause significant toxicity on cells.34
MRI Contrast Performance and Cytotoxicity of iRGD-pMCMO in vitro
Owing to the excellent tumor-targeting and physicochemical properties of iRGD-pMCMO nanoplatforms, we assessed its potential applicability in MRI. The T1 relaxation rate of iRGD-pMCMO was measured on a 3.0 T MRI scanner. As shown in Figure 4a, the T1 relaxation rate of iRGD-pMCMO was only 1.28 mM−1s−1 under neutral conditions but significantly increased to 2.5 mM−1s−1 and 5.69 mM−1s−1 at pH values of 6.5 and 5.5, respectively. This increase in the T1 relaxation rate may be attributed to the rapid release of abundant Mn2+ ions from iRGD-pMCMO. Free Mn2+ ions interact with excessive GSH found in cancer cells,35,36 thereby enhancing contrast activity. To verify this hypothesis, we assessed the GSH-responsive performance of iRGD-pMCMO in T1-weighted imaging on a 3.0 T MRI scanner. As shown in Figure 4b, the T1 relaxation rate of iRGD-pMCMO increased from 5.69 mM−1s−1 to 8.54 mM−1s−1 in a weakly acidic environment (pH 5.5) with 2 mM GSH. In addition, the T1 relaxation rate of iRGD-pMCMO sharply increased to 17.60 mM−1s−1 when the concentration of GSH was 10 mM. These results indicate that the presence of GSH further enhances the T1 contrast performance of iRGD-pMCMO, resulting in efficient tumor-selective imaging. In addition, the brightness-darkness contrast images of different samples were also observed. As shown in Figure S2, the brightness of iRGD-pMCMO significantly increased with increasing concentrations, showing concentration-dependent relation. Moreover, the weakly acidic solution further enhanced the brightness of MRI images in iRGD-pMCMO group, and the solution of iRGD-pMCMO treated with weak acid plus GSH showed the largest brightness compared to other groups. These results are consistent with the relaxation rate change of iRGD-pMCMO.
 |
Figure 4 MRI contrast enhancement and cytotoxicity of iRGD-pMCMO. (a) T1 relaxation rate of iRGD-pMCMO at different pH conditions. (b) T1 relaxation rate of iRGD-pMCMO before and after treated with different GSH concentrations. (c) T1 map value of PC-3 cells treated with different samples. The viability of normal cells including (d) THLE-3 and (e) C166 cells treated with different concentrations of MCMO and iRGD-pMCMO. Data are presented as mean ± SEM. *p < 0.05; ***p < 0.001; ns, not significant. |
Subsequently, the T1 contrast ability of iRGD-pMCMO was investigated in vitro. Briefly, cancer cells were, respectively, incubated with pMCMO, iRGD-pMCMO, iRGD-pMCMO plus GSH (5 mM), and iRGD-pMCMO plus LBS (a GSH inhibitor). The cells were collected, and the corresponding T1 relaxation time was measured on a 3.0 T MRI scanner. The T1 relaxation time of cancer cells treated with PBS was 1879 ± 89.7 ms (Figure 4c), whereas that of tumor cells treated with pMCMO decreased to 1045±78.2 ms, indicating that pMCMO had strong T1 contrast effects. The T1 relaxation time of tumor cells treated with iRGD-pMCMO was shorter than that of cells treated with non-targeted pMCMO, suggesting that targeted iRGD-pMCMO had superior contrast performance. Co-incubation with GSH further decreased the T1 relaxation time of cells, whereas co-incubation with a GSH inhibitor significantly recovered the T1 relaxation time of cells. These results validate the excellent tumor-selective contrast performance of iRGD-pMCMO nanoparticles. Furthermore, the cytotoxicity of iRGD-pMCMO was assessed in normal cells, including THLE-3 and C166 cells. At a high concentration of 100 μg/mL, pristine MCMO nanocrystals exert toxic effects on THLE-3 and C166 cells to a certain extent (Figure 4d and e). Remarkably, iRGD-pMCMO had no significant toxic effects on normal cells, indicating that the conjugation of iRGD-PEG-DSPE polymers onto the surface of MCMO crystals dramatically improved the biocompatibility of iRGD-pMCMO nanoparticles. Altogether, these results suggest that iRGD-pMCMO nanoparticles as novel nanoMRICAs have great application potential in vivo.
Evaluation of MRI Contrast Performance of iRGD-pMCMO for Early and Accurate Diagnosis of Tumors in vivo
To assess the contrast performance of the iRGD-pMCMO in vivo, tumor models were established via direct subcutaneous injection of 107 tumor cells into the right legs of mice. All animal experiments were studied in accordance with the rules approved by the animal ethics committee of School of Medicine of Shanghai Jiao Tong University. When tumor volume reached approximately 200 mm3, tumor-bearing mice were administered using pMCMO and iRGD-pMCMO via tail vein injection. As shown in Figure 5a, the T1-weighted images of tumors in the pMCMO and iRGD-pMCMO groups gradually brightened with time, with the brightest images being observed at 1 and 4 h after injection, respectively. These results demonstrated that both pMCMO and iRGD-pMCMO enhanced the contrast of tumors in vivo. In particular, the T1-weighted images of tumors were significantly brighter in the iRGD-pMCMO group than in the pMCMO group, indicating that iRGD-pMCMO had stronger tumor contrast effects than pMCMO. Subsequently, the corresponding MRI signal intensities of tumors were evaluated using microMRI software. As shown in Figure 5b, the MRI signal intensity of tumors was only approximately 140 units before the administration of pMCMO and iRGD-pMCMO. However, the maximal MRI signal intensity of tumors increased to 185 units after 2 h of injection in the pMCMO group and to 229 units after 4 h of injection in the iRGD-pMCMO group. This trend is consistent with the results observed in MRI images of tumors, indicating that iRGD-pMCMO nanoparticles as tumor-targeting nanoMRICAs had significantly enhanced contrast performance for tumor diagnosis.
 |
Figure 5 Analysis of accurate MRI diagnosis of tumor in vivo. (a) T1-weighted MRI images and (b) corresponding tumor signal intensity of PC-3 tumor bearing mice at coronal plane after pMCMO and iRGD-pMCMO treatment. (red arrows indicate tumor site) (c) T1-weighted MRI images and (d) corresponding signal intensity of orthotopic prostatic cancer in TRAMP mice at axial plane after pMCMO and iRGD-pMCMO treatment (red arrows indicate tumor site). (e) T1-weighted MRI images and (f) corresponding T1 signal intensity of orthotopic tumor in TRAMP mice after different treatments. Data are presented as mean ± SEM. *, p < 0.05; ***p < 0.001; ns, not significant. |
Furthermore, we assessed the performance of iRGD-pMCMO nanoparticles in the diagnosis of early-stage tumors in vivo. Transgenic adenocarcinoma of mouse prostate (TRAMP) model was established as orthotopic tumor models, in which the prostate tissues of mice became cancerous at 24 weeks of age.37,38 TRAMP mice were intravenously injected with pMCMO or iRGD-pMCMO. Early prostate tumors were difficult to distinguish from normal prostate tissue before the administration of MRICAs (Figure 5c). However, MRI images of tumors in TRAMP mice treated with pMCMO or iRGD-pMCMO showed enhanced contrast between normal prostate and prostate tumor tissues, resulting in clearer MRI images. In addition, prostate tumors were clearly visible in the contrast-enhanced images, and the tumor size was estimated to be only 1–5 mm, indicating that both pMCMO and iRGD-pMCMO achieved excellent contrast for early tumor diagnosis. On evaluating the corresponding MRI signals of orthotopic tumors, iRGD-pMCMO was found to have better contrast enhancement performance than pMCMO (Figure 5d). This trend was consistent with the results observed in MRI images of tumors. Altogether, these results suggest that iRGD-pMCMO nanoparticles as tumor-targeting MRICAs actively recognize early-stage tumors and enhance the contrast between normal and tumor tissues, thereby realizing an accurate diagnosis of early tumors.
We verified the tumor-selectivity of the iRGD-pMCMO nanoparticles by investigating the effects of GSH present in tumors on T1-weighted contrast enhancement. To establish tumor models with different concentrations of GSH, 25-week-old TRAMP mice were, respectively, pre-treated with different concentrations of GSH and a GSH inhibitor (LBS) via direct injection into the tumor site. Untreated TRAMP mice were administered saline, pMCMO, or iRGD-pMCMO at a dosage of 5 mg/kg. In addition, GSH- and LBS-treated TRAMP mice were administered iRGD-pMCMO at a dosage of 5 mg/kg. Subsequently, all mice were scanned on a 3.0 T MRI machine. As shown in Figure 5e, the T1-weighted images of TRAMP mice treated with pMCMO showed significant contrast enhancement when compared with saline-treated mice. In addition, MR images of mice in the iRGD-pMCMO group demonstrated stronger contrast than those of mice in the pMCMO group, further demonstrating the excellent tumor-specific contrast-enhancing ability of iRGD-pMCMO. The T1-weighted images of GSH-pretreated TRAMP mice showed very strong contrast after the administration of iRGD-pMCMO. In particular, the contrast performance of iRGD-pMCMO significantly increased with an increase in the pretreated concentration of GSH. Nevertheless, the T1-weighted images of LBS-pretreated TRAMP mice showed relatively weak contrast. Subsequently, the MRI signals of TRAMP mice in different groups were evaluated, and the results were consistent with those observed in MRI images (Figure 5f). Altogether, these results suggest that the contrast-enhancing ability of iRGD-pMCMO was closely associated with the concentration of GSH in tumor tissues. Therefore, iRGD-pMCMO nanoparticles such as nano-MRICAs have excellent selectivity for GSH-overexpressing tumors and may facilitate early and accurate diagnosis of tumors.
Biosafety of iRGD-pMCMO
Biosafety of nanodrugs is an important parameter for examining their clinical applicability.39 Therefore, we investigated the biodistribution and pharmacokinetic behavior of iRGD-PMCMO nanoparticles. Tumor-bearing mice were divided into two groups (n = 5) and intravenously injected with pMCMO and iRGD-pMCMO, respectively. The mice were sacrificed after 24 h of intravenous injection of either pMCMO or iRGD-pMCMO, and their tumor tissues and vital organs were excised, weighed, and analyzed via ICP-OES. As shown in Figure 6a, pMCMO and iRGD-pMCMO primarily accumulate in liver and spleen tissues, indicating that both types of nanoparticles might be excreted from the body via feces. Notably, the accumulation of iRGD-pMCMO was higher than that of pMCMO in tumor tissues, indicating the excellent tumor-targeting ability of iRGD-pMCMO. In addition, pharmacokinetic curves indicated that both pMCMO and iRGD-pMCMO were completely metabolized after 30 h of injection (Figure 6b), which reduced the risk of potential toxicity induced by long-term accumulation of contrast agents. The half-life of iRGD-pMCMO was longer than that of pMCMO, which increased its accumulation in tumor tissues. Subsequently, we evaluated the biocompatibility of iRGD-pMCMO in vitro and in vivo through hemolysis assay and blood routine examination. Hemolysis assay showed that iRGD-pMCMO at concentration range from μg/mL 10 to 200 μg/mL did not cause damage to red blood cells (Figure 6c). In addition, a routine blood examination showed that the vital blood indices did not significantly change at 24 and 48 h after iRGD-pMCMO injection (Figure 6d). These results demonstrate that iRGD-pMCMO nanoparticles had excellent hemocompatibility. Finally, the biosafety of iRGD-pMCMO was assessed in tumor tissues in vivo (Figure 6e). Tumor-bearing mice were intravenously injected with iRGD-pMCMO (5 mg/kg) at an interval of 2 days. After 24 days, the mice were sacrificed, and their tumor tissues and vital organs were excised, cut into slices, and stained with H&E for pathological analysis. The results revealed no significant pathological changes in tumor tissues, indicating that iRGD-pMCMO nanoparticles had excellent biosafety. In addition, the acute toxicity of iRGD-pMCMO was also investigated as shown in Table S1. Single intravenous injection of iRGD-pMCMO was conducted with SD rats, and the injection dosage was set as 2.5mg/kg, 5 mg/kg, 10 mg/kg, 50 mg/kg, 100 mg/kg, and 500 mg/kg. Survival rate of mice still reached up to be 100% even if the injection dosage of iRGD-pMCMO at 50 mg/kg. Notably, the maximal dosage of iRGD-pMCMO at 500 mg/kg only caused the death of three rats, this dosage was more 100-folds of actual injection dosage. Altogether, these results suggest that iRGD-pMCMO nanoparticles have excellent biosafety and great application potential in clinical settings.
 |
Figure 6 Evaluation of biosafety in vivo. (a) Biodistribution of pMCMO and iRGD-pMCMO in mice at postinjection 6h. (b) the pharmacokinetic curves of pMCMO and iRGD-pMCMO in mice after administration. (c) Hemolysis assay of iRGD-pMCMO. (d) The blood routine analysis of mice treated with iRGD-pMCMO at postinjection 24h and 48 h. (e) H&E staining of vital organs in mice after treated with iRGD-pMCMO. Data are presented as mean ± SEM. ***p < 0.001. |
Conclusions
In this study, we successfully developed a novel tumor-selective nano-MRICA (iRGD-pMCMO) for early and accurate diagnosis of malignant tumors. The iRGD-pMCMO demonstrated uniform size and excellent colloidal stability in different media. Owing to its mesoporous structure, it promotes accessibility of water molecules, which significantly enhances its T1 contrast performance. In addition, the iRGD-pMCMO actively targeted tumor cells, quickly responded to a weakly acidic TME, and released a large number of Mn2+ ions that selectively interacted with cellular GSH, further improving T1-weighted imaging. In vivo experiments revealed that iRGD-pMCMO significantly enhanced the contrast between normal and tumor tissues in MR images and demonstrated remarkable tumor-selectivity, realizing effective and accurate diagnosis of early-stage tumors. In addition, the iRGD-pMCMO possessed low toxicity for cells, blood, and tissues, demonstrating an excellent biosafety profile. Therefore, the iRGD-pMCMO nanoparticles developed in this study may serve as potent tumor-selective nano-MRICAs for the accurate and early diagnosis of tumors.
Ethics Approval and Consent to Participate
The animal studies were approved and conducted according to the experimental protocols by Institutional Animal Care and Use Committee of Shanghai Jiao Tong University, School of Medicine.
Funding
This work was supported by the National Natural Science Foundation of China (No. 82170975).
Disclosure
The authors declare that they have no known competing financial interests or personal relationships that could have appeared to influence the work reported in this paper.
References
1. Ahmad R, Bouman CA, Buzzard GT, et al. Plug-and-play methods for magnetic resonance imaging: using denoisers for image recovery. IEEE Signal Process Mag. 2020;37:105–116. doi:10.1109/MSP.2019.2949470
2. Puntmann VO, Peker E, Chandrashekhar Y, et al. T1 mapping in characterizing myocardial disease: a comprehensive review. Circ Res. 2016;119:277–299. doi:10.1161/CIRCRESAHA.116.307974
3. Schramm C, Eaton J, Ringe KI, et al. Recommendations on the use of MRI in PSA-A position statement from the international psc study group. Hepatology. 2017;66:1675–1688. doi:10.1002/hep.29293
4. Yu Z, Han X, Zhang S, et al. MouseGAN++: unsupervised disentanglement and contrastive representation for multiple MRI modalities synthesis and structural segmentation of mouse brain. IEEE Trans Med Imaging. 2022;42:1197–1209. doi:10.1109/TMI.2022.3225528
5. Weiskopf N, Edwards LJ, Helms G, et al. Quantitative magnetic resonance imaging of brain anatomy and in vivo histology. Nat Rev Phys. 2021;60:443–452.
6. Chen X, Teng S, Li J, et al. Gadolinium (III)-chelated deformable mesoporous organosilica nanoparticles as magnetic resonance imaging contrast agent. Adv Mater. 2023;35:e2211578. doi:10.1002/adma.202211578
7. Zhang L, Yin F, Lu K, et al. Improving liver tumor image contrast and synthesizing novel tissue contrasts by adaptive multiparametric MRI fusion. Precis Radiat Oncol. 2022;6:190–198. doi:10.1002/pro6.1167
8. Lu Y, Feng J, Liang Z, et al. A tumor microenvironment dual responsive contrast agent for contrary contrast-magnetic resonance imaging and specific chemotherapy of tumors. Nanoscale Horiz. 2022;7:403–413. doi:10.1039/D1NH00632K
9. Zhao Z, Sun C, Bao J, et al. Surface manganese substitution in magnetite nanocrystals enhances T1 contrast ability by increasing electron Spin relaxation. J Mater Chem B. 2017;6:401–413. doi:10.1039/C7TB02954C
10. Carniato F, Ricci M, Tei L, et al. Novel nanogels loaded with Mn(II) chelates as effective and biologically stable MRI probes. Small;2023. e2302868. doi:10.1002/smll.202302868
11. Lu X, Zhou H, Liang Z, et al. Biodegradable and biocompatible exceedingly small magnetic iron oxide nanoparticles for T1-weighted magnetic resonance imaging of tumors. J Nanobiotechnol. 2022;20:350. doi:10.1186/s12951-022-01562-y
12. Peng Y, Tsang S, Chou P. Chemical design of nanoprobes for T1-weighted magnetic resonance imaging. Mater Today Bio. 2016;218:112750.
13. Lu C, Xu X, Zhang T, et al. Facile synthesis of superparamagnetic nickel-doped iron oxide nanoparticles as high-performance T1 contrast agents for magnetic resonance imaging. J Mater Chem B. 2022;10:1623–1633. doi:10.1039/D1TB02572D
14. Green C, Jost G, Frenzel T, et al. The effect of gadolinium-based contrast agents on longitudinal changes of magnetic resonance imaging signal intensities and relaxation times in the aging rat brain. Invest Radiol. 2022;57:453–462. doi:10.1097/RLI.0000000000000857
15. Xu K, Liu H, Zhang J, et al. Improving longitudinal transversal relaxation of gadolinium chelate using silica coating magnetite nanoparticles. Int J Nanomed. 2019;14:7879–7889. doi:10.2147/IJN.S211974
16. Guo S, Xiao X, Wang X, et al. Reductive microenvironment responsive gadolinium-based polymers as potential safe MRI contrast agents. Biomater Sci. 2019;7:1919–1932. doi:10.1039/C8BM01103F
17. Gonzalez-Martin R, Palomar A, Quiñonero A, et al. The impact of essential trace elements on ovarian response and reproductive outcomes following single euploid embryo transfer. Int J Mol Sci. 2023;24:10968. doi:10.3390/ijms241310968
18. Hall AR, Geoghegan M. Polymers and biopolymers at interfaces. Rep Prog Phys. 2018;81:036601. doi:10.1088/1361-6633/aa9e9c
19. Jensen AI, Severin GW, Hansen AE, et al. Remote-loading of liposomes with manganese-52 and in vivo evaluation of the stabilities of 52Mn-DOTA and 64Cu-DOTA using radiolabelled liposomes and PET imaging. J Control Release. 2017;269:100–109. doi:10.1016/j.jconrel.2017.11.006
20. Sahar P, Soodabeh D, Nader R, et al. How advancing are mesoporous silica nanoparticles? A comprehensive review of the literature. Int J Nanomed. 2022;17:1803–1827. doi:10.2147/IJN.S353349
21. Xiao JM, Zhang GL, Xu X, et al. A pH-responsive platform combining chemodynamic therapy with limotherapy for simultaneous bioimaging and synergistic cancer therapy. Biomaterials. 2019;216:119254. doi:10.1016/j.biomaterials.2019.119254
22. Ni DL, Bu WB, Ehlerding EB, et al. Engineering of inorganic nanoparticles as magnetic resonance imaging contrast agents. Chem Soc Rev. 2017;46:7438. doi:10.1039/c7cs00316a
23. Ananta JS, Godin B, Sethi R, et al. Geometrical confinement of gadolinium-based contrast agents in nanoporous particles enhances T1 contrast. Nat Nanotechnol. 2010;5:815–821. doi:10.1038/NNANO.2010.203
24. Pierre VC, Harris SM, Pailloux SL. Comparing strategies in the design of responsive contrast agents for magnetic resonance imaging: a case study with copper and zinc. Acc Chem Res. 2018;51:342–351. doi:10.1021/acs.accounts.7b00301
25. Yang Y, Chen S, Li H, et al. Engineered paramagnetic graphene quantum dots with enhanced relaxivity for tumor imaging. Nano Lett. 2018;19:441–448. doi:10.1021/acs.nanolett.8b04252
26. Ndiaye D, Cieslik P, Wadepohl H, et al. Mn2+ bispidine complex combining exceptional stability, inertness, and MRI efficiency. J Am Chem Soc. 2022;144:22212–22220. doi:10.1021/jacs.2c10108
27. Si YC, Zhang GL, Wang D, et al. Nanostructure-enhanced water interaction to increase the dual-mode MR contrast performance of gadolinium-doped iron oxide nanoclusters. Chem Eng J. 2019;360:289–298. doi:10.1016/j.cej.2018.11.219
28. Cheng ZL, Thorek DL, Tsourkas A. Gadolinium-conjugated dendrimer nanoclusters as a tumor-targeted T1 magnetic resonance imaging contrast agent. Angew Chem Int Ed. 2010;49:346–350. doi:10.1002/anie.200905133
29. Sun Q, He J, Li X, et al. Misfit Dislocations at Ag/Mn3O4, Cu/MnO and Cu/Mn3O4 Interfaces. Acta Mater. 1998;46:111–126.
30. Li T, Xue B, Wang B, et al. Tubular Monolayer Superlattices of Hollow Mn3O4 Nanocrystals and Their Oxygen Reduction Activity. J Am Chem Soc. 2017;139:12133–12136. doi:10.1021/jacs.7b06587
31. Lin YS, Hung Y, Su JK, et al. Gadolinium(III)-incorporated nanosized mesoporous silica as potential magnetic resonance imaging contrast agents. J Phys Chem B. 2004;108:15608–15611. doi:10.1021/jp047829a
32. Cho HJ, Lee SJ, Park SJ, et al. Activatable iRGD-based peptide monolith: targeting, internalization, and fluorescence activation for precise tumor imaging. J Control Release. 2016;237:177–184. doi:10.1016/j.jconrel.2016.06.032
33. Zhang Z, Qian H, Huang J, et al. Anti-EGFR-iRGD recombinant protein modified biomimetic nanoparticles loaded with gambogic acid to enhance targeting and antitumor ability in colorectal cancer treatment. Int J Nanomed. 2018;13:4961–4975. doi:10.2147/IJN.S170148
34. Zhang YN, Liu Lu L, Li WL, et al. PDGFB-targeted functional MRI nanoswitch for activatable T1–T2 dual-modal ultra-sensitive diagnosis of cancer. J Nanobiotechnol. 2023;21:9. doi:10.1186/s12951-023-01769-7
35. Geng Z, Chen F, Wang X, et al. Combining Anti-PD-1 antibodies with Mn2+-Drug coordinated multifunctional nanoparticles for enhanced cancer therapy. Biomaterials. 2021;275:120897. doi:10.1016/j.biomaterials.2021.120897
36. Xiao J, Yan M, Zhou K, et al. A nanoselenium-coating biomimetic cytomembrane nanoplatform for mitochondrial targeted chemotherapy- and chemodynamic therapy through manganese and doxorubicin codelivery. J Nanobiotechnol. 2021;19:227. doi:10.1186/s12951-021-00971-9
37. Foster BA, Gingrich JR, Kwon ED, et al. Characterization of prostatic epithelial cell lines derived from transgenic adenocarcinoma of the mouse prostate (TRAMP) model. Cancer Res. 1997;57:3325–3330.
38. Raina K, Blouin MJ, Singh RP, et al. Dietary feeding of silibinin inhibits prostate tumor growth and progression in transgenic adenocarcinoma of the mouse prostate model. Cancer Res. 2007;67:11083–11091. doi:10.1158/0008-5472.CAN-07-2222
39. Zhang X, Chen J, Jiang Q, et al. Highly biosafe biomimetic stem cell membrane-disguised nanovehicles for cartilage regeneration. J Mater Chem B. 2020;8:8884–8893. doi:10.1039/D0TB01686A
 © 2024 The Author(s). This work is published and licensed by Dove Medical Press Limited. The
full terms of this license are available at https://www.dovepress.com/terms
and incorporate the Creative Commons Attribution
- Non Commercial (unported, 3.0) License.
By accessing the work you hereby accept the Terms. Non-commercial uses of the work are permitted
without any further permission from Dove Medical Press Limited, provided the work is properly
attributed. For permission for commercial use of this work, please see paragraphs 4.2 and 5 of our Terms.
© 2024 The Author(s). This work is published and licensed by Dove Medical Press Limited. The
full terms of this license are available at https://www.dovepress.com/terms
and incorporate the Creative Commons Attribution
- Non Commercial (unported, 3.0) License.
By accessing the work you hereby accept the Terms. Non-commercial uses of the work are permitted
without any further permission from Dove Medical Press Limited, provided the work is properly
attributed. For permission for commercial use of this work, please see paragraphs 4.2 and 5 of our Terms.