Back to Journals » Risk Management and Healthcare Policy » Volume 15
A Sustainable Model for Emergency Medical Services in Developing Countries: A Novel Approach Using Partial Outsourcing and Machine Learning
Authors Rathore N, Jain PK, Parida M
Received 7 September 2021
Accepted for publication 6 January 2022
Published 9 February 2022 Volume 2022:15 Pages 193—218
DOI https://doi.org/10.2147/RMHP.S338186
Checked for plagiarism Yes
Review by Single anonymous peer review
Peer reviewer comments 3
Editor who approved publication: Dr Jongwha Chang
Nikki Rathore,1 Pramod Kumar Jain,1 Manoranjan Parida2
1Department of Mechanical and Industrial Engineering, Indian Institute of Technology Roorkee, Roorkee, 247667, India; 2Department of Civil Engineering Indian Institute of Technology Roorkee, Roorkee, 247667, India
Correspondence: Nikki Rathore, Department of Mechanical and Industrial Engineering, Indian Institute of Technology Roorkee, Roorkee, Uttarakhand, 247667, India, Tel +91-9520466428, Email [email protected]
Introduction: Unlike Western countries, many low- and middle-income countries (LMIC), like India, have a de-centralized emergency medical services (EMS) involving both semi-government and non-government organizations. It is alarming that due to the absence of a common ecosystem, the utilization of resources is inefficient, which leads to shortage of available vehicles and larger response time. Fragmentation of emergency supply chain resources motivates us to propose a new vehicle routing and scheduling model equipped with novel features to ensure minimal response time using existing resources.
Materials and Methods: The data set of medical and fire-related emergencies from January 2018 to May 2018 of Uttarakhand State in India was provided by GVK Emergency Management and Research Institute (GVK EMRI) also known as 108 EMSs was used in the study. The proposed model integrates all the available EMS vehicles including partial outsourcing to non-ambulatory vehicles like police vans, taxis, etc., using a novel two-echelon heuristic approach. In the first stage, an offline learning model is developed to yield the deployment strategy for EMS vehicles. Seven well researched machine learning (ML) algorithms were analyzed for parameter prediction namely random forest (RF), convolutional neural network (CNN), k-nearest neighbor (KNN), classification and regression tree (CART), support vector machine (SVM), logistic regression (LR), and linear discriminant analysis (LDA). In the second stage, a real-time routing model is proposed for EMS vehicle routing at the time of emergency, considering partial outsourcing.
Results and Discussion: The results indicate that the RF classifier outperforms the LR, LDA, SVM, CNN, CART and NB classifier in terms of both accuracy as well as F-1 score. The proposed vehicle routing and scheduling model for automated decision-making shows an improvement of 42.1%, 54%, 27.9% and 62% in vehicle assignment time, vehicle travel time from base to scene, travel time from scene to hospital, and total response time, respectively, in urban areas.
Keywords: emergency medical services, integration, routing and scheduling model, non-ambulatory vehicle, random forest, predictive model, EMS, RF
Introduction
Emergency Medical Services (EMS) plays an important role towards public safety by reducing the mortality and morbidity rate. The primary purpose of EMS is to allocate emergency vehicles to call locations, find the nearest hospital for transferring patients and to provide on-site critical emergency care by using the limited available physical and human resources effectively and efficiently. Time is the driving factor in estimating the performance of any EMS system. Example, for a critically injured person in vehicular trauma, the survival depends on the time in which the patient receives prompt treatment. The shorter the time, the higher the chances of survival. In medical terms, this concept is known as the golden hour. This notion is not limited to trauma-related emergencies only. In case of heart attack or stroke, time is a ticking bomb necessitating emergency medical care for patient survival.1
The design of effective EMS systems involves several interconnected strategic decisions, such as locations for deployment of emergency vehicles, number and type of the vehicles, dispatch strategies, hospital selection, etc. In case of emergency management, most of the information is not known beforehand and is made available in real time only which makes it dynamic in nature and difficult to comprehend.
Countries with well-organized emergency medical systems with adequate numbers of ambulances can significantly reduce the response time. However, in areas where the demand is more than the capacity such as low- and middle-income countries (LMICs), the response time is high due to insufficient physical as well as human resources. As per the World Health Organization (WHO), there should be at least one ambulance per 100,000 people. However, in Delhi, the national capital of India, the ratio is alarming with one ambulance for every 144,736 people.2 Of the total ambulances, some are reserved for non-emergency tasks, for example, relocating patients from one health care center to another, or moving discharged patients to their homes. This further reduces the number of ambulances available for life-threatening emergencies.3
There is a growing need to increase the fleet of EMSs in order to adequately address the current as well as burgeoning future demand. Moreover, in India there is no centralized EMS provider, unlike 911 in the US. The role of EMS is spread across numerous public and private organizations resulting in lack of resources integration and protocols standardization implying that EMS as a whole is fragmented and are underfunded or inconsistently funded which further reduces the capacity as well as quality of EMS.4 Similar characteristics of EMS are also evident in countries like Nepal,5,6 Nigeria,7 Vietnam,8 and South Asian9 and African10 nations. Sheu and Pan11 have shown that a centralized emergency supply network in response to a large scale disaster is efficient than a de-centralized system in terms of cost as well as response time.
Further, the world is facing an acute health emergency with the ongoing COVID-19 pandemic. The adverse effects of the pandemic have been pushing the already-struggling economy further down the slippery road.12 While every industry is being impacted by the ongoing pandemic, it’s the health care industry that takes center-stage. The current fragile state of the health care system did not just make the global environment ripe for worldwide pandemic but also exposed how digital transformation in health care has been long-overdue. The influx of patients, inundated hospitals, shortage of resources has exposed some persistent challenges in the health care industry such as lack of transparency and accountability, as well as little monitoring and oversight, leading to increased levels of mental stress for patients as well as their families, students and the elderly.13–15
Increasing the in-house capacity of individual EMS service providers is not an effective approach as demand is variable. Hence, for periods when the demand is higher than the capacity, outsourcing and integration of resources can cater to the demand in a timely and more effective manner. Outsourcing can be done from various sources such as non-EMS vehicles (police vans, rental car providers such as Ola and Uber cab services); and ambulances from private health care facilities (non-public ambulances). In many countries, non-EMS vehicles present at the distress location are used for transporting patients to nearest hospitals.16,17 Cornwell et al18 reported higher mortality outcomes in patients transported by EMS vehicles in comparison to those transported using nearest available non-EMS vehicles.
Non-EMS vehicles can be used during non-availability of ambulances to transport trauma patients to the nearest hospital; if the response time of an ambulance is high; also in non-critical/ non-emergency tasks so that ambulances are available for future emergencies where paramedics are required. For better utilization of resources, the EMS vehicle carrying non-critical patient can be re-routed to serve another patient if the total travel time is significantly low. For countries with limited resources and high demand with significant variability, re-routing strategy can ensure maximum coverage and optimal vehicle usage. With the advancement of technology, the vehicle dispatch system can track the real-time location of vehicles and route the nearest vehicle to the demand location based on travel time and type of emergency.
The critical point in ensuring minimum response time is the real-time estimation of traffic condition on-road segments. Sometimes distance is small but the travel time is high mostly during peak hours. Nowadays, Google Maps Distance Matrix API estimates the real-time traffic information. However, the traffic condition can change because of an accident or other events along the route.19 Hence, using the current traffic information to predict arrival time is not the best way. To overcome this, the vehicle closest to the emergency site can be deployed and navigated in a way that it arrives at the accident location and to the desired hospital in the minimum time with the changing traffic situation. Such problems can be addressed using machine learning (ML) techniques which are very useful in predicting future scenarios such as future demand points, road traffic conditions, location for vehicle redeployment, automatic hospital selection to dispatch patient based on past data to avoid any delay in patient care, etc.
Finding the shortest route from the nearest available vehicle to the emergency call location and then to hospital is termed as vehicle routing of emergency vehicles; refer to20–23 for detailed discussion. In this article, the authors propose a novel two-echelon vehicle routing and scheduling framework with offline ML and partial outsourcing of resources for EMS providers in developing countries. The contributions of this study are:
- Develop a prediction model by applying ML on historical emergency call data from EMS service provider with the following capabilities:
- Analyze well-researched ML algorithms for parameter prediction namely Random Forest (RF), Convolutional Neural Network (CNN), k-Nearest Neighbor (KNN), Classification and Regression Tree (CART), Support Vector Machine (SVM), Logistic Regression (LR), and Linear Discriminant Analysis (LDA) on test data set. The best suited algorithm was used to formulate EMS prediction model.
- Predict future demand areas based on the type of emergencies, time of the day and day of the week for deployment of vehicles to reduce response time.
- Estimate travel time of vehicle based on the time of day and day of the week.
- Predict the choice of hospital in real time based on type of emergency, travel time and availability of resources.
- The model will give two hospital locations based on complications: designated hospital and nearest hospital.
- Develop a non-linear integer programming mathematical model for routing and scheduling of ambulances with partial outsourcing of ambulatory (medically equipped vehicle from private agencies or private hospitals) or non-ambulatory vehicles (e.g., taxis and police vans) equipped with following features:
- Re-route the in-house vehicle carrying non-critical patient en route to hospital to serve another patient if the travel time is significantly low.
- Monitor real-time information such as vehicle location and availability, available hospital capacity, availability of doctors, etc., to avoid any unexpected delay.
- Determine the vehicle type (ambulatory or non-ambulatory) before dispatching to the distress location in case of outsourced vehicles or in case travel time is higher than desired using ML model.
Literature Review
In the last decade, many researchers have used different ML techniques for EMS decision-making.24–26 Ji et al27 developed a dynamic ambulance redeployment strategy for mobile ambulances using deep reinforcement learning framework to reduce the pick-up time of patients. Policy gradient-based reinforcement was used to learn the score network, and redeploy the ambulance at the station with the highest score. Zhou et al28 solved the ambulance demand estimation problem over 2-hour discrete intervals in Toronto, Canada, using a novel time-varying Gaussian mixture approach. Spatial and temporal characteristics of the data over time using mixture weights were proposed. Grekousis and Liu29 developed an artificial intelligent tool to predict the vehicle base locations to address future demand in a short period of time. The study predicted the expected emergency location site instead of zone. Emergency events (EEs) were modeled as sets of interconnected points in space. Zhou30 predicted ambulance demand with accuracy over time and space. Three approaches based on Gaussian mixture models; kernel-density estimation; and kernel warping were proposed by the authors to predict the demand accurately.
While some studies have used ML, deep learning and/or artificial intelligent techniques for predicting the ambulance demand, other studies find these methods useful in predicting travel times on road network.31–38 Boutilier and Chan39 proposed a regression approach to estimate the distribution of ambulance travel time between two points. The method uses global positioning system data obtained from historical trips of ambulances on the given road network. Researchers also use these approaches for the development of tools to recognize the type of emergency from the recorded calls such as cardiac arrest,40,41 so that the medical caregivers can give prompt treatment to the patient without any delay. Chi et al42 developed a novel prediction and optimization-based decision support system for constructing a hospital referral expert system.
Recently scientists used data mining and ML techniques to predict hospital admission of patient in emergency department;43 and in the decision-making of disaster and crisis management related tasks,44,45 allowing advance resources planning and preventing bottlenecks during rescue operations or patient flow. However, these techniques have not been used to predict all the above discussed features (demand locations, travel time, hospital selection, etc.) into single prediction model. In this article, the authors develop a ML model to predict the following: demand sites for deployment of vehicles, travel time and hospital location for an efficient EMS system.
The emergence of new technologies like artificial intelligence (AI) and ML offers unprecedented opportunities to improve patient and clinical team outcomes, reduce costs, and impact global mental health.46 Examples include but are not limited to automation; information synthesis; and recommendations and visualization of information for shared decision-making. The increasing availability of health care data and rapid development of big data analytic methods has made possible the recent successful applications of AI/ML in health care. Guided by relevant clinical questions, powerful AI techniques can unlock relevant information hidden in the massive amount of data, which in turn can assist in decision-making.47–49
However, it is critical to identify suitable ML techniques to analyze the data. Sakr et al50 predicted the all-cause mortality rate using the fitness data. The study evaluated and compared the performance of seven ML techniques in predicting medical outcomes such as mortality from the data set. RF performed best in both accuracy and complexity. Kumari et al51 used a single layer CNN model for identification of text or images containing of bullying comments in social media posts. Han et al52 investigated the response of RF algorithm for intelligent diagnosis of rotating machinery. A framework was developed to compare RF algorithm with other ML techniques from the literature. RF outperformed all in terms of accuracy, stability, and robustness even with small training data sets. Zheng et al53 predicted a tourist’s next most likely points of interest to visit in a city and concluded that results of RF are more accurate as compared to LambdaMART, Ranking SVM, ListNet and RankBoost. Hence, in this research, RF algorithm is used for predictive analysis. The performance of RF is also compared with 7 other classifiers namely KNN, SVM, CNN, LDA, naive Bayes (NB), LR, and a decision tree algorithm known as CART. CNN, SVM, decision trees and deep learning techniques also find applications in other area such as classification of imbalanced data;54 automatic disease detection,55 Web scraping.56,57
Use of historical data in planning of EMS can revolutionize the EMS sector. But certain studies incorporated the uncertainty without feeding any historical data into the ambulance routing and scheduling problem, and used exact approaches, heuristics or metaheuristics for solving the model. Sheu et al58 proposed a stochastic model for estimating real-time effects of incident on surface street traffic congestion. An et al59 developed a mixed integer non-linear scenario driven stochastic model to solve facility location problem with facility disruption risks; in transit traffic congestion and in facility queuing delay.
Zhang et al60 developed a mathematical model for the allocation of manpower and routing of ambulances for the non-emergency transfer service using variable neighborhood search algorithm. Liu et al61 introduced a double standard model using genetic algorithm to solve vehicle allocation problem for EMS. Shishebori and Yousefi Babadi62 developed a mixed-integer programming model for medical facility location and network design with system disruptions and uncertainty. Andersson and Värbrand63 developed a decision support system for dynamic relocation and automatic dispatching of ambulances. Lu and Sheu64 developed a robust vertex p-center model for locating urgent relief distribution centers while addressing uncertainty in travel time.
However, the majority of prior research lacks integration of predictive analysis into the ambulance routing and decision-making. This article develops a framework which incorporates the predictions from past data into the vehicle routing model to make informed decisions in real time.
Materials and Methods
Study Area
The data set used in this study was provided by GVK Emergency Management and Research Institute (GVK EMRI) commonly known as 108 Emergency Medical Service in India. Calling 108 is suited for different emergencies like medical, fire-related accidents, and reporting an ongoing crime,65 etc. The data used in this study are medical and fire-related emergencies from January 2018 to May 2018 in state of Uttarakhand, India. The total geographical area of the state is 53,483 km2, of which 86% of the area is mountainous-terrain and 65% is covered by forest but has a very low population density of 189 persons per km2 as per Census 2011. 69.45% of the population is rural population and the rest is urban population, thus making it difficult to deploy dedicated ambulances for small and scattered patches of population. The total number of requests is 43,404 in the data with a surprising turn that only 29.6% of them are from urban areas while 70.4% are from rural areas.
Ethics
The study protocol was reviewed and approved by corresponding author’s scientific research committee on 22nd June, 2016. The data given by GVK Emergency Management and Research Institute was anonymized. As the information used in this study does not include any identifying information of the patients; thus, a written consent from the patients was not required. This study is anonymized, and informed consent was waived.
Data Set and Preprocessing
To reduce the complexity and for the ease of data handling, the present study is modeled and tested on the data set of the Dehradun district of Uttarakhand, India. It contains all the features of the original data set. The raw data set contains 9766 requests out of which 38.6% are from urban area and 61.4% are from rural areas. For each request, a total of 659 variables are collected and divided into 16 major feature categories presented in Table 1. Some of the data entries are listed as “NULL”, such as no scene to hospital distance, any landmark, etc. For all those cases a dummy value is assigned, e.g., N/A for categorical data and 4-digit random numerical number for numerical data. Before the training and testing of the model, categorical data of each feature set is converted into numerical value using label encoder class of python tool. The processing steps for each category are defined below.
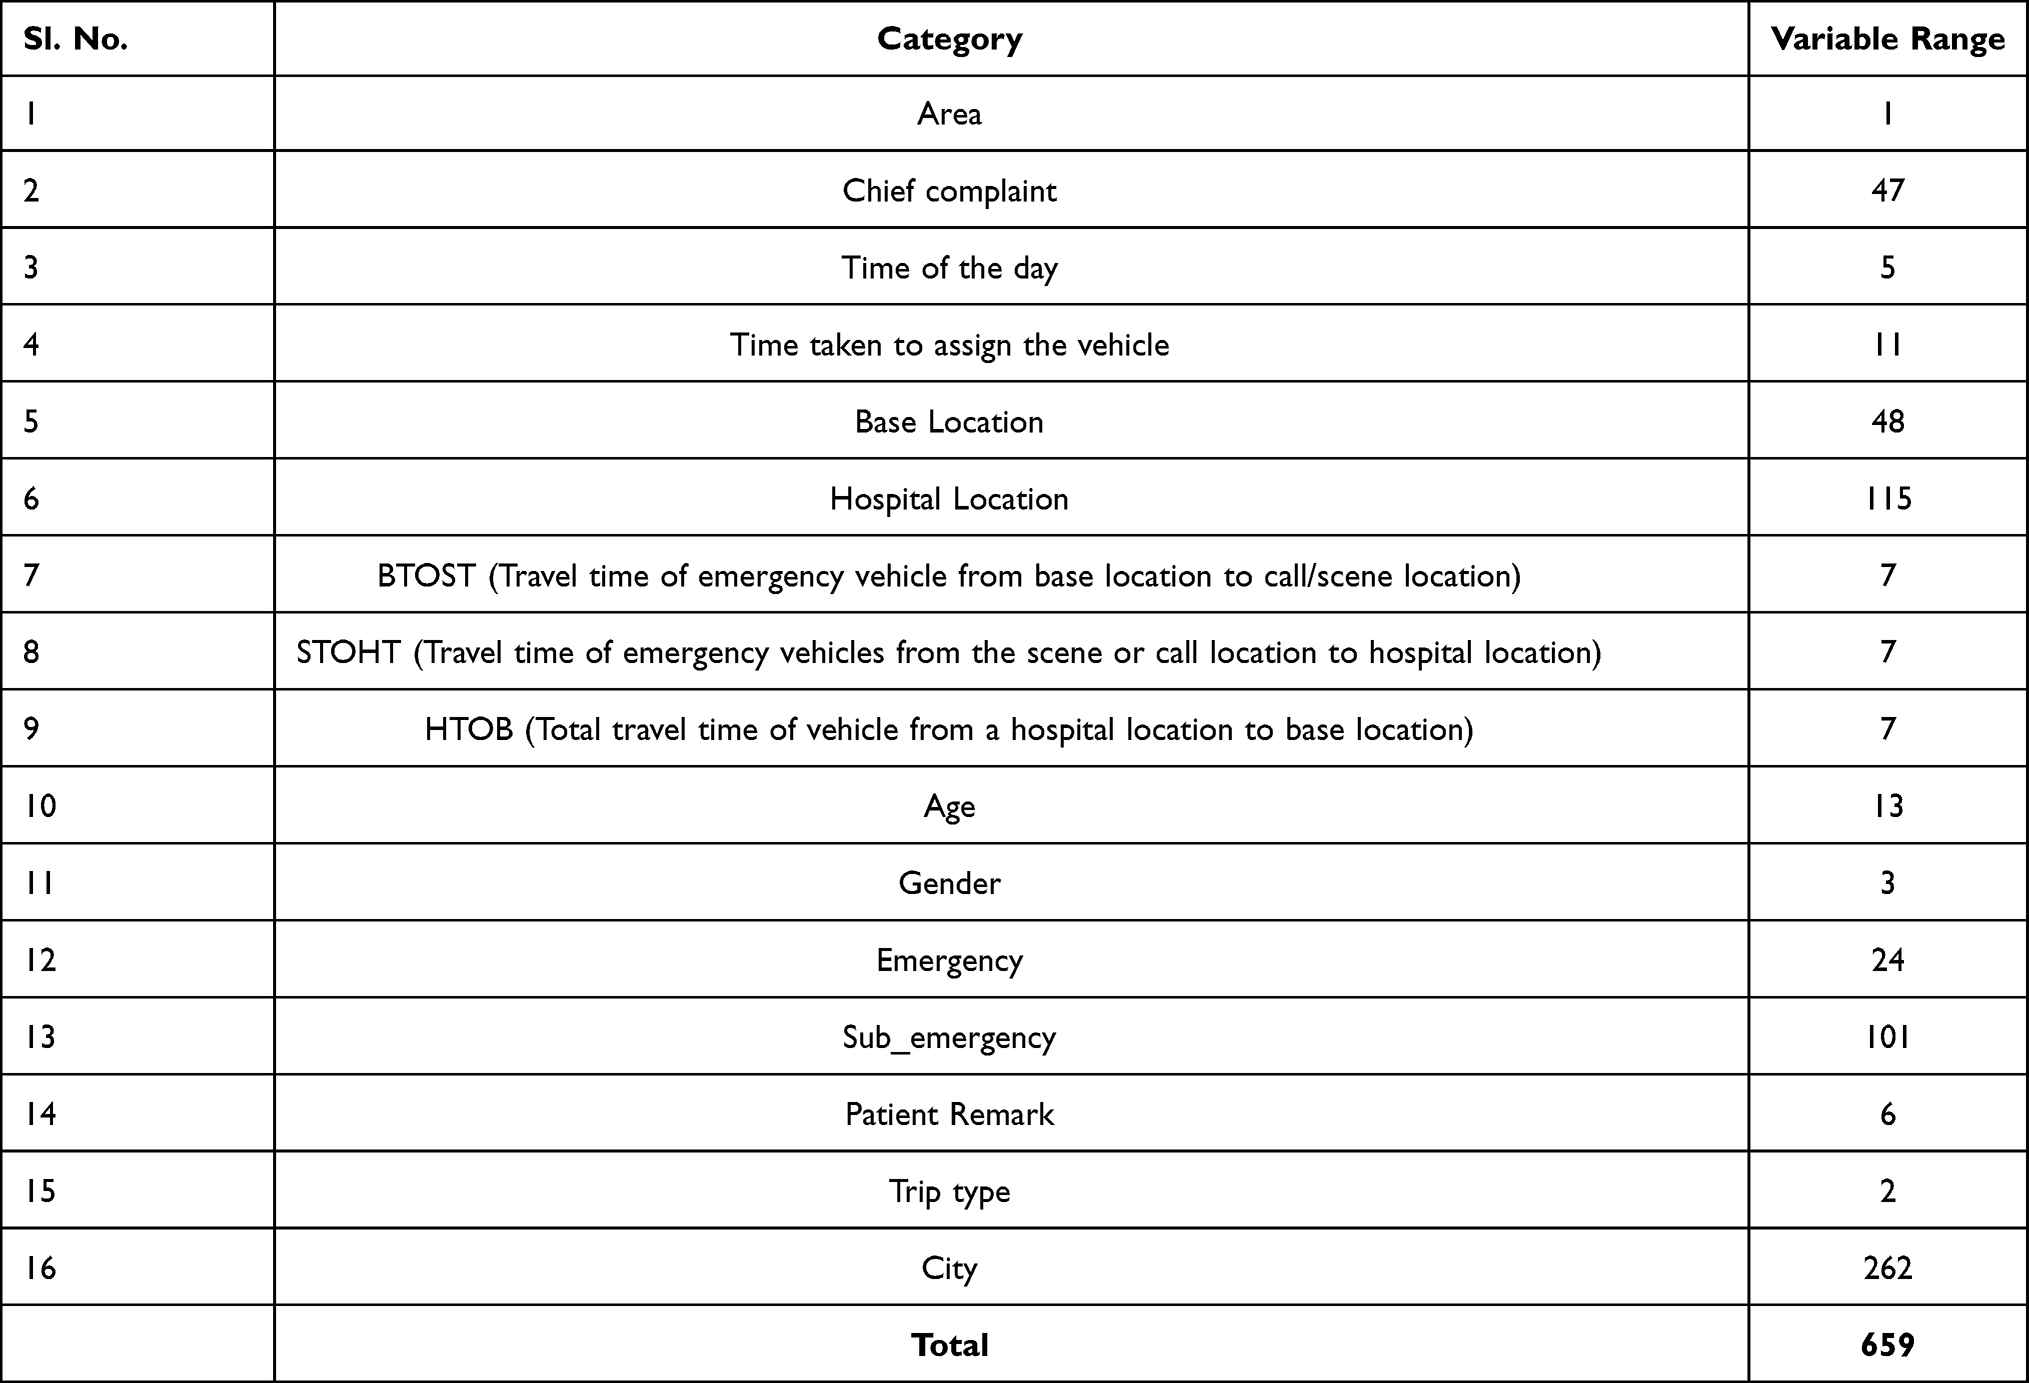 |
Table 1 Model Variables |
Area: The area of call location is listed as rural or urban, encoded in a binary variable (0 = Rural, 1 = Urban).
Chief complaint: 47 types of medical emergencies are identified as unique categories such as vehicular trauma, non-vehicular trauma, cardiac, head injury, fever, fracture, etc. The distribution of requests on the basis of the chief complaint is given in Table 2. The major chief complaint is pregnancy-related which contributes to 37.3% of all call requests. These categories are further listed as critical and non-critical emergencies and the distribution of chief complaint on the basis of criticality is shown in Tables 3 and 4.
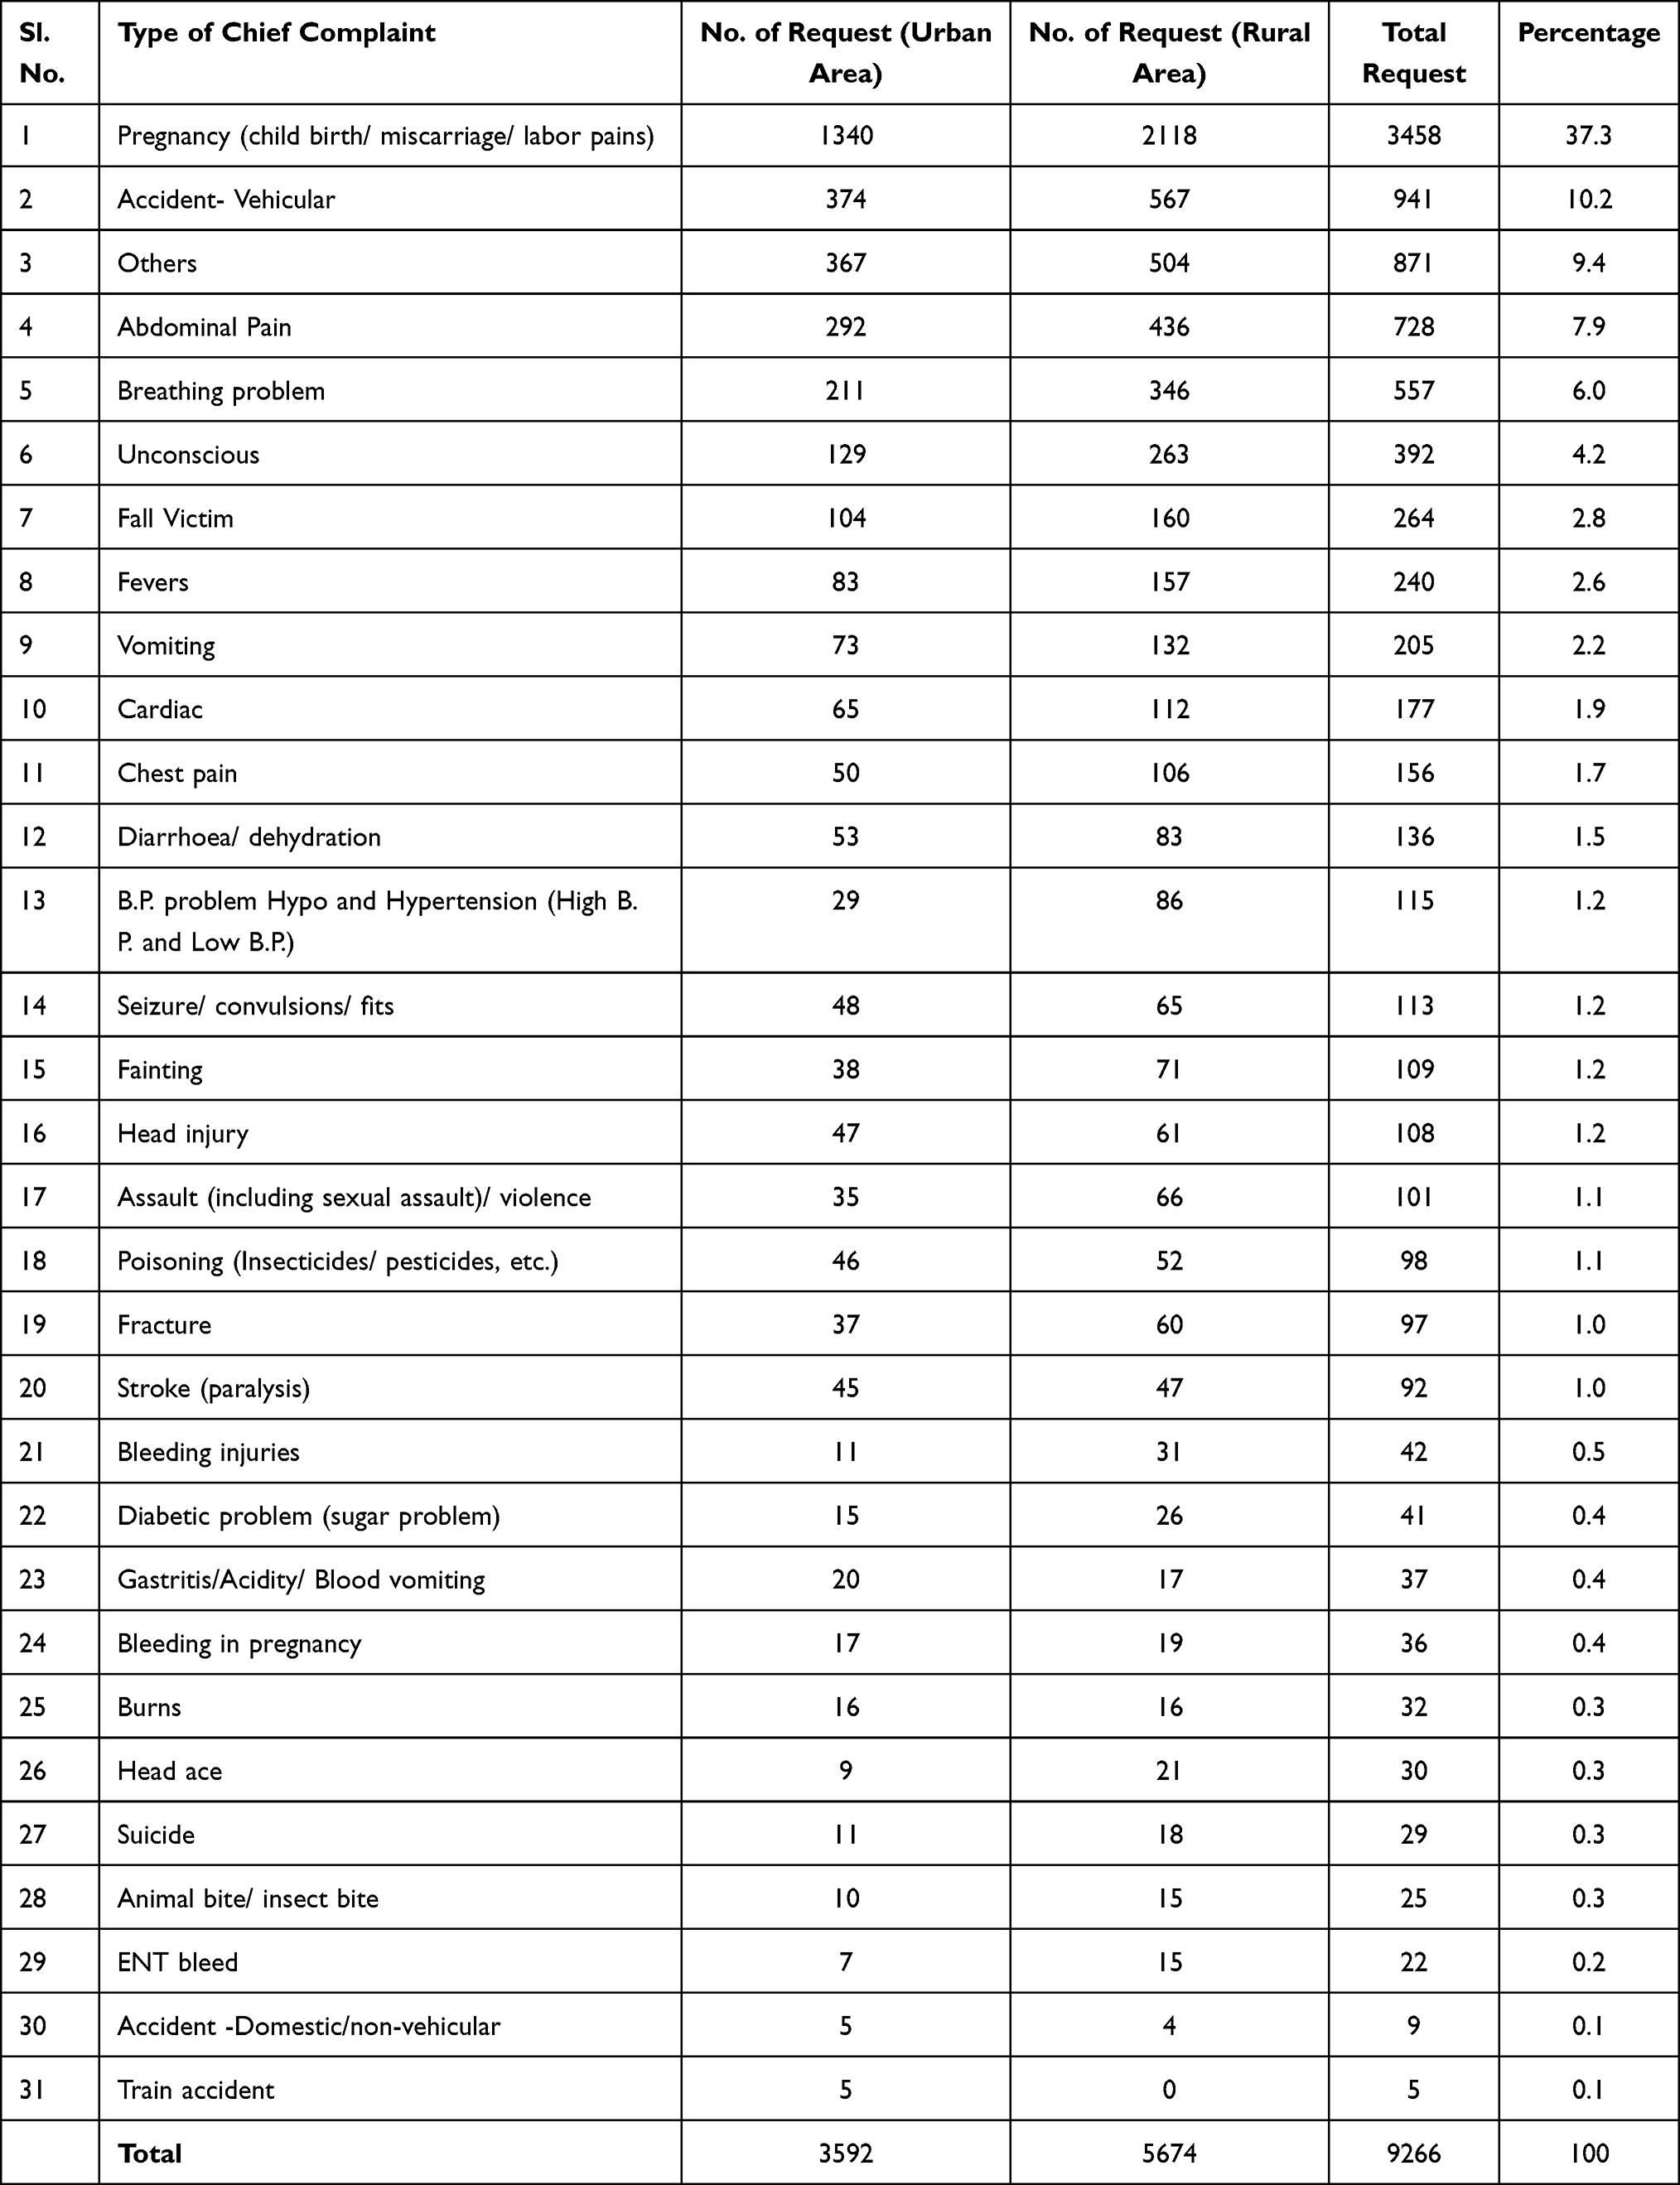 |
Table 2 Total Call Requests Distribution Based on Chief Complaint |
Time of the day: EMS arrival calls per unit time are assumed to follow Poisson or Poisson related distribution by most of the researchers.66–69 So, based on the data, the 24-hour shift has been divided into five periods: early morning hours (03:00–09:00), morning hours (09:01–11:59), afternoon hours (12:00–17:00), evening hours (17:01–21:00), and night hours (17:01–21:00). (21:01–2:59). The average number of calls per hour in each time frame is similar. The incoming distress call distribution in percent throughout the day is as follows: 14.2% between 9:01–11:59, 22.3% between 12:00–17:00, 17.7% between 17:01–21:00, 26.6% between 21:01–2:59, and 19.2% between 3:00–9:00.
Time taken to assign the vehicle: All the requests were distributed in 11 time-intervals. The intervals are defined as 0–1, 1–2, 2–4, 4–6, 6–8, 8–10, 10–15, 15–20, 20–25, 25–30, >30.
Base location: 48 unique ambulance base locations were identified in the Dehradun district of Uttarakhand, India as the base location. Base locations indicate the vehicle station location. These bases are shifted to other locations at every fixed interval of time on the basis of demand pattern of the previous period.
Hospital location: The data provided lists 115 different hospitals. There are both public and private hospitals on the list. From January through May, patients were sent to these hospitals.
The total travel time of ambulance in response to an emergency is divided into 3 parts as follows:
BTOST*: Travel time of emergency vehicle from base location to call/scene location was taken as metrics for BTOST.
STOHT*: STOHT variable includes the travel time of emergency vehicles from the scene or call location to hospital location.
HTOB*: The total travel time value of the vehicle from a hospital location to base location was taken as the basis of HTOB variable.
*Note: It may be noted that BTOST, STOHT and HTOB have divided into 7 different time-intervals in minutes (0–10, 10–20, 20–30, 30–40, 40–50, 50–60, >60) for drawing a categorical comparison between two events rather than having continuous comparison. This reduces the complexity of the RF model as individual travel-times are still considered for making predictions. Another argument could have been to use continuous predictions instead of breaking into time-intervals, but that would’ve left the decision-making to be done post-prediction, and that too at a higher computational expense. Thus, it is suitable to present the results in given time-intervals.
Age: For a better understanding of the demand requests with respect to type of emergency and area, the age of the patient is also taken into consideration. Patients are classified into 13 age groups with a 7-year interval; for example, patients aged 0 to 7 years are included in one group.
Emergency: Type of emergency diagnosed (i) by on-call description by the victim, and (ii) at the scene location by the first responders.
Sub_emergency: Further categorization of the emergency type, e.g., Pregnancy-related emergency is further diagnosed as labor pains, miscarriage, bleeding in pregnancy, etc.
Patient Remark: Before terminating the request, each call record in the data set has an ending remark that specifies the paramedics’ course of action concerning the patients, e.g., Closed (patient admitted at hospital); Closed First Aid (first responder gave first aid to the patient); First responder found that the patient is in stable condition (no emergency); Patient expired (before ambulance reached the scene location); Patient refused treatment (used the transport).
City: Locations of a base from where the ambulance was dispatched is recorded as the city variable.
Predictive Analysis
The RF algorithm is used in this study for the predictive analysis. The predictions are made based on the historical data for (i) deployment strategy of EMS vehicles, (ii) choice of ambulatory/non-ambulatory vehicle when the distress call is received, and (iii) hospital selection if the victim is not able to communicate his/her choice when first responding vehicle reaches the distress call location.
Considering the empirical aspect, it seemed reasonable to test a tree model. For this RF was chosen. The performance of RF classifier is compared with 7 other classifiers namely KNN, SVM, CNN, LDA, NB, LR and decision tree algorithm known as CART. Accuracy and F1 score is used as a measure of performance for all techniques. The analysis of the compared results is presented in section 3.
We classified the data into three categories of prediction such as peak demand periods (based on type of emergency, area, and time of the day), vehicle deployment location during peak hours (based on future distress locations, type of emergency and travel time), and hospital selection (based on travel time and emergency type). The RF classifier includes 16 attributes/features related to the emergency already discussed in section 2.2. Ninety percent of the total data entries were used to train the model and the rest 10% were used to test the model.
Random Forest Algorithm
An RF is built by creating the bootstrapped data set from the given data. The bootstrapped data set may have repeated data entries as it is created randomly. RF randomly selects the set of variables and further divides it by randomly selecting a subset of variables/attributes at every step. Once a decision tree is formed, a new bootstrapped data set is created and a new tree is formed again by taking a subset of variables at each step. This is repeated “n” number of times. The use of a bootstrapped sample and only a subset of the attributes at every stage results in a wide variety of trees.
The bootstrapped data set allows duplicate entries, as a result, some of the entries are not included in the bootstrapped data set. Typically, 1/3 of the original entries do not end up in the bootstrapped data set. Such entries are known as “Out-of-Bag Data sets.” These “Out-of-Bag Data sets” are used to determine the accuracy of the model as follows:
- Run Out-of-Bag Data set entry through all of the decision trees and store the output. Aggregate the results and assign that to the out of bag sample.
- The number of out-of-bag samples that are correctly classified by RF will determine the accuracy of the model.
- The proportions of the out-of-bag samples that were falsely classified are the out-of-bag error.
Pseudocode to build a RF:
1. Create a bootstrap sample X1 of size K from the training data set.
2. Arbitrary choose “A” attributes from the total of “N” attributes.
Where A ≪ N

3. Between the selected “A” attributes, find the best split node “s” using Gini Index.
Gini Index (s)=  , where
  is the relative frequency of class z in the node s.
4. Using the best split, divide the node into offspring nodes.
- Repeat steps 1 to 3 until the stopping criteria has been reached, i.e., nodes cannot be split further.
6. Repeat the steps 1–5 for “m” times to create “L” no. of trees.
Pseudocode for developing the accurate RF
1. Build an RF.
2. Calculate the accuracy of RF using the out-of-bag data set.
3. Alter the no. of attributes used per step to build a bootstrapped data set
4. Go to step 1 and repeat
5. Do this for n no. of times and then select the one that is most accurate.
Pseudocode to predict the outcome for a new test data at point “t”

2. Similarly, find the prediction outcome of each tree.

Routing Methodology
To reduce the total response time; improve the patient survival rate, and increase the overall efficiency of EMS in India, the proposed research is focused on developing a more sustainable solution. The objective of the study is to manage the limited resources to meet the uncertainties. This can be achieved by integrating alternative transportation vehicle modes other than 108 ambulances, e.g., non-ambulatory transportation vehicles (police cars, taxi, etc.), non-public ambulance service providers.
In developing countries, especially India, the criticality of the incident cannot be predetermined. To tackle this issue, the proposed model implements a novel approach which includes determining the criticality after reaching the distress location, and accordingly take decisions for rest of the vehicle-routing strategy.
The proposed routing algorithm is designed to incorporate the results of predictive analysis for efficient and effective scheduling and routing of vehicles as shown in Figure 1. The features of the proposed routing and scheduling framework are:
- Location for vehicle deployment: Based on the predictions, hot spot locations for next period are created and vehicle is deployed at the center of that location inside a government building or school or a hospital.
- Which vehicle to dispatch: In trauma cases, as discussed earlier it is more important to transport the patient to hospital as soon as possible with or without first responders; but in cardiac related emergencies first responders are needed to transport the patient. Since criticality of patient is not known beforehand, the RF will help in dispatching of vehicle by categorizing the calls into type of emergencies, sub-emergencies and determining the criticality using past data.
- In India, hospital selection in general is done by patient or his/her acquaintances at the distress location. Otherwise, first responders take decision based on their experience and knowledge. In such cases, the prediction model can help in taking these decisions. Patients’ hospital preferences are influenced by a variety of factors, including their financial condition and the severity of their condition. For example, critically injured patients prefer a well-equipped hospital over finances and non-critical patients are more likely to choose public hospitals. The hospital location is predicted based on the type of emergency and travel time.
- Two hospital locations are needed in this study:
- Designated hospital: Predicted by the RF model based on type of emergency and demand locations. There can be more than one designated hospital. Final selection will be done by routing model based on the availability of resources in real time and travel time.
- Nearest hospital: Given by the routing model in case designated hospital is too far.
- The decision of dispatching the patient to hospital is taken in real-time by the routing model once the criticality of patient is known. Because in India, the criticality of patient is not known beforehand and is determined after arriving at the distress location only. Also, the choice of hospital will depend upon the availability of resources in real-time. If the patient is critical, then the person is dispatched to nearest hospital instead of designated hospital.
- The prediction model is also used to estimate the travel time of vehicle based on the time of day and day of the week.
- In the data set, route taken by the emergency vehicle is not given; only locations such as vehicle start location, call/patient location, hospital location and the distance between each pair (vehicle base to patient location; patient location to hospital; and hospital to base location) is given.
- A distance–time matrix is created using the given data. The prediction model uses the distance–time matrix to predict the travel time between two locations.
- Another attribute which contributed to prediction of travel time is time of the day. The travel time is predicted for short time horizons of up to one hour.
- Vehicle travel time is estimated after comparing the predicted travel time of ML model with the time given by Google Maps Distance Matrix API. GPS data, once the trip is ended, is then used to calculate the error in prediction between the actual and estimated time for future correction.
- A non-linear integer programming mathematical model is then developed for routing and scheduling of ambulances with partial outsourcing of ambulatory or non-ambulatory vehicles.
- Other than outsourcing, the optimization model may re-route the in-house vehicle carrying non-critical patient enroute to hospital to serve another patient if the travel time is significantly less.
- The proposed framework also determines the vehicle type (ambulatory or non-ambulatory) before dispatching to distress location in case of outsourced vehicles or in cases travel time is more than desired using ML model.
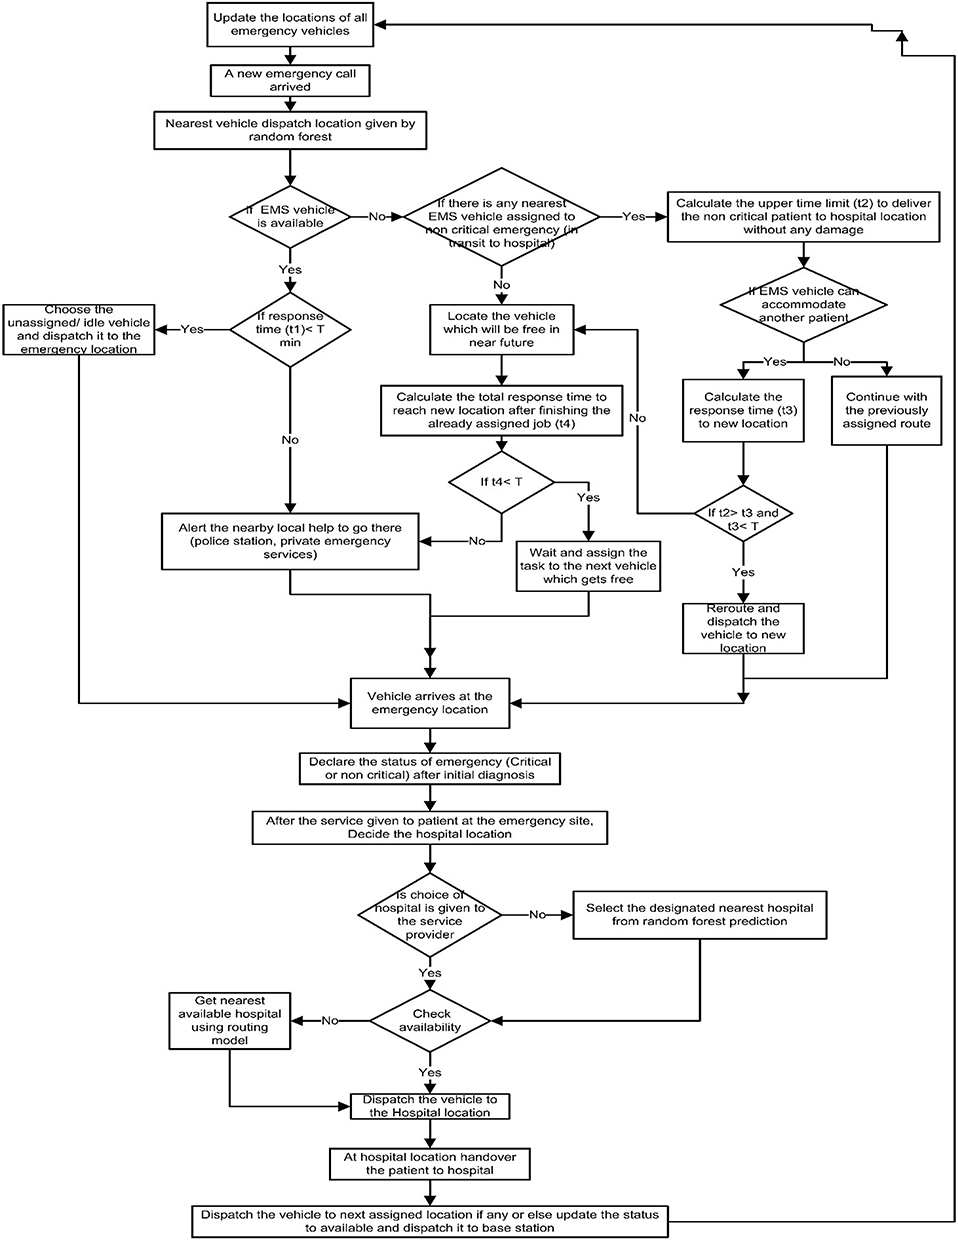 |
Figure 1 Vehicle routing methodology. |
Following assumptions are considered before modeling the routing problem:
- All vehicles can serve any patient in case of unavailability of public ambulatory vehicles.
- Non-ambulatory vehicles are prohibited from assigning to call location which will need medical staff for pre-hospital care, e.g., heart-related emergencies, etc. (as discussed in literature review).
- If more than one emergency vehicle is needed at the call location, then the request will be divided into several and will be treated as individual requests with the same location.
- Only public vehicles may be re-routed to serve more than one patient if it is transporting a non-critical patient and in transit to the hospital.
- Cloud sharing: Real-time sharing of information related to the emergency among all the parties involved:
- a. In cases where 108 is too far to respond, any nearby patient carrier option can raise the hand and deliver the patient to hospital.
- b. In the meantime, with every incoming emergency request, nearby hospital’s status is also known in real-time and the hospital can give green signals whether they can accommodate a new request or not. If they cannot accommodate then new hospital can be identified with available facilities without losing time.
- Before making a dispatching decision to a new location, the vehicles that are at patient scene, re-routed once and/or transporting critical patients are excluded from the list of available vehicles.
- Status of patient with respect to criticality is known at the patient location only. First responders after examining the patient will update the patient’s status.
- Real-time status update with respect to each vehicle (vehicle is connected to GPS).
- a. So that in case of vehicle breakdown or other random error (gets stuck) then for preliminary treatment the patient can be taken to a nearby clinic or a hospital, whichever is nearest, for the first aid and after that transferred to the desired hospital. The vehicle is subjected to a destination change if required.
- b. If a new emergency request is located on the way to the hospital of already assigned vehicle, then it can accommodate new emergency if needed.
- Nearest hospitals have the resources to stabilize the critical patient but may or may not specializes in definitive care.
- Real-time data feedback to improve the system: travel time, type of emergency, environmental conditions, social and cultural conditions, time of the day, location of request, etc., to estimate the reasons for delay for future reference.
- Google Maps Distance Matrix API is used to calculate the real-time traffic information.
- a. Due to the mixed traffic conditions on Indian roads, it is difficult to consistently predict travel times accurately.
- b. The integration of Google Maps Distance Matrix API into the model will help in developing the optimized routes.
- c. It will convert the emergency location into latitude and longitude coordinates and calculate distance/time between emergency location and base location and/or hospital.
After considering all the above assumptions, the proposed model is designed to take decisions in four phases.
- In the first phase, vehicle is assigned to the call location based on its availability and current location.
- Decisions regarding the re-routing of vehicles are taken in the second phase. A vehicle transporting non-critical patients to the hospital can be re-routed to serve another patient if the travel time is less. However, the vehicle serving critical patient or two patients is exempted.
- In the third stage, hospital is assigned to patient either based on his/her preference if given any or based on the predictions of RF.
- In the last stage, model relocates the vehicle either to the next call location or towards base station if no call is received.
The developed methodology for the real-time routing and scheduling of emergency vehicles is presented in Figure 1. The proposed problem is solved as a nonlinear integer programming problem. It incorporates the predictions from RF into the model before dispatching the vehicle.
Mathematical Formulation
The proposed objective function (OF) has six parts for routing and dispatching of vehicles. Aim of OF is to minimize the total travel time.

The model notations and decision variables are given in Appendix A.
The first term in OF minimizes the vehicle travel time from base to emergency location. The second term minimizes the travel time from emergency to hospital location for vehicles which are exempted from serving another patient ie vehicles transporting either critical patient or two patient or non-ambulatory vehicles. The third to fifth term minimizes the travel time for public vehicles (108) serving non-critical patients.
The first constraint given by Equation 2, states that at any node, vehicles can be dispatched only to: call/patient location, hospital or base station.

The second constraint given by Equation 3 states that non-ambulatory vehicle will not be assigned to emergency locations requiring medical staff for pre-hospital care;

The third constraint given by Equation 4 states that each vehicle will return to the same base station if idle after hand over of patient to the hospital (not assigned to another call location);

The fourth constraint given by Equation 5 states that vehicle dispatched to serve a patient can never go to hospital or to base station without visiting the patient;

The fifth constraint given by Equations 6 and 7 states that public vehicle is permitted to reroute if there is significant improvement in total travel time;


The sixth constraint given by Equations 8 and 9 states that public vehicle servicing critical patient and non-ambulatory vehicles will be exempted from rerouting;


Pseudocode for vehicle deployment and routing strategy
1. Prepare the data
Read the historical data
Convert string data to numerical using ranking method
Prepare and run Model
2. Place taken as class tag for classification
3. Divide the data into Training and Testing set
4. Pass the data through RF
5. Perform predictive analysis on the output from 4
6. Calculate accuracy
Get the possible locations from where the ambulance can be deployed
7. I = Take location of the new request
8. Pass I to 5 and get V
9. Get nearest vehicle from V
if V=={Vpu || Vpr || VNA ||  ||
||  }
}

if V(TSv)< T
select the vehicle
direct selected vehicle to location
update v
Allocate hospital
if “choice of hospital” exists:
Check availability at target hospital
if True:
dispatch to target location
else:
evaluate “nearest designated hospital” based on complications using OF
if True:
dispatch to target location
else:
find the nearest hospital/ clinic
take the patient for the first aid
take the patient to the available hospital
update vehicle status as “Free” after patient handover
10. Repeat steps 7 to 10 for all the requests.
Results
Experimental Setup
All the experiments are done on a Dell Intel(R) CORE (TM) i5-5200U Processor with 2.20 GHz and 8 GB RAM and a 64-bit operating system. Anaconda distribution platform is used for developing the model. In this study, the test data set has been created on the basis of actual data obtained from GVK Emergency Management and Research Institute (GVK EMRI) Uttarakhand, India. The test data set of 7 days’ duration has been extracted from actual call records of Dehradun district of Uttarakhand, India. The characteristics of the extracted test data set reflects similar characteristics of actual data set in terms of demand distribution as per day of week, time of the day, type of emergency, etc.
The collected data set has 45 ambulances in Dehradun district to fulfill the demand from January 2018 to May 2018. Vehicle registration number of each ambulance served as the unique code for respective ambulances. These vehicles are stationed at various locations for effective operations within the district. For this study, only Police Control Room (PCR) vans are used to serve the purpose of non-EMS vehicles due to lack of taxi data. There are 39 police stations and police check posts located within the district. These locations are assumed as base locations for stationing the non-EMS vehicles.
For simulation, the sample size of non- EMS vehicles is assumed to be 78 PCR vans, two vans at each station/post. Private ambulance services working within the district are also identified. To the best of our knowledge, there are 21 private ambulance service providers working within the district. The sample size of private ambulances is assumed to be 63, 3 ambulances at every base location. These ambulances are assumed to be stationed at the addresses given on Google maps by respective service providers to run the simulation.
Geo-location of each vehicle is validated using Google maps before running the simulation. Since, the simulation method is divided into two stages, first is predictive modeling and then routing. The results of predictive analysis can change the final base location of vehicles before using it as input for 2nd stage. The hospital list is extracted from the actual call data obtained from GVK EMRI. There are a total of 115 hospitals and clinics listed in the call records and are used as hospital destinations during simulation. These hospitals are further categorized into different types depending upon the type of treatment provided, e.g., trauma centers, pregnancy related, heart disease specialist, etc. Accuracy, F1-score, total response time, vehicle assignment time, vehicle travel time, etc. is used as model performance indicators.
Performance Evaluation
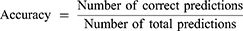
The performance of the RF classifier is compared with 7 other classifiers namely KNN, SVM, CNN, LDA, NB, LR and decision tree algorithm known as CART. Any classification algorithm is evaluated on the basis of its classification accuracy. In general, due to the accuracy paradox which states that for a given level of accuracy, the predictive models may have greater predictive power than models with higher accuracy70 and hence it is best to use another performance matrix as well. To overcome this, F1-score is used as a secondary metric for performance assessment as it estimates the random error.
For the ease of comparison, a subset of 2000 data points is created. Out of which 90% are used for training and rest 10% is used for testing. To reduce the bias from random sampling of training data, the learning models are trained and tested using 10-fold cross validation method. The parameters of different classifiers are listed in Table 5. The results of performance assessment between all the classification algorithms are shown in Figure 2. The results indicate that the RF out-performs all the other techniques. The performance of NB is lowest of all. RF classifier outperforms the LR, LDA, SVM and NB classifier in terms of both accuracy as well as F-1 score. Performance of RF is almost equal to the CNN, CART and KNN classifier in terms of accuracy, but is significantly better in terms of F-1 score.
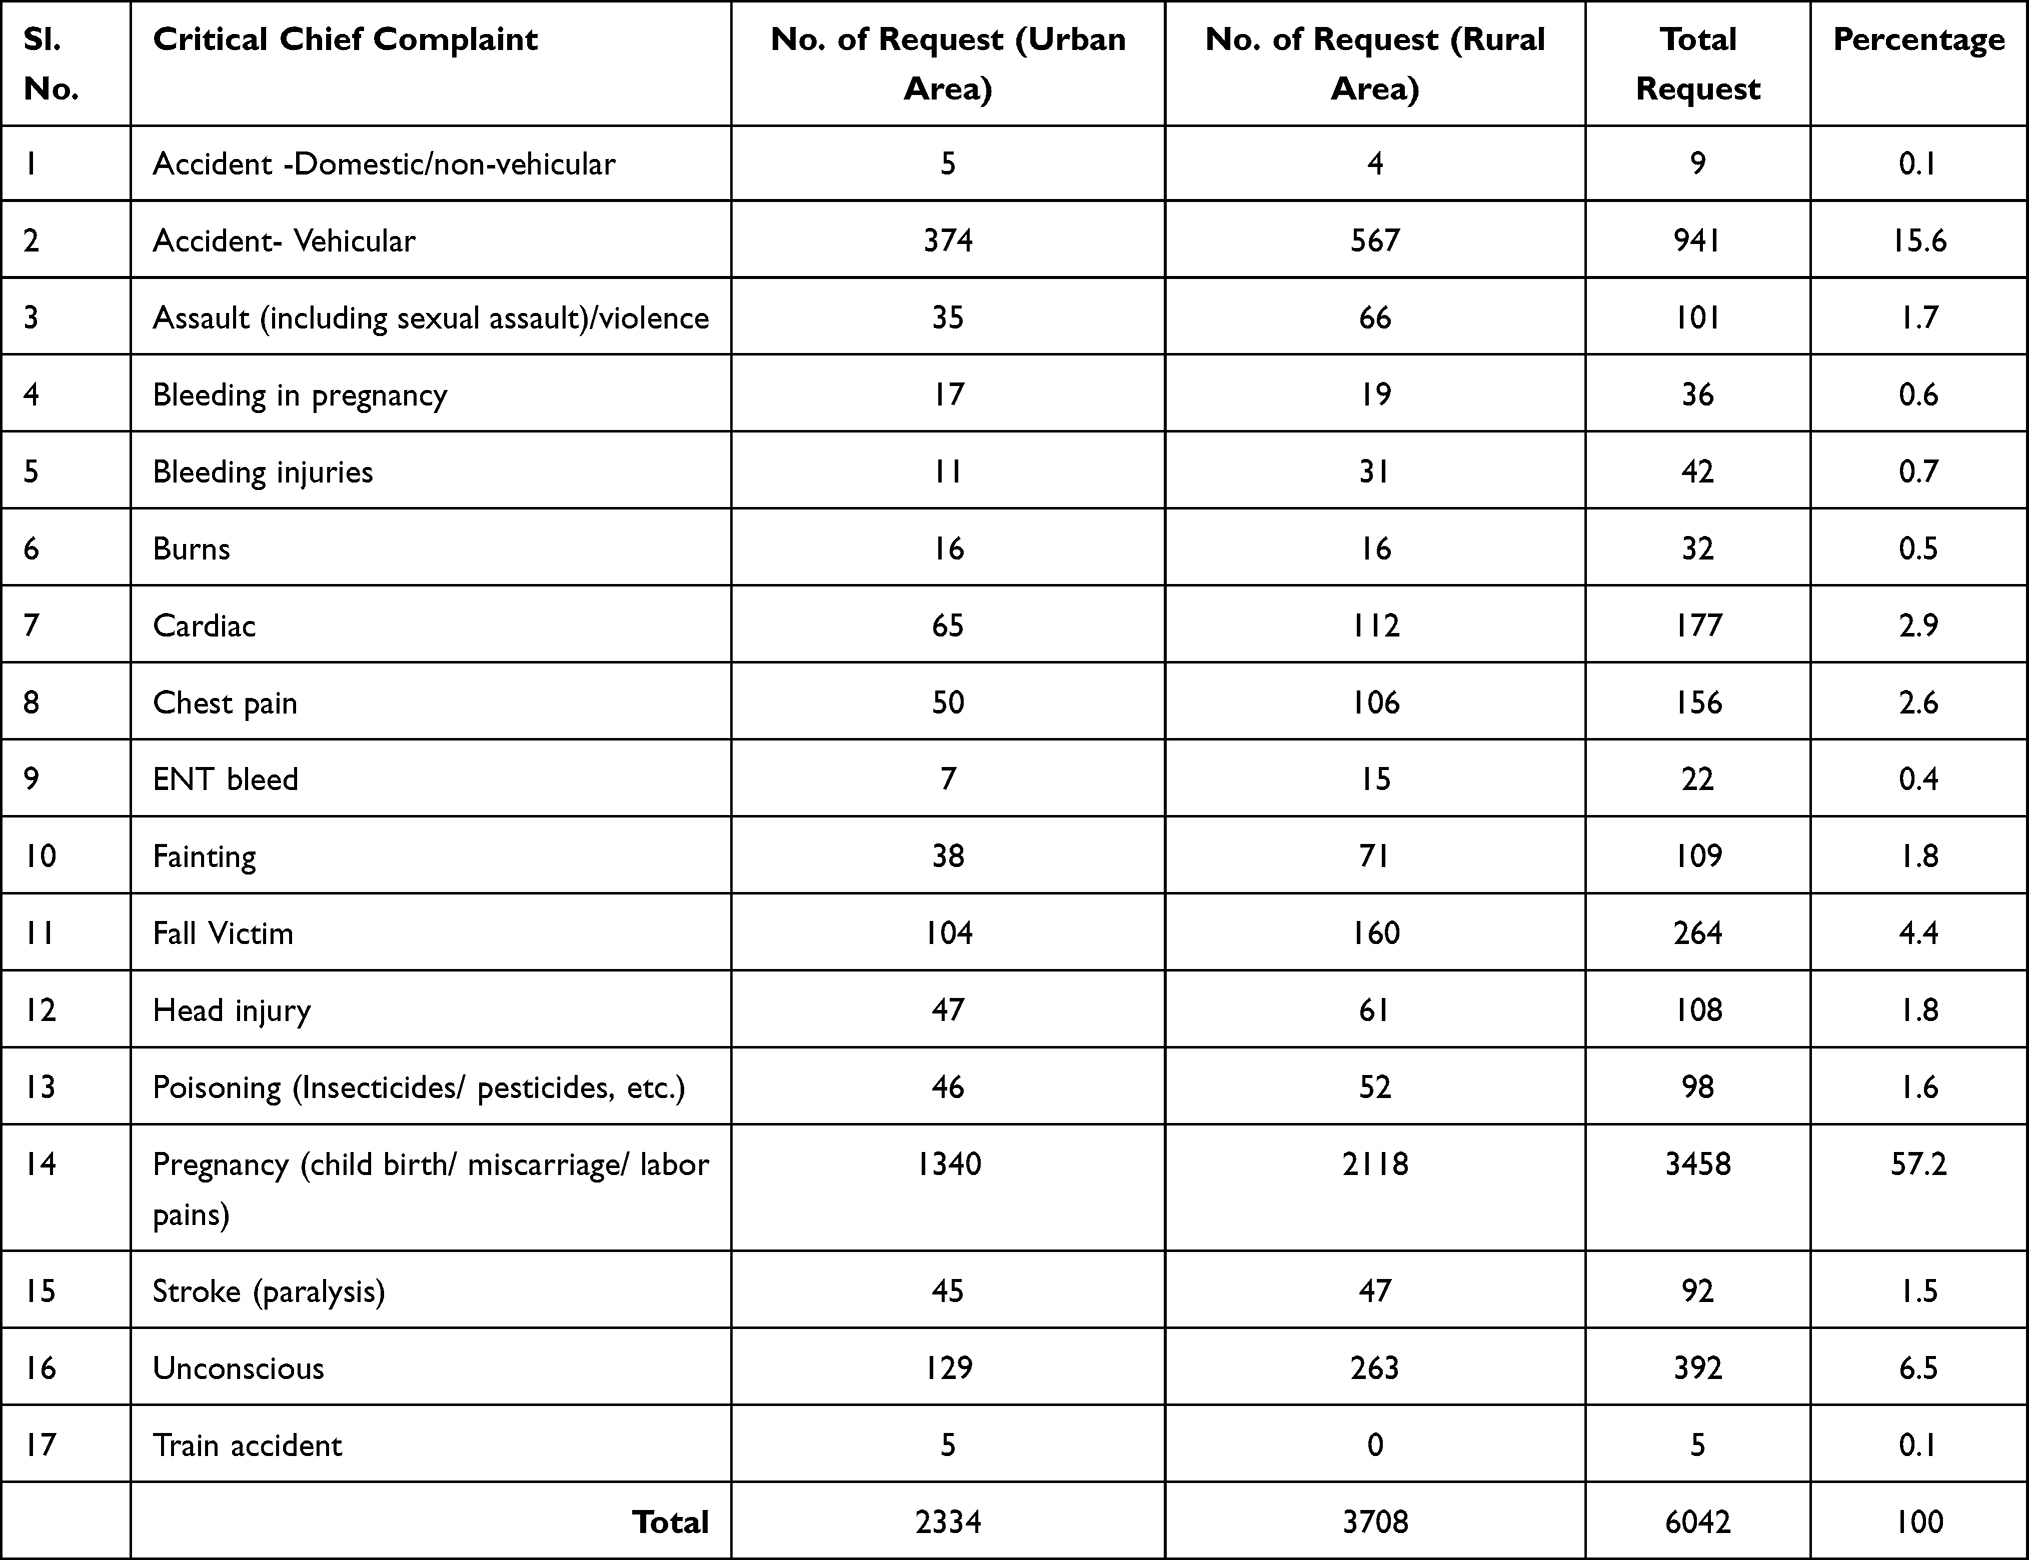 |
Table 3 Total Call Requests Distribution Based on Critical Chief Complaint |
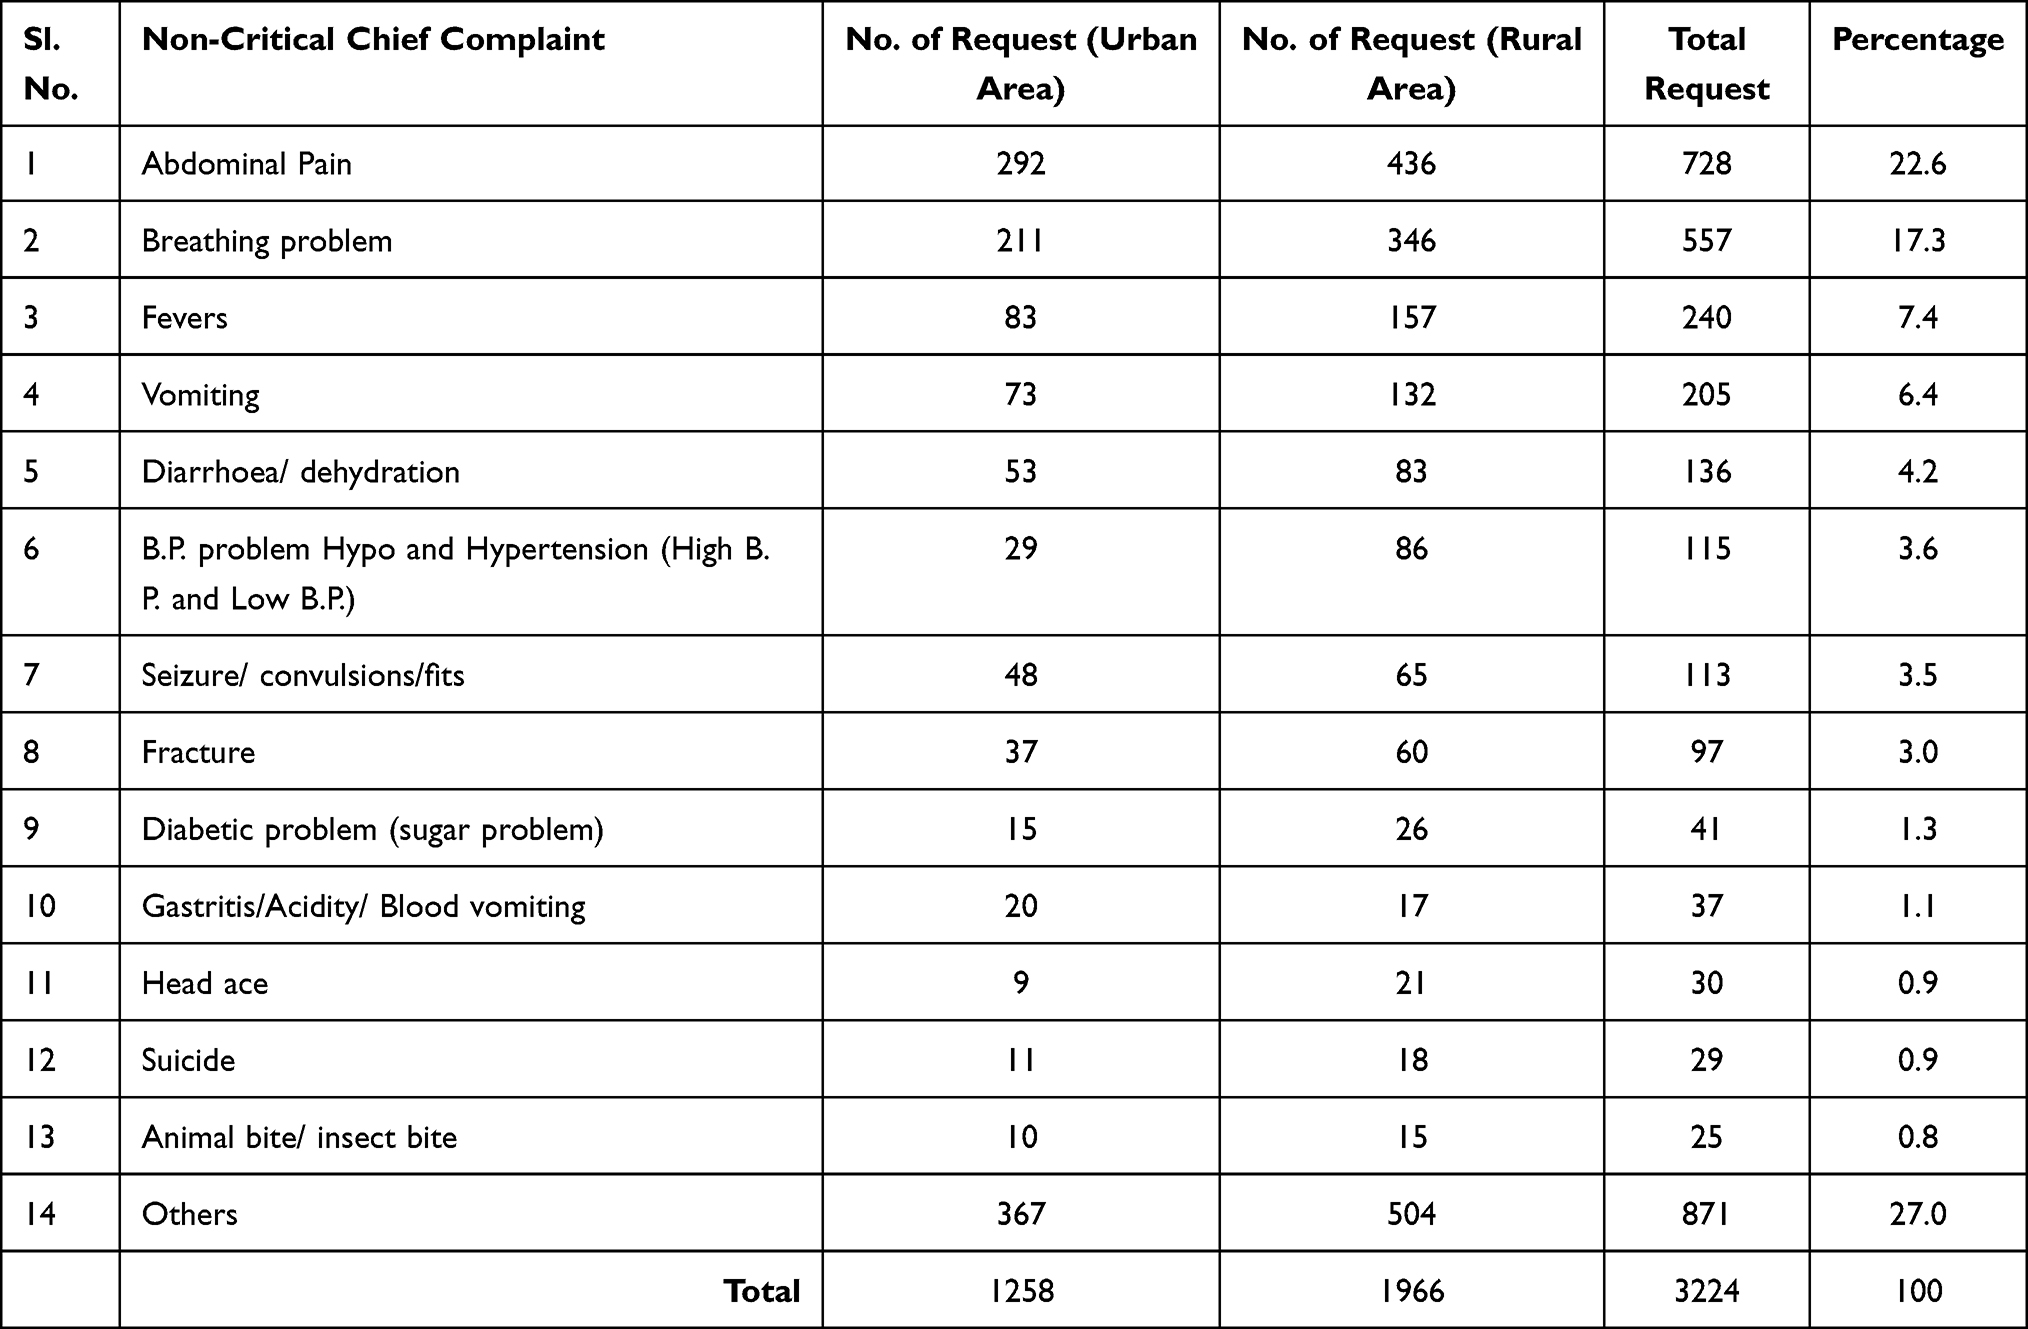 |
Table 4 Total Call Requests Distribution Based on Non-Critical Chief Complaint |
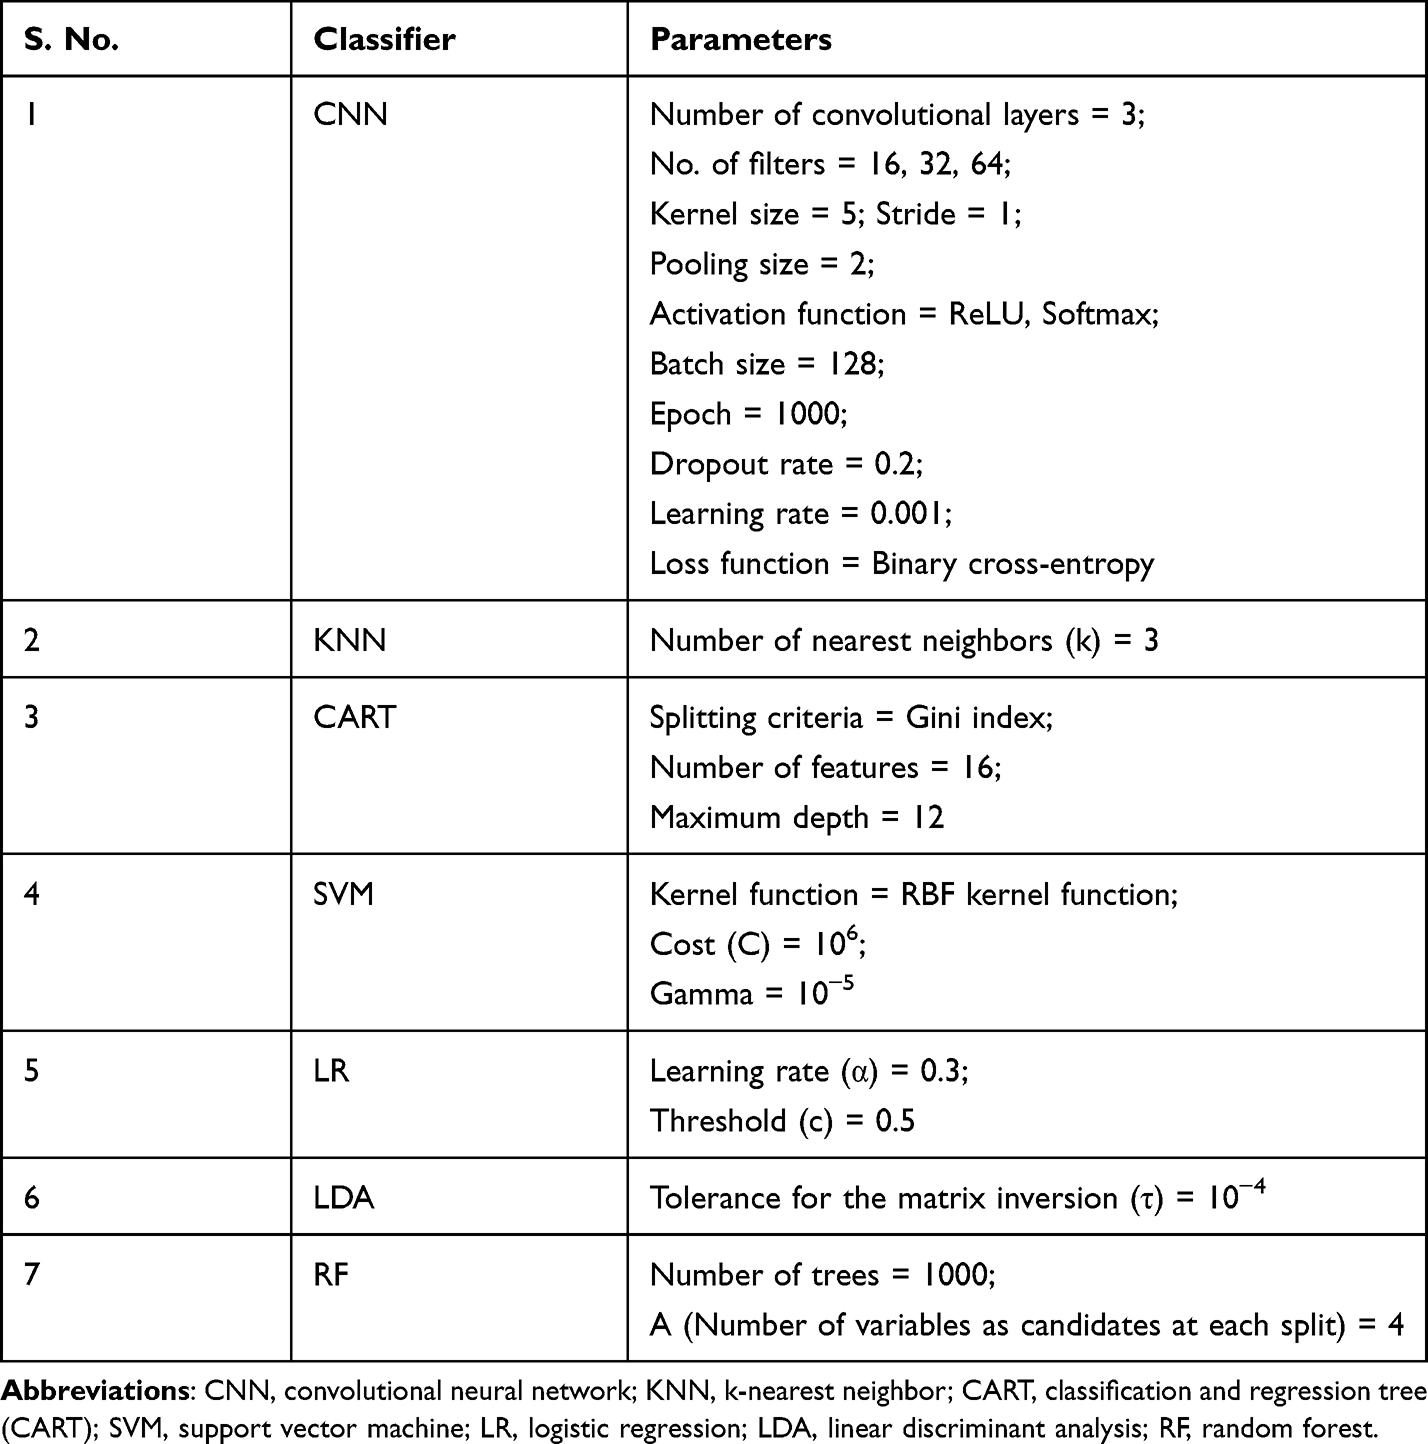 |
Table 5 Parameters of Different Classifier Used in the Study |
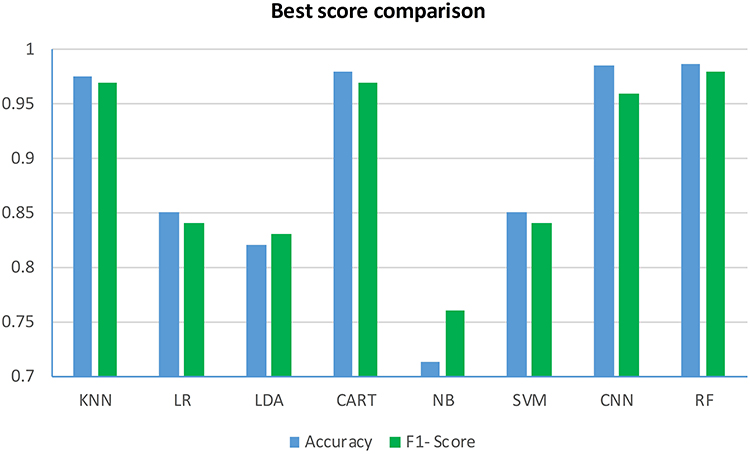 |
Figure 2 Performance comparison of different classification techniques. Abbreviations: CNN, convolutional neural network; KNN, k-nearest neighbor; CART, classification and regression tree (CART); SVM, support vector machine; LR, logistic regression; LDA, linear discriminant analysis; RF, random forest. |
Vehicle Assign Time Estimate to Incoming Request
The vehicle assign time is defined as the time after which a vehicle is assigned to scene location once the call is received. The calls are classified into two categories: rural and urban because there is significant difference in infrastructure of both the areas. Factors such as route network, condition of road, number of hospitals and available vehicles, etc., are different for both the areas. Hence, the vehicle assignment time shall vary accordingly. The comparison of existing approach and our customized random forest vehicle routing (RFVR) is presented in Table 6. The results indicate that in urban area RFVR algorithm takes less than a minute to assign vehicle to 25.5% of the total requests in comparison to 18.5% in the existing method. RFVR algorithm assigns vehicle to 90.2% of the requests within first six minutes of the call while existing approach caters only to 80.2% of the requests. Three percent of the requests takes more than 30 minutes to assign the vehicle in existing approach while in RFVR, all the requests are assigned vehicle within 25 minutes. The statistics in case of rural area vary as 18% of the requests are catered by RFVR in less than a minute while only 13% requests are assigned to vehicles in first minute according to existing data set; RFVR assigns vehicle to 81% of the requests within first 6 minutes as compared to 74.8% in the existing approach.
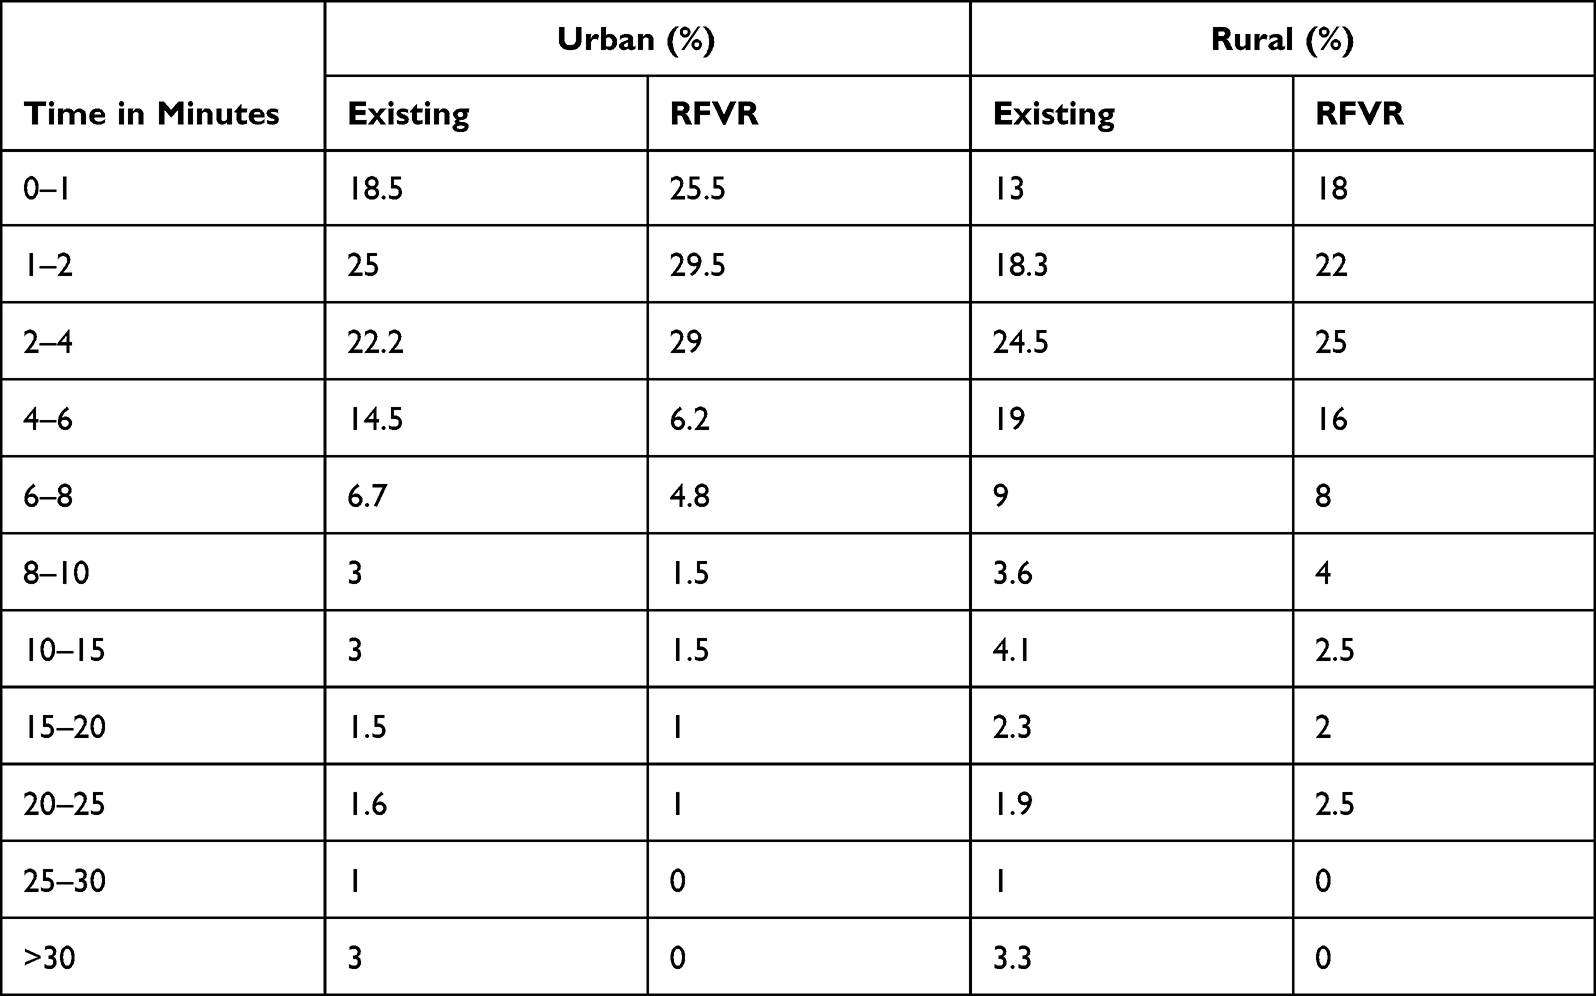 |
Table 6 Proportions of Vehicle Assignment Distribution Within Intervals (in Minutes) |
Vehicle Travel Time Estimation from Base to Scene/Request Location
The location of the call is taken as the origin and the nearest location as identified by the algorithm is taken as the destination. The approximate time to travel is estimated using past data. The comparison of the results is shown in Table 7. The results indicate that vehicle takes less than 10 minutes to reach scene location in 27.3% and 20.8% in urban and rural area whereas the existing method serves 23.3% and 18.4%, respectively. According to simulation data, 89% requests in urban and 78.8% requests in rural areas are within 30-minute distance from the vehicle locations in comparison to 76.6% in urban and 70.8% in rural areas in existing approach. According to historical data, vehicles takes more than 60 minutes to reach scene location in 4.5% and 6.4% of the cases in urban and rural area which improved to 1.5% in urban and 2% in rural respectively in the proposed approach.
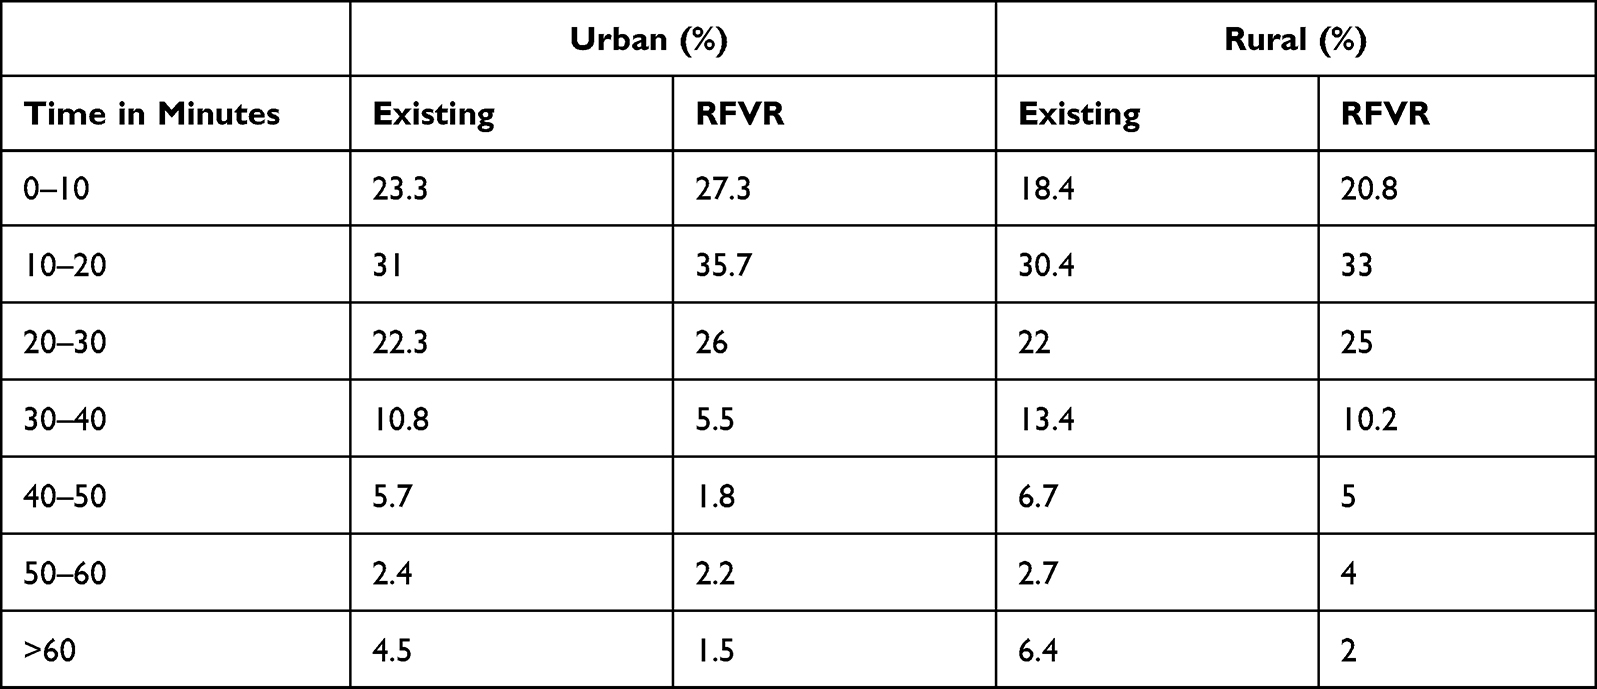 |
Table 7 Proportions of Vehicle Traveled from Base to Scene Within Time Interval |
Total Response Time Estimation to an Emergency
The response time to an emergency is defined as the time difference between the call receipt time and vehicle arrival time at the scene. In other words, response time is the sum of vehicle assignment time and travel time from base to scene. The comparative results of the study are shown in Table 8. The proposed simulation indicates that 19.4% and 12.4% requests in urban and rural area respectively are responded within 10 minutes of the call receipt as compared to the existing which accounts for 15.6% in urban and 10.6% in rural areas. The results of the algorithm show that within the first 30 minutes of the call, 81.5% and 68.4% requests in urban and rural area respectively are served as against the existing approach which serves 66.5% and 59.2% requests in urban and rural area, respectively.
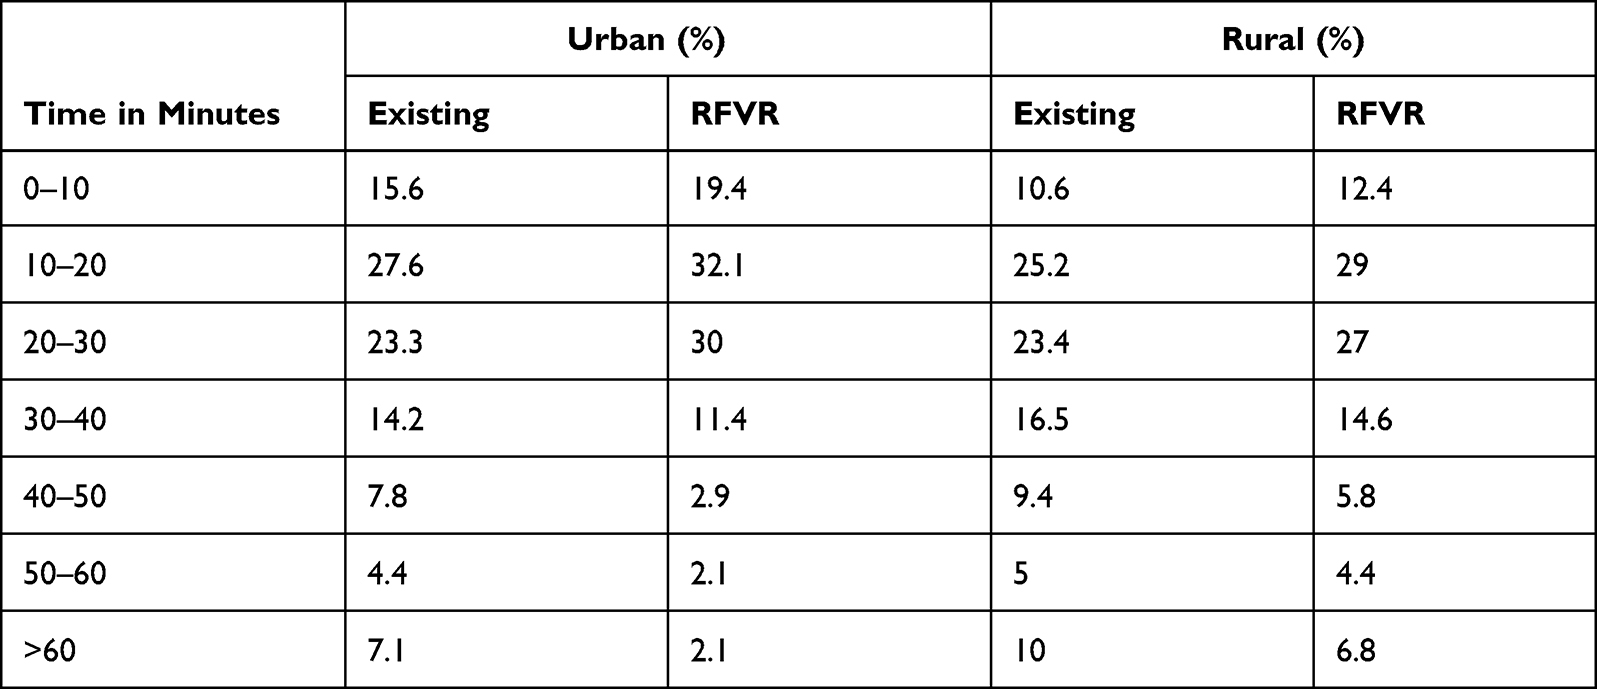 |
Table 8 Proportions of Responses to an Emergency Within Time (in Minutes) |
Table 9 shows the Vehicle assignment time with respect to type of emergency and comparison of average vehicle assignment time to different types of emergency, comparison of simulated and existing average vehicle travel time from base to scene location with respect to type of emergencies, and the average response time with respect to type of emergency in urban and rural area of Dehradun district of Uttarakhand, India.
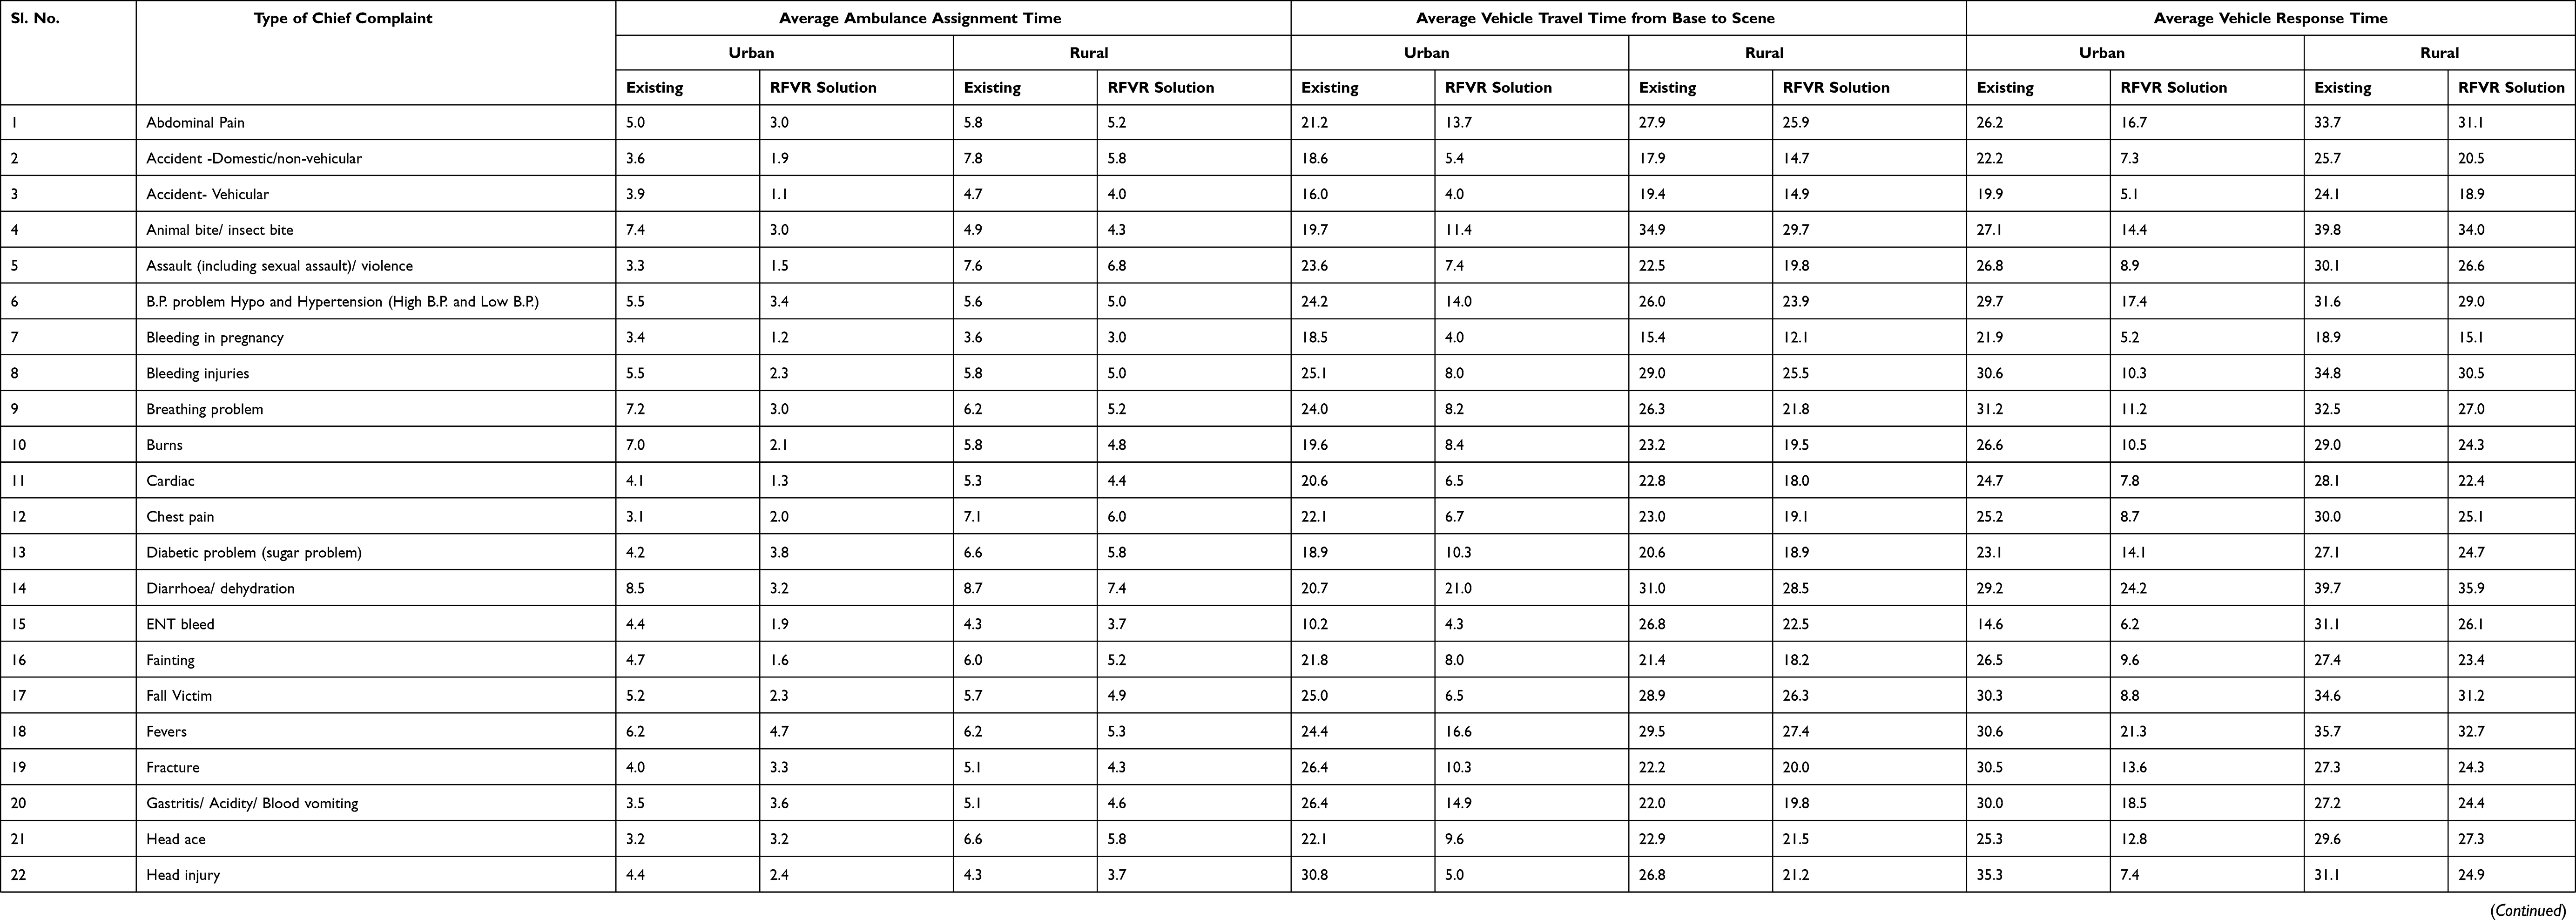 |
Table 9 Average Time Metrics with Respect to Chief Complaint |
Estimated Improvement in Solution
Improvement in EMS services is calculated on the basis of reduction in time associated with the different tasks of emergency services namely: vehicle assignment time, travel time from base to incident and incident to hospital, and total response time. In urban area of Dehradun district, the RFVR simulation model shows an improvement of 42.1%, 54%, 27.9%. and 62% in vehicle assignment time, vehicle travel time from base to scene, travel time from scene to hospital and total response time, respectively. In rural parts of the district, the algorithm shows an improvement of 17.3%, 13.8, 12.4%, and 13.8% in vehicle assignment, travel time from base to scene, travel time from scene to hospital and total response time, respectively. Figures 3 and 4 shows the distribution of improvement with respect to emergency type in urban and rural area respectively.
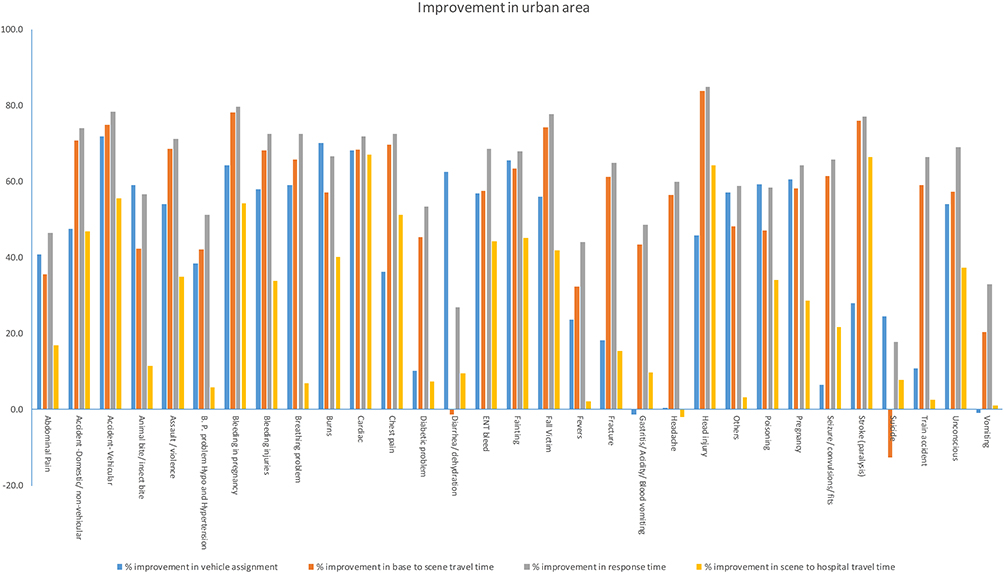 |
Figure 3 Improvement in urban area. |
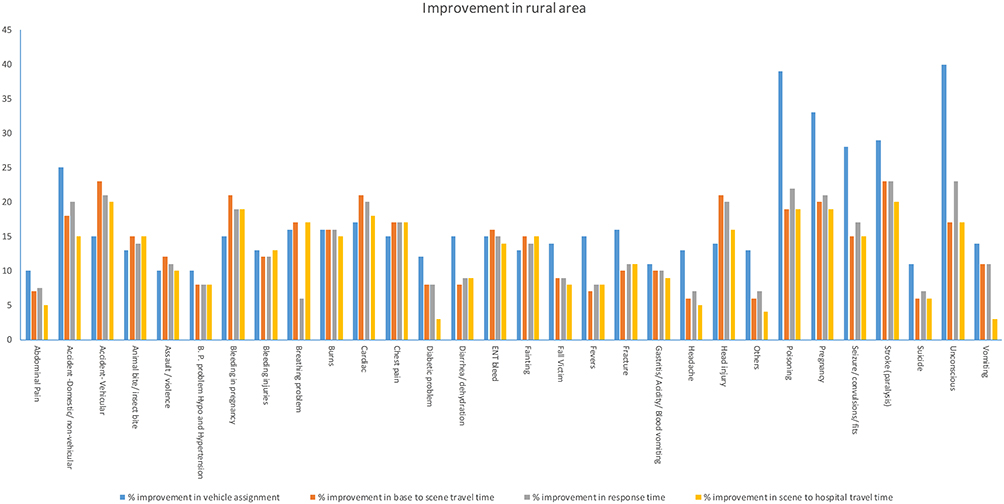 |
Figure 4 Improvement in rural area. |
Proportion Utilization of Integrated System Capacity
The capacity of the simulated system is defined as the total number of vehicles (in-house and outsourced), the total number of hospitals in Dehradun district including polyclinics. The results are reported in terms of proportions of requests served by GVK EMRI (108) and other alternative options. The results of simulation indicate that 76% of the requests are served using 108 emergency vehicles; 19% are addressed using 112 or police cars (112 is a new centralized emergency service launched in India for multiple request types), and; the rest 5% are addressed using other emergency providers such as private ambulances. Hospital assignment ie selection of hospital is distributed as follows: 65% of the patient are transferred to designated hospitals which are listed in the 108 system; 15% are transported to patient’s choice; 11% are sent to nearest hospital; and the rest 9% are taken to polyclinics.
Discussion and Implications
In both urban and rural areas of Uttarakhand State, India, the results obtained using the proposed method demonstrate potential improvements in all the considered metrics: average ambulance assignment time, average vehicle travel time from base to scene, and average vehicle response time. However, as compared to rural regions, the rate of improvement in urban areas is substantially higher. This might be owing to the scarcity of both public and private ambulatory vehicles. Furthermore, the number of resources available to outsource non-ambulatory vehicles is restricted in rural areas. In general, rural regions have lower population density and are more dispersed than urban areas, making it inefficient to deploy large amounts of resources to serve such a dispersed population. Additionally, in rural regions, there are few hospitals with minimal resources such staff, equipment’s, ventilators, etc. The mountainous landscape of Uttarakhand’s Dehradun area contributes to the increase in travel time as well. The narrow road or single lane road condition is prevalent in rural areas leading to traffic delays.
The findings imply that integration of resources and utilization of historical data into a real-world dynamic system can improve the efficiency and efficacy of a fragmented supply chain system. The proposed approach helps to save time and promote effective utilization of resources. Resource outsourcing in a dynamic environment is not only beneficial in meeting the demand in a timely manner, but can also be beneficial in a life-threatening situation. The applications of the proposed approach have promising future in EMSs of developing countries where funds and system capacities are limited but demand is high.
The promising results obtained from the developed prediction model suggest that utilizing a large data set derived from day-to-day operations is beneficial in gaining meaningful insights into the system and its characteristics in real-world scenarios. By reducing system uncertainties, policymakers and decision-makers will be able to make more informed and long-term decisions. Furthermore, prediction models can also aid in the reduction of human interaction with the system, thereby moving the system closer to semi/complete automation.
Conclusion and Future Work
In this article, the authors have developed a two-echelon vehicle scheduling and routing model for EMSs in Uttarakhand, India. In the first echelon, offline learning model based on an RF algorithm is used for prediction of the following: emergency demand sites, travel time, type of vehicle to be dispatched and selection of hospital. In second stage, the vehicle routing model with partial outsourcing and re-routing of vehicles is used to optimize the routes of emergency vehicles, reduce travel time and improve the overall efficiency of system.
A data set of 9766 points has been used to train and test the model. The performance of the RF classifier is compared with 7 other classifiers namely KNN, SVM, CNN, LDA, NB, LR and decision tree algorithm known as CART. Accuracy and F-1 score is used to draw the comparisons. The results show that the RF classifier outperforms all the other techniques.
To meet the rising demand for emergency services, it is proposed to create a centralized framework by integrating all the available EMS and alternative resources such as non-ambulatory vehicles, private ambulances, etc., instead of increasing the in-house capacity. The results of the simulation show that there is 62% and 13.8% reduction in the total response time in urban area and rural area respectively of Dehradun district of Uttarakhand. Hence, integration of resources can help the EMS to respond to an emergency in a time effective manner without increasing the current in-house capacity. It should be noted that the rate of improvement in urban areas is substantially higher. This might be due to lack of resources and hilly topography, both of which contribute to the increase in total response time.
This study can be applied to different parts of the country with modifications due variation in traffic conditions and norms of EMS. The proposed approach has a promising future in emergency medical care in other LMICs with limited resources and system capacities and high demand. Future studies can be taken up to determine the probability of future emergencies in real-time as well as traffic conditions on road using online learning framework for efficient allocation of vehicles. There is a growing need to explore the use of medical drones in order to supply medicines where accessibility is difficult, provide first aid kit to an accident location, check patient status using video, etc.
Data Sharing Statement
The authors are not permitted to share the obtained data.
Acknowledgments
We would like to show our gratitude to GVK EMERGENCY MEDICAL RESEARCH INSTITUTE, Dehradun, Uttarakhand, India for sharing the data with us.
Author Contributions
All authors made a significant contribution to the work reported, whether that is in the conception, study design, execution, acquisition of data, analysis and interpretation, or in all these areas; took part in drafting, revising or critically reviewing the article; gave final approval of the version to be published; have agreed on the journal to which the article has been submitted; and agree to be accountable for all aspects of the work.
Disclosure
The authors report no conflicts of interest in this work. This research did not receive any specific grant from funding agencies in the public, commercial, or not-for-profit sectors.
References
1. The golden hour and the difference between life and death; 2011. Available from: https://www.kevinmd.com/blog/2011/02/09/golden-hour-difference-life-death.html.
2. Khanna S. Ambulance response optimization. Int J Comput Sci Eng. 2019;7(6):281–286. doi:10.26438/ijcse/v7i6.281286
3. Singh KD. India’s ambulance emergency - India real time – WSJ; 2014. Available from: https://blogs.wsj.com/indiarealtime/2014/10/16/indias-ambulance-emergency/. .
4. Sriram V, Gururaj G, Razzak JA, Naseer R, Hyder AA. Comparative analysis of three prehospital emergency medical services organizations in India and Pakistan. Public Health. 2016;137:169–175. doi:10.1016/j.puhe.2016.02.022
5. Pandey NR. Emergency medicine in Nepal: present practice and direction for future. Int J Emerg Med. 2016;9(1):20. doi:10.1186/s12245-016-0118-3
6. Bhandari D, Yadav NK. Developing an integrated emergency medical services in a low-income country like Nepal: a concept paper. Int J Emerg Med. 2020;13(1):1–5. doi:10.1186/s12245-020-0268-1
7. Usoro A, Aiwonodagbon B, Strong J, Kivlehan S, Akodu BA, Olufadeji A. Perspectives on the current state of Nigeria’s emergency care system among participants of an emergency medicine symposium: a qualitative appraisal. BMJ Open. 2021;11:e043869. doi:10.1136/bmjopen-2020-043869
8. Hoang BH, Mai TH, Dinh TS, Nguyen T, Dang TA, Le VC. Unmet need for emergency medical services in Hanoi, Vietnam. JMA J. 2021;4(3):277–280. doi:10.31662/jmaj.2020-0110
9. Joshipura M, Hyder AA, Rehmani R. Emergency care in South Asia: challenges and opportunities. J Coll Physicians Surg Pak. 2004;14(12):731–735.
10. Reynolds TA, Mfinanga JA, Sawe HR, Runyon MS, Mwafongo V. Emergency care capacity in Africa: a clinical and educational initiative in Tanzania. J Public Health Policy. 2012;33(S1):S126–S137. doi:10.1057/jphp.2012.41
11. Sheu J-B, Pan C. A method for designing centralized emergency supply network to respond to large-scale natural disasters. Transp Res Part B Methodol. 2014;67:284–305. doi:10.1016/j.trb.2014.05.011
12. Azizi MR, Atlasi R, Ziapour A, Abbas J, Naemi R. Innovative human resource management strategies during the COVID-19 pandemic: a systematic narrative review approach. Heliyon. 2021;7(6):e07233. doi:10.1016/j.heliyon.2021.e07233
13. Abbas J. Crisis management, transnational healthcare challenges and opportunities: the intersection of COVID-19 pandemic and global mental health. Res Glob. 2021;3. doi:10.1016/j.resglo.2021.100037
14. Maqsood A, Abbas J, Rehman G, Mubeen R. The paradigm shift for educational system continuance in the advent of COVID-19 pandemic: mental health challenges and reflections. Curr Res Behav Sci. 2021;2:100011. doi:10.1016/j.crbeha.2020.100011
15. Shuja KH, Shahidullah aqeel S, Aqeel M, Khan EA, Abbas J. Letter to highlight the effects of isolation on elderly during COVID‐19 outbreak. Int J Geriatr Psychiatry. 2020;35:1477–1478. doi:10.1002/gps.5423
16. Demetriades D, Kimbrell B, Salim A, et al. Trauma deaths in a mature urban trauma system: is “Trimodal” distribution a valid concept? J Am Coll Surg. 2005;201(3):343–348. doi:10.1016/j.jamcollsurg.2005.05.003
17. Corrado MM, Shi J, Wheeler KK, et al. Emergency medical services (EMS) versus non-EMS transport among injured children in the United States. Am J Emerg Med. 2017;35(3):475–478. doi:10.1016/j.ajem.2016.11.059
18. Cornwell EE. Emergency Medical Services (EMS) vs non-EMS transport of critically injured patients. Arch Surg. 2000;135(3):315. doi:10.1001/archsurg.135.3.315
19. Zografos KG, Androutsopoulos KN, Vasilakis GM. A real-time decision support system for roadway network incident response logistics. Transp Res Part C Emerg Technol. 2002;10(1):1–18. doi:10.1016/S0968-090X(00)00043-7
20. Fitzsimmons JA, Srikar BN. Emergency ambulance location using the contiguous zone search routine. J Oper Manag. 1982;2(4):225–237. doi:10.1016/0272-6963(82)90011-0
21. McCormack R, Coates G. A simulation model to enable the optimization of ambulance fleet allocation and base station location for increased patient survival. Eur J Oper Res. 2015;247(1):294–309. doi:10.1016/j.ejor.2015.05.040
22. Tlili T, Harzi M, Krichen S. Swarm-based approach for solving the ambulance routing problem. In: Procedia Computer Science. Vol. 112. Elsevier;2017:350–357. doi:10.1016/J.PROCS.2017.08.012
23. Zhou Y, Liu J, Zhang Y, Gan X. A multi-objective evolutionary algorithm for multi-period dynamic emergency resource scheduling problems. Transp Res Part E Logist Transp Rev. 2017;99:77–95. doi:10.1016/j.tre.2016.12.011
24. Delir Haghighi P, Burstein F, Zaslavsky A, Arbon P. Development and evaluation of ontology for intelligent decision support in medical emergency management for mass gatherings. Decis Support Syst. 2013;54(2):1192–1204. doi:10.1016/j.dss.2012.11.013
25. Cabitza F, Rasoini R, Gensini GF. Unintended consequences of machine learning in medicine. JAMA. 2017;318(6):517. doi:10.1001/jama.2017.7797
26. Beam AL, Kohane IS. Big data and machine learning in health care. JAMA. 2018;319(13):1317. doi:10.1001/jama.2017.18391
27. Ji S, Zheng Y, Wang Z, Li T. A deep reinforcement learning-enabled dynamic redeployment system for mobile ambulances. Proc ACM Interact Mob Wearable Ubiquitous Technol. 2019;3(1):1–20. doi:10.1145/3314402
28. Zhou Z, Matteson DS, Woodard DB, Henderson SG, Micheas AC. A Spatio-temporal point process model for ambulance demand. J Am Stat Assoc. 2015;110(509):6–15. doi:10.1080/01621459.2014.941466
29. Grekousis G, Liu Y. Where will the next emergency event occur? Predicting ambulance demand in emergency medical services using artificial intelligence. Comput Environ Urban Syst. 2019;76:110–122. doi:10.1016/j.compenvurbsys.2019.04.006
30. Zhou Z. Predicting ambulance demand: challenges and methods. ICML Work Data4Good Mach Learn Soc Good Appl. 2016:11–15. Available from: http://arxiv.org/abs/1606.05363.
31. Liu Y, Wang Y, Yang X, Zhang L. Short-term travel time prediction by deep learning: a comparison of different LSTM-DNN models.
32. Vlad RC, Morel C, Morel JY, Vlad S. A learning real-time routing system for emergency vehicles.
33. Siripanpornchana C, Panichpapiboon S, Chaovalit P. Travel-time prediction with deep learning.
34. Clark S. Traffic prediction using multivariate nonparametric regression. J Transp Eng. 2003;129(2):161–168. doi:10.1061/(ASCE)0733-947X(2003)129
35. Panahi S, Delavar MR. A GIS-based dynamic shortest path determination in emergency vehicles. World Appl Sci J. 2008;3(Supple1):88–94.
36. Manimaran A, Murali S, Praba B, Chandrasekaran VM, Asesh A. Dynamic traffic routing based on feedback mechanisms using RF algorithm. Int J Pure Appl Math. 2017;117(7Special Issue):23–30.
37. Gupte S, Younis M. Vehicular networking for intelligent and autonomous traffic management.
38. Zhang Z, He Q, Gou J, Li X. Performance measure for reliable travel time of emergency vehicles. Transp Res Part C Emerg Technol. 2016;65(2016):97–110. doi:10.1016/j.trc.2016.01.015
39. Boutilier JJ, Chan TCY. Ambulance emergency response optimization in developing countries. Oper Res. 2018;68:1315–1334.
40. Blomberg SN, Folke F, Ersbøll AK, et al. Machine learning as a supportive tool to recognize cardiac arrest in emergency calls. Resuscitation. 2019;138:322–329. doi:10.1016/j.resuscitation.2019.01.015
41. Kovalchuk SV, Krotov E, Smirnov PA, Nasonov DA, Yakovlev AN. Distributed data-driven platform for urgent decision making in cardiological ambulance control. Futur Gener Comput Syst. 2018;79:144–154. doi:10.1016/j.future.2016.09.017
42. Chi C-L, Street WN, Ward MM. Building a hospital referral expert system with a prediction and optimization-based decision support system algorithm. J Biomed Inform. 2008;41(2):371–386. doi:10.1016/j.jbi.2007.10.002
43. Graham B, Bond R, Quinn M, Mulvenna M. Using data mining to predict hospital admissions from the emergency department. IEEE Access. 2018;6:10458–10469. doi:10.1109/ACCESS.2018.2808843
44. Zagorecki AT, Johnson DEA, Ristvej J. Data mining and machine learning in the context of disaster and crisis management. Int J Emerg Manag. 2013;9(4):351. doi:10.1504/IJEM.2013.059879
45. Su Z, McDonnell D, Wen J, et al. Mental health consequences of COVID-19 media coverage: the need for effective crisis communication practices. Global Health. 2021;17(4):1–8. doi:10.1186/s12992-020-00654-4
46. Su Z, Wen J, Abbas J, et al. A race for a better understanding of COVID-19 vaccine non-adopters. Brain, Behav Immun - Heal. 2020;9:100159. doi:10.1016/j.bbih.2020.100159
47. Jiajia L, Wang D, Abbas J, Mubeen R. Tourists’ health risk threats amid COVID-19 era: role of technology innovation, Transformation, and recovery implications for sustainable tourism. Front Psychol. 2021;12:769175. doi:10.3389/fpsyg.2021.769175
48. NeJhaddadgar N, Ziapour A, Zakkipour G, Abbas J, Abolfathi M, Shabani M. Effectiveness of telephone-based screening and triage during COVID-19 outbreak in the promoted primary healthcare system: a case study in Ardabil province, Iran. J Public Health (Bangkok). 2020. doi:10.1007/s10389-020-01407-8
49. Aqeel M, Abbas J, Shuja KH, et al. The influence of illness perception, anxiety and depression disorders on students mental health during COVID-19 outbreak in Pakistan: a Web-based cross-sectional survey. Int J Hum Rights Healthc. 2021;ahead-of-print. doi:10.1108/IJHRH-10-2020-0095
50. Sakr S, Elshawi R, Ahmed AM, et al. Comparison of machine learning techniques to predict all-cause mortality using fitness data: the Henry Ford exercIse testing (FIT) project. BMC Med Inform Decis Mak. 2017;17(1):174. doi:10.1186/s12911-017-0566-6
51. Kumari K, Singh JP, Dwivedi YK, Rana NP. Towards Cyberbullying-free social media in smart cities: a unified multi-modal approach. Soft Comput. 2020;24(15):11059–11070. doi:10.1007/s00500-019-04550-x
52. Han T, Jiang D, Zhao Q, Wang L, Yin K. Comparison of random forest, artificial neural networks and support vector machine for intelligent diagnosis of rotating machinery. Trans Inst Meas Control. 2018;40(8):2681–2693. doi:10.1177/0142331217708242
53. Zheng S, Liu Y, Ouyang Z. A machine learning-based tourist path prediction.
54. Liu H, Zhou M, Liu Q. An embedded feature selection method for imbalanced data classification. IEEE/CAA J Autom Sin. 2019;6(3):703–715. doi:10.1109/JAS.2019.1911447
55. Ohata EF, Bezerra GM, Chagas Das JVS, et al. Automatic detection of COVID-19 infection using chest X-ray images through transfer learning. IEEE/CAA J Autom Sin. 2021;8(1):239–248. doi:10.1109/JAS.2020.1003393
56. Lu XS, Zhou M, Qi L, Liu H. Clustering-algorithm-based rare-event evolution analysis via social media data. IEEE Trans Comput Soc Syst. 2019;6(2):301–310. doi:10.1109/TCSS.2019.2898774
57. Zhang H, Li Y, Lv Z, Sangaiah AK, Huang T. A real-time and ubiquitous network attack detection based on deep belief network and support vector machine. IEEE/CAA J Autom Sin. 2020;7(3):790–799. doi:10.1109/JAS.2020.1003099
58. Sheu J-B, Chou YH, Chen A. Stochastic modeling and real-time prediction of incident effects on surface street traffic congestion. Appl Math Model. 2004;28(5):445–468. doi:10.1016/j.apm.2003.10.004
59. An S, Cui N, Bai Y, Xie W, Chen M, Ouyang Y. Reliable emergency service facility location under facility disruption, en-route congestion and in-facility queuing. Transp Res Part E Logist Transp Rev. 2015;82:199–216. doi:10.1016/j.tre.2015.07.006
60. Zhang Z, Qin H, Wang K, He H, Liu T. Manpower allocation and vehicle routing problem in non-emergency ambulance transfer service. Transp Res Part E Logist Transp Rev. 2017;106:45–59. doi:10.1016/j.tre.2017.08.002
61. Liu Y, Li Z, Liu J, Patel H. A double standard model for allocating limited emergency medical service vehicle resources ensuring service reliability. Transp Res Part C Emerg Technol. 2016;69:120–133. doi:10.1016/j.trc.2016.05.023
62. Shishebori D, Yousefi Babadi A. Robust and reliable medical services network design under uncertain environment and system disruptions. Transp Res Part E Logist Transp Rev. 2015;77:268–288. doi:10.1016/j.tre.2015.02.014
63. Andersson T, Värbrand P. Decision support tools for ambulance dispatch and relocation. J Oper Res Soc. 2007;58(2):195–201. doi:10.1057/palgrave.jors.2602174
64. Lu -C-C, Sheu J-B. Robust vertex p-center model for locating urgent relief distribution centers. Comput Oper Res. 2013;40(8):2128–2137. doi:10.1016/j.cor.2013.02.019
65. Rathore N, Jain PK, Parida M. A ROUTING MODEL FOR EMERGENCY VEHICLES USING THE REAL TIME TRAFFIC DATA.
66. Sreekanth VK, Roy RB. Modeling demand patterns of emergency medical services in Rajasthan. Int Conf Syst Med Biol. 2017;87–90. doi:10.1109/ICSMB.2016.7915094
67. Huang H, Jiang M, Ding Z, Zhou M. Forecasting emergency calls with a poisson neural network-based assemble model. IEEE Access. 2019;7:18061–18069. doi:10.1109/ACCESS.2019.2896887
68. McCarthy ML, Zeger SL, Ding R, Aronsky D, Hoot NR, Kelen GD. The challenge of predicting demand for emergency department services. Acad Emerg Med. 2008;15(4):337–346. doi:10.1111/j.1553-2712.2008.00083.x
69. Matteson DS, McLean MW, Woodard DB, Henderson SG. Forecasting emergency medical service call arrival rates. Ann Appl Stat. 2011;5(2B):1379–1406. doi:10.1214/10-AOAS442
70. Afonja T. Accuracy paradox - towards data science; 2018. Available from: https://towardsdatascience.com/accuracy-paradox-897a69e2dd9b.
 © 2022 The Author(s). This work is published and licensed by Dove Medical Press Limited. The
full terms of this license are available at https://www.dovepress.com/terms
and incorporate the Creative Commons Attribution
- Non Commercial (unported, 3.0) License.
By accessing the work you hereby accept the Terms. Non-commercial uses of the work are permitted
without any further permission from Dove Medical Press Limited, provided the work is properly
attributed. For permission for commercial use of this work, please see paragraphs 4.2 and 5 of our Terms.
© 2022 The Author(s). This work is published and licensed by Dove Medical Press Limited. The
full terms of this license are available at https://www.dovepress.com/terms
and incorporate the Creative Commons Attribution
- Non Commercial (unported, 3.0) License.
By accessing the work you hereby accept the Terms. Non-commercial uses of the work are permitted
without any further permission from Dove Medical Press Limited, provided the work is properly
attributed. For permission for commercial use of this work, please see paragraphs 4.2 and 5 of our Terms.