Back to Journals » Neuropsychiatric Disease and Treatment » Volume 18
A Study of Spontaneous Brain Activity on Resting-State Functional Magnetic Resonance Imaging in Adults with MRI-Negative Temporal Lobe Epilepsy
Authors Yang F, Jia W, Kukun H ![]() , Ding S, Zhang H, Wang Y
, Ding S, Zhang H, Wang Y
Received 12 March 2022
Accepted for publication 18 May 2022
Published 2 June 2022 Volume 2022:18 Pages 1107—1116
DOI https://doi.org/10.2147/NDT.S366189
Checked for plagiarism Yes
Review by Single anonymous peer review
Peer reviewer comments 2
Editor who approved publication: Dr Yu-Ping Ning
Fan Yang, Wenxiao Jia, Hanjiaerbieke Kukun, Shuang Ding, Haotian Zhang, Yunling Wang
Department of Radiology, The First Affiliated Hospital of Xinjiang Medical University, Ürümqi, Xinjiang, People’s Republic of China
Correspondence: Yunling Wang, Department of Radiology, The First Affiliated Hospital of Xinjiang Medical University, Ürümqi, Xinjiang, People’s Republic of China, Tel +86 139 9990 9377, Email [email protected]
Purpose: Patients with magnetic resonance imaging (MRI)-negative temporal lobe epilepsy (TLE-N) represent an important subgroup of temporal lobe epilepsy (TLE). Here, we aimed to combine three voxel-based local brain area analysis methods of resting-state functional MRI (rs-fMRI), to examine the TLE-N patients’ resting brain function based on neural synchronization and intensity of local brain areas.
Methods: The study included 47 patients with TLE, including 28 cases of drug-controlled TLE (cTLE-N) and 19 cases of drug-resistant TLE-N (rTLE-N), as well as 30 participants in the healthy control (HC) group. To comprehensively assess the altered brain function associated with TLE-N patients, we analyzed three data-driven rs-fMRI algorithms for amplitude of low-frequency fluctuations (ALFF), fractional ALFF (fALFF) and regional homogeneity (ReHo).
Results: Compared to the HC group, the distribution of abnormal functional brain areas in cTLE-N patients was dominated by occipital lobe activation, as measured by increased fALFF values in the superior occipital gyrus (SOG) and increased ReHo values in the lingual gyrus (Lin), fusiform gyrus, and middle occipital gyrus. Patients with rTLE-N exhibited a diffuse distribution of abnormal functional brain areas, showing increased fALFF values in the SOG, Lin, superior temporal gyrus, and postcentral gyrus, and decreased fALFF values in the inferior frontal gyrus orbital, parahippocampal gyrus, and superior frontal gyrus orbital. The ReHo values were reduced in the orbital region of the middle frontal gyrus, the precuneus, and the parietal inferior angular gyrus; while ReHo values were elevated values in several frontal, temporal, occipital, and subcortical brain areas.
Conclusion: Patients with rTLE-N have local brain activity changes in the prefrontal limbic system and default model network dysfunction, while cTLE-N patients have local brain activity changes in the visual functional areas. Different epilepsy networks exist between cTLE-N and rTLE-N.
Keywords: temporal lobe epilepsy, resting-state fMRI, ALFF, fALFF, ReHo
Introduction
Temporal lobe epilepsy (TLE) is the most prevalent type of focal epilepsy in adults, and it has a high tendency for treatment resistance.1 The advances of magnetic resonance imaging (MRI) technology have brought significant diagnostic value for TLE, however, conventional MRI sequences are not sensitive to the identification of certain TLE, and around one-third of patients with TLE have negative MRI findings, a condition known as MRI-negative temporal lobe epilepsy (TLE-N).2 Patients with TLE-N have a later age of seizure, less impaired cognitive function, and greater pharmacological control effectiveness compared to those with TLE with hippocampal sclerosis (TLE-HS).3–6 TLE is highly drug resistant and is a potential candidate for epilepsy surgery. Patients with drug-resistant TLE-N (rTLE-N) can now be treated surgically given the advances of localization techniques, although invasive approaches are typically necessary to detect the epileptogenic foci before surgery. Furthermore, patients with TLE-N have a significantly worse postoperative seizure-free rate compared to those with MRI-positive TLE. Furthermore, the postoperative seizure-free rate in patients with TLE-N is much lower than that in patients with MRI-positive TLE. A meta-analysis found that patients with TLE-N were 2.7-fold less likely to be seizure-free following surgery than those with MRI-positive TLE. This may be due to the difficulties in finding epileptogenic foci, as well as the worse prognosis in patients with TLE-N, resulting in such patients often being excluded from surgical alternatives.7–9 The processes behind medication resistance in TLE-N remain unknown, and there is an urgent need to understand the neurological mechanisms of disease to guide effective and specialized treatment strategies.
Recent advances in data-driven analysis have resulted in the widespread adoption of resting-state functional MRI (rs-fMRI) methods. The rs-fMRI can be used to investigate spontaneous neural activity in the resting brain and can quantify the interactions between neurons in the basal brain. Epilepsy is characterized by abnormal spontaneous brain activity in the resting state.10 The rs-fMRI has been used in research on numerous types of epilepsy, and one rs-fMRI study revealed that TLE-N and TLE-HS may involve different brain networks.5
The amplitude low-frequency fluctuations (ALFF) and regional homogeneity (ReHo) are reliable algorithms for quantifying the neural activity in rs-fMRI. The ALFF represents the strength of regional neuronal spontaneous activity by measuring the amplitude of BOLD signal oscillations induced by spontaneous neural activity in local brain areas within a specified frequency range of 0.01–0.08 Hz.11 Zhang first used the ALFF parameter in TLE and found that the areas of increased ALFF were distributed in the medial temporal lobe and some other cortical and subcortical structures that comprise the previously proposed medial TLE network, whereas the areas of decreased ALFF were mainly located in the default network area.12 The fractional ALFF (fALFF) is an improved ALFF method that can effectively inhibit non-specific signal components, directly reflect the signal dependent on the blood oxygen level and metabolic changes in brain tissue in the resting state, and improve the sensitivity and specificity of detecting local spontaneous brain activity.11 A study of patients with TLE-HS and TLE-N using fALFF, demonstrated that the fALFF values of the affected amygdala and hippocampus (HIP) were decreased in patients with TLE-HS, the fALFF value of the ipsilateral amygdala was slightly decreased in patients with TLE-N, and the fALFF value of the HIP remained unchanged.5 ReHo is a technique that can be used to determine local functional connectivity based on the temporal correlation between voxels and neighboring voxels, which may be used to quantify activity coordination among voxels in a region.13 According to Zhu et al, patients with TLE-N have lower ReHo values in the precuneus (PrC) than normal controls.14 According to one study, ReHo may complement ALFF in identifying spontaneous activity across the brain and is more effective than ALFF in detecting localized abnormalities.15 As a result, combining ALFF with ReHo may offer additional information regarding spontaneous brain activity in patients with epilepsy.
Three voxel-based rs-fMRI data processing methods of local brain areas ALFF, fALFF, and ReHo were employed in this work to evaluate the spontaneous brain activity in patients with rTLE-N and to investigate the processes of neurological impairment in the epileptic brain. We hypothesize that resting state data in certain brain areas are significantly different between patients with drug-controlled TLE (cTLE-N) and patients with rTLE-N compared to controls. These modifications will aid in our understanding of the underlying neurophysiology.
Materials and Methods
Participants
Forty-seven patients with TLE attending the Department of Neurology of the First Affiliated Hospital of Xinjiang Medical University from February 2020 to November 2021 were selected. Among them, 28 cases were cTLE-N and 19 cases were rTLE-N. The inclusion criteria were as follows: (1) all patients with epilepsy who met the diagnostic criteria of the International League Against Epilepsy (ILAE) as assessed independently by two neurologists;16 (2) drug-controlled epilepsy, defined as having at least three seize-free episodes during the longest pre-intervention interval or 12 months, whichever was longer, in patients receiving the current AED regimen; drug-refractory epilepsy, defined as persistent seizures in the presence of two or more suitable antiepileptic medicines, depending on the patient’s condition and under the supervision of a neurologist;17 (3) all patients were monitored by video EEG during the seizure-onset period, and the source was confirmed as the temporal lobe using pterygoid sinus electrodes; (4) all patients were subjected to 3.0 T high-resolution MRI with oblique coronal views scanned perpendicular to the long axis of the hippocampus, and a comprehensive assessment was performed by two chief radiologists (Wang and Ding) to confirm the absence of potentially epileptogenic structural abnormalities; and (5) no previous neurological or psychiatric illnesses, intracranial occupying lesions, or similar. The exclusion criteria were as follows: (1) EEG suggesting areas of extratemporal epileptiform discharges; (2) conventional MRI suggesting structural changes or other psychiatric disorders; (3) long history of alcohol or substance abuse; and (4) severe cognitive impairment.
Thirty healthy controls (HC) were recruited through the community and physical examination center. The inclusion criteria were as follows: (1) aged 18 to 55 years; (2) normal routine cranial MRI examination, with no history of traumatic brain injury, cerebrovascular disease, occupying brain lesions, or similar; and (3) no family history of neurological disorders. The exclusion criteria were as follows: (1) mental or mood disorders, migraine and other disorders that may affect the network connectivity of brain function; (2) history of chronic medical conditions, such as liver and kidney disease, diabetes, and hypertension; and (3) history of long-term alcohol or drug abuse.
The study subjects were informed of the relevant precautions and signed an informed consent form. The study was approved by the Clinical Trial Ethics Committee of Xinjiang Medical University, and we carried out the protocol in accordance with the Declaration of Helsinki.
Cognitive Assessment
All subjects underwent neuropsychological testing to assess cognitive function prior to MRI using the Montreal Cognitive Assessment (MoCA) scale for each subject. A lower score indicates more severe cognitive impairment (note: 1 point is added if the number of years of education was ≤ 12).
MRI Data Acquisition
The SIGNA Architect 3.0T scanner with a 40-channel head coil (GE Medical Systems, Milwaukee, WI) was used in the current study. The patient was scanned in the supine position, with the head immobilized to prevent head movement, and the subject was instructed to remain relaxed, awake, quiet, and with eyes closed, and to refrain from any thinking activity as much as possible. FLAIR was performed first, parallel or perpendicular to the hippocampal long axis. The hippocampus was assessed by two chief radiologists (Wang and Ding) and case screening was performed to exclude other intracranial organic lesions.
The rs-fMRI scans were collected using a gradient echo planar imaging (EPI) sequence (repetition time [TR], 2000 ms; echo time [TE], 30 ms; flip angle [FA], 90°; field of view [FOV], 24 cm × 24 cm; 36 axial slices; matrix, 64 × 64; containing 180 blood oxygenated level-dependent volumes, and a 3.5-mm thickness without gap). Simultaneously, high-resolution T1-weighted structural images were collected from the three-dimensional magnetization prepared rapid gradient echo (MPRAGE) sequence (TR, 2400 ms; TE, 2.38 ms; FA, 8°; FOV, 24 cm × 24 cm; matrix, 256 × 256; 156 slices; and 1-mm slice thickness without slice gap).
Rs-fMRI Data Processing
Grouped rs-fMRI image data from the cTLE-N, rTLE-N, and HC groups were batch imported and image pre-processed using the DPARSF4.5 package (http://rfmri.org/DPARSF) on the MATLAB R2017a-based platform. The steps were as follows: (1) format conversion; (2) removal of the first six time points of the images; (3) time correction, in which the time difference generated by the interval layer scans was eliminated to ensure the same start point of the acquired images; (4) head movement correction, performed to align the images, such that subjects with excessive head movement (horizontal movement distance > 2.5 mm or rotation angle > 2.5°) were excluded, no excluded data in this study; Additionally, the mean head translation, mean head rotation, and frame-wise displacement were calculated for each group.18 Analysis of those head motion parameters did not reveal differences among the three groups (P > 0.05). (5) spatial normalization, in which the data of each subject after head movement correction was aligned to the MNI standard spatial brain template, and each voxel was resampled to 3 mm × 3 mm × 3 mm voxel size; and (6) improvements to the image signal-to-noise ratio by spatially smoothing the image with a FWHM Gaussian smoothing kernel of 6 mm × 6 mm × 6 mm, removing low-frequency drift, and filtering (frequency band set to 0.01–0.08 Hz). Covariates were regressed from time series of each voxel, including white matter signals, cerebrospinal fluid signals, and Friston 24 motor parameters.19 Global signals were also included due to their potential to provide additional valuable information.20
ALFF/ fALFF Calculation
The filtered MR was converted from the time to the frequency domain by Fourier transform using the DPARSF software package. The power spectrum of each voxel was calculated, the power spectrum was squared for each frequency, and the average of each voxel in the frequency range 0.01–0.08 Hz was calculated as the ALFF value.21 The fALFF was obtained by summing the squared power spectrum over the frequency range and then dividing by the sum of the full band squared power spectrum.11
ReHo Calculation
The un-smoothed pre-processed data were used for ReHo calculations using the DPARSF4.5 software package, relying on Kendall’s coefficient of concordance (KCC), which measures the synchrony of the time series between a given voxel and its neighboring 26 voxels at the voxel level.13 The obtained ReHo of individual participants were normalized using the Fisher Z-transform to allow for population analysis.
Statistic Analysis
Clinical information: SPSS 26.0 software was used for data analysis. Sex was used as a relative number composition ratio (%) using the χ2 test. The measurement data including age, years of education, duration of illness, age of onset, and MoCA score, of the two groups, if normally distributed, were expressed as a one-way analysis of variance (ANOVA) for comparison between multiple groups and two-sample t-test for comparison between two groups. Non-normally distributed measurement data were expressed as M (Q1, Q3) and analyzed by Wilcoxon rank sum test. Differences were considered statistically significant at P < 0.05.
DPARSF software was used for statistical analysis of functional indicators (ALFF, fALFF, ReHo). Analysis of covariance (ANCOVA) was used to analyze the differences among the three groups, with age, sex and education level as covariables. The Gaussian random field (GRF) method was used to set the corrected P-value of the ANCOVA to P < 0.05 (voxel-level P < 0.001, cluster-level P < 0.05). In particular, after ANCOVA, the Bonferroni test was used for post-comparison correction of group pairs. Then the P graph was converted into the Z graph and marked as the mean difference between groups. Using the Z-plot, we then performed GRF correction to correct multiple comparisons on voxels (voxel-level P < 0.001, cluster-level P < 0.05) and examine the spontaneous neuronal changes among the three groups. Correlation analysis: Brain areas that were statistically different between the three ANCOVA groups were used as regions of interest, and relevant indicators were extracted and correlated with the MoCA score.
Results
Demographic and Clinical Characteristics of Participants
Table 1 shows the detailed demographic and clinical characteristics of the cTLE-N, rTLE-N, and HC groups. Age, sex, and years of education did not differ significantly between the three groups. Post hoc tests showed no significant differences between groups. Additionally, the age of onset, epilepsy durations, and TLE location did not differ significantly between the cTLE-N and rTLE-N groups. In neurocognitive tests, the patients with rTLE-N had lower MoCA scores than the patients with cTLE-N (t = 2.813, P = 0.007).
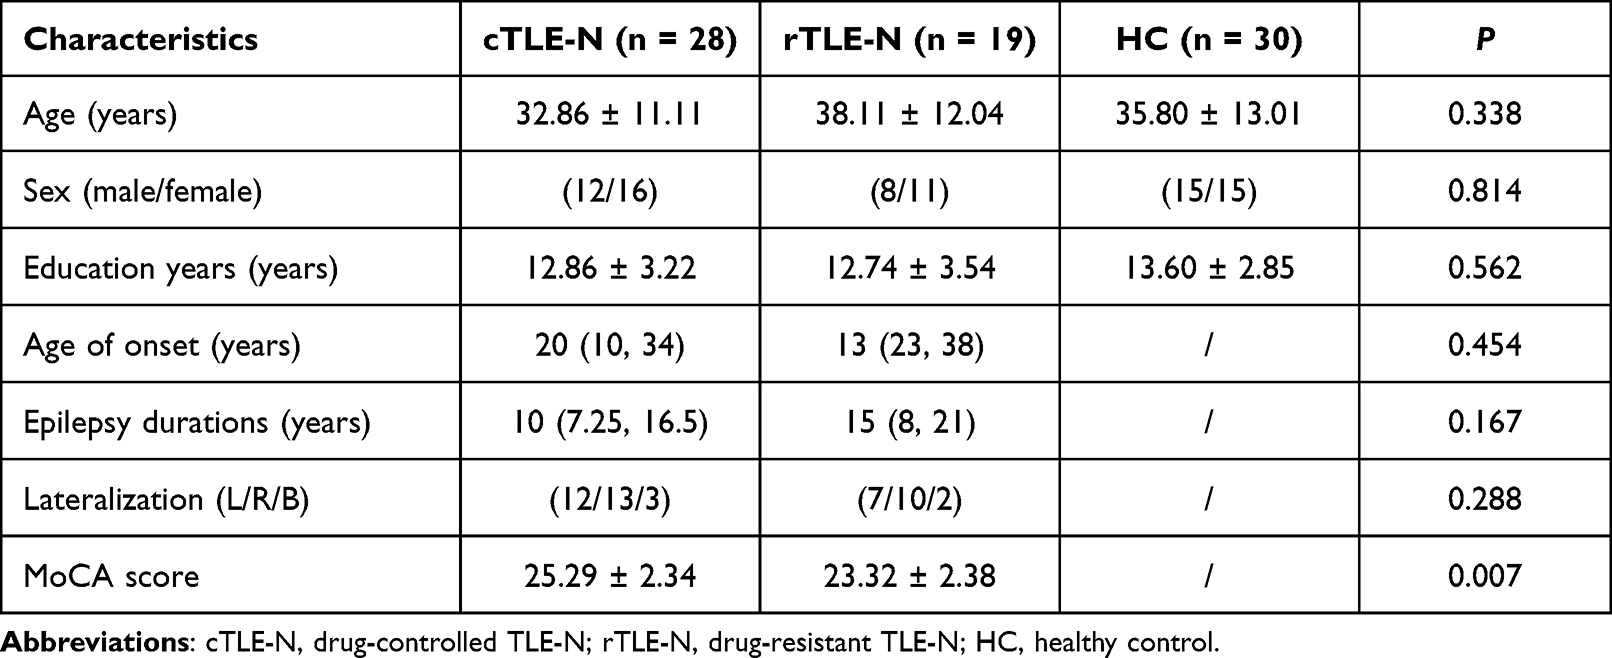 |
Table 1 Demographic and Clinical Characteristics of the Participants |
Alterations of ALFF
The differences in ALFF among the three groups were compared using ANCOVA with post hoc analysis. As shown in Figure 1A, significant inter-group differences in ALFF values were mainly distributed in the right angular gyrus (AG), bilateral middle frontal gyrus orbital (ORBmid), left inferior frontal gyrus pars triangularis (IFGpTri), and left calcarine gyrus (CG) (GRF corrected, voxel-level P < 0.001, cluster-level P < 0.05). Details of all abnormal ALFF regions in the three groups are shown in Supplementary Table 1.
 |
Figure 1 Brain regions exhibiting significant differences in ALFF values according ANCOVA and post-hoc analysis. Notes: (A) Brain regions showing significant differences in ALFF values between cTLE-N, rTLE-N, and HC groups. (B) Brain regions showing significant differences in ALFF values between cTLE-N and HC groups. (C) Brain regions showing significant differences in ALFF values between rTLE-N and HC group. (D) Brain regions showing significant differences in ALFF values between cTLE-N and rTLE-N group. (A–D are displayed after GRF correction, voxel-level P < 0.001, cluster-level P < 0.05, and cluster size ≥ 28). |
In post hoc tests, compared to the HC group, the cTLE-N group showed decreased ALFF in the right CG, as well as increased ALFF in the right Cerebelum Crus1 (Figure 1B). The rTLE-N group showed increased ALFF in the bilateral ORBmid, left IFGpTri, left CG, and right paracentral lobule (PCL) (Figure 1C). Compared to the rTLE-N group, the cTLE-N group showed significantly lower ALFF in the right lingual gyrus (Lin), right cuneus (Cun), and right PCL, as well as increased ALFF in the left fusiform gyrus (FG) and right putamen (Put) (Figure 1D).
Alterations of fALFF
The differences in fALFF among the three groups were compared using ANCOVA with post hoc analysis. As shown in Figure 2A, significant inter-group differences in fALFF values were mainly distributed in the right FG, bilateral inferior frontal gyrus orbital (ORBinf), right superior frontal gyrus orbital (ORBsup), right Lin, right superior occipital gyrus (SOG), left middle frontal gyrus (MFG), right postcentral gyrus (PoCG), left superior frontal gyrus (SFG), and right PCL (GRF corrected, voxel-level P < 0.001, cluster-level P < 0.05). Details of all abnormal fALFF regions in the three groups are shown in Supplementary Table 2.
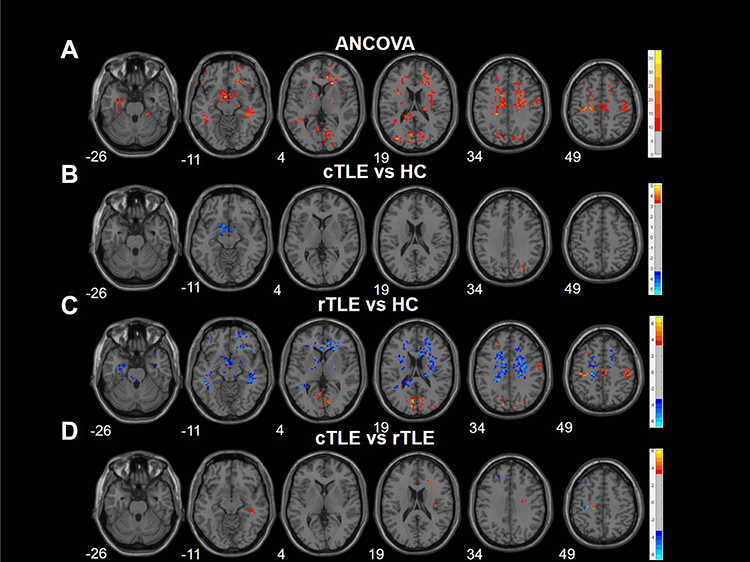 |
Figure 2 Brain regions exhibiting significant differences in fALFF values according to ANCOVA and post-hoc analysis. Notes: (A) Brain regions showing significant differences in fALFF values between cTLE-N, rTLE-N, and HC groups. (B) Brain regions showing significant differences in fALFF values between cTLE-N and HC groups. (C) Brain regions showing significant differences in fALFF values between rTLE-N and HC groups. (D) Brain regions showing significant differences in fALFF values between cTLE-N and rTLE-N groups. (A–D are displayed after GRF correction, voxel-level P < 0.001, cluster-level P < 0.05, and cluster size ≥ 28). |
In post hoc tests, compared to the HC group, the cTLE-N group showed decreased fALFF in the left pallidum (Pal), as well as increased fALFF in the right SOG (Figure 2B). The rTLE-N group showed decreased fALFF in the right parahippocampal gyrus (PHG), bilateral ORBinf, right ORBsup, as well as increased fALFF in the right SOG, right Lin, left SFG, right PoCG, and right PCL (Figure 2C). Compared to the rTLE-N group, the cTLE-N group showed significantly lower fALFF in the left PoCG and right PCL, as well as increased fALFF in the right FG (Figure 2D).
Alterations of ReHo
The differences in ReHo among the three groups were compared using ANCOVA with post hoc analysis. As shown in Figure 3A, significant inter-group differences in ReHo values were mainly distributed in the left Cerebelum Crus6, left FG, bilateral CG, left inferior occipital gyrus (IOG), right ORBmid, left superior temporal gyrus (STG), left caudate nucleus (Caud), right middle occipital gyrus (MOG), right SFG, right supplementary motor area (SMA), left AG, left angular gyrus of the parietal inferior margin, and left middle frontal gyrus (MFG) (GRF corrected, voxel-level P < 0.001, cluster-level P < 0.05). Details of all abnormal ReHo regions in the three groups are shown in Supplementary Table 3.
 |
Figure 3 Brain regions exhibiting significant differences in ReHo values according to ANCOVA and post-hoc analysis. Notes: (A) Brain regions showing significant differences in ReHo values between cTLE-N, rTLE-N, and HC groups. (B) Brain regions showing significant differences in ReHo values between cTLE-N and HC groups. (C) Brain regions showing significant differences in ReHo values between rTLE-N and HC groups. (D) Brain regions showing significant differences in ReHo values between cTLE-N and rTLE-N groups. (A–D are displayed after GRF correction, voxel-level P < 0.001, cluster-level P < 0.05, and cluster size ≥ 28). |
In post hoc tests, compared to the HC group, the cTLE-N group showed increased ReHo in the right Lin, right FG, right MOG, and left PoCG (Figure 3B). The rTLE-N group showed decreased ReHo in the right ORBmid, right PrC, bilateral angular gyrus of the parietal inferior margin, as well as increased ReHo in the Cerebelum Crus6, left FG, left IOG, bilateral CG, left STG, left Caud, right middle temporal gyrus (MTG), right SMA, bilateral MOG, and left MFG (Figure 3C). Compared to the rTLE-N group, the cTLE-N group showed significantly lower ReHo in the left MFG and bilateral precentral gyrus (PreCG), as well as increased ReHo in the left ORBmid (Figure 3D).
Correlations Between ALFF/fALFF/ ReHo Values and MoCA Score
We analyzed the association of the MoCA score with abnormal ALFF/fALFF/ ReHo values in the participants with TLE-N. In the cTLE-N group, the ReHo value of the left PoCG was negatively correlated with the MoCA score (r = −0.405, P = 0.032) (Figure 4). Additionally, in the rTLE-N group, no correlation was found between altered value and neurocognitive function.
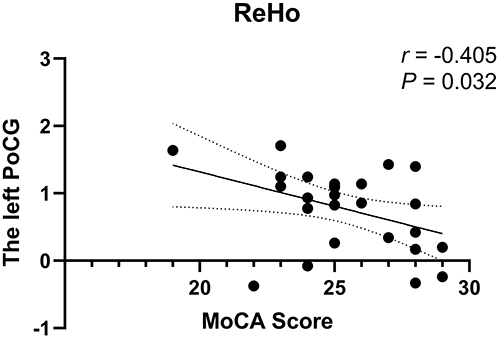 |
Figure 4 Correlation of abnormal brain areas in the ReHo with MoCA score in the cTLE-N group. Abbreviation: PoCG, postcentral gyrus. Note: In the cTLE-N group, the ReHo value of the left PoCG was negatively correlated with the MoCA score. |
Discussion
Patients with TLE-N represent a significant subgroup of patients with TLE, and understanding of the biology and etiology of the condition is critical for its diagnosis and treatment. Although rs-fMRI has been frequently employed in epilepsy research, it has been less commonly used in TLE-N investigations. This study combined three voxel-based local regional brain analysis methods, ALFF, fALFF, and ReHo, to investigate the resting brain function in patients with TLE-N, from the perspective of regional neural synchronization and intensity, as well as to investigate the neural mechanisms of brain functional impairment in patients with TLE-N. These functional indicators are examined according to distinct concepts and indicate different neuronal activities in the brain. Our findings show that the spatial patterns of brain activity change across the cTLE-N, rTLE-N, and HC groups.
ALFF/fALFF Analysis Results
The ALFF and fALFF both reflect the magnitude of spontaneous brain activity. The ALFF can reflect the degree of spontaneous neural activity in individual brain areas by computing the average of all frequency point amplitudes in a specific frequency band, representing the overall power in a specific frequency range, and indicating the strength of low-frequency oscillations.21 The fALFF is a modified ALFF approach that can efficiently block non-specific signal components while also reducing sensitivity to physiological noise, demonstrating the relative contribution of certain low-frequency oscillations to the entire frequency range.11 In our research, in which these two modalities were examined individually, the results maps produced by ALFF analysis were more diffuse than those produced by fALFF analysis, centered on the ventricles, and did not reveal more effective brain areas. We demonstrated the advantage of fALFF analysis, which lowers the effect of physiological noise in the ventricles and paraventricular pools, by comparing these two approaches.22 Therefore, we focus on the results of fALFF analysis for further discussion.
We discovered that the fALFF values of the ORBinf, PHG, and ORBsup of the rTLE-N group were lower than those of the control group, indicating damage to the prefrontal and limbic systems of rTLE-N, which resulted in a significant reduction of spontaneous brain activity in the prefrontal and limbic systems at rest. In TLE, the PHG is thought to be a significant epileptogenic area. The frontal lobe is the most developed portion of the brain, whereas the prefrontal lobe contains extensive contact fibers and is involved in executive processes. Frontal lobe damage may be the result of frontotemporal transmission involvement or secondary transmission of epileptic activity in the epileptogenic region of the integrated cortex with similar frontal lobe function.23 Through their FDG-PET research, Guedj et al demonstrated substantial frontotemporal lobe functional impairments in patients with TLE.24 Clinical investigations have indicated that patients with TLE exhibit mild frontal dysfunction,25,26 as well as mental impairment related to medial prefrontal dysfunction.27 Using the fALFF investigation, we verified local brain activity alterations in the prefrontal limbic system in rTLE-N patients.
We also discovered that patients with rTLE-N exhibited greater fALFF values in the SOG, Lin, STG, and PoCG, which may be attributed to increased excitability of neurons in local brain areas, indicating that abnormal discharges during interictal periods could be related to higher fALFF. The CG, Lin, and FG are involved in visual information processing. Taken together, these data suggest that patients with rTLE-N have visual impairment. Wills et al discovered abnormal connections between the thalamic awakening center and the TLE occipital lobe, some of which improved after surgery, and suggested that the thalamic awakening center may help to explain the TLE distal network disorder.28
ReHo Analysis Results
ReHo analysis is a more stable voxel-based measure reflecting the homogeneity of neuronal activity at the same frequency based on the similarity of BOLD signal fluctuations in local brain regions.13 The degree of temporal homogeneity and synchronization of changes in neuronal activity is assumed to be reflected by ReHo. In our investigation, the ReHo values in the ORBmid, PrC, and parietal inferior angular gyrus were shown to be lower in rTLE-N patients when compared to the HC group, which involved some of the brain regions associated with DMN, implying that long-term epileptic activity has disrupted the local coherence of DMN-related regions. When Zhu et al analyzed patients with TLE-N using regional coherence and compared the results to those of healthy controls, they discovered lower ReHo values in the PrC, indicating impaired PrC function.14 Furthermore, in patients with rTLE-N, we identified elevated ReHo values in various frontal lobe, temporal lobe, occipital lobe, and subcortical brain areas, with greater ReHo values, suggesting a higher consistency of spontaneous neural activity in these brain regions. In several brain areas, ReHo rose and reduced simultaneously, demonstrating that epilepsy has a bidirectional effect.
Other Findings
In our investigation, we discovered that occipital lobe activation was dominating in the distribution of abnormal functional brain areas in patients with cTLE-N; these included increased fALFF values in the SOG and increased ReHo value in the Lin, FG, and MOG. Visual processing is associated with several anatomical regions, including the CG, Lin, and FG, all of which are involved in the processing of visual information. The FG has a visual processing function, and an increase in activity level causes hallucinations;29 the Lin is the visual sensory cortex and is responsible for visual information. We assumed that the functional anomalies in the above brain areas were a result of decreased visual function, suggesting that in clinical work, patients’ visual symptoms should be closely observed to assist with early identification. However, dysfunctional functional brain regions in patients with rTLE-N are widely dispersed, including in the frontal lobe, temporal lobe, parietal lobe, occipital lobe, and limbic systems, indicating the presence of distinct epileptic networks in cTLE-N and rTLE-N that require further investigation.
Limitations of This Study
This study has several limitations that warrant discussion. First, we were unable to perform more detailed lateral grouping due to the small sample size. We will continue to gather cases and investigate this issue thoroughly. Second, because this is a cross-sectional study, important fMRI information on the dynamic evolution of spontaneous brain activity recovery caused by antiepileptic medication could not be provided. In the future, longitudinal study designs may address this question.
Conclusion
Patients with rTLE showed altered local brain activity in the prefrontal limbic system, while those in the cTLE group showed impaired visual function. The fMRI techniques provide a range of analytic approaches, expanding the scope of epilepsy research. The fALFF and ReHo techniques provide distinct views on pathophysiological processes, and they play complementary roles in explaining the regional spontaneous brain activity. When combined, these fMRI approaches may help researchers to better understand the underlying neurophysiological and compensatory processes driving TLE-N and contribute to the development of novel therapies. Furthermore, our exploratory investigation of TLE-N may help to shape the design of future longitudinal studies.
Acknowledgments
We thank LetPub for its linguistic assistance during the preparation of this manuscript.
Funding
This work was supported by Regional Collaborative Innovation special fund of Xinjiang Uygur Autonomous Region (Grant numbers: 2020E0275).
Disclosure
The authors report no conflicts of interest in this work.
References
1. Muhlhofer W, Tan YL, Mueller SG, Knowlton R. MRI -negative temporal lobe epilepsy—What do we know? Epilepsia. 2017;58:727–742. doi:10.1111/epi.13699
2. Téllez-Zenteno J, Hernández-Ronquillo L. A review of the epidemiology of temporal lobe epilepsy. Epilepsy Res Treat. 2012;2012:630853. doi:10.1155/2012/630853
3. Lopinto-Khoury C, Sperling MR, Skidmore C, et al. Surgical outcome in PET-positive, MRI-negative patients with temporal lobe epilepsy. Epilepsia. 2012;53:342–348. doi:10.1111/j.1528-1167.2011.03359.x
4. Helmstaedter C, Petzold I, Bien CG. The cognitive consequence of resecting nonlesional tissues in epilepsy surgery–results from MRI- and histopathology-negative patients with temporal lobe epilepsy. Epilepsia. 2011;52:1402–1408. doi:10.1111/j.1528-1167.2011.03157.x
5. Reyes A, Thesen T, Wang X, et al. Resting-state functional MRI distinguishes temporal lobe epilepsy subtypes. Epilepsia. 2016;57:1475–1484. doi:10.1111/epi.13456
6. Shon Y-M, Kim J, Kim SH, Lim SC, Kim W. Clinical characteristics of patients with benign nonlesional temporal lobe epilepsy. Neuropsychiatr Dis Treat. 2016;12:1887–1891. doi:10.2147/NDT.S110400
7. Iv WOT, Benbadis SR, Hussain A, et al. Ictal EEG remains the prominent predictor of seizure-free outcome after temporal lobectomy in epileptic patients with normal brain MRI. Seizure. 2008;17:631–636. doi:10.1016/j.seizure.2008.04.001
8. Bell ML, Rao S, So EL, Trenerry M, Kazemi N. Epilepsy surgery outcomes in temporal lobe epilepsy with normal MRI. Epilepsia. 2009;50:2053–2060. doi:10.1111/j.1528-1167.2009.02079.x
9. Téllez-Zenteno F, Dhar R, Wiebe S, et al. Long-term seizure outcomes following epilepsy surgery: a systematic review and meta-analysis. Brain. 2005;128:1188. doi:10.1093/brain/awh449
10. Wurina Zang W, Zang Y-F, Zhao,S-G. Resting-state fMRI studies in epilepsy. Neuroscience Bulletin. 2012;28:449–455. doi:10.1007/s12264-012-1255-1
11. Zou QH, Zhu CZ, Yang Y, et al. An improved approach to detection of amplitude of low-frequency fluctuation (ALFF) for resting-state fMRI: fractional ALFF. J Neurosci Methods. 2008;172:137–141. doi:10.1016/j.jneumeth.2008.04.012
12. Zhang Z, Lu G, Zhong Y, Tan Q, Chen H. FMRI study of mesial temporal lobe epilepsy using amplitude of low-frequency fluctuation analysis. Hum Brain Mapp. 2010;31:1851–1861. doi:10.1002/hbm.20982
13. Zang Y, Jiang T, Lu Y, et al. Regional homogeneity approach to fMRI data analysis. NeuroImage. 2004;22(1):394–400. doi:10.1016/j.neuroimage.2003.12.030
14. Zhu X, He Z, Luo C, et al. Altered spontaneous brain activity in MRI-negative refractory temporal lobe epilepsy patients with major depressive disorder: a resting-state fMRI study. J Neurol Sci off Bull World Feder Neurol. 2018;386:29–35. doi:10.1016/j.jns.2018.01.010
15. An L, Cao QJ, Sui MQ, et al. Local synchronization and amplitude of the fluctuation of spontaneous brain activity in attention-deficit/hyperactivity disorder: a resting-state fMRI study. Neuroscience bulletin. 2013;29:603–613. doi:10.1007/s12264-013-1353-8
16. Berg AT, Berkovic SF, Brodie MJ, et al. Revised terminology and concepts for organization of seizures and epilepsies: report of the ILAE commission on classification and terminology, 2005–2009. Epilepsia. 2010;51:676–685. doi:10.1111/j.1528-1167.2010.02522.x
17. Brodie MJ. Definition of drug resistant epilepsy: consensus proposal by the ad hoc task force of the ILAE commission on therapeutic strategies. Yearbook Neurol Neurosurg. 2011;2011:29–30. doi:10.1016/j.yneu.2010.12.020
18. Power JD, Barnes KA, Snyder AZ, et al. Spurious but systematic correlations in functional connectivity MRI networks arise from subject motion. NeuroImage. 2012;59:2142–2154. doi:10.1016/j.neuroimage.2011.10.018
19. Yan CG, Craddock RC, He Y, Milham MP. Addressing head motion dependencies for small-world topologies in functional connectomics. Front Hum Neurosci. 2013;7:910. doi:10.3389/fnhum.2013.00910
20. Liu TT, Nalci A, Falahpour M. The global signal in fMRI: nuisance or Information?. NeuroImage. 2017;150:213–229. doi:10.1016/j.neuroimage.2017.02.036
21. Yang H, Long XY, Yang Y, et al. Amplitude of low frequency fluctuation within visual areas revealed by resting-state functional MRI. NeuroImage. 2007;36:144–152. doi:10.1016/j.neuroimage.2007.01.054
22. Zhou C, Tang X, You W, Wang X, Yu M. Altered patterns of the fractional amplitude of low-frequency fluctuation and functional connectivity between deficit and non-deficit schizophrenia. Front Psychiatr. 2019;10:680. doi:10.3389/fpsyt.2019.00680
23. Stretton J, Thompson PJ. Frontal lobe function in temporal lobe epilepsy. Epilepsy Res. 2012;98:1–13. doi:10.1016/j.eplepsyres.2011.10.009
24. Guedj E, Bonini F, Gavaret M, et al. 18 FDG-PET in different subtypes of temporal lobe epilepsy: SEEG validation and predictive value. Epilepsia. 2015;56:414–421. doi:10.1111/epi.12917
25. Kim CH, Lee SA, Yoo HJ, Kang JK, Lee JK. Executive performance on the wisconsin card sorting test in mesial temporal lobe epilepsy. Eur Neurol. 2007;57:39–46. doi:10.1159/000097009
26. Lie CH, Specht K, Marshall JC, Fink GR. Using fMRI to decompose the neural processes underlying the wisconsin card sorting test. NeuroImage. 2006;30:1038–1049. doi:10.1016/j.neuroimage.2005.10.031
27. Li YH, Chiu MJ, Yeh ZT, Liou HH, Cheng TW, Hua MS. Theory of mind in patients with temporal lobe epilepsy. J Int Neuropsychol Soc. 2013;19:594–600. doi:10.1017/S1355617713000143
28. Wills KE, González H, Johnson GW, Haas KF, Morgan VL. People with mesial temporal lobe epilepsy have altered thalamo-occipital brain networks. Epilepsy Behav. 2020;115:107645. doi:10.1016/jhebeh.2020.107645
29. Palejwala AH, O’Connor KP, Milton CK, Anderson C, Pelargos P. Anatomy and white matter connections of the fusiform gyrus. Sci Rep. 2020;10. doi:10.1038/s41598-020-70410-6
 © 2022 The Author(s). This work is published and licensed by Dove Medical Press Limited. The
full terms of this license are available at https://www.dovepress.com/terms
and incorporate the Creative Commons Attribution
- Non Commercial (unported, 3.0) License.
By accessing the work you hereby accept the Terms. Non-commercial uses of the work are permitted
without any further permission from Dove Medical Press Limited, provided the work is properly
attributed. For permission for commercial use of this work, please see paragraphs 4.2 and 5 of our Terms.
© 2022 The Author(s). This work is published and licensed by Dove Medical Press Limited. The
full terms of this license are available at https://www.dovepress.com/terms
and incorporate the Creative Commons Attribution
- Non Commercial (unported, 3.0) License.
By accessing the work you hereby accept the Terms. Non-commercial uses of the work are permitted
without any further permission from Dove Medical Press Limited, provided the work is properly
attributed. For permission for commercial use of this work, please see paragraphs 4.2 and 5 of our Terms.
Recommended articles
Structural and Functional Brain Alterations in Postherpetic Neuralgia: A Systematic Review and Voxel-Wise Coordinate-Based Meta-Analysis via the SDM-PSI Method
Na Y, Mu H, Zhang J, Chen Q, Zhao L, Tan Z, Liu L, Lv T, Li B
Journal of Pain Research 2026, 19:600570
Published Date: 26 May 2026