Back to Journals » International Journal of Chronic Obstructive Pulmonary Disease » Volume 15
A Sputum 6 Gene Expression Signature Predicts Inflammatory Phenotypes and Future Exacerbations of COPD
Authors Baines KJ ![]() , Negewo NA, Gibson PG, Fu JJ
, Negewo NA, Gibson PG, Fu JJ ![]() , Simpson JL
, Simpson JL ![]() , Wark PAB
, Wark PAB ![]() , Fricker M
, Fricker M ![]() , McDonald VM
, McDonald VM ![]()
Received 10 January 2020
Accepted for publication 24 May 2020
Published 2 July 2020 Volume 2020:15 Pages 1577—1590
DOI https://doi.org/10.2147/COPD.S245519
Checked for plagiarism Yes
Review by Single anonymous peer review
Peer reviewer comments 5
Editor who approved publication: Prof. Dr. Richard Russell
Katherine J Baines,1 Netsanet A Negewo,1 Peter G Gibson,1,2 Juan-Juan Fu,3 Jodie L Simpson,1 Peter AB Wark,1,2 Michael Fricker,1 Vanessa M McDonald1,2,4
1Priority Research Centre for Healthy Lungs, Hunter Medical Research Institute, The University of Newcastle, Callaghan, NSW, Australia; 2Department of Respiratory and Sleep Medicine, John Hunter Hospital, Newcastle, NSW, Australia; 3Respiratory Group, Department of Integrated Traditional Chinese and Western Medicine, West China Hospital, Sichuan University, Chengdu, Sichuan Province, People’s Republic of China; 4School of Nursing and Midwifery, Faculty of Health and Medicine, The University of Newcastle, Callaghan, NSW, Australia
Correspondence: Katherine J Baines
Hunter Medical Research Institute, Level 2 West Wing, Locked Bag 1000, New Lambton, NSW 2305, Australia
Email [email protected]
Background: The 6 gene expression signature (6GS) predicts inflammatory phenotype, exacerbation risk, and corticosteroid responsiveness in asthma. In COPD, patterns of airway inflammation are similar, suggesting the 6GS may be useful. This study determines the diagnostic and prognostic ability of 6GS in predicting inflammatory phenotypes and exacerbation risk in COPD.
Methods: We performed 2 studies: a cross-sectional phenotype prediction study in stable COPD (total N=132; n=34 eosinophilic (E)-COPD, n=42 neutrophilic (N)-COPD, n=39 paucigranulocytic (PG)-COPD, n=17 mixed-granulocytic (MG)-COPD) that assessed 6GS ability to discriminate phenotypes (eosinophilia≥ 3%; neutrophilia≥ 61%); and a prospective cohort study (total n=54, n=8 E-COPD; n=18 N-COPD; n=20 PG-COPD; n=8 MG-COPD, n=21 exacerbation prone (≥ 2/year)) that investigated phenotype and exacerbation prediction utility. 6GS was measured by qPCR and evaluated using multiple logistic regression and area under the curve (AUC). Short-term reproducibility (intra-class correlation) and phenotyping method agreement (κ statistic) were assessed.
Results: In the phenotype prediction study, 6GS could accurately identify and discriminate patients with E-COPD from N-COPD (AUC=96.4%; p< 0.0001), PG-COPD (AUC=88.2%; p< 0.0001) or MG-COPD (AUC=86.2%; p=0.0001), as well as N-COPD from PG-COPD (AUC=83.6%; p< 0.0001) or MG-COPD (AUC=87.4%; p< 0.0001) and was reproducible. In the prospective cohort study, 6GS had substantial agreement for neutrophilic inflammation (82%, κ=0.63, p< 0.001) and moderate agreement for eosinophilic inflammation (78%, κ=0.42, p< 0.001). 6GS could significantly discriminate exacerbation prone patients (AUC=77.2%; p=0.034). Higher IL1B levels were associated with poorer lung function and increased COPD severity.
Conclusion: 6GS can significantly and reproducibly discriminate COPD inflammatory phenotypes and predict exacerbation prone patients and may become a useful molecular diagnostic tool assisting COPD management.
Keywords: COPD, airway markers, inflammation, molecular biology, eosinophil
Synopsis
What is the key question?
Can we use the 6 gene expression signature (6GS) to predict inflammatory phenotype and exacerbation prone patients with COPD?
What is the bottom line?
Measurement of the 6GS can significantly and reproducibly discriminate inflammatory phenotypes of COPD, as well as predicting exacerbation prone patients.
Why read on?
We demonstrate that the 6GS, a sputum-based molecular signature, is a useful molecular diagnostic tool in COPD phenotype recognition that could be used to guide inflammation-based management of COPD.
Introduction
Chronic obstructive pulmonary disease (COPD) is a major global health problem, responsible for a large and increasing burden of illness and death around the world. In 2010, COPD was the fourth global leading cause of death, with this expected to rise to the third leading cause in 2020.1 Therefore, improvements in the diagnosis and management of COPD and exacerbations of COPD are an urgent priority.2 A full understanding of disease pathogenesis and heterogeneity is crucial to advance COPD management and treatment.3 Increased neutrophils in the airways are a well-known feature of COPD whereby neutrophils correlate with clinical severity, however there is a lack of treatments targeting airway neutrophilia. Corticosteroid responsive eosinophilic inflammation is now recognised to account for 10–40% of stable COPD,4 as well as being present during exacerbations.5
The development of molecular signatures is likely to revolutionise personalised medicine for airway diseases.6 Our previous sputum transcriptomics studies in asthma lead to the identification of a PCR-based gene expression signature of 6 biomarkers that can discriminate inflammatory phenotypes,7,8 predict corticosteroid responsiveness,7,9 and identify exacerbation prone patients.10 The components of the 6 gene expression signature (6GS) are charcot leydon crystal (CLC), carboxypeptidase A3 (CPA3), DNASE1-like 3 (DNASE1L3), which are elevated with eosinophilic airway inflammation, and interleukin-1β (IL1B), tissue non-specific alkaline phosphatase (ALPL) and chemokine (C-X-C motif) receptor 2 (CXCR2), which are elevated with neutrophilic airway inflammation.7 Development of this qPCR biomarker signature as a tool for phenotype prediction will provide significant advantages over traditional cell counting, being faster, with less sample processing, and the potential for the analysis to be automated. Given that similar inflammatory patterns exist in COPD as in asthma, this study aims to determine the diagnostic ability and reproducibility of the 6GS in predicting inflammatory phenotypes and determine prognostic capacity to predict future risk of COPD exacerbation. We hypothesise that the 6GS is a clinically useful biomarker that significantly and reproducibly predicts both inflammatory phenotypes and exacerbation prone COPD patients.
Methods
Study Population
We performed 2 studies: a cross-sectional phenotype prediction study (n=132), that assessed the ability of the 6GS in discriminating inflammatory phenotypes of COPD with a sub-group (n=22) that established short-term reproducibility of the gene expression measures, and a prospective cohort study (n=54), that tested the utility and reliability of the 6GS in predicting inflammatory phenotypes, and investigated prediction of exacerbation prone COPD patients, previously reported.11,12 Participants with stable physician-diagnosed COPD were recruited from the respiratory ambulatory care clinics at John Hunter Hospital, the clinical research databases of the John Hunter Hospital’s Department of Respiratory and Sleep Medicine and the Hunter Medical Research Institute, Newcastle, Australia. COPD diagnosis was confirmed by incompletely reversible airflow limitation (forced expiratory volume in one second (FEV1)/forced vital capacity (FVC) ratio of <0.70).13 Exclusion criteria included current smoking (Phenotype prediction study) and unstable COPD, as determined by an acute exacerbation of COPD, which required treatment with antibiotics or oral corticosteroids within the previous 4 weeks, which was cause to delay study visits until recovery. All participants gave written informed consent. The Hunter New England Local Health District and the University of Newcastle Human Ethics Research Committees approved this study (HNEHREC approval numbers of 10/08/18/5.03 and 12/12/12/3.06) which was conducted in accordance with the Declaration of Helsinki.
Clinical Assessments
Participants attended the research centre whereby information on demographics, smoking status, exacerbation history in the preceding year, medical history, medication use, comorbidities (Charlson Comorbidity Index (CCI)14) and health-related quality of life (Saint George Respiratory Questionnaire (SGRQ)15) were collected. A 6-minute walk test was performed and the BODE index (Body mass index BMI), airflow Obstruction, Dyspnoea and Exercise capacity) calculated.16 Pre- and post-bronchodilator spirometry17 and sputum induction18 were performed. Peripheral venous blood was collected and serum high-sensitivity C-reactive protein (hs-CRP) was measured using enzyme-linked immunosorbent assay. A subgroup of participants was assessed approximately 1 month later, whereby a second sputum induction was carried out for assessment of reproducibility. In the prospective cohort study, 3 monthly telephone reviews were conducted over 12 months to assess exacerbations and medication use as previously described.11,12
Exacerbation Capture
Respiratory hospitalisations, emergency department (ED) visits, unscheduled general practice (GP) visits, and medication use including antibiotics and systemic corticosteroids were recorded at each assessment. An exacerbation of COPD was defined as a COPD-related episode with a) hospitalisation; or b) ED visit; or c) the need for oral corticosteroid (OCS) and/or antibiotics for at least 3 days.19 An exacerbation prone patient was defined as a participant with ≥2 exacerbations over the course of the 12 month follow up period.19
Sputum Induction and Analysis
Sputum induction was performed as previously described18 and is described in more detail in the Online Supplement.
Inflammatory Phenotype Classification
The cut off used to define eosinophilic inflammation was ≥3%20–22 (Eosinophil positive (E+ve)-COPD eosinophils≥3%; Eosinophil negative (E−ve)-COPD eosinophils<3%), and for neutrophilic inflammation was ≥61%18,23 (Neutrophil positive (N+ve)-COPD neutrophils≥61%; Neutrophil negative (N−ve)-COPD neutrophils<61%). Eosinophilic (E)-COPD was defined as sputum eosinophils≥3% and neutrophils<61%. Neutrophilic (N)-COPD was defined as sputum neutrophils≥61% and eosinophils<3%. Mixed granulocytic (MG)-COPD was defined as sputum neutrophils≥61% and eosinophils≥3%, whereas paucigranulocytic (PG)-COPD had normal levels of sputum eosinophils and neutrophils.
6GS Analysis
Sputum gene expression of CLC, CPA3, DNASE1L3, IL1B, ALPL, CXCR2 was performed as previously described,7,8 and is described in more detail in the Online Supplement.
Statistical Analysis
Data were analyzed using Stata 13 (Stata Corporation, College Station, Texas, USA) and were reported as mean (SD) or median (quartile 1, quartile 3) depending on the distribution. Comparisons between two independent groups were performed using Student’s t-test or Wilcoxon Rank Sum test. Fisher’s exact test was used to test categorical data. Comparisons between multiple groups were assessed using one-way ANOVA with Bonferroni correction for parametric data and Kruskal Wallis for non-parametric data as indicated. Associations were assessed using Spearman correlation. Biomarker potential was assessed using multiple logistic regression, receiver operating characteristic curves (ROCs) and area under the curve (AUC), described in more detail in the Online Supplement. Reproducibility of 2 qPCR measures approximately 1 month apart (phenotype prediction study) was assessed using Bland-Altman plots and intra-class correlation (ICC, MedCalc software). Agreement of phenotype prediction reliability between the 2 methods (Sputum cell counts and 6GS, prospective cohort study) was assessed using the κ statistic. Significance was accepted when p<0.05.
Results
Phenotype Prediction Study: Clinical Characteristics and Inflammatory Phenotypes
Details of the study participants are provided in Table 1. In the phenotype prediction study, participants (n=132) had a mean (SD) age of 70 (8) years and moderate airflow limitation with a mean (SD) post-bronchodilator FEV1%predicted of 55 (16)%. Comparison of the characteristics between inflammatory phenotypes of COPD patients is summarised in Table 2. There were 34 (26%) participants with E-COPD, 42 (32%) with N-COPD, 39 (30%) with PG-COPD and 17 (13%) with MG-COPD (Table 2). All clinical characteristics were similar between phenotypes, except for N-COPD having a lower BMI compared with PG-COPD (Table 2).
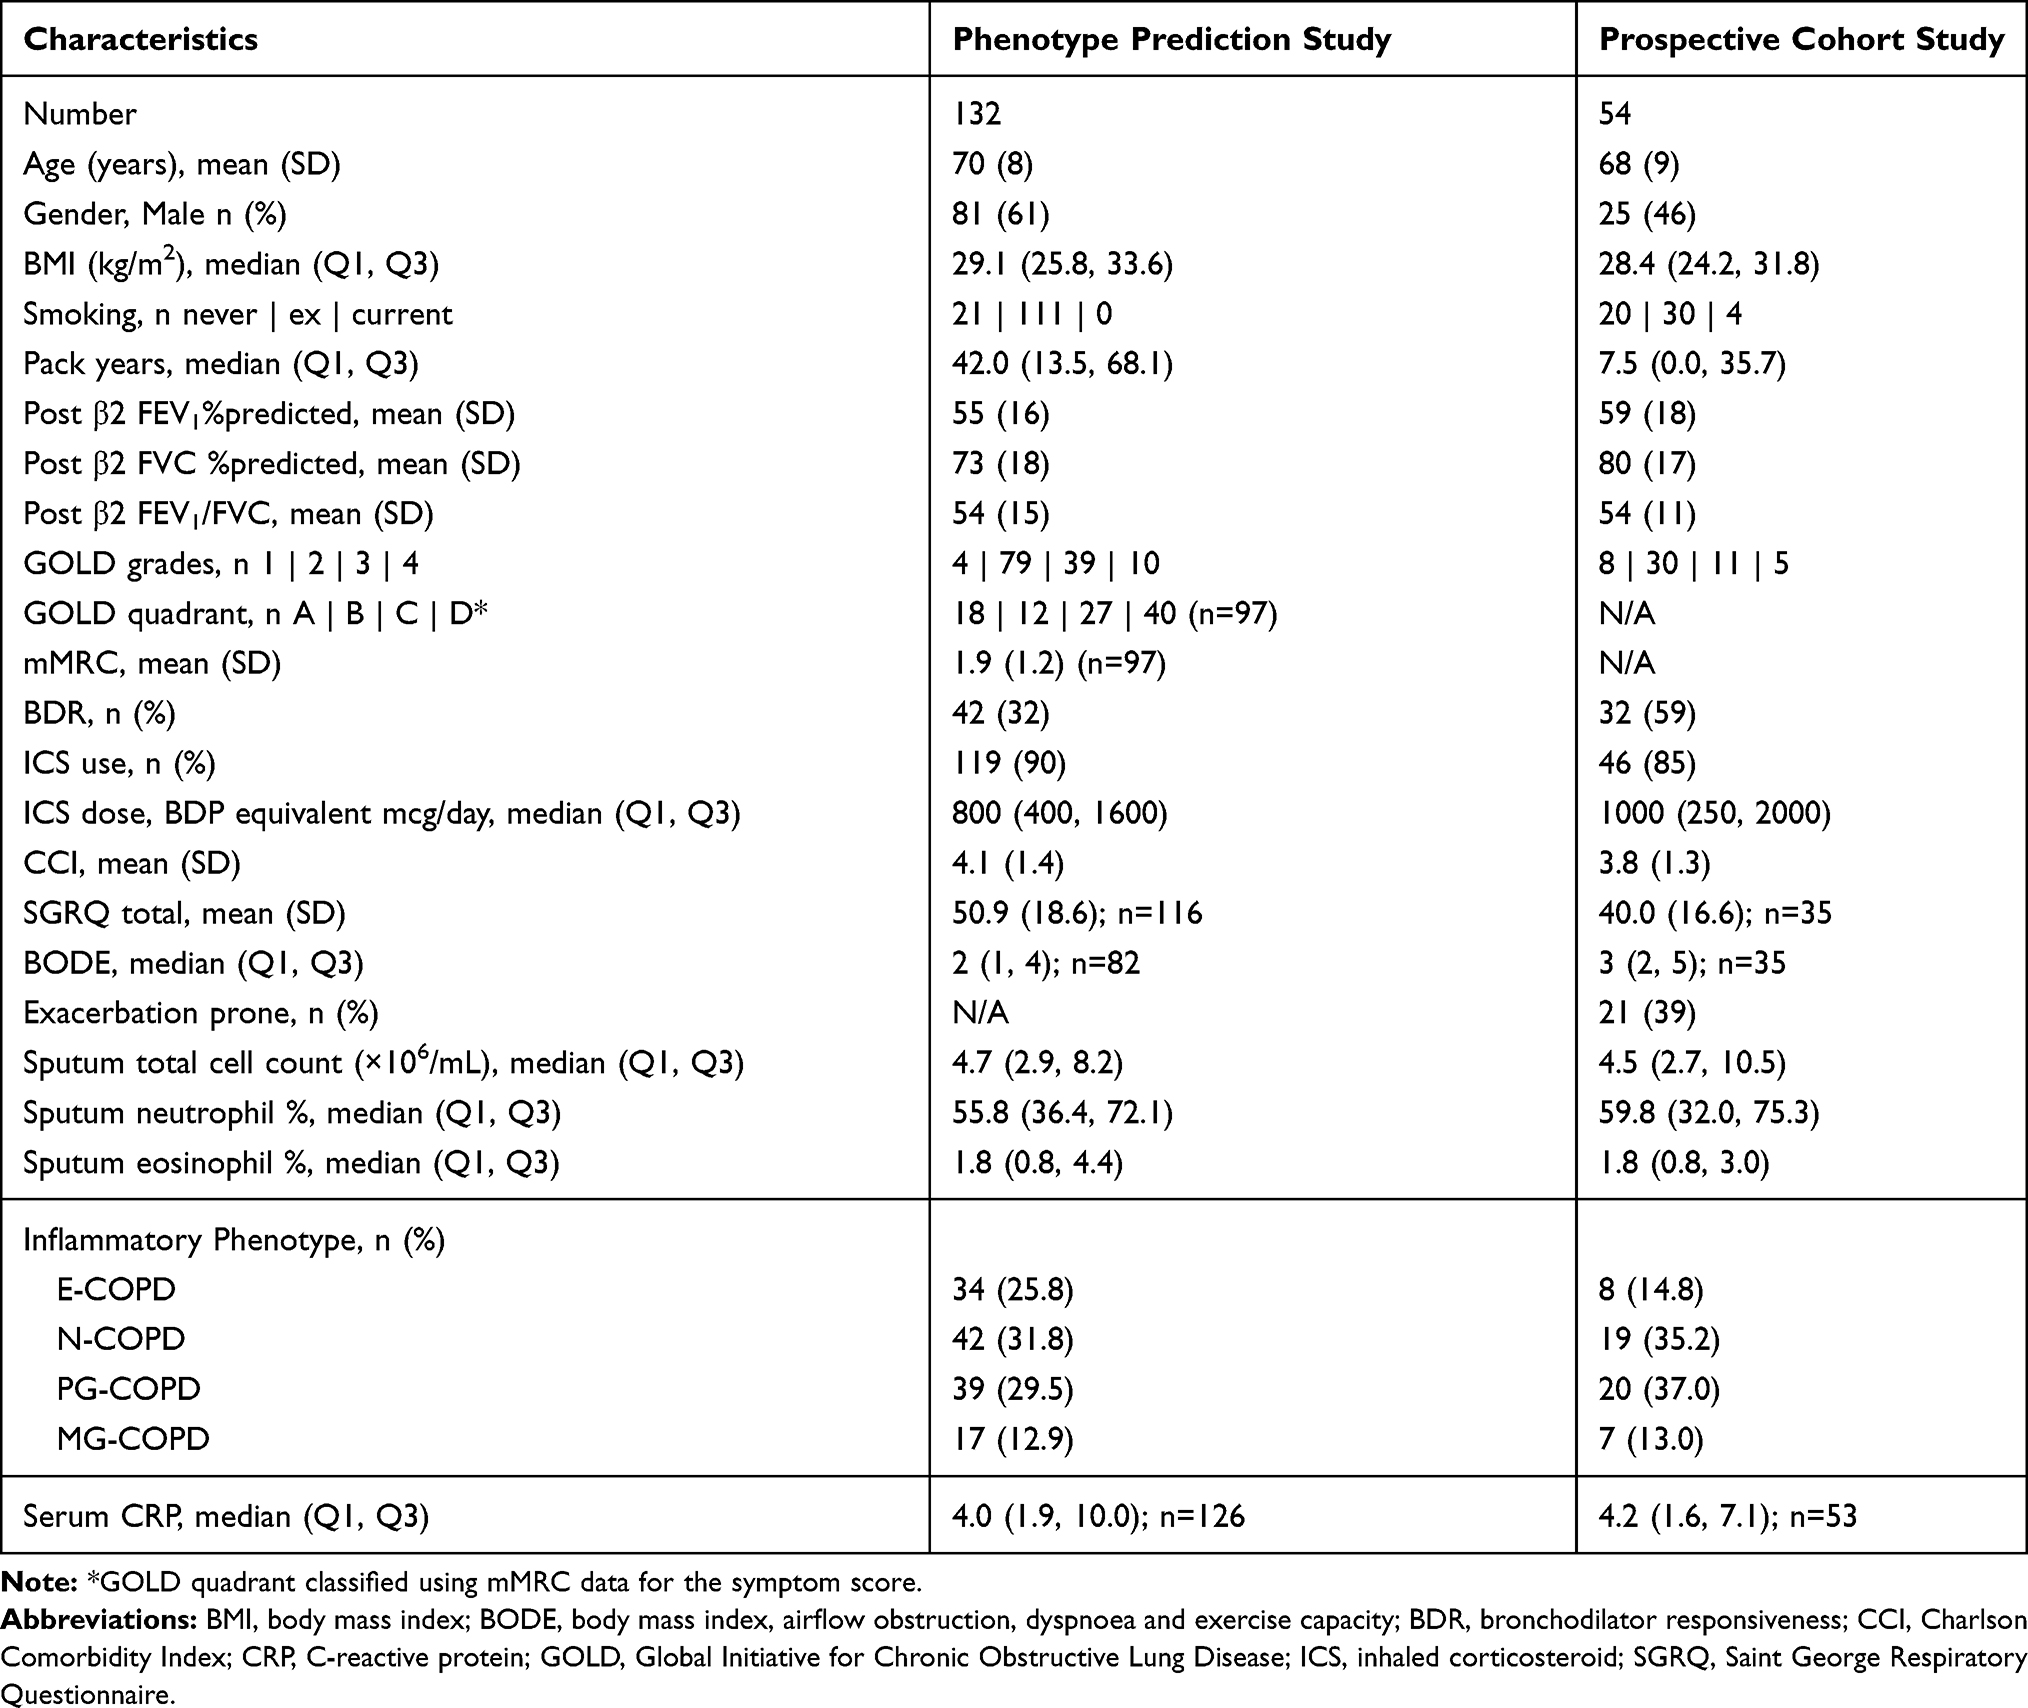 |
Table 1 Summary Clinical Characteristics of the Phenotype Prediction and Prospective Cohort Studies |
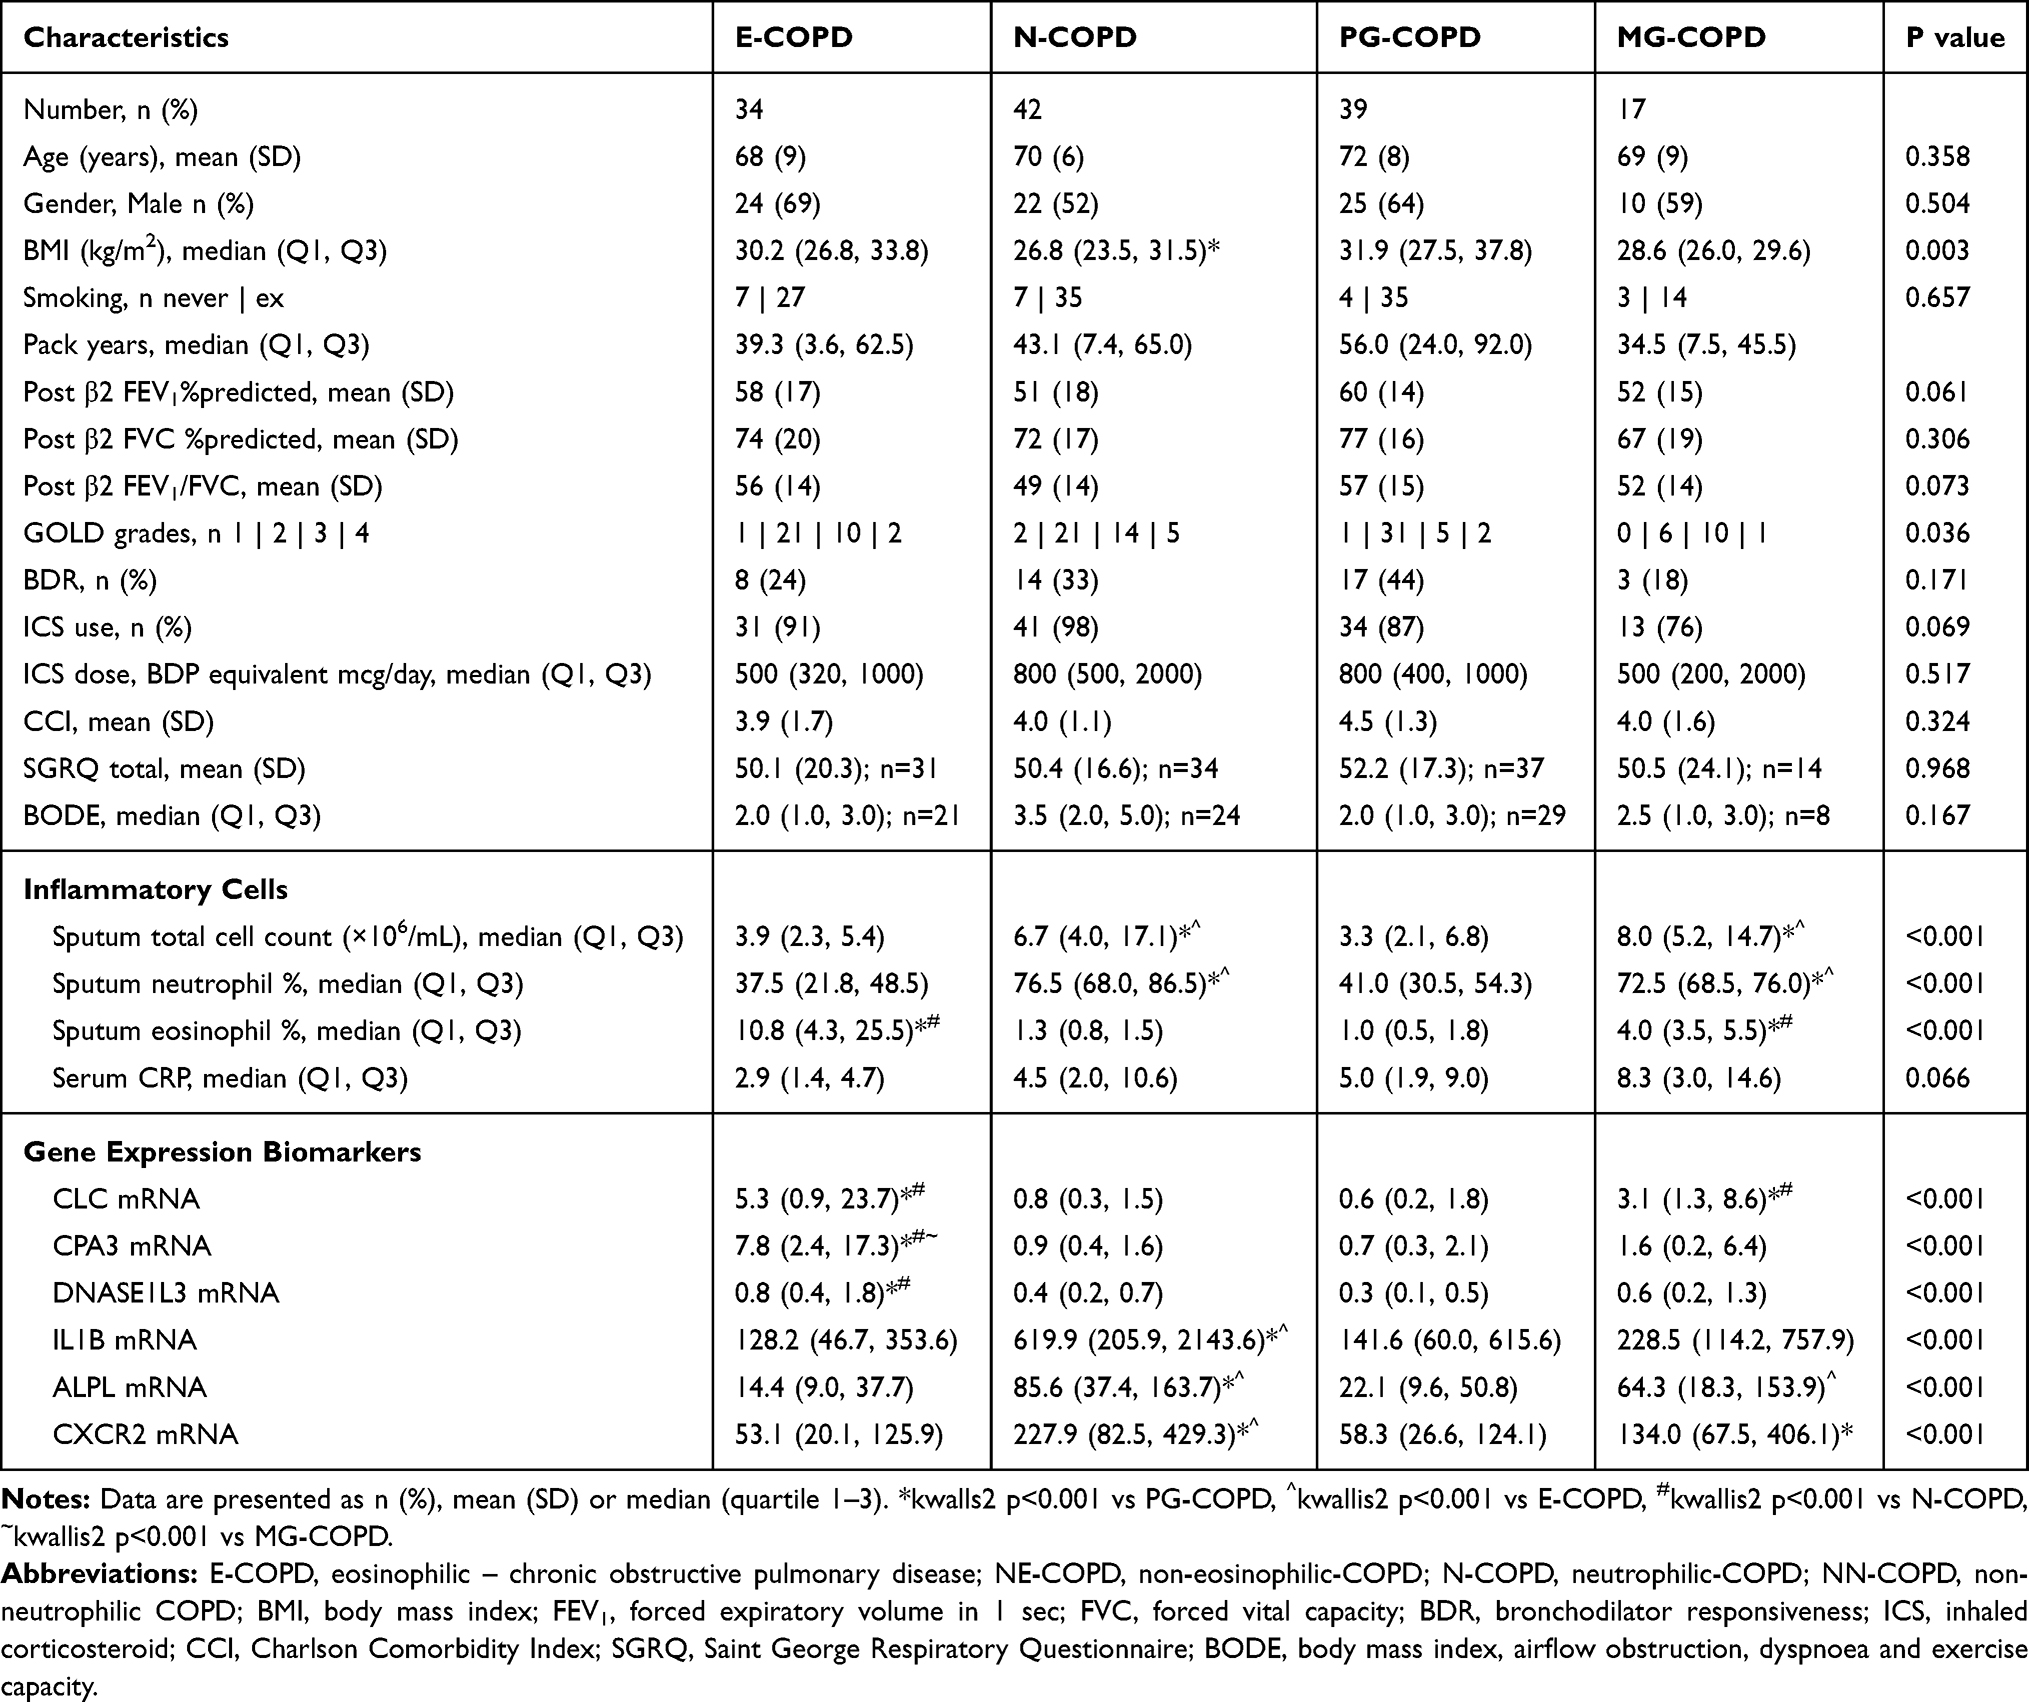 |
Table 2 Phenotype Prediction Study Clinical Characteristics, Inflammatory Cells and Gene Expression Levels in Inflammatory Phenotypes of COPD |
Phenotype Prediction Study: Gene Expression Levels in Inflammatory Phenotypes of COPD
Relative gene expression levels of the 6 genes between inflammatory phenotypes are detailed in Table 2 and Figure 1. CLC expression was significantly higher in patients with E-COPD and MG-COPD compared with N-COPD and PG-COPD. CPA3 expression was higher in E-COPD compared with N-COPD, PG-COPD and MG-COPD. DNASE1L3 expression was higher in E-COPD compared with N-COPD and PG-COPD. Sputum gene expression of IL1B, ALPL and CXCR2 was all higher in N-COPD compared with E-COPD and PG-COPD. ALPL expression was higher in MG-COPD compared with E-COPD and CXCR2 expression was higher in MG-COPD compared with PG-COPD.
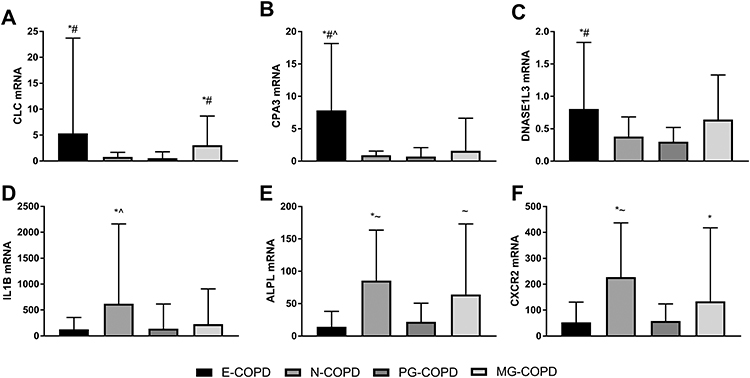 |
Figure 1 Relative gene expression levels of (A) CLC, (B) CPA3, (C) DNASE1L3, (D) IL1B, (E) ALPL and (F) CXCR2 in induced sputum samples from subjects with eosinophilic (E), neutrophilic (N), paucigranulocytic (PG) or mixed granulocytic (MG) COPD. Gene expression is calculated relative to β-actin (ΔCt), log transformed (2−ΔCt) and scaled. Bar graphs show the median and error bars as the upper quartile. *p<0.01 versus PG-COPD; #p<0.01 versus N-COPD; ^p<0.01 versus MG-COPD; ~p<0.01 versus E-COPD. |
Phenotype Prediction Study: Diagnostic Performance of the Sputum 6GS for Predicting Inflammatory Phenotypes of COPD
The diagnostic performance of the 6-gene signature, a composite of gene expression results for CLC, CPA3, DNASE1L3, IL1B, ALPL and CXCR2, was evaluated for predicting inflammatory phenotypes of COPD (Table 3). Firstly, the expression levels of the 6 genes in combination were able to identify participants with COPD that had eosinophilic inflammation compared to those without eosinophilic inflammation (Figure 2A, E+ve-COPD vs E−ve-COPD; AUC= 85.8%; 95% CI=79.3–92.3%; p<0.0001), as well as those participants with COPD that had neutrophilic inflammation compared with those without neutrophilic inflammation (Figure 2A, N+ve-COPD vs N−ve-COPD; AUC= 81.1; 95% CI=73.9–88.2%; p<0.0001).
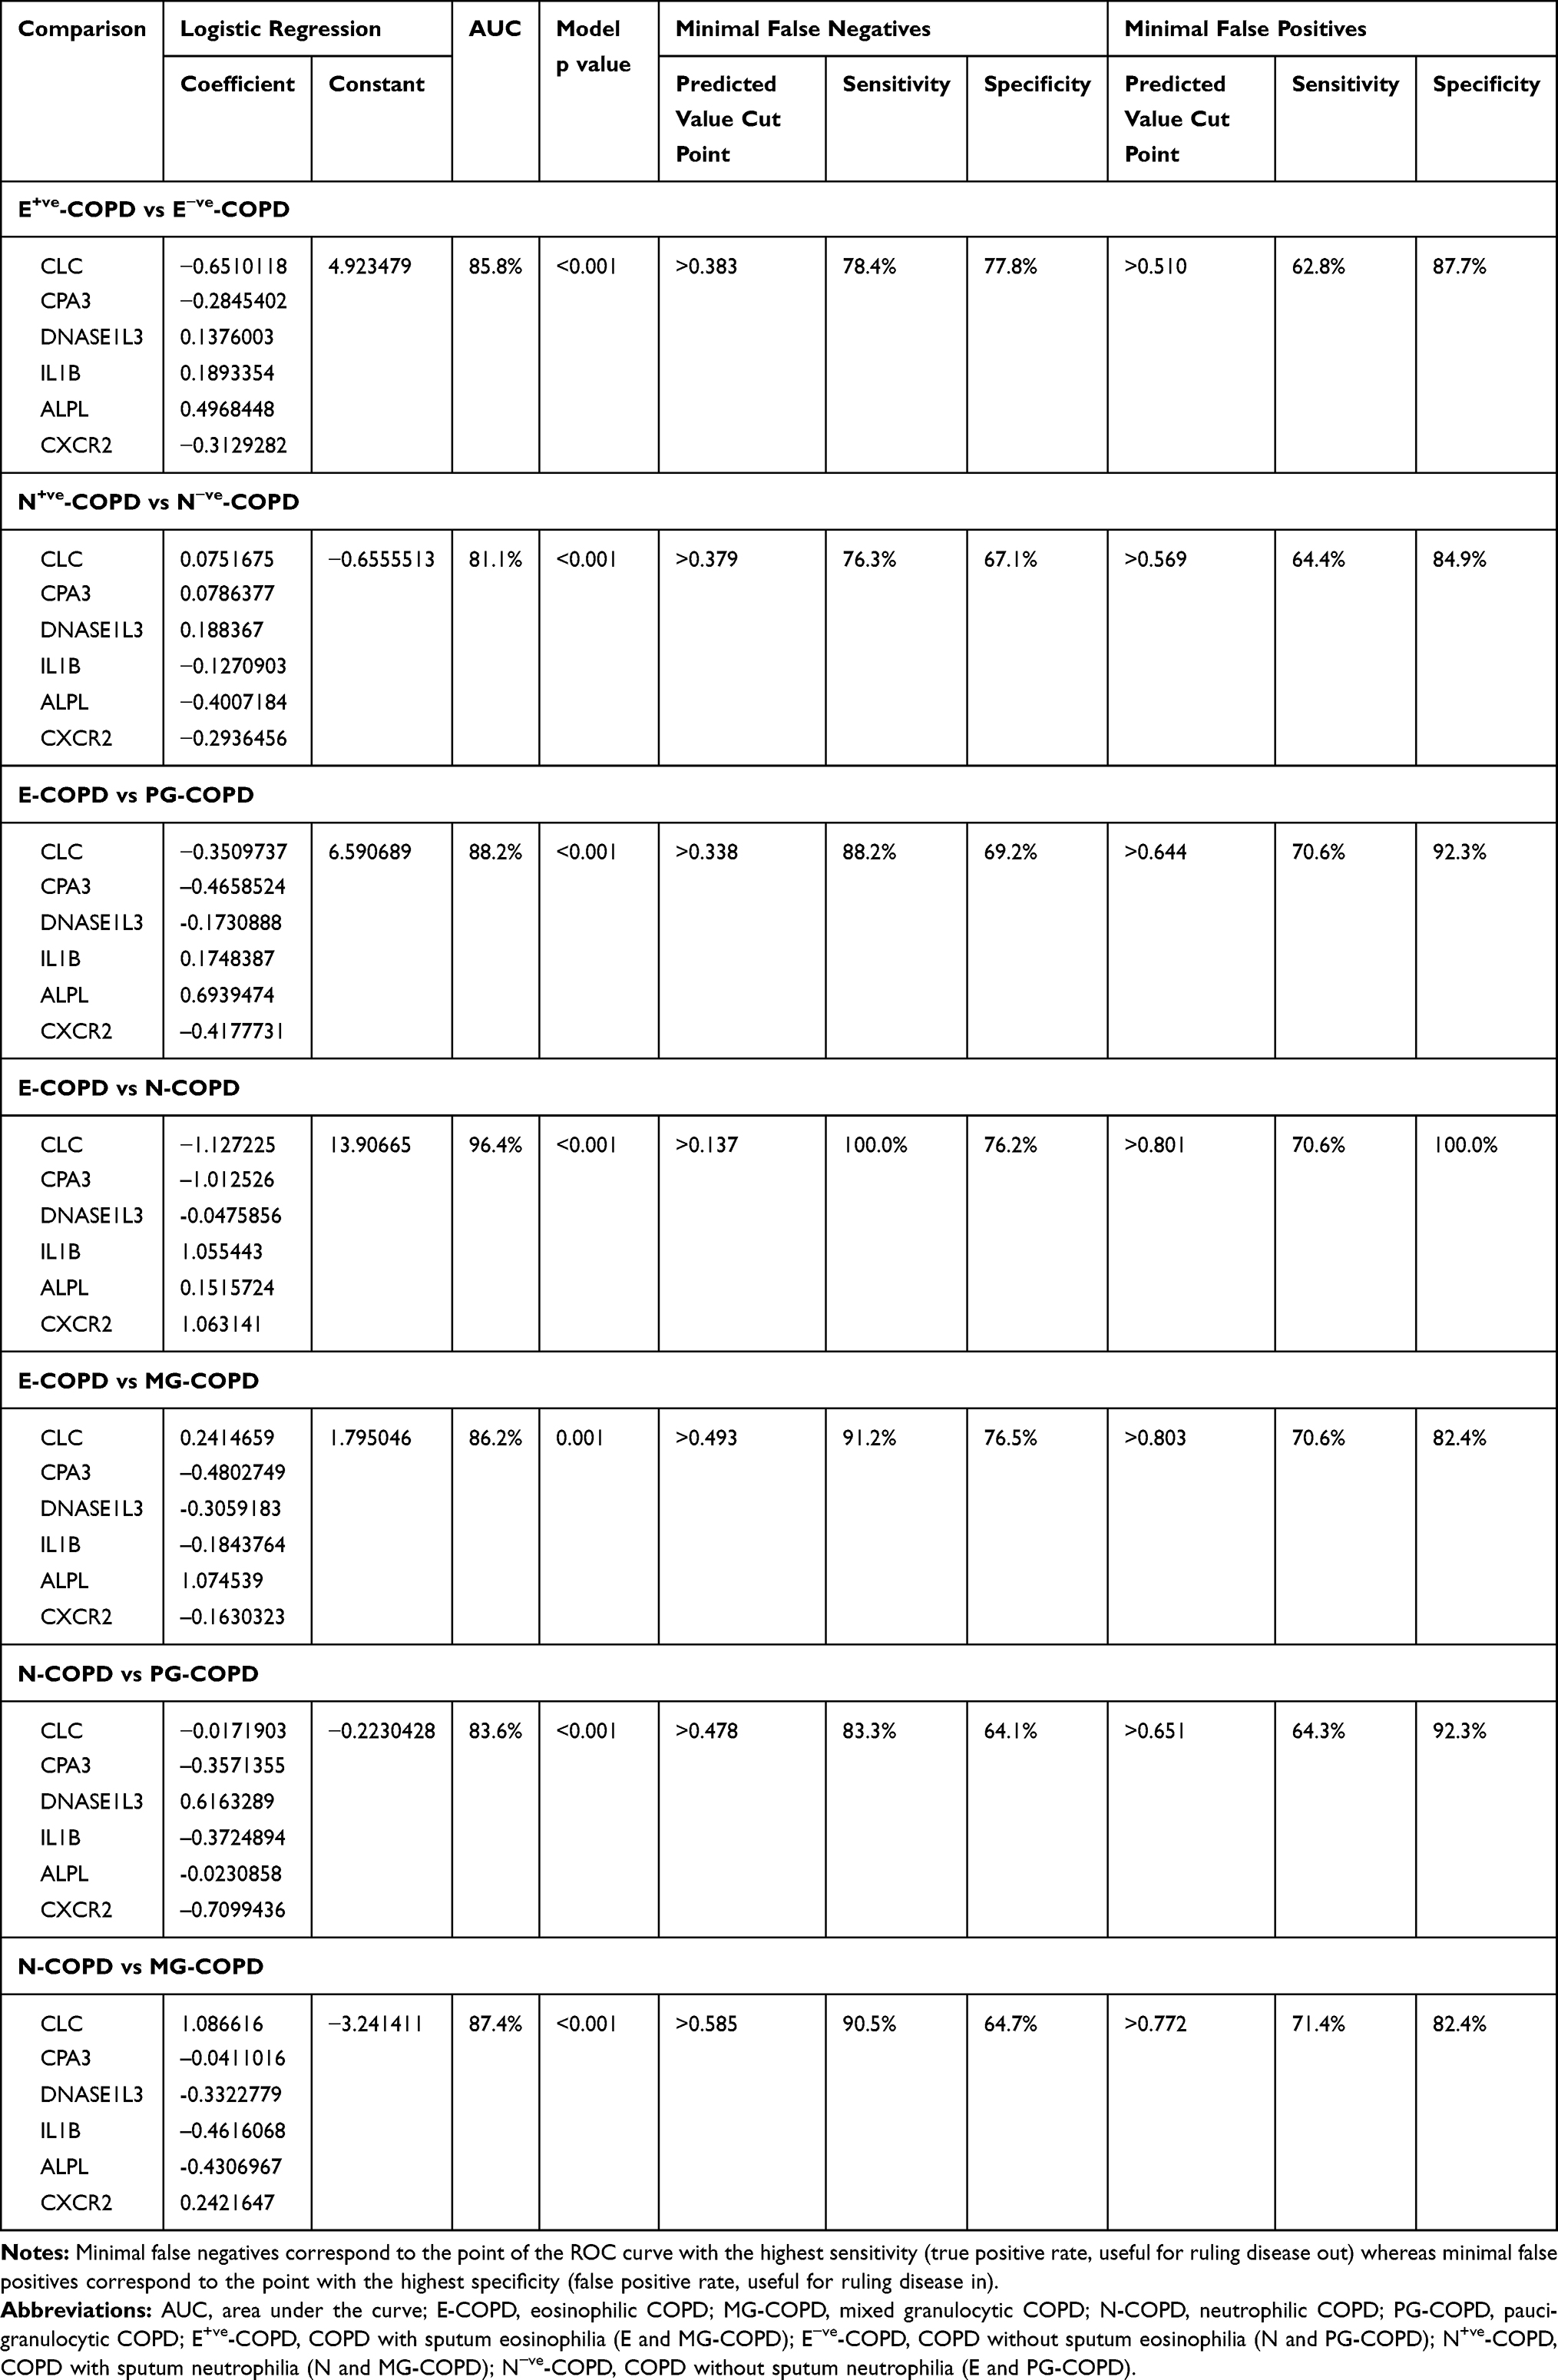 |
Table 3 Phenotype Prediction Study Diagnostic Value of the 6GS for Inflammatory Phenotype of COPD |
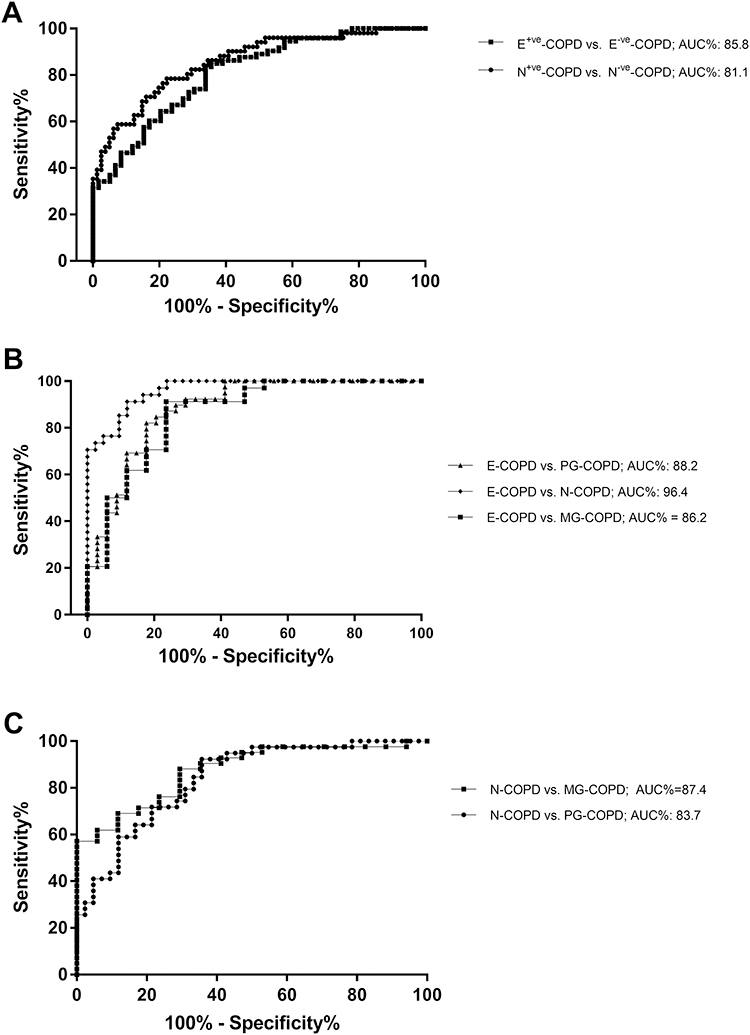 |
Figure 2 Receiver operating characteristic (ROC) curves demonstrate that the sputum 6GS biomarker discriminates (A) eosinophilic (E+ve vs E−ve) and neutrophilic (N+ve vs N−ve) airway inflammation in COPD, and inflammatory phenotypes (B) E-COPD from N, PG and MG-COPD, and (C) N-COPD from PG and MG-COPD. |
At an optimal predicted value cut point of 0.458 (sensitivity=70.6%, specificity=84.0% and positive likelihood ratio=4.4), the sputum 6GS correctly predicted E+ve-COPD from E−ve-COPD in 79 of 100 cases. At an optimal predicted value cut point of 0.549 (sensitivity=66.1%, specificity=83.6% and positive likelihood ratio=4.0), the sputum 6-gene signature correctly identified N+ve -COPD from N−ve-COPD in 76 of 100 cases.
Furthermore, when splitting the participants into 4 inflammatory phenotypes, 6GS could discriminate E-COPD from PG-COPD (AUC%=88.2; 95% CI=80.3–96.2; p<0.001), N-COPD (AUC%=96.4; 95% CI=93.2–99.7; p<0.001), and MG-COPD (AUC%=86.2; 95% CI=74.4–97.9%; p=0.001) (Figure 2B). The 6GS also distinguished N-COPD from PG-COPD (AUC%=83.7; 95% CI=75.1–92.2; p<0.001) and MG-COPD (AUC%=87.4; 95% CI=78.2–96.5; p<0.001) (Figure 2C).
The optimal predicted value (output of the multiple logistic regression combining 6 genes) cut points for the 6-gene expression signature to distinguish E-COPD from PG-COPD and MG-COPD were 0.484 (sensitivity=82.4%, specificity=82.1% and positive likelihood ratio=4.6, correctly classified 82%), and 0.493 (sensitivity=91.2%, specificity=76.5% and positive likelihood ratio=3.9, correctly classified 86%), respectively. The optimal predicted value cut points for the 6-gene expression signature to distinguish N-COPD from PG-COPD and MG-COPD were 0.503 (sensitivity=78.6%, specificity=71.8% and positive likelihood ratio=2.8, correctly classified 75%), and 0.603 (sensitivity=88.1%, specificity=70.6% and positive likelihood ratio=3.0, correctly classified 83%), respectively.
Phenotype Prediction Study: Reproducibility of the 6GS
Sputum gene expression of the 6 biomarkers was measured in 22 participants (n=9 E-COPD, n=9 N-COPD, n=4 PG-COPD) on 2 occasions, a mean (SD) of 37 (20) days apart. Inflammatory phenotype remained the same between the visits. The bias of measurement was small with equal scatter for all genes (Figure S1). ICC coefficients were excellent for CLC (0.78) and IL1B (0.76), good for ALPL (0.65) and CXCR2 (0.60), fair for CPA3 (0.45), and poor for DNASE1L3 (0.33).
Prospective Cohort Study: Using 6GS for Inflammatory Phenotype Prediction
Clinical characteristics of the participants in the prospective cohort study are detailed in Table 1. There were 8 participants with E-COPD, 19 with N-COPD, 20 with PG-COPD and 7 with MG-COPD. To further validate the 6GS prediction of inflammatory phenotypes, we repeated the ROC analysis in this secondary population, which confirmed the 6GS ability to predict phenotypes with high accuracy (Table S1).
To test the clinical utility of the 6GS to predict phenotype in the prospective cohort study (n=54; Table 1), we used the logistic regression equation (detailed in the Supplementary Methods section) to calculate predicted values based on the level of expression of the 6 biomarkers, with the coefficients and constants (Table 3) for each phenotype comparison in question, and the cut points from the ROC curves as described in the phenotype prediction study (Figure 3).
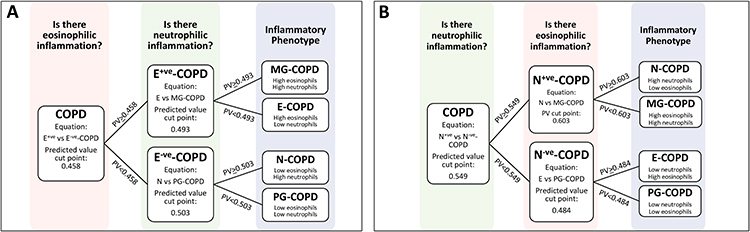 |
Figure 3 Demonstrates the 2 phenotyping strategies that were tested, with (A) taking the approach of detecting eosinophilic inflammation first, and then neutrophilic inflammation, and (B) vice versa. |
Two strategies (two-step process) for predicting the 4 inflammatory phenotypes were tested (Figure 3). In strategy 1, we first determined the presence of eosinophilic inflammation (E+ve vs E−ve-COPD), and secondly the presence of neutrophilic inflammation (in E+ve-COPD, E-COPD vs MG-COPD, and in E−ve-COPD, N-COPD vs PG-COPD, Figure 3). We could successfully predict 53% (8/15) of E+ve-COPD, and 87% (34/39) of E−ve-COPD. Comparison of sputum cell counts and 6GS methods to detect eosinophilic inflammation showed an overall moderate agreement of 78% (expected agreement 62%) with a κ statistic of 0.42 (p<0.001). When classified into the 4 inflammatory phenotypes, there was an overall moderate agreement of 67% (expected agreement 31%) with a κ statistic of 0.52 (p<0.001; Table 4).
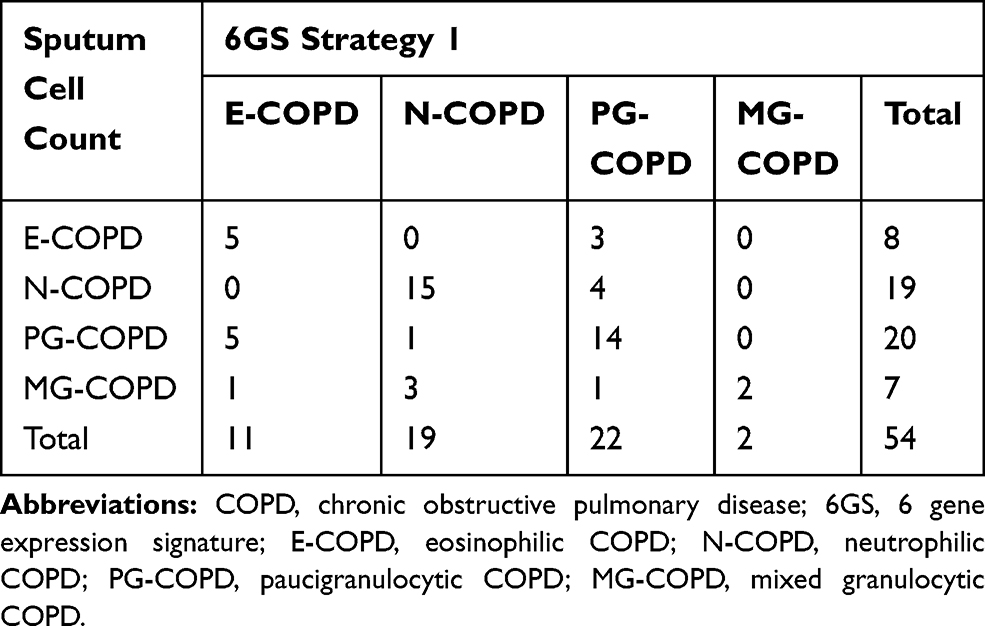 |
Table 4 Prospective Cohort Study Phenotype Prediction, 6GS vs Sputum Cell Counts, Using Strategy 1 |
In strategy 2, we first determined the presence of neutrophilic inflammation, and secondly the presence of eosinophilic inflammation (in N+ve-COPD, N-COPD vs MG-COPD, and in N−ve-COPD, E-COPD vs PG-COPD; Figure 3). We could successfully predict 81% (21/26) of participants with N+ve-COPD, and 82% (23/28) participants with N−ve-COPD. Comparison of sputum cell counts and 6GS methods to detect neutrophilic inflammation showed an overall substantial agreement of 81.5% (expected agreement 50%) with a kappa statistic of 0.63 (p<0.001). When classified into the 4 inflammatory phenotypes, there was an overall moderate agreement of 69% (expected agreement 30%) with a κ statistic of 0.55 (p<0.001; Table 5).
 |
Table 5 Prospective Cohort Study Phenotype Prediction, 6GS vs Sputum Cell Counts Using Strategy 2 |
Between the two 6GS phenotype strategies, there was an overall substantial agreement of 76% (expected agreement 32%) with a κ statistic of 0.65 (p<0.001). However, predicting neutrophilic inflammation first (strategy 2) was slightly improved at predicting inflammatory phenotype as determined by sputum cell count.
Prospective Cohort Study: 6GS and Predicting Exacerbation Prone Patients
To further investigate the clinical utility of the 6GS we investigated whether the gene signature could predict exacerbation prone COPD patients (≥2 exacerbations in 12 months following sputum collection, n=21). The 6GS could predict exacerbation prone patients (AUC=77.2%; 95% CI: 63.6–90.8; p=0.034; Figure 4, Table S2), better than sputum cell counts (6GS vs sputum neutrophil%: p=0.016; 6GS vs sputum eosinophil%: p=0.050; 6GS vs sputum neutrophil% and eosinophil% combined: p=0.029, Figure 4, Table S2). The optimal predicted cut point for the 6GS to distinguish COPD exacerbation prone patients was 0.539 (sensitivity=57.1%, specificity=90.9% and positive likelihood ratio=6.3, correctly classified 78%).
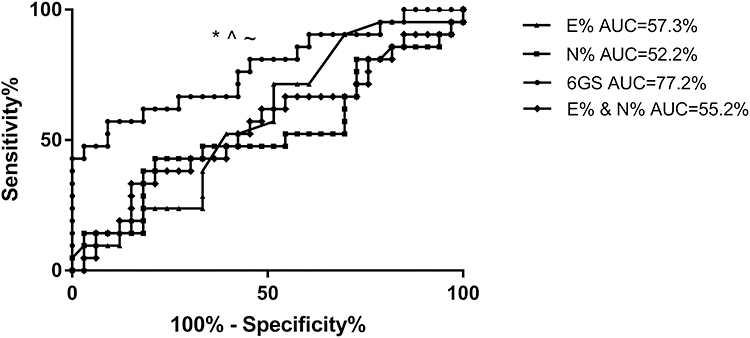 |
Figure 4 Receiver operating characteristic (ROC) curves demonstrate that the sputum 6GS biomarker significantly discriminates COPD participants who experienced frequent (>2) exacerbations in the following year, whereas sputum neutrophils and eosinophils did not discriminate frequent exacerbators. *p=0.016 6GS vs sputum neutrophil% (AUC=52.2%, p=0.783), ^p=0.050 vs sputum eosinophils (AUC=57.3%, p=0.370), ~p=0.029 vs sputum eosinophil% and neutrophil% combined (AUC=55.2%, p=0.939). |
We then further investigated whether 6GS can predict the type of exacerbations experienced, including hospital admission (n=8), frequent (≥2) GP visits (n=11), frequent (≥2) OCS courses (n=12), and frequent (≥2) antibiotics courses (n=20). The 6GS was able to significantly discriminate future hospitalisation (AUC=87%; p=0.028) and frequent OCS courses (AUC=81.6%; p=0.0156); however, 6GS did not significantly predict frequent GP visits or frequent antibiotic courses from the rest of the group.
Correlations of Gene Expression Markers with Clinical Outcomes
Elevated gene expression levels of IL1B had a weak but significant association with post-bronchodilator FEV1%predicted (r=−0.32; p<0.0001; Figure 5A). Elevated expression of ALPL also correlated with poor lung function (FEV1%predicted r=−0.33; p<0.001). Gene expression of IL1B (Figure 5B; p<0.001), ALPL (p<0.001) and CXCR2 (p=0.017) was significantly higher in participants in GOLD grade 4 especially when compared with those in GOLD grades 1 and 2. Neutrophil related signatures were associated with BODE index (IL1B: Figure 5C; r=0.31; p<0.001, ALPL: r=0.32; p=0.002,). CLC, CPA3 and DNASE1L3 did not show any significant correlation with above mentioned clinical outcomes.
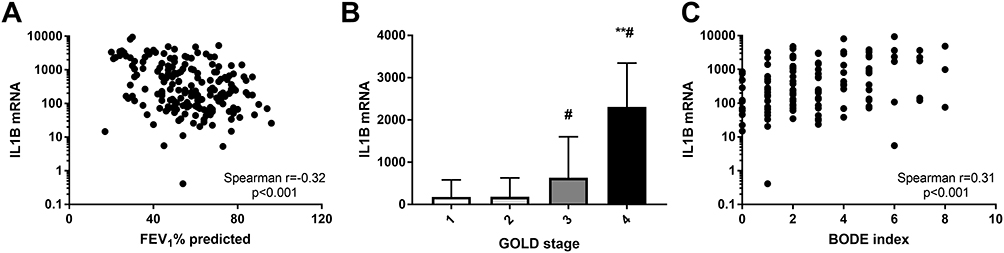 |
Figure 5 Sputum gene expression of IL1B correlates with (A) FEV1% predicted; (B) GOLD stage and (C) BODE index. **p<0.001 versus GOLD stage 1 and GOLD stage 2; #p<0.05 versus GOLD stage 3. |
Discussion
This study, which examined the diagnostic ability of a sputum 6GS in predicting airway inflammatory phenotypes in COPD, had a number of significant findings. We have shown that the 6GS can distinguish between patients with different inflammatory phenotypes of COPD, with a substantial degree of accuracy and reproducibility. We demonstrated the clinical utility of 6GS by investigating 2 prediction strategies which showed significant agreement between cell counts and 6GS for detecting COPD phenotype. 6GS was also able to predict participants who experienced frequent (≥2) exacerbations in the following 12 months. Similar to our previous findings in asthma,7 expression of CLC, CPA3 and DNASE1L3 was higher in participants with airway eosinophilia, and expression of IL1B, ALPL and CXCR2 was higher in those with airway neutrophilia. Elevated expression levels of genes associated with neutrophilic inflammation, in particular IL1B, were associated with poorer lung function, severity (GOLD stage) and a higher BODE index.
There have been significant advances in molecular phenotyping of asthma and asthma-COPD overlap using transcriptomic profiling of samples obtained from bronchial or nasal airway brushings, induced sputum or blood.7,8,24–30 We have previously discovered and developed a qPCR-based test measuring the expression levels of 6 genes (CLC, CPA3, DNASE1L3, IL1B, ALPL and CXCR2) in sputum samples, which can reproducibly differentiate inflammatory phenotypes of asthma, predict both ICS7 and OCS9 responsiveness better than sputum eosinophil count, and predict exacerbation prone patients with poorly controlled asthma.10 We confirmed the regulation of expression of the 6GS biomarkers in COPD was similar to asthma, with CLC, CPA3 and DNASE1L3 were highly expressed in eosinophilic inflammation, and higher expression of IL1B, ALPL and CXCR2 characterized neutrophilic inflammation.7 The crystal structures of CLC protein have classically been observed in tissues and secretions from eosinophil-associated diseases.31 CPA3 is known to be expressed largely in mast cells,32 but also basophils33 and is differentially expressed in airway epithelial brushings25 and sputum from patients with asthma.34
In the present study, we show that the 6GS differentiates E-COPD from other inflammatory phenotypes with high accuracy, similar to our asthma data.7,10 Of note, it was not possible to distinguish E-COPD using clinical criteria. This suggests that a genomic approach may be a more reliable, accurate and sensitive means to characterise phenotypes of COPD. Moreover, akin to our findings in asthma,7,10 the present study also showed that CLC, CPA3 and DNASE1L3 were highly expressed in E-COPD. This finding may be indicative that eosinophilic inflammation in both asthma and COPD may share common pathways and mechanisms such as the involvement of mast cells34 and basophils, and/or the levels of these mRNAs are overrepresenting the cells of interest, thus providing predictive value of cellular phenotype in sputum regardless of the disease context. Given the similarities between eosinophilia in asthma and eosinophilic COPD, this is a trait that should be targeted with treatments,35 in which case biomarkers to identify suitable patients will be of great advantage.
This study demonstrated that 6GS could also predict exacerbation prone COPD patients, whereas sputum cell counts could not. This may be driven partly by the expression of IL-1β, which we have previously shown, along with IL-1 pathway activation, can predict future frequent exacerbations.11,12 In addition, Bafadhel et al5 have shown that sputum IL-1β levels are also increased in COPD exacerbations, predicting those exacerbations associated with bacterial infection.
COPD exacerbations are associated with higher healthcare burden, disease progression and increased mortality. Further investigation into biomarkers that are predictive of exacerbation susceptibility are of urgent need, as current strategies based on clinical factors, such as exacerbation history19 are limited, and fail to target underlying biological mechanisms. Early intervention gives an opportunity to optimise treatment and prevent progression of the disease. Pulmonary biomarkers for exacerbations have been investigated (reviewed in36), and show promise, however, no single marker is adequately validated for clinical use. Recent blood biomarker analysis of the SPIROMICS and COPDGene cohorts has shown limited exacerbation prediction, with poor reproducibility between cohorts, and the markers only marginally improving predictive rates of clinical variables.37
Evidence in the literature suggests that treatment with either OCS or ICS has little effect in lessening neutrophilic airway inflammation in COPD,38,39 and new treatment approaches including selective phosphodiesterase (PDE) inhibitors and macrolide antibiotics3,40 are thus being tested. As Dasgupta et al41 pointed out the key to the success of clinical trials on novel treatment approaches targeting airway inflammation in COPD and asthma mainly depend on the ability to accurately phenotype patients using methods employing non-invasive inflammometry techniques to provide information as to possible mechanisms, mediators or cytokines involved in the disease pathogenesis. Application of molecular signatures, such as the 6GS, has the ability to revolutionise the field of personalised medicine, providing sensitive biomarkers that represent underlying disease endotypes that can be specifically targeted with treatments.
In the present study, we have also succeeded in showing that the sputum 6-gene signature can distinguish MG-COPD from other inflammatory phenotypes of COPD with an excellent accuracy. MG-COPD participants had higher CLC, ALPL and CXCR2, but no difference in CPA3, DNASE1L3 or IL1B. Interestingly, the MG-COPD group did not appear to have an elevated CPA3, DNASE1L3 or IL1B signal, suggesting there are potentially different mechanisms at play, and that E-COPD may have a stronger mast cell/basophil component. These findings are clinically relevant, as so far there is no specific therapeutic regimen available for either asthma or COPD associated with mixed eosinophilic and neutrophilic airway inflammation.41 This also demonstrates the importance of measuring activation of pathobiological mechanisms, as there could be several underlying factors that result influx of airway inflammatory cells, and therefore treatments targeting particular pathways will be more effective in selected patients where those mechanisms are active.
This study has a number of limitations, including a small sample size that will ultimately need further validation in larger numbers of COPD patients, particularly in relation to the exacerbation prediction. We do not understand the influence of COPD treatments of gene expression levels, and although we could hypothesise that the 6GS is predictive of corticosteroid response as per our asthma data, we need to further test the ability of the biomarker to predict treatment responsiveness. Both CPA3 and DNASE1L3 were detected less and had a poorer reproducibility, most likely because of these lower detection rates, however they are still important in E-COPD. Although having a biomarker signature for inflammatory phenotype regardless of the respiratory disease does have advantages, further transcriptomic studies of COPD are warranted and have the potential to identify COPD specific biomarkers for inflammatory phenotype, which may differ from asthma. Further studies are also required to understand stability of COPD inflammatory phenotypes and their relation to 6GS expression levels.
In summary, the present study has shown that the sputum 6-gene expression signature of CLC, CPA3, DNASE1L3, IL1B, ALPL and CXCR2 can serve as a discriminatory biomarker for airway inflammatory phenotypes and exacerbation prone COPD patients. CLC, CPA3 and DNASE1L3 were associated with eosinophilic inflammation and IL1B, ALPL and CXCR2 were associated with neutrophilic inflammation. Neutrophilic gene signatures were associated with poor lung function, systemic inflammation, comorbidity, and BODE index. This gene expression signature has the potential to become a useful tool in guiding the management of COPD and accurately identifying phenotypes with different underlying mechanisms and treatment responses.
Acknowledgments
The authors would like to acknowledge the technical assistance of Naomi Fibbens, Gabrielle Le Brocq, Clare Powell, Amber Smith, Brooke Emmett, Penelope Chan, Bridgette Ridewood, Michelle Gleeson, Kellie Fakes, and Heather Macdonald.
Author Contributions
KJB had full access to all data in the study and takes responsibility for the integrity of the data and accuracy of the data analysis. All authors participated in aspects of the study design and development and interpretation of the results. KJB and NN conducted the data analysis and wrote the manuscript. All authors edited and approved the final version of the manuscript. PGG, JJF, JLS, PABW, and VMM provided critical input into the clinical aspects of this study. PGG and VMM designed the clinical data collection studies and supervised clinical data collection. PGG supervised the sputum induction and induced sputum cell counts for inflammatory phenotyping. KJB supervised the sample processing and laboratory analysis. All authors contributed to data analysis, drafting or revising the article, gave final approval of the version to be published, and agree to be accountable for all aspects of the work.
Disclosure
JJ Fu, N Negewo, JL Simpson and PAB Wark have nothing to disclose. Dr. Baines reports grants from NHMRC, during the conduct of the study; grants from Lung Foundation of Australia and Thoracic Society of Australia and New Zealand/National Asthma Council, outside the submitted work; in addition, Dr. Baines has a National Phase Patent pending: P558 PCT/AU2018/050644. Prof Gibson reports grants from NHMRC, during the conduct of the study; personal fees from AstraZeneca, GSK, Novartis, and Sanofi outside the submitted work; in addition, Prof Gibson has a patent gene signature pending (National Phase Patent). Dr Michael Fricker reports grants from Thoracic Society of Australia and New Zealand and NHMRC, during the conduct of the study. Prof McDonald reports grants from NHMRC, Lung Foundation of Australia, and Ramaciotti Foundation, during the conduct of the study; grants and personal fees from GSK and AstraZeneca, and personal fees from Menarini, outside the submitted work. The authors report no other possible conflicts of interest in this work.
References
1. Lozano R, Naghavi M, Foreman K, et al. Global and regional mortality from 235 causes of death for 20 age groups in 1990 and 2010: a systematic analysis for the Global Burden of Disease Study 2010. Lancet. 2012;380(9859):2095–2128. doi:10.1016/S0140-6736(12)61728-0
2. Quaderi SA, Hurst JR. The unmet global burden of COPD. Glob Health Epidemiol Genom. 2018;3:e4. doi:10.1017/gheg.2018.1
3. McDonald VM, Higgins I, Wood LG, et al. Multidimensional assessment and tailored interventions for COPD: respiratory utopia or common sense? Thorax. 2013;68(7):691–694. doi:10.1136/thoraxjnl-2012-202646
4. George L, Brightling CE. Eosinophilic airway inflammation: role in asthma and chronic obstructive pulmonary disease. Ther Adv Chronic Dis. 2016;7(1):34–51. doi:10.1177/2040622315609251
5. Bafadhel M, McKenna S, Terry S, et al. Acute exacerbations of chronic obstructive pulmonary disease: identification of biologic clusters and their biomarkers. Am J Respir Crit Care Med. 2011;184(6):662–671. doi:10.1164/rccm.201104-0597OC
6. Baines KJ, Pavord ID, Gibson PG. The role of biomarkers in the management of airways disease. Int J Tuberc Lung Dis. 2014;18(11):1264–1268. doi:10.5588/ijtld.14.0226
7. Baines KJ, Simpson JL, Wood LG, et al. Sputum gene expression signature of 6 biomarkers discriminates asthma inflammatory phenotypes. J Allergy Clin Immunol. 2014;133(4):997–1007. doi:10.1016/j.jaci.2013.12.1091
8. Baines KJ, Simpson JL, Wood LG, et al. Transcriptional phenotypes of asthma defined by gene expression profiling of induced sputum samples. J Allergy Clin Immunol. 2011;127(1):153–160. doi:10.1016/j.jaci.2010.10.024
9. Berthon BS, Gibson PG, Wood LG, et al. A sputum gene expression signature predicts oral corticosteroid response in asthma. Eur Respir J. 2017;49(6):1700180. doi:10.1183/13993003.00180-2017
10. Fricker M, Gibson PG, Powell H, et al. A sputum 6-gene signature predicts future exacerbations of poorly controlled asthma. J Allergy Clin Immunol. 2019;144(1):51–60.e11. doi:10.1016/j.jaci.2018.12.1020
11. Baines KJ, Fu -J-J, McDonald V, et al. Airway gene expression of IL-1 pathway mediators predicts exacerbation risk in obstructive airway disease. Int J Chron Obstruct Pulmon Dis. 2017;12:541–550. doi:10.2147/COPD.S119443
12. Fu -J-J, McDonald VM, Baines KJ, et al. Airway IL-1β and systemic inflammation as predictors of future exacerbation risk in asthma and COPD. Chest. 2015;148(3):618–629. doi:10.1378/chest.14-2337
13. From the global strategy for the diagnosis and management and prevention of COPD, global initiative for chronic obstructive lung disease (GOLD) 2016 [Internet]. Available from: http://goldcopd.org/.
14. Charlson ME, Pompei P, Ales KL, et al. A new method of classifying prognostic comorbidity in longitudinal studies: development and validation. J Chronic Dis. 1987;40(5):373–383. doi:10.1016/0021-9681(87)90171-8
15. Jones PW, Quirk FH, Baveystock CM, et al. A self-complete measure of health status for chronic airflow limitation. The St. George’s Respiratory Questionnaire. Am Rev Respir Dis. 1992;145:1321–1327. doi:10.1164/ajrccm/145.6.1321
16. Celli BR, Cote CG, Marin JM, et al. The body-mass index, airflow obstruction, dyspnea, and exercise capacity index in chronic obstructive pulmonary disease. N Engl J Med. 2004;350(10):1005–1012. doi:10.1056/NEJMoa021322
17. Miller M. Standardisation of spirometry. Eur Respir J. 2005;26(2):319–338. doi:10.1183/09031936.05.00034805
18. Simpson JL, SCOTT R, BOYLE MJ, et al. Inflammatory subtypes in asthma: assessment and identification using induced sputum. Respirology. 2006;11(1):54–61. doi:10.1111/j.1440-1843.2006.00784.x
19. Hurst JR, Vestbo J, Anzueto A, et al. Susceptibility to exacerbation in chronic obstructive pulmonary disease. N Engl J Med. 2010;363(12):1128–1138. doi:10.1056/NEJMoa0909883
20. Leigh R, Pizzichini MMM, Morris MM, et al. Stable COPD: predicting benefit from high-dose inhaled corticosteroid treatment. Euro Respir J. 2006;27(5):964–971. doi:10.1183/09031936.06.00072105
21. Negewo N, McDonald V, Baines K, et al. Peripheral blood eosinophils: a surrogate marker for airway eosinophilia in stable COPD. Int J Chron Obstruct Pulmon Dis. 2016;11:1495–1504. doi:10.2147/COPD.S100338
22. Pavord ID, Brightling CE, Woltmann G, et al. Non-eosinophilic corticosteroid unresponsive asthma. Lancet. 1999;353:2213–2214. doi:10.1016/S0140-6736(99)01813-9
23. Simpson JL, Powell H, Baines KJ, et al. The effect of azithromycin in adults with stable neutrophilic COPD: a double blind randomised, placebo controlled trial. PLoS One. 2014;9(8):e105609. doi:10.1371/journal.pone.0105609
24. Wesolowska-Andersen A, Seibold MA. Airway molecular endotypes of asthma: dissecting the heterogeneity. Curr Opin Allergy Clin Immunol. 2015;15(2):163–168. doi:10.1097/ACI.0000000000000148
25. Woodruff PG, Boushey HA, Dolganov GM, et al. Genome-wide profiling identifies epithelial cell genes associated with asthma and with treatment response to corticosteroids. Proc Natl Acad Sci USA. 2007;104(40):15858–15863. doi:10.1073/pnas.0707413104
26. Christenson SA, Steiling K, van den Berge M, et al. Asthma-COPD overlap. Clinical relevance of genomic signatures of type 2 inflammation in chronic obstructive pulmonary disease. Am J Respir Crit Care Med. 2015;191:758–766. doi:10.1164/rccm.201408-1458OC
27. Yan X, Chu J-H, Gomez J, et al. Noninvasive analysis of the sputum transcriptome discriminates clinical phenotypes of asthma. Am J Respir Crit Care Med. 2015;191(10):1116–1125. doi:10.1164/rccm.201408-1440OC
28. Poole A, Urbanek C, Eng C, et al. Dissecting childhood asthma with nasal transcriptomics distinguishes subphenotypes of disease. J Allergy Clin Immunol. 2014;133(3):670–678. doi:10.1016/j.jaci.2013.11.025
29. Gibson PG, McDonald VM. Phenotyping asthma and chronic obstructive pulmonary disease (COPD). BRN Rev. 2016;2:239–252.
30. Kuo CS, Pavlidis S, Loza M, et al. A transcriptome-driven analysis of epithelial brushings and bronchial biopsies to define asthma phenotypes in U-BIOPRED. Am J Respir Crit Care Med. 2017;195:443–455. doi:10.1164/rccm.201512-2452OC
31. Leonidas DD, Elbert BL, Zhou Z, et al. Crystal structure of human Charcot-Leyden crystal protein, an eosinophil lysophospholipase, identifies it as a new member of the carbohydrate-binding family of galectins. Structure. 1995;3:1379–1393. doi:10.1016/S0969-2126(01)00275-1
32. Trivedi NN, Caughey GH. Mast cell peptidases: chameleons of innate immunity and host defense. Am J Respir Cell Mol Biol. 2010;42(3):257–267. doi:10.1165/rcmb.2009-0324RT
33. Dwyer DF, Barrett NA, Austen KF, et al. Expression profiling of constitutive mast cells reveals a unique identity within the immune system. Nat Immunol. 2016;17(7):878. doi:10.1038/ni.3445
34. Wang G, Baines KJ, Fu JJ, et al. Sputum mast cell subtypes relate to eosinophilia and corticosteroid response in asthma. Eur Respir J. 2016;47(4):1123–1133. doi:10.1183/13993003.01098-2015
35. Bel EH, Ten Brinke A. New anti-eosinophil drugs for asthma and COPD: targeting the trait! Chest. 2017;152:1276–1282. doi:10.1016/j.chest.2017.05.019
36. Koutsokera A, Kostikas K, Nicod LP, et al. Pulmonary biomarkers in COPD exacerbations: a systematic review. Respir Res. 2013;14(1):111. doi:10.1186/1465-9921-14-111
37. Keene JD, Jacobson S, Kechris K, et al. Biomarkers predictive of exacerbations in the SPIROMICS and COPD Gene cohorts. Am J Respir Crit Care Med. 2017;195(4):473–481. doi:10.1164/rccm.201607-1330OC
38. Culpitt SV, MAZIAK W, LOUKIDIS S, et al. Effect of high dose inhaled steroid on cells, cytokines, and proteases in induced sputum in chronic obstructive pulmonary disease. Am J Respir Crit Care Med. 1999;160(5):1635–1639. doi:10.1164/ajrccm.160.5.9811058
39. Keatings VM, Jatakanon A, Worsdell YM, et al. Effects of inhaled and oral glucocorticoids on inflammatory indices in asthma and COPD. Am J Respir Crit Care Med. 1997;155:542–548. doi:10.1164/ajrccm.155.2.9032192
40. Siddiqui S, Brightling CE. Airways disease: phenotyping heterogeneity using measures of airway inflammation. Allergy Asthma Clin Immunol. 2007;3:60–69. doi:10.1186/1710-1492-3-2-60
41. Dasgupta A, Neighbour H, Nair P. Targeted therapy of bronchitis in obstructive airway diseases. Pharmacol Ther. 2013;140(3):213–222. doi:10.1016/j.pharmthera.2013.07.001
 © 2020 The Author(s). This work is published and licensed by Dove Medical Press Limited. The
full terms of this license are available at https://www.dovepress.com/terms
and incorporate the Creative Commons Attribution
- Non Commercial (unported, 3.0) License.
By accessing the work you hereby accept the Terms. Non-commercial uses of the work are permitted
without any further permission from Dove Medical Press Limited, provided the work is properly
attributed. For permission for commercial use of this work, please see paragraphs 4.2 and 5 of our Terms.
© 2020 The Author(s). This work is published and licensed by Dove Medical Press Limited. The
full terms of this license are available at https://www.dovepress.com/terms
and incorporate the Creative Commons Attribution
- Non Commercial (unported, 3.0) License.
By accessing the work you hereby accept the Terms. Non-commercial uses of the work are permitted
without any further permission from Dove Medical Press Limited, provided the work is properly
attributed. For permission for commercial use of this work, please see paragraphs 4.2 and 5 of our Terms.