Back to Journals » Journal of Hepatocellular Carcinoma » Volume 10
A Single-Step Immunocapture Assay to Quantify HCC Exosomes Using the Highly Sensitive Fluorescence Nanoparticle-Tracking Analysis
Authors Koksal AR, Ekmen N, Aydin Y, Nunez K, Sandow T, Delk M, Moehlen M, Thevenot P, Cohen A, Dash S
Received 15 June 2023
Accepted for publication 7 October 2023
Published 2 November 2023 Volume 2023:10 Pages 1935—1954
DOI https://doi.org/10.2147/JHC.S423043
Checked for plagiarism Yes
Review by Single anonymous peer review
Peer reviewer comments 3
Editor who approved publication: Prof. Dr. Imam Waked
Ali Riza Koksal,1 Nergiz Ekmen,2 Yucel Aydin,2 Kelley Nunez,3 Tyler Sandow,4 Molly Delk,2 Martin Moehlen,2 Paul Thevenot,3 Ari Cohen,3,5 Srikanta Dash1,2,6
1Department of Pathology and Laboratory Medicine, Tulane University Health Sciences Center, New Orleans, LA, USA; 2Department of Gastroenterology and Hepatology, Tulane University Health Sciences Center, New Orleans, LA, USA; 3Department of Gastroenterology and Hepatology, Institute of Translational Research, Ochsner Health, New Orleans, LA, USA; 4Department of Radiology, Institute of Translational Research, Ochsner Health, New Orleans, LA, USA; 5Multi-Organ Transplant Institute, Ochsner Health, New Orleans, LA, USA; 6Southeast Louisiana Veterans Health Care System, New Orleans, LA, USA
Correspondence: Srikanta Dash, Department of Pathology and Laboratory Medicine, Tulane University Health Sciences Center, 1430 Tulane Avenue, New Orleans, LA, 70112, USA, Tel +1 504-988-2519, Fax +1 504-988-7389, Email [email protected]
Introduction: Extracellular vesicles could serve as a non-invasive biomarker for early cancer detection. However, limited methods to quantitate cancer-derived vesicles in the native state remain a significant barrier to clinical translation.
Aim: This research aims to develop a rapid, one-step immunoaffinity approach to quantify HCC exosomes directly from a small serum volume.
Methods: HCC-derived exosomes in the serum were captured using fluorescent phycoerythrin (PE)-conjugated antibodies targeted to GPC3 and alpha-fetoprotein (AFP). Total and HCC-specific exosomes were then quantified in culture supernatant or patient-derived serums using fluorescence nanoparticle tracking analysis (F-NTA). The performance of HCC exosome quantification in the serum was compared with the tumor size determined by MRI.
Results: Initially we tested the detection limits of the F-NTA using synthetic fluorescent and non-fluorescent beads. The assay showed an acceptable sensitivity with a detection range of 104– 108 particles/mL. Additionally, the combination of immunocapture followed by size-exclusion column purification allows the isolation of smaller-size EVs and quantification by F-NTA. Our assay demonstrated that HCC cell culture releases a significantly higher quantity of GPC3 or GPC3+AFP positive EVs (100– 200 particles/cell) compared to non-HCC culture (10– 40 particles/cell) (p< 0.01 and p< 0.05 respectively). The F-NTA enables absolute counting of HCC-specific exosomes in the clinical samples with preserved biological immunoreactivity. The performance of F-NTA was clinically validated in serum from patients ± cirrhosis and with confirmed HCC. F-NTA quantification data show selective enrichment of AFP and GPC3 positive EVs in HCC serum compared to malignancy-free cirrhosis (AUC values for GPC3, AFP, and GPC3/AFP were found 0.79, 0.71, and 0.72 respectively). The MRI-confirmed patient cohort indicated that there was a positive correlation between total tumor size and GPC3-positive exosome concentration (r:0.78 and p< 0.001).
Conclusion: We developed an immunocapture assay that can be used for simultaneous isolation and quantification of HCC-derived exosomes from a small serum volume with high accuracy.
Keywords: hepatocellular carcinoma, HCC, extracellular vesicles, EVs, glypican 3, GPC3, alpha-fetoprotein, AFP, magnetic resonance imaging, MRI, area under the curve, AUC
Introduction
Primary liver cancers, including hepatocellular carcinoma (HCC) and intrahepatic cholangiocarcinoma (ICC), are the leading cause of cancer-related death worldwide.1–4 HCC accounts for 80–90% of primary liver cancer and most often develops in the context of cirrhosis due to viral or non-viral chronic liver disease.5 The hazard ratios for developing HCC are higher in patients with chronic viral hepatitis due to Hepatitis C (HCV) or Hepatitis B (HBV).6 HCV infection can be cured with direct-acting antivirals (DAAs) which have begun to decrease the incidence of HCV-HCC.7,8 However, the most prominent non-viral etiologies, alcoholic and non-alcoholic fatty liver disease, cause hepatic steatosis that can progress to cirrhosis and HCC.9,10 Recent projections estimate HCC incidence will increase worldwide among the aged population with metabolic syndrome, diabetes, and toxic environmental exposure.11,12 An alarming majority of HCC is diagnosed at an advanced stage and accompanied by a dismal prognosis with limited treatment options.13 Driven by a high mortality rate, HCC is now the third-leading cause of cancer-related death. The current American Association for the Study of Liver Diseases guideline recommends biannual surveillance in patients with cirrhosis using liver ultrasound ± serum alpha-fetoprotein (AFP) for early detection of HCC.14 The sensitivity of this AFP-based HCC surveillance is between 60% and 70%, with a specificity of 90%.15–17 There remains an urgent need to expand HCC biomarkers to improve early detection, access to curative treatment options, and overall outcomes.
Extracellular vesicles (EV) are nanometer size, closed lipid-bilayer vesicles naturally released by most cells in the body. Recent studies have shown that EV release plays many important roles in facilitating intracellular communication in both normal and pathological conditions. EV release occurs through outward budding of the plasma membrane or multivesicular body fusion with the plasma membrane.18 EV shedding plays a critical role in maintaining homeostasis, cell-to-cell communication, inflammation, aging, metabolic diseases, neurological diseases, and cancer. The EV release was also demonstrated in plants and bacteria indicating this process is evolutionarily conserved.19,20 Each cell type in our body fine-tunes EV biogenesis with a specific lipid, protein, and nucleic acid composition depending on its metabolic state.21 EV release is controlled by autophagy and intracellular membrane trafficking and helps maintain normal cellular function.22 In stressed conditions, EV release can signal disease onset and organ dysfunction.23
In addition to releasing hepatic EVs, the liver plays a central role in clearing EVs from systemic circulation.24,25 Hepatic EVs quantification has emerged as a promising prognostic indicator for early assessment of chronic liver disease, and progression to cirrhosis, and HCC.26–28 ASGPR1 is a transmembrane molecule expressed in the sinusoidal and basolateral membrane of hepatocytes, but not in the bile canalicular apical membrane.29,30 High percentage of HCC lost polarized expression of ASGPR1. The ASGPR1 expression in the EV can be used as a marker to assess the polarized EV release from the liver.31,32 Our recent study shows that the integrated stress response (ISR) and hepatic adaptive plasticity caused by HCV replication led to impaired autophagy and increased EV release in the cell culture model.33 We demonstrated HCC development in the cirrhotic liver is accompanied by impaired autophagy and increased EV shedding (microvesicle and exosomes).34–37 This data is consistent with reports from other researchers indicating that cancer cells secrete significantly higher amounts of exosomes and microvesicles than normal cells, which could be harnessed as a minimally invasive biomarker for cancer diagnosis.38,39 However, isolating and quantifying organ-specific exosomes has created a significant hurdle to establishing causal relationships between EV biology and underlying disease. The ability to accurately quantify specific exosome subsets in the blood would help establish and distinguish EV-based non-invasive diagnostics in HCC surveillance. Several methods have been utilized for the exosome quantification, including enzyme-linked immunosorbent assay (ELISA), Western blotting, flow cytometry, tunable resistive pulse sensing (TRPS), electron microscopy, dynamic light scattering (DLS), microfluidics, surface plasmon resonance (SRR), and single particle interferometric reflectance imaging sensor (SP-IRIS).40 These techniques require specialized, costly instrumentation, technical expertise, and time-consuming methodologies complicating their applications in the resource-limited clinical laboratory setting. The International Society for Extracellular Vesicles recommends methods that minimize clinical sample manipulation to preserve the functional biological state of EVs.41 The clinical impact of EV-based diagnostics and exosome-based biomarkers has therefore been limited, largely due to the lack of a standardized, well-established technology to accurately quantify biomolecules associated with EVs.42 NTA is the most sensitive instrument that allows the analysis of EVs on a single particle level in light scatter mode (LSM) and fluorescent mode (FM).43,44 This equipment directly provides the video image of EVs in motion and simultaneously measures their size and concentrations using the Stokes-Einstein equation.45–47
In this study, we report an optimized, single-step immunocapture assay combined with mini-column purification for microliter scale quantification of HCC-derived exosomes in their native state using NanoSight NS300 in fluorescence mode (F-NTA). We comprehensively validated the ability of the F-NTA method to quantify exosomes by using synthetic fluorescence beads, HCC cell line-derived EVs, and tumor-derived EVs from patients with confirmed HCC. F-NTA assay performance was optimized using antibodies targeted to GPC3 and AFP alone and in combination. HCC-derived exosome quantification by F-NTA was directly compared with magnetic bead-based affinity flow detection methods. Our results indicate that F-NTA has a superior sensitivity for detecting HCC-derived exosomes and is scalable to microliter-level sample volumes. F-NTA distinguished patients with confirmed HCC from malignancy-free cirrhosis as well as healthy controls. In culture supernatant, F-NTA had a detection limit as low as 102 HCC-derived exosomes per tumor cell. The concentration of HCC exosomes in the serum detected by F-NTA shows strong correlation with tumor size assessed by MRI. As a proof-of-principle, serum HCC-derived exosome levels were calibrated with MRI-based assessments of HCC burden to demonstrate compatibility as a diagnostic assay.
Materials and Methods
Cell Culture and Reagents
Human hepatoma cell line (Huh7) (CAR-STC-ZP51) and the human cholangiocarcinoma cell line (HuCCA-1) were purchased from Creative Bioarray (CSC-C6896J) (Shirley, NY) and cultured in DMEM high glucose with 10% exosome-free fetal calf serum (FBS), L-glutamine, 1mM sodium pyruvate, and 0.1mM non-essential amino acids with 1% penicillin and streptomycin. At confluence, the cells were split in a 1:3 ratio. Exosome-free fetal bovine serum was purchased from Thermo Fisher, Waltham, MA (A2720803).
EV Purification from Huh7 and HuCCA-1 Cell Culture Supernatant
Cells were cultured in exosome-depleted media for three days before EV analysis. Briefly, cellular debris was removed from the culture supernatant by centrifugation at 2000 g for 30 minutes. Cleared supernatants were transferred to a new tube and mixed with 0.5 volumes of total EV isolation reagent (4478359) from Invitrogen Carlsbad, CA. Tubes were incubated at 4°C overnight. The following day samples were centrifuged at 10,000 g for one hour at 4°C. The resulting supernatant was carefully removed, and the EV pellet was resuspended in PBS and stored at −20°C until further analysis.
Nanoparticle Tracking Analysis (NTA)
EV concentration and size distribution were determined using NanoSight (Model NS300- NTA3300, Malvern Panalytical, Worcestershire, UK) equipped with a 532 nm green laser and a 565 nm long-pass filter for fluorescence detection. Technical triplicate measurements in FM and LSM were performed for each serum or cell culture-derived sample used in this study. Brownian motion of EVs is visualized in real-time while liquid-state light scattering properties are utilized to measure EV concentration and size. A syringe pump enables the free movement of particles in the tube. EVs in suspension are passed through a flow chamber and illuminated by a laser source to analyze total particle concentration by the NTA software as particle/mL (v3.2, Malvern Panalytical, Worcestershire, UK). Initially, FM measurements were completed and sequentially LSM measurements were done to avoid the “photobleaching” effect. Either in FM or LSM, exosome concentration analysis was performed using a 30-second recording per individual replicate. A washing step was performed between each measurement using ultrapure particle-free water. The fluorescence signal generated from the particles is recorded with a digital camera. Representative images were captured from these video records. The NTA instrument has a limited dynamic range for particle concentration (104–108 particles/mL). Therefore, all the samples were diluted to a maximum concentration of 1×10⁸ particles/mL to obtain accurate concentration measurements within the instrument’s detectable range.
Measurements of LSM were performed with camera level settings (12–14) and 15–16 to measure in FM. If there was a noise that would affect the analysis quality, the measurement was repeated by going to the next dilution step and the dilution rates were recorded. The syringe pump flow rate was set to 25 frames/second, and the detection threshold was set up to 5. Optimal camera and detector settings were fixed and remained constant for patient-derived serum sample analysis. Phycoerythrin (PE) -conjugated anti-human CD9, AFP, and GPC3 antibodies were used for the fluorescence detection of EVs. PE-labeled monoclonal rabbit and mouse antibodies against GPC3 (sc-390587 PE), AFP (sc-8399 PE), CD9 (sc-13118 PE), ARF6 (sc-7971 PE), and ASGPR1 (sc-166633 PE) were purchased from Santa Cruz Biotechnology (Dallas, TX). Antibody dilutions were optimized through antibody titration experiments using HCC-derived exosomes purified from Huh7 cells. EV samples were incubated with GPC3 antibody at 1:25 (v/v), AFP antibody at 1:100 (v/v) in PBS, CD9 antibody (1:25), ARF6 antibody (1:25), ASGPR1 antibody (1:25) with 1% BSA overnight at 4°C with agitation. The next day EVs were purified by size exclusion chromatography and immediately processed for NTA analysis. The assay performance to detect HCC exosomes in the serum using multiple dilutions of GPC3 and AFP antibodies was determined. For this purpose, 10μL of normal serum or HCC serum was diluted in 100μL of PBS with 1% BSA incubated with a diluted antibody. The next day, samples were diluted in 1mL of ultrapure water and examined by NTA. The dilution level with minimal background serum signal compared to the positive detection signal was selected.
Quantification of Membranous Particles by NTA
Serum samples (10μL) and isolated exosomes from Huh7 cell culture were diluted in 100μL of PBS. Lipophilic membrane dye (Cell Mask Plasma Membrane Stains - C10046, CMDR, ThermoFisher, USA) was diluted in PBS at a proportion of 1:1000. A hundred microliter of diluted dye was mixed with 100μL of diluted samples and incubated for two hours in a dark room with ambient temperature. The entire staining mix was diluted with up to 1mL of PBS. The labeled EVs were purified from a free dye by passing through the Sephadex G-200 column. The percentage of membranous EVs was determined using the ratio of particle concentrations measured in FM and LSM.
Serum Cohort Study
Human specimen studies were conducted following the ethical guidelines set forth by the Declaration of Helsinki. Isolated serums from patients with confirmed HCC (n = 21) were obtained from a single-center, prospective study (Ochsner Multi-Organ Transplant Institute, New Orleans, LA, USA) approved by the Ochsner Health Institutional Review Board (IRB) protocol No.2016.131.B,9/8/2023). Specimens were obtained following informed consent and current IRB approval date. Serum samples from cirrhotic patients (n = 20) and healthy individuals (n = 10) were obtained through a prospective study approved by the Tulane University IRB (Protocol 2017-197-2-25-24). The study inclusion criteria required an HCC diagnosis based on the Liver Imaging Reporting and Data System (LI-RADS) and/or biopsy in accordance with current American Association for the Study of Liver Disease guidelines. Informed consent was obtained from patients following confirmed HCC diagnosis. Among these patients, 10 out of 21 with an MRI-based diagnosis and serum AFP at the time of diagnosis were selected for the biomarker-MRI verification study. Stage F4 cirrhosis serum was obtained from patients with a diagnosis of non-alcoholic steatohepatitis (NASH) receiving care at Tulane University Department of Gastroenterology and Hepatology (n = 20). The cirrhotic patients who had available imaging and AFP levels were enrolled in a radiological validation study (n=10). Healthy control serum from patients with no existing liver disease was obtained from the Tulane Department of Clinical Pathology Laboratory (n = 10) after age and sex matching against the cirrhosis and HCC cohorts.
Single Step Immunocapture of Serum HCC Exosomes
Isolated serum aliquots of 10µL across all patient cohorts were diluted in 100µL of PBS with 1% BSA. PE-labeled antibodies to AFP (1:50) and GPC3 (1:25) were added to the diluted serum samples and incubated overnight at 4°C with agitation. Samples were then diluted to 1 mL with ultrapure particle-free water. Fluorescence-labeled, antibody-coated HCC exosomes were separated from unbound PE-antibodies by size-exclusion column chromatography to improve isolation efficiency and avoid denaturing the isolated EVs.48–50 Sephadex G-200 (“hand-made gel column”, A 50120, Sigma, Burlington MA), Bio-Spin Chromatography Columns (7326008 Bio-Rad, Hercules, CA), Cell guidance Exo-spin mini columns (EX03-50), and Amersham MicroSpin G-50 Columns (27533001, Cytiva, Marlborough, MA) were used for this step. The columns were washed three times with PBS and then the fluorescence-labeled, immunocaptured HCC exosomes were loaded onto the column. The solution was passed through the column until the entire 1mL flow-through volume was collected to completely remove the unbound PE-conjugated antibodies. Samples were diluted 1:10 before size and concentration analysis using F-NTA.
Analysis of HCC Exosomes by Immunomagnetic Bead-Based Affinity Flow Cytometry
Streptavidin-coated magnetic beads (10608D) were purchased from Invitrogen (Carlsbad, CA). Beads were prewashed in PBS and incubated with biotinylated antibodies for one hour. Biotinylated antibodies to CD63 (353018) were used at a proportion of 4μg/107 of magnetic beads (Bio Legend, San Diego, CA). Antibody-conjugated beads were washed twice using PBS with 1% BSA to block the nonspecific bindings sites. The beads were incubated with 100μL of cell culture-derived EVs overnight at 4°C The following protocol was used for immunomagnetic separation of EVs in human serum. Serum samples were centrifuged briefly at 2000 rpm for 5 minutes to remove debris. A 10µL aliquot of serum was diluted in 100μL PBS and incubated with immunomagnetic beads for native EV capture. The next day, the EV-bead complex was kept in a magnetic stand and washed three times using 0.5mL of PBS with 1% BSA. Following this step, the EV-bead complex was incubated with fluorescence-labeled antibodies diluted in 100 μL PBS 1% BSA for one hour at room temperature. Beads were washed three times with 0.5 mL of PBS 1% BSA and then analyzed on a Becton-Dickinson flow cytometer (BD FACS Celesta) using BD FACSDiva Software 6.0 (San Jose, CA). Advanced flow cytometry analyses and graphical output were performed using Flowing Software version 2.5.1 (Turku Bioscience, Turku, Finland).
Statistical Analysis
Statistical analysis was performed using Prism software version 8 (GraphPad Software, Inc., La Jolla, CA, USA). All experiments were performed 3 independent times with fresh cultures of cells each time to obtain 3 replicates. The variables were investigated using visual (histograms, probability plots) and analytical methods (Kolmogorov–Smirnov/Shapiro–Wilk tests) to test for normal distribution. Continuous variables were shown as mean and standard deviation (SD) or median and 25th–75th quartiles (IQR-interquartile range) according to their distribution pattern. Results were presented The Kruskal–Wallis test was used to compare exosomal concentration size and expression of GPC3, ARF6, and CD9 in patient serum cohorts. A value of P < 0.017, calculated by Bonferroni correction, was considered statistically significant when comparing the three patient groups. The Mann–Whitney U-test was used to compare the medians between the study subgroups. Spearman correlation analysis was used for investigating the relationship between lesion size and GPC3+ve exosome concentrations. Sensitivity, specificity, and cut-off values were calculated for discriminating HCC and non-HCC cases using receiver operating characteristic curve (ROC) analysis. The statistical significance was shown as * p < 0.05, ** p < 0.01, *** p < 0.001.
Results
Establishing a Workflow for Quantifying HCC Exosomes in Serum
Quantification of EVs isolates released by tumor cells will offer a great advantage for monitoring early cancer growth, tumor size, and treatment response. We developed a fast and easy technique for scalable purification of EVs that uses a combination of immunocapture, and size exclusion chromatography followed by concentration measurements by fluorescence nanoparticle tracking analysis (F-NTA) summarized in Figure 1. The serum EV immunocapture and size exclusion chromatography were used to separate the fluorescence-labeled EVs from the unbound fluorescence antibodies. The F-NTA protocol was optimized to quantify circulating HCC-derived exosomes in isolated serum after immunocapture with PE-conjugated antibodies against AFP or GPC3. The F-NTA measures the fluorescence-positive EVs in the red fluorescence channel and total EVs in the light scatter channel. Initial experiments were carried out to determine the detection range of F-NTA using Synthetic Beads. F-NTA performance was established by serial dilution using fluorescent-labeled beads (Figure 2). Unlabeled fluorescent beads were detected in light scatter mode (LSM) with no autofluorescence signal detected in FM. Serially diluted fluorescent-labeled beads were similarly detected in the LSM mode and detected in FM (Figure 2A and B). The median particle size for both unlabeled and fluorescent-labeled beads was correctly calculated in both LSM and FM, respectively (Figure 2C). F-NTA detection range was determined using a fixed concentration of unlabeled beads spiked with varying concentrations of synthetic fluorescence beads with dynamic particle imaging recorded in FM and LSM (Figure 2D). F-NTA detection limits for fluorescence-labeled beads ranged from 104 to 108 particles/mL which established the optimal target dilution for subsequent experiments.
 |
Figure 1 Overview of the experimental workflow of fluorescent-nanoparticle tracking analysis (F-NTA) to quantify HCC exosomes in their native state. (A). Shows antibody selection to immunocapture HCC exosomes. PE-labeled AFP and GPC3 antibodies are specific to HCC-derived exosomes used alone or in combination. (B). Brief presentation of clinical assay used to capture highly purified HCC exosomes for F-NTA quantification. 10μL of human serum was diluted in 100μL of PBS with 1% BSA. Antibody incubation was performed overnight at 4°C with shaking. The next day, the sample was diluted in 1mL of ultrapure-filtered distilled water and passed through the Sephadex column. Samples were further diluted 1:10 in ultrapure water and analyzed by NTA in light scattered mode (LSM) and fluorescence mode (FM). |
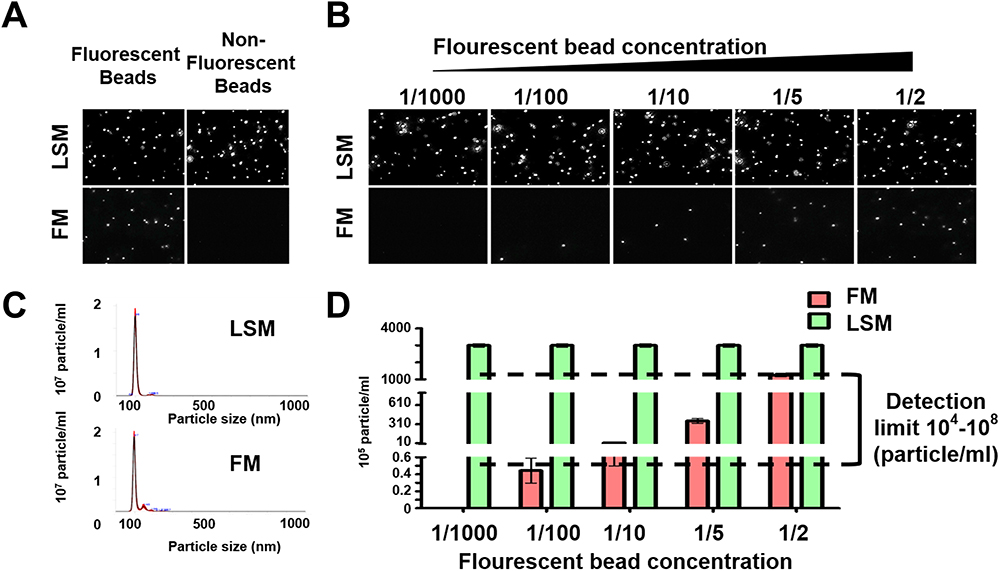 |
Figure 2 Optimization of fluorescent-nanoparticle tracking analysis (F-NTA) measurement using synthetic fluorescent and non-fluorescent beads. (A). Shows video images of unlabeled and labeled fluorescent synthetic beads in suspension examined using NTA in light scattered mode (LSM) and fluorescence mode (FM). Only fluorescence-labeled synthetic beads were detected in both LSM and FM (B). Show the sensitivity and specificity of F-NTA analysis using synthetic beads. A snapshot of video images of particles in motion using NTA analysis of synthetic beads in LSM and FM. A fixed amount of unlabeled synthetic beads were spiked with different concentrations of fluorescence-labeled synthetic beads. (C). Shows particle size distribution of synthetic beads analyzed by NTA. (D). Show quantification of synthetic fluorescence beads by NTA. The detection range of F-NTA is shown. |
The size exclusion chromatography step was optimized by comparing four different approaches including four commercially available laboratory protocols. To identify the optimal recovery strategy which preserved exosome morphology, the mean concentration and mode size for each column preparation was analyzed in LSM (Figure 3). Analysis of the standard and model of vesicle size and video images of exosome light scattering show that all columns produced excellent exosome yield since they all generate exosome numbers 1×10⁸ per mL. As shown the yield and purity of EVs varies among different column isolation. The recovery and size of vesicles varied among different column purification approaches, with more heterogenous particles found in the Cell Guidance and Cytiva gel filtration column (Figure 3A), which was confirmed in the video images of particles (Figure 3B). The concentration of EV isolated by various columns are comparable (Figure 3C). The size measurement indicates that all columns purified smaller vesicles in the range of 100–150 nm (Figure 3D). The bigger non-vesicular particles or protein aggregates could be contributing mean diameter to a bigger size. The Sephadex G-200 column purification provided the optimal purification therefore, it was selected for subsequent analyses of exosome purification.
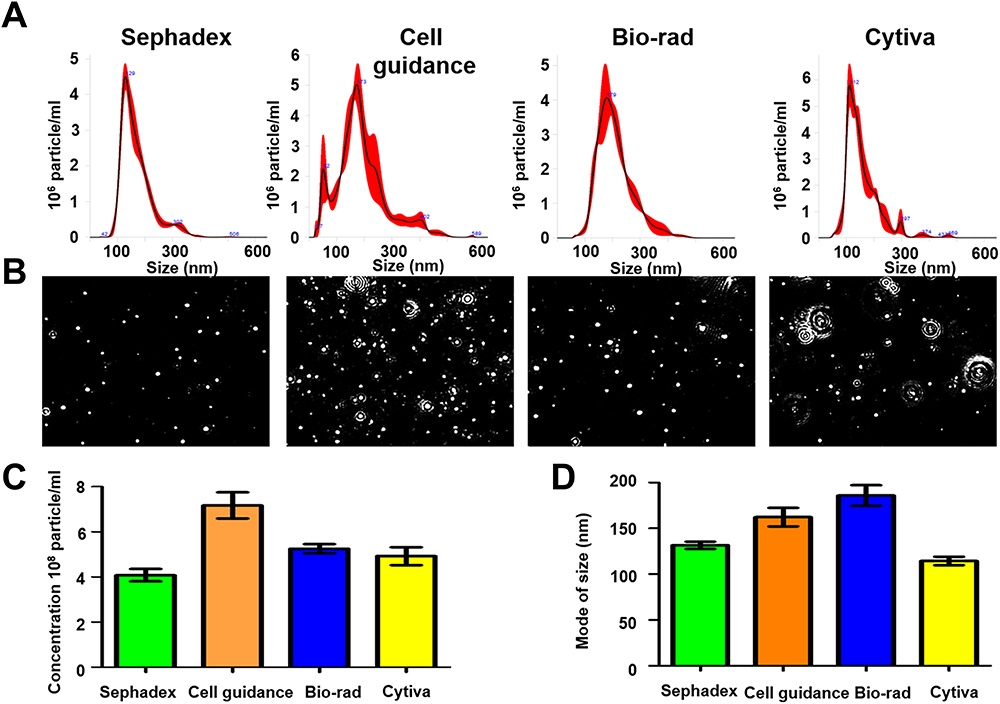 |
Figure 3 Recovery and quality assessment of immunocapture-HCC exosomes purified by size exclusion column purification for nanoparticle tracking analysis (NTA). Immunocaptured HCC exosomes were diluted in 1mL of ultrapure water and passed through a gel filtration column to separate free labeled antibodies. (A). Size and concentration measurement of extracellular vesicles (EVs) isolated by various columns by NTA. (B). Video images of EVs in motion captured via light scatter model. (C) Particle recovery by various columns. (D) Size of particle isolated by various columns. |
Purity, Population Diversity, and Liver Specificity Check of Column Purified EVs by F-NTA
The NTA does not discriminate different biological vesicles such as membrane and non-membrane particles such as protein aggregates or salt precipitate. We designed an experiment that distinguishes membranous and non-membranous EVs after labeling them with a lipid-permeable fluorescent dye. The dye was diluted to a concentration of 1:1000 and then a dose-dependent dye titration was performed using isolated EVs from Huh7 cells. The labeled EVs and unbound dye were separated by column purification. The concentration of dye that shows maximum labeling was determined by F-NTA used in the serum studies (Supplementary Figure 1). Serums of healthy individuals, patients with cirrhosis, and HCC were labeled with lipophilic red dye for two hours, and EVs were column purified. The concentration of fluorescence-positive membranous particles and total particle counts in each sample was determined by NTA in FM and LSM. The data clearly show that column purification of EVs has a purity of >80% (Figure 4A). We tested the immunoreactivity of EVs after column purification to confirm the suitability of this method for diagnostic use. For this purpose, EV population diversity following immunocapture and gel-filtration assay was confirmed using PE-conjugated antibodies specific to microvesicles (ARF6) and exosomes (CD9). This analysis shows that Huh7 cells release several subtypes of EVs with only 1% of EVs positive for the microvesicle marker ARF6 and 24% of EVs positive for the exosome marker CD9 (Figure 4B). The majority of EVs (>75%) secreted by the Huh7 cells were negative for both the microvesicle and exosome marker. A similar EV population analysis was performed using 10-μL of serum from a healthy individual, a cirrhotic patient, and a patient confirmed for HCC. In the healthy control sample, only nearly 12% of the isolated EVs stained positive for the exosomal marker with 53% showing positive for the microvesicle marker and the remaining 35% showing negative for exosome and microvesicles. However, EV population diversity was found to be different in cirrhotic patients with or without HCC. EV isolated from patients with cirrhosis and HCC were nearly 2-3-fold enriched in exosome positive fractions (28% and 30%, respectively) with microvesicle fractions of 13% in patients with cirrhosis and 30% in HCC. Of note, there was no difference in the total number of particles isolated between equal volumes of Huh7 cell culture supernatant and patient subgroups. The next set of experiment was performed to test whether peripheral blood sample contained adequate amount of liver-derived vesicles. Normalized distribution of the liver-derived ASGPR1+ve EVs in cell culture, normal healthy serum, cirrhosis, and HCC serums are presented in Figure 4C. EVs isolated from Huh7 culture showed low positivity of ASGPR1. Normal healthy individuals release high amounts of ASGPR1+ve EVs and the production decreased in liver cirrhosis and HCC.
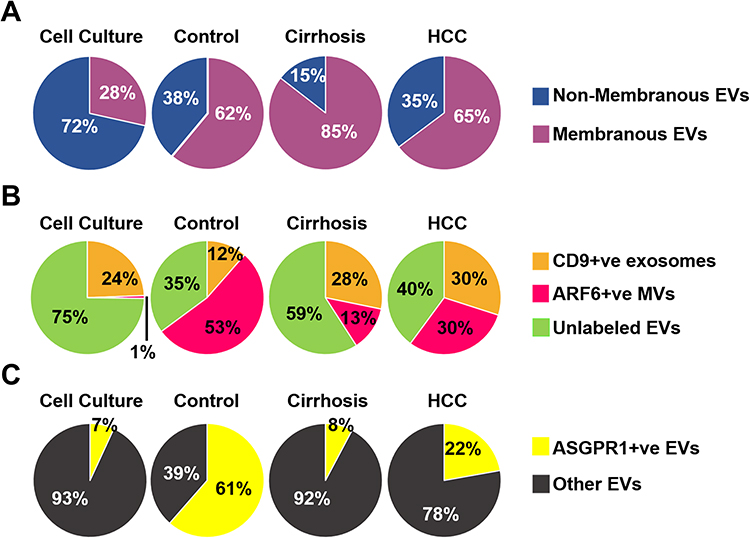 |
Figure 4 Purification of extracellular vesicles (EVs) by size exclusion chromatography preserves immunoreactivity assessed by fluorescent-nanoparticle tracking analysis (F-NTA). (A). Shows effectiveness of purification after using lipophilic membrane dye (Cell Mask Plasma Membrane Stain) for staining EV’s. According to percentages of the positive stained vesicles, most of the EV’s are membranous. (B). A pie chart shows the EV population diversity of exosome and microvesicle after immunocaptured using PE-labeled CD9 antibody and PE-labeled ARF6 antibody from cell culture, and clinical samples (normal serum, cirrhosis with or without HCC). As predicted, the F-NTA analysis shows exosome release increased in chronic liver disease as compared to only among healthy individuals. A large percentage of EVs remain unlabeled. (C). Show clinical application of F-NTA to quantify liver-derived EVs using PE-labeled antibodies to ASGPR1. The percentage of liver-derived vesicles was lower in cirrhosis and HCC groups than the healthy controls. |
F-NTA Assay Calibration Using EVs Isolated from Huh7 Cell Culture
The first sets of experiments determined the antibody dilutions that show optimal detection with minimum non-specific background signal. We found that the GPC3 antibody at 1:25 and AFP (1:100) produced optimum quantification of the HCC exosomes (Supplementary Figure 2). The second set of analyses was performed to compare HCC and non-HCC exosomes for the expression of known HCC markers. Exosomes were isolated from Huh7 and HuCCA-1 cell cultures by precipitation and immunocapture assay using PE-labeled antibodies to AFP or GPC3 alone and in both antibodies in combination (Figure 5). Exosomes from Huh7 and HuCCA-1 cells immunocaptured with PE-labeled CD9 antibodies were used as the internal control. The antibody reaction was compared between HCC and non-HCC cell lines. Representative LSM and FM images of light scattering, CD9+ve, and GPC3/AFP+ve exosomes isolated from Huh7 and HuCCA-1 culture supernatants are shown in Figure 5A and B. The estimated exosome shedding per tumor cell was determined by normalizing the cell number in the culture. Both LSM and FM particle concentrations were higher in HuCCA-1 cell culture samples than in Huh7 cell culture samples in the CD9 experiment (For LSM 1068±80.4 vs 843±88.7 particle/cell p=0.03 and FM 751±38.1 vs 389.3±101.1 particle/cell p=0.004). Due to this reason, fluorescent CD9+ve particle ratios were found equivalent in samples from Huh7 cells and HuCCA-1 cells. We found fluorescent positive HCC particle concentration is significantly higher in Huh7 exosomes than exosomes from HuCCA-1 cells in terms of GPC3, AFP, and a combination of GPC3 and AFP. Total particle concentration and yield of particles between Huh7 and HuCCA-1 were comparable in these experiments (p>0.05). The per-cell shedding frequency for GPC3+, AFP+, and GPC3+AFP+ EVs was higher in Huh7 cells compared to HuCCA-1 (Figure 5C). This analysis allowed us to compare the average exosome release between Huh7 and HuCCA-1 cells. HuCCA-1 cells release more exosomes compared to HCC cells. However, this analysis resulted in the detection of more GPC3+ve HCC exosomes in Huh7 cells compared to HuCCA-1 cells (100 GPC3+ve exosome per Huh7 as compared to 10 GPC3 positive exosome per HuCCA-1 cells). The F-NTA analysis showed 200 AFP-positive exosomes in HuCCA-1 cells compared to 500 AFP-positive exosomes in Huh7 cells. AFP and GPC3 antibody combination captured more HCC exosomes in Huh7 cells than in HuCCA-1 cells. The number of fluorescence-labeled particles called HCC exosome per cell was found to be in the range of 1–200 particles/ cells when AFP and GPC3 antibodies were used in combination.
 |
Figure 5 Assay calibration using exosome purified from Huh7 culture. Approximately 1×10⁷ Huh 7 cells were cultured in a 10-cm tissue culture plate. Media were collected after 72 hours and exosomes were precipitated from 1-mL cell-free supernatants by precipitation. Exosomes were recovered after centrifugation. The exosome pellet was resuspended in 100μL of PBS with 1%BSA and incubated with PE-labeled GPC3, AFP, and CD9 overnight. The next day, samples were diluted in 1 mL water and passed through a column. Extracellular vesicles (EVs) collected from flow-through were diluted in water (1:10) and immediately analyzed by fluorescent-nanoparticle tracking analysis (F-NTA) using light scattered mode (LSM) and fluorescence mode (FM). (A). Video images of PE-conjugated CD9 antibody labeled EVs were captured from Huh7 and HuCCA-1 culture and measured by F-NTA in LSM and FM. (B). Representative video image of PE-labeled GPC3 antibody-labeled HCC exosomes captured from HuCCA-1 and Huh7 cells and measured by NTA in LSM and FM. (C). Total exosomes and HCC exosomes are released per tumor cell. The total exosome release from HuCCA-1 cells is more than from Huh7 cells. HuCCA-1 cells release a minimum number of HCC exosomes as compared to Huh7 cells. Statistical significance levels were presented as ns for non-significant, * for p<0.05, ** for p<0.01. |
Quantification of HCC-Derived Exosomes in the Clinical Samples
To extend the clinical utility of serum HCC exosome quantification, a serum cohort from patients with a confirmed diagnosis of no underlying liver disease (healthy normal), cirrhosis, or HCC was procured. The individual performances of AFP and GPC3 versus a combination of GPC3/AFP were investigated across the patient subgroups. Diagnostic sensitivity and specificity values for optimal cut-offs are shown in Supplementary Table 1. The results of serum HCC-derived exosome quantification using GPC3 PE-conjugated antibody are shown in Figure 6. A representative image of particles in motion in LSM and FM is shown in Figure 6A. GPC3-positive vesicles were detected more frequently in HCC cases compared to cirrhosis and healthy controls. Negative fluorescence staining was more frequently detected in normal serum and cirrhosis samples. Analysis of GPC3-labeled exosomes in each patient subgroup revealed particles in the range of 100 to 150 nm, supporting that they are primarily exosomes. The mean and mode particle sizes captured in FM and LSM for GPC3 labeled EV samples are shown in Figure 6B. The particles counted in FM were normalized with the total particle number in LSM to compare the distribution of GPC3-bound vesicles between normal, cirrhosis, and HCC (Figure 6C). A statistically significant increase in GPC3+ve exosomes was detected in HCC patients compared to malignancy-free cirrhosis. A receiver operator curve was plotted to determine the diagnostic power in clinical HCC specimens. It yielded AUC values of 0.79 for discriminating HCC and cirrhotic non-HCC cases (p=0.02) (Figure 6D). The performance of AFP antibody capturing HCC exosomes was examined using identical samples with the same analytical parameters (Figure 7A and B). The quantification of HCC exosome captured using PE-labeled AFP antibody in normal, cirrhosis, and HCC was performed using an exact setting of LSM and FM of NTA. The AFP+ve HCC exosome number was normalized to the total particle counts obtained in LSM mode. While AFP+ve exosome concentration was significantly higher in the HCC group than in the cirrhosis group, there was no significant difference between the control and HCC groups (p=0.03 and p=0.09) (Figure 7C). The ROC analysis showed that the AUC value of AFP+ve exosomes for detecting HCC cases was 0.71 and this was statistically significant (p=0.02) (Figure 7D). Lastly, we performed HCC exosome quantification after immunocapture of exosomes using PE-labeled GPC3 and PE-labeled AFP antibodies in the same set of samples. The HCC exosome counts were normalized with the total particle counts obtained in LSM. The performance of HCC exosome quantification using a combination of GPC3, and AFP antibodies together appears to be superior to AFP alone but not to GPC3 alone (Figure 8A–D). All these results indicate that F-NTA is sensitive enough to quantify HCC exosomes using PE-labeled tumor-specific antibodies. This analysis demonstrates that the use of GPC3-PE antibody alone performed well compared to the combination of AFP and GPC3 for HCC exosome quantification.
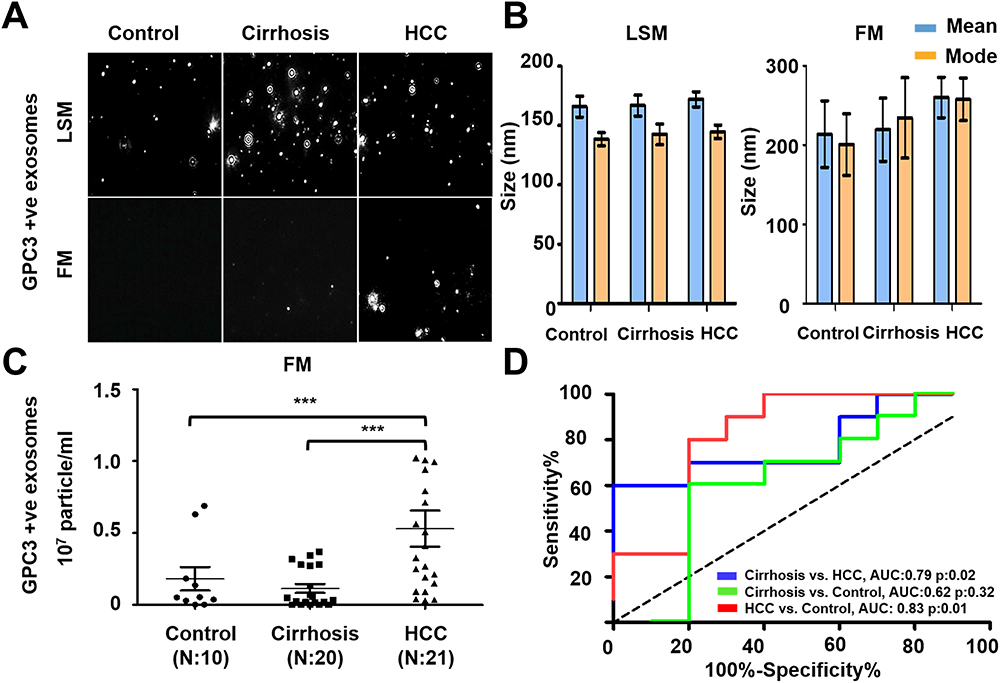 |
Figure 6 Quantification of GPC3+ve HCC exosomes using fluorescent-nanoparticle tracking analysis (F-NTA). Ten microliters of serum samples were diluted in 100 μL of PBS with 1% BSA. Antibody incubation was performed at 4 °C overnight. The next day samples were diluted in 1mL of ultrapure water and passed through a gel-filtration column. Samples were further diluted (1:10) in 1mL water and analyzed by NTA using light scattered mode (LSM) and fluorescence mode (FM). (A). Representative video image of Extracellular vesicles (EVs) analysis captured in LSM and FM of immunocaptured using PE-conjugated GPC3 antibody. (B). Show the size (mean and mode) measured in LSM and FM. (C) Concentration measurement of immunocaptured EVs (particles/mL) using GPC3 antibody levels in normal, cirrhosis, and HCC serum detected using FM. The particle number obtained in FM was normalized with the particle number obtained in LSM for each sample. *** is representing the statistical significance level of p<0.001. (D). ROC analysis shows the sensitivity and specificity values of GPC3 vesicles in normal, cirrhosis, and HCC. |
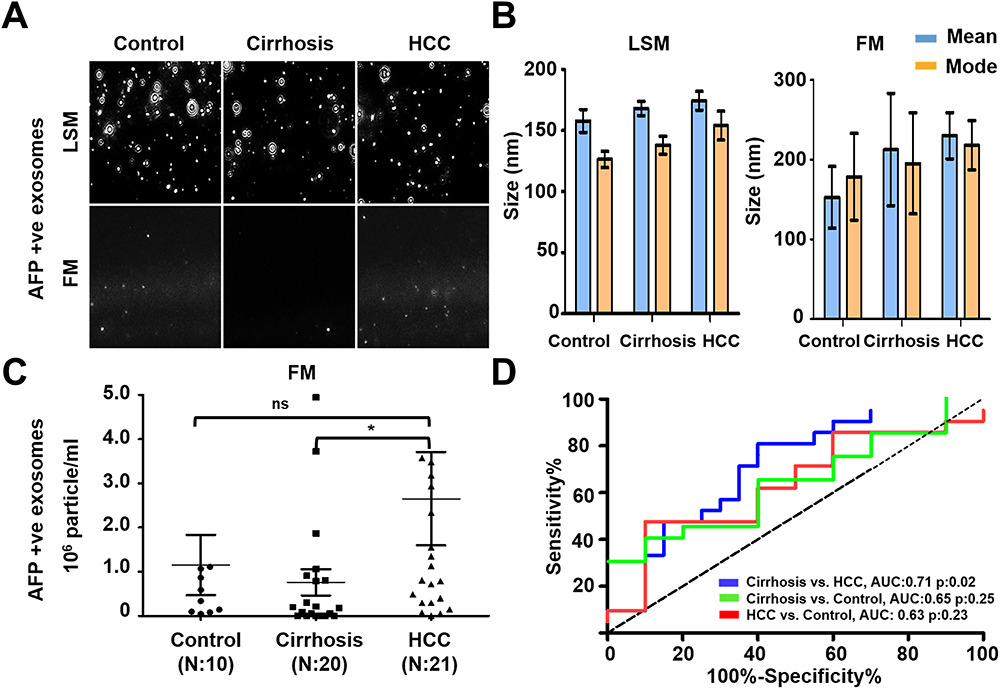 |
Figure 7 Quantification of AFP+ve HCC exosomes using fluorescent-nanoparticle tracking analysis (F-NTA). Ten microliters of serum samples were diluted in 100μL of PBS with 1% BSA. AFP antibody (1:100) incubation was performed at 4°C overnight. The next day samples were diluted in 1mL of ultrapure water and passed through a gel-filtration column. Samples were further diluted (1:10) in 1 mL water and analyzed by NTA. (A). Representative video image of extracellular vesicles (EVs) analysis captured in light scattered mode (LSM) and fluorescence mode (FM) of immunocaptured using PE-conjugated AFP antibody. (B). Show the size (mean and mode) measured in LSM and FM. (C). Particle size distribution of EVs analyzed in LSM and FM. Quantification of immunocaptured EVs using AFP antibody in normal, cirrhosis and HCC serum detected using FM. The particle number obtained in FM mode was normalized with the particle number obtained in LSM for each sample. Statistical significance levels were presented as ns for non-significant, * for p<0.05 (D). ROC analysis shows the sensitivity and specificity values of AFP vesicles in normal, cirrhosis, and HCC. |
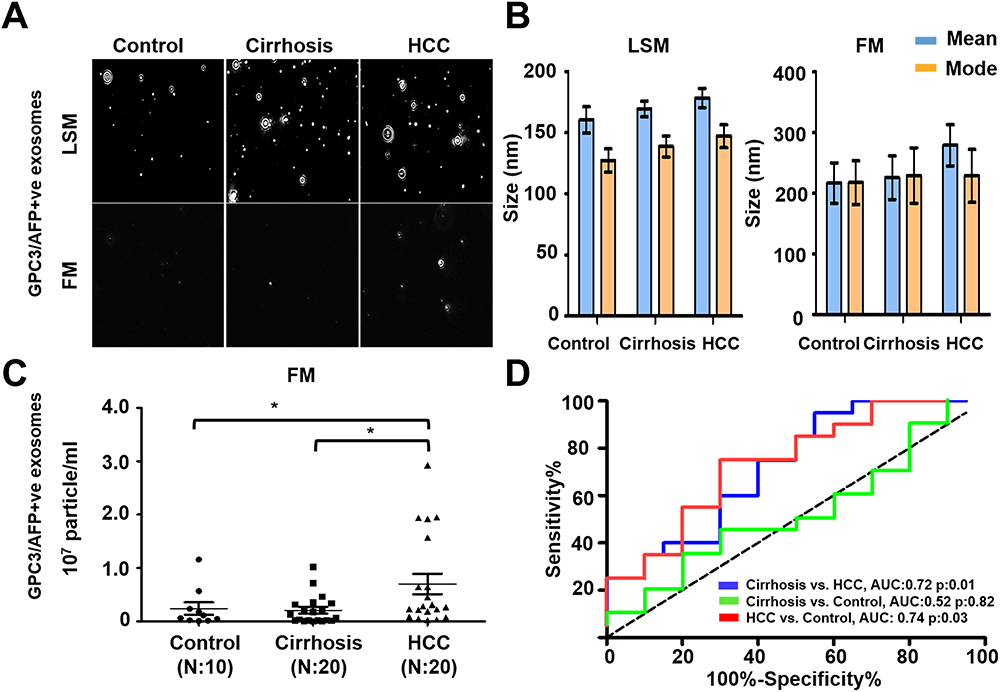 |
Figure 8 Quantification of AFP and GPC3 double-positive HCC exosome using the combination of two antibodies (AFP and GPC3). (A). Representative video image captured during extracellular vesicles (EVs) analysis in light scattered mode (LSM) and fluorescence mode (FM) of immunocaptured using PE-conjugated AFP and GPC3 antibody combination. (B). Show the size (mean and mode) of immunocaptured EVs using two antibodies measured in LSM and FM. (C) Quantification of immunocaptured EVs using a combination of two antibodies (GPC3/AFP) in normal, cirrhosis and HCC serum detected using FM. The particle number obtained in FM was normalized with the particle number obtained in LSM for each sample. Statistical significance levels were presented as non-significant, * for p<0.05 (D). ROC analysis shows the sensitivity and specificity values of HCC exosome quantification using the combination of AFP and GPC3 antibodies in normal, cirrhosis, and HCC. |
Comparison of Immune Magnetic Bead Affinity Flow Assay with Direct Quantification of HCC Exosome by F-NTA
The performance of HCC exosome quantification by F-NTA in the same set of samples was compared with the magnetic bead assay described by our group previously.37 The immunomagnetic beads were prepared by mixing streptavidin-conjugated magnetic beads with biotinylated CD63 antibodies, followed by blocking and incubation directly with the serum for EV capture. This assay principle is that serum exosomes immobilized onto beads reacted either with PE-labeled AFP or PE-labeled GPC3 or in a combination of both antibodies (Figure 9A). The magnetic bead assay was used to determine the performance of GPC3 and AFP alone and in combination markers for HCC detection using the same three groups of serum cohorts. We found the GPC3-positive exosomes were detected significantly higher in the serum of patients with HCC than in cirrhosis without HCC (Figure 9B). The AFP-positive exosomes were detected considerably more in the HCC serum as compared to the control and cirrhosis (Figure 9C). The percentage of HCC exosome detection was improved by the combination of two antibodies (Figure 9D). A representative flow cytometry picture shows that a high percentage of HCC exosomes were detected using the combination of AFP and GPC3 antibodies (Figure 9E). ROC analysis shows the sensitivity and specificity of magnetic bead assay for HCC detection using single and double antibodies (Figure 9F). This analysis shows that the combination of AFP and GPC3 improved the sensitivity of HCC detection among cirrhotic patients, but the specificity decreased.
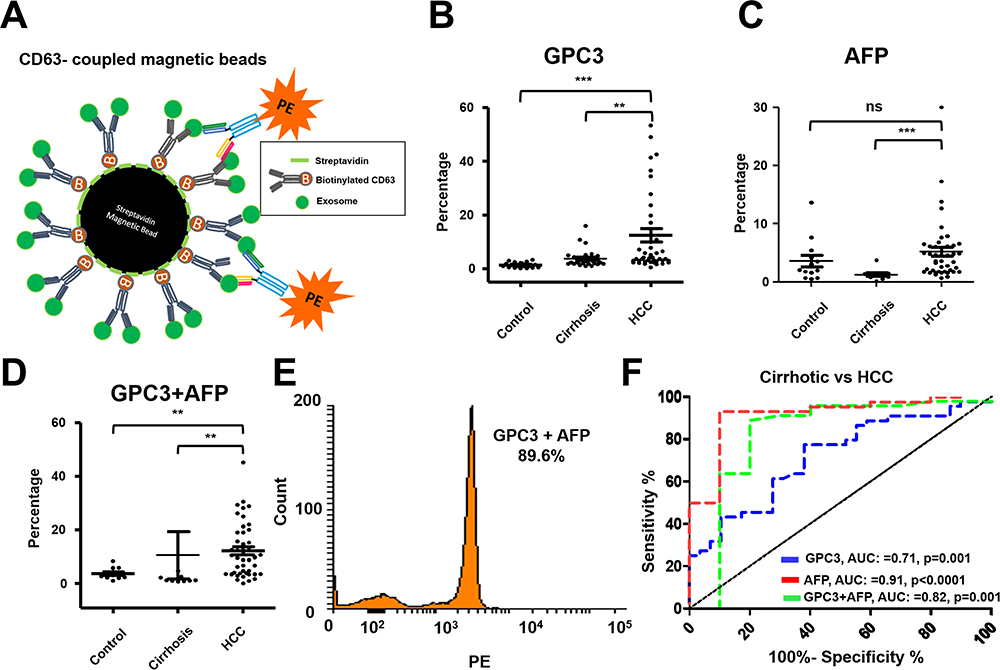 |
Figure 9 Performance of magnetic bead assay for HCC detection using antibodies to GPC3 alone, AFP alone, and a combination. (A). Illustrate the assay design. Streptavidin-conjugated magnetic beads were attached to a biotinylated CD63 antibody. The next day, beads were incubated with 10μL of the serum diluted in 100μL PBS with 1%BSA overnight. The next day, beads were washed twice and then incubated with PE-conjugated antibodies (GPC3 alone, AFP alone, and combination) for one hour. Following this step, beads were washed and analyzed by a flow cytometer. (B). Percentage of exosomes reacted with GPC3 antibody by magnetic bead-based flow assay in normal healthy serum, cirrhosis, and cirrhosis with HCC. (C). Percentage of HCC exosome captured using AFP antibody using magnetic bead-based flow assay between normal healthy serum, cirrhosis, and cirrhosis with HCC. (D). Percentage of HCC exosome captured using a combination of AFP and GPC3 antibodies in normal healthy serum, cirrhosis, and cirrhosis with HCC. Statistical significance levels were presented as ns for non-significant, ** for p<0.01, *** for p<0.001 (E). Representative flow cytometry image showing very high reactivity of HCC exosomes using the combination of two antibodies. (F). ROC analysis shows the sensitivity and specificity of immunomagnetic bead flow assay for HCC exosome quantification. |
Direct Comparison of HCC Exosome Quantification with Imaging-Based Diagnosis
The performance of direct serum HCC-exosome quantification for liver tumor diagnosis was validated using a set of HCC whose diagnosis and tumor size were established by the radiologist through gold-standard MRI-based liver imaging. This validation study included 10-serum samples of liver cirrhosis without HCC and 10-serum samples with HCC from our cohort. The demographic and clinical characteristics of these patients are summarized in Table 1. The HCC-exosome quantification after immunocapturing with antibodies to either GPC3 or AFP and in combination was performed by F-NTA using identical conditions. Normalized GPC3+ve exosome concentration was found significantly higher in MRI-confirmed HCC cases than the MRI-confirmed, HCC-free cirrhotic group (1.4x10⁶ IQR25-75 3.2×10⁵-3.8x10⁶ particle/mL vs 9.4×10⁴ IQR25-75 0–3.2×10⁵ particle/mL respectively p< 0.0001) (Figure 10A). The comparison of MRI negative and positive groups in terms of AFP+ve or GPC3/AFP+ve exosome concentration is summarized in Figure 10B and C. Serum AFP levels were found significantly higher in MRI positive group than in MRI negative group (2.5 IQR25-75 2–3.1 ng/mL vs 12.5 IQR25-75 3.8–148 ng/mL respectively and p=0.04) (Figure 10D). Despite there being no statistical direct correlation between GPC3+ve exosome concentration and serum AFP levels, GPC3+ve exosome concentration was significantly higher in the high serum AFP (≥20ng/mL) group than in the low-AFP group (p=0.034) (Figure 10E). The size of the HCC-exosome in the MRI-positive and negative groups is comparable (Figure 10F). There is a positive correlation between GPC3+ve HCC exosome detection by F-NTA with tumor size assessed by liver imaging (r=0.78 and p<0.001) (Figure 10G). The ROC analysis of the MRI-positive and negative samples shows GPC3+ve exosomes separate well with AUC value:0.86, p:0.006 compared to AFP+ve exosomes and a combination of GPC3/AFP+ve exosomes with AUC:0.72, p:0.89 (Figure 10H).
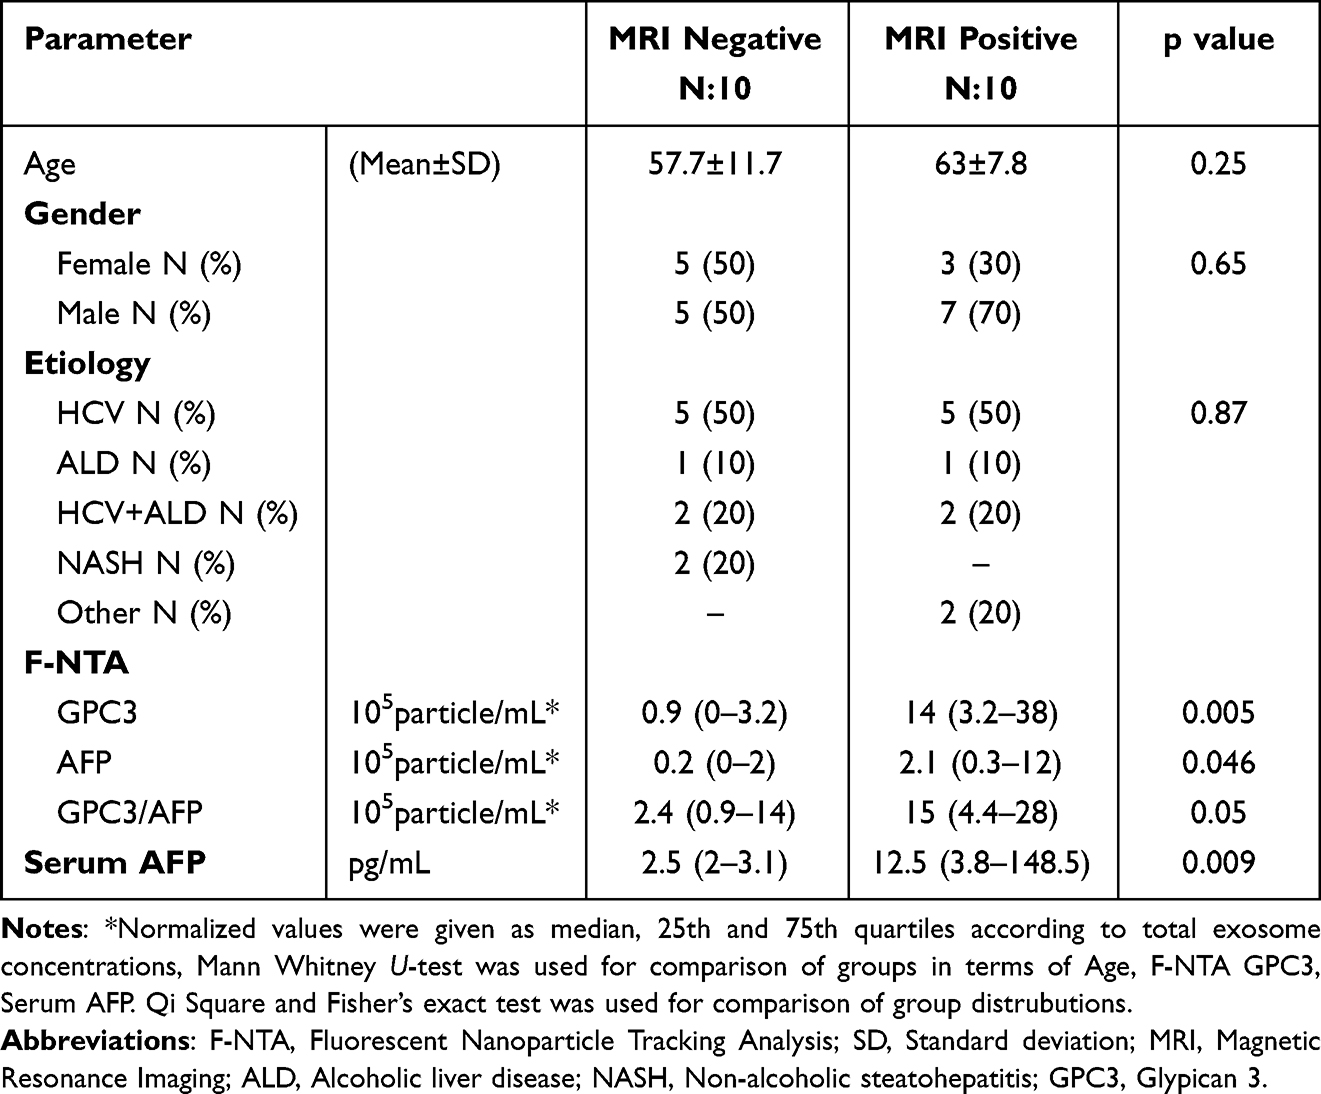 |
Table 1 Comparison of MRI Negative and Positive Groups for Demographics, F-NTA, and Serum AFP Results |
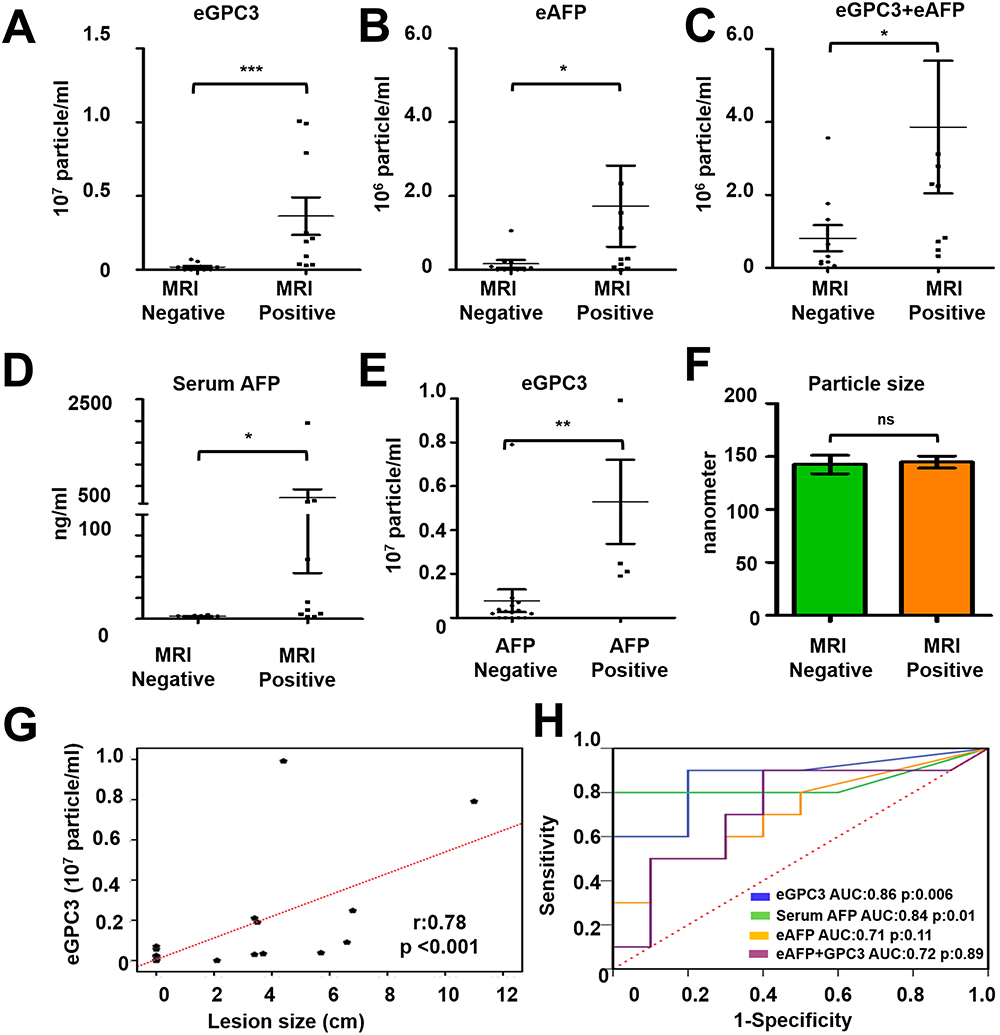 |
Figure 10 Statistical analysis determines the performance of HCC exosome quantification by fluorescent-nanoparticle tracking analysis (F-NTA) among MRI positive and negative serum samples of our patient cohort. The fluorescence-positive exosome number is normalized with the total number of extracellular vesicles (EVs) captured by light scatter mode in each sample. (A). Quantification of GPC3+ve exosomes in serums obtained from MRI positive and negative cases. (B). Quantification of HCC exosome using PE-labeled AFP antibodies in the same set of serum samples. (C). Quantification of HCC exosomes using a combination of PE-labeled GPC3 and PE-labeled AFP antibodies. (D). Comparison of MRI-positive and MRI-negative cirrhosis samples for serum AFP levels. (E). Comparison for GPC3+ve HCC-exosome concentration in AFP negative and AFP positive groups. The upper limit of AFP was considered as 20 ng/mL (F). Statistical significance levels were presented as ns for non-significant, * for p<0.05, ** for p<0.01, *** for p<0.001. The exosome size is comparable between the MRI-positive and negative groups. (G). Show correlation between HCC-exosome quantification with HCC size determined by MRI in the HCC cohort. (H). ROC analysis shows the sensitivity and specificity values of marker-positive exosome quantification and serum AFP levels for diagnosing HCC in liver cirrhosis. |
Discussion
Circulating EVs are relatively easy to isolate using minimally invasive procedures and offer an attractive biomarker target to monitor human health and disease progression. With no consensus on exosome isolation standards, we propose that the direct quantification of exosome-biomarkers represents the ideal approach for studying the biological relationship between EV signals and their source tissue at the different stages of disease progression. This study explores the direct immunocapture of HCC-specific EVs using a fluorescence-tagged antibody and then quantifying labeled EVs using F-NTA. The presented data support the F-NTA assay’s excellent sensitivity and specificity for HCC exosome quantification. Using serially diluted fluorescence beads, the dynamic range of F-NTA for accurate concentration measurement of exosomes was found to be 104 to 108 particles/mL. Initial validation studies using serum samples revealed a high exosome concentration in human serum and therefore required volumes as low as 10μL to fall within the F-NTA dynamic range. A critical aspect of EV quantification in serum is plasma is maintaining immunoreactivity and biological activity following isolation. For example, the high mechanical stress required by several EV isolation protocols can alter the morphology of EVs due to the vesicle tethering and interfere with their recovery and quantification. Additionally, these protocols may lead to denaturing the epitopes and diminish the immunoreactivity. The immunocapture approach used here relies on the binding of EV surface proteins with antibodies, therefore, allowing the recovery of HCC-specific EVs. This approach can be adapted for diagnostics purposes to incorporate specific protein targets for exosome capture. AFP and GPC3 are two proteins that have been widely used in HCC diagnosis. GPC3 is only produced by HCC cells, not the surrounding cirrhotic liver, whereas AFP is expressed in cirrhotic hepatocytes as well as HCC tumors. We have previously shown that Huh7 cells release exosomes that express AFP and GPC3.34 As a proof-of-principle, GPC3 and AFP antibodies were selected to capture HCC exosomes. Excessive unbound fluorescence antibodies can interfere with EV quantification using F-NTA, highlighting the importance of purifying fluorescently labeled EVs from unbound fluorescent antibodies. Column purification and antibody labeling allowed the preparation of pure population PE-labeled EVs for F-NTA quantification. We found that column purification generated greater quantality for the direct quantification of EVs in the serum samples. Optimal antibody dilution was also critical for accurate quantification using F-NTA.
We first assessed whether EV size distribution by F-NTA was maintained following immunocapture isolation and size exclusion column. Using PE-labeled CD9 or PE-labeled ARF6 we showed that this method can be used to assess the distribution of exosomes and microvesicles in the serum of patients with or without advanced liver disease. Specific pathological conditions alter EVs’ production and composition causing disease-specific alterations in EV composition compared to a reference healthy population. Multifaceted stress response alters autophagic mechanisms and it causes generating many membrane-enclosed lipid-bilayer vesicles to encapsulate specific cargoes of cellular plasticity. For example, induction or inhibition of autophagy leads to an increase in the release of microvesicles and exosomes during chronic viral and bacterial infection.51–53 By understanding the disease- and tissue-specific EV-associated biomarkers, this novel immunocapture assay can be utilized to accurately detect and isolate these EVs in the blood. Our results show that circulating EVs are heterogenous since most cells in the body release EVs to maintain cellular homeostasis.54 Surprisingly, more than 50% of serum EVs did not express conventional exosome or microvesicle markers. One recent study showed substantial EV diversity in the blood and predominantly of hematopoietic origin compared to tissue origin.55 In addition to EVs shed from infected cells and diseased tissues, many other biomolecules including protein aggregates, protein-DNA and protein-RNA complexes, ultra-fine bubbles, salt precipitates, and lipoproteins aggregates can be co-isolated from peripheral blood samples.56,57 We examined whether the cellular origin of circulating EVs could be determined using the F-NTA approach. Quantification of hepatocyte-derived EVs was performed using a PE-labeled antibody to the asialoglycoprotein receptor (ASGPR1). ASGPR1 expression in the liver is decreased in cirrhosis and HCC due to loss of polarized secretion.32 Our data are consistent with the literature showing ASGPR1 expression decreased with progression from the healthy liver to cirrhosis and HCC.29–32
Clinical utility was also demonstrated with the F-NTA-based HCC exosome quantification approach.The ease and accuracy of the method allowed for HCC exosome quantification by combining it with immunocapture and size exclusion chromatography. As a proof-of-principle, we selected two cancer-specific antibodies that are exclusively expressed on EV of HCC origin and showed minimal cross-reactivity with cholangiocarcinoma, a liver cancer of different cell origin. Our data show that the F-NTA is sensitive enough to determine the concentration of HCC exosomes in clinical samples. Using GPC3, AFP, and the biomarker combination, we showed that the detection of HCC-derived exosomes is specific to HCC diagnosis with AUC values of 0.79 for GPC3, AUC values of 0.71 for AFP, and AUC values of 0.72 to discriminate cirrhosis vs HCC. The F-NTA-based measurement correlates well with data generated by immunomagnetic bead-based flow cytometry for HCC exosome detection. To demonstrate whether this HCC-exosome quantification can be a potential serum test for detecting early-stage HCC, the assay was validated using the HCC cohort whose diagnosis was confirmed by MRI-based liver imaging. The HCC exosome quantification data correlated well with the diameter of the index HCC tumor assessed by MRI. Biostatistical analysis shows that quantification of HCC exosomes using GPC3 antibody is consistent with serum AFP levels. This suggests that the GPC3+ve exosome concentration in combination with serum AFP may improve diagnostic potential. Quantification of HCC exosomes using AFP antibody increased background staining and decreased the sensitivity and specificity of GPC3-based exosome level in identifying the HCC population. The diagnostic value of F-NTA-based HCC exosome quantification using GPC3 antibody is excellent that can be used for HCC detection among liver cirrhosis. Despite the limitation of F-NTA which is a time-consuming procedure, we propose that this analysis can be extended in clinical practice for the diagnosis of HCC with developing automation techniques.
Quantitation of AFP and GPC3 proteins in the serum are well-established biomarkers for HCC diagnosis. The biological relationship between the release of these two proteins and HCC growth in liver cirrhosis is unclear. Others and our lab showed that impaired autophagy response in HCC promotes exosome release. Wide varieties of tumor-derived cargoes are enclosed in the endosomal vesicles and released outside because tumor cells cannot degrade these molecules. Quantifying tumor exosomes is essential to establish the biological relationship between tumor growth in parent tissue and exosome signal. AFP and GPC3 proteins are encapsulated into multivesicular bodies of HCC tumors and released outside the exosomes. Therefore, counting the number of eAFP+eGPC3 vesicles should establish a causal relationship with the size of the HCC tumor mass in the liver. The F-NTA method can simultaneously quantify the presence of more than one HCC-specific biomolecule in vesicles. The fluorescence signal depends on the number of biomolecules selected in the HCC exosomes. As a proof-of-principle, we demonstrated that eAFP+eGPC3 correlates with HCC size determined by MRI. F-NTA technique quantifies microvesicle and exosome concentration in the serum. For instance, quantifying polarized release ASGPR-positive extracellular vesicles can directly assess the hepatic function and healthy liver versus cirrhotic liver. The F-NTA-based exosome quantification is a novel assay that should bring exosomal biomarker utility to the clinic to monitor the biological relationship between exosome signal and parent tissue.
Various techniques, such as ELISA and affinity flow analysis, are used to detect extracellular vesicles in body fluids. One of the limitations of these assays is that there is no consensus on quantifying the number of cancer-specific biomolecules enriched in EV preparation. Affinity exo-ELISA that detects tumor exosomes requires a standard curve to quantify biomolecules present in the EVs. Flow cytometry-based assay used for exosome quantification measures the percentage increase or decrease of the cargo enrichment. It is impossible to compare the results of one assay with the other. Moreover, all these techniques require some precipitation and centrifugation, which alters the EV conformation and biomolecule quantification in their native state. The F-NTA approach described here has the advantage of directly quantifying membrane vesicles and their concentration change in various human diseases.
The F-NTA quantitation use also has the following limitations. The F-NTA method is very time-consuming and operator-specific. A small number of samples can be analyzed per day. Individuals with specific expertise can do these analyses. A small volume of serum is required for exosome quantification by F-NTA. Fluorescence bleaching is a concern; therefore, the samples after column purification should be protected from light. However, the F-NTA can be automated to overcome these limitations for large-scale biomarker screening for HCC.
Conclusion
For many years, HCC surveillance has centered around ultrasound imaging with the serum AFP biomarker. More recently, gender, age, and three serum markers (AFP-L3, AFP, and Des-carboxyprothrombin) have been combined to develop the GALAD score for HCC surveillance. Unfortunately, the GALAD score performance did not outperform other methods based on recent studies.58,59 There is a need to develop HCC biomarkers directly associated with the biology of HCC. Recently, many recent publications show that various biomolecules such as circulating tumor DNA, miRNA, non-coding RNA, and protein detection in the serum EVs have immense potential as serum biomarkers for HCC detection.60–64 Many of these candidate markers do not address the potential challenges facing the early detection of cancer, which include: (i) understanding the molecular biology of cancer etiology that contribute to cancer initiation; (ii), early identification of high-risk patients; (iii), identifying and validating organ-specific biomolecules for early-stage cancer detection; (iv), development of technology to quantify these molecules in their native state; (v), appropriate performance evaluation through multi-site collaboration.65 Our ongoing research shows that adaptive plasticity to multifaceted stress response generated during chronic HCV infection determines who is at risk of HCC development. We have selected biomolecules specific to liver cancer and show altered expression during cancer development due to impaired autophagy. This study aimed to develop an innovative assay that can rapidly and directly quantify HCC exosomes using a small quantity of serum using specific molecules amendable to biomarker development, prognosis, and early HCC detection. This assay is simple; therefore, it can be adapted to any clinical laboratory for cancer exosome quantification as a method for HCC detection in the liver through a blood test.
Author Contributions
All authors made a significant contribution to the work reported, whether that is in the conception, study design, execution, acquisition of data, analysis and interpretation, or in all these areas; took part in drafting, revising or critically reviewing the article; gave final approval of the version to be published; have agreed on the journal to which the article has been submitted; and agree to be accountable for all aspects of the work.
Funding
This work was supported by funds derived from a Veterans Affairs Merit Review Grant (1101 BX004516-01A1), Bridge Funding from Tulane University Health Sciences Center and the Department of Pathology and Laboratory Medicine, and a grant from the American Society of Transplant Surgeons. Nergiz Ekmen was supported by funds received from Akdamar Felllowship Program, Department of Gastroenterology and Hepatology Tulane University Health Science Center.
Disclosure
Dr Tyler Sandow reports personal fees from Boston Scientific, outside the submitted work. Dr Martin Moehlen reports grants from Merck Sharp & Dohme Corporation and Bristol- Myers Squibb; personal fees from Gilead Sciences, Inc. and Intercept Pharmaceuticals, Inc., outside the submitted work. Dr Paul Thevenot reports grants from American Society of Transplant Surgeons, during the conduct of the study. The authors report no other conflicts of interest in this work
References
1. Chung BK, Karlsen TH, Folseraas T. Cholangiocytes in the pathogenesis of primary sclerosing cholangitis and development of cholangiocarcinoma. Biochim Biophys Acta Mol Basis Dis. 2018;1864(4 Pt B):1390–1400. doi:10.1016/j.bbadis.2017.08.020
2. Massarweh NN, El-Serag HB. Epidemiology of Hepatocellular carcinoma and intrahepatic cholangiocarcinoma. Cancer Control. 2017;24(3):1073274817729245. doi:10.1177/1073274817729245
3. Paradis V, Zucman-Rossi J. Pathogenesis of primary liver carcinomas. J Hepatol. 2023;78(2):448–449. doi:10.1016/j.jhep.2022.05.037
4. Sung H, Ferlay J, Siegel RL, et al. Global cancer statistics 2020: GLOBOCAN estimates of incidence and mortality worldwide for 36 cancers in 185 countries. CA Cancer J Clin. 2021;71(3):209–249. doi:10.3322/caac.21660
5. Sia D, Villanueva A, Friedman SL, Llovet JM. Liver cancer cell of origin, molecular class, and effects on patient prognosis. Gastroenterology. 2017;152(4):745–761. doi:10.1053/j.gastro.2016.11.048
6. Kuper H, Ye W, Broomé U, et al. The risk of liver and bile duct cancer in patients with chronic viral hepatitis, alcoholism, or cirrhosis. Hepatology. 2001;34(4 Pt 1):714–718. doi:10.1053/jhep.2001.28233
7. Paik JM, Golabi P, Younossi Y, Mishra A, Younossi ZM. Changes in the global burden of chronic liver diseases from 2012 to 2017: the growing impact of NAFLD. Hepatology. 2020;72(5):1605–1616. doi:10.1002/hep.31173
8. Younossi ZM, Otgonsuren M, Henry L, et al. Association of nonalcoholic fatty liver disease (NAFLD) with hepatocellular carcinoma (HCC) in the United States from 2004 to 2009. Hepatology. 2015;62(6):1723–1730. doi:10.1002/hep.28123
9. Fazel Y, Koenig AB, Sayiner M, Goodman ZD, Younossi ZM. Epidemiology and natural history of non-alcoholic fatty liver disease. Metabolism. 2016;65(8):1017–1025. doi:10.1016/j.metabol.2016.01.012
10. Satriano L, Lewinska M, Rodrigues PM, Banales JM, Andersen JB. Metabolic rearrangements in primary liver cancers: cause and consequences. Nat Rev Gastroenterol Hepatol. 2019;16(12):748–766. doi:10.1038/s41575-019-0217-8
11. Barouki R, Samson M, Blanc EB, et al. The exposome and liver disease - how environmental factors affect liver health. J Hepatol. 2023;79(2):492–505. doi:10.1016/j.jhep.2023.02.034
12. Gentile D, Donadon M, Lleo A, et al. Surgical treatment of Hepatocholangiocarcinoma: a systematic review. Liver Cancer. 2020;9(1):15–27. doi:10.1159/000503719
13. Ronot M, Nahon P, Rimola J. Screening of liver cancer with abbreviated MRI. Hepatology. 2023;78(2):670–686. doi:10.1097/hep.0000000000000339
14. Marrero JA, Kulik LM, Sirlin CB, et al. Diagnosis, staging, and management of hepatocellular carcinoma: 2018 practice guidance by the American Association for the study of liver diseases. Hepatology. 2018;68(2):723–750. doi:10.1002/hep.29913
15. Singal AG, Conjeevaram HS, Volk ML, et al. Effectiveness of hepatocellular carcinoma surveillance in patients with cirrhosis. Cancer Epidemiol Biomarkers Prev. 2012;21(5):793–799. doi:10.1158/1055-9965.Epi-11-1005
16. Singal AG, Hoshida Y, Pinato DJ, et al. International Liver Cancer Association (ILCA) White Paper on Biomarker Development for Hepatocellular Carcinoma. Gastroenterology. 2021;160(7):2572–2584. doi:10.1053/j.gastro.2021.01.233
17. Yang JD, Kim WR. Surveillance for hepatocellular carcinoma in patients with cirrhosis. Clin Gastroenterol Hepatol. 2012;10(1):16–21. doi:10.1016/j.cgh.2011.06.004
18. van Niel G, D’Angelo G, Raposo G. Shedding light on the cell biology of extracellular vesicles. Nat Rev Mol Cell Biol. 2018;19(4):213–228. doi:10.1038/nrm.2017.125
19. Deatherage BL, Cookson BT. Membrane vesicle release in bacteria, eukaryotes, and archaea: a conserved yet underappreciated aspect of microbial life. Infect Immun. 2012;80(6):1948–1957. doi:10.1128/iai.06014-11
20. Stanly C, Fiume I, Capasso G, Pocsfalvi G. Isolation of exosome-like vesicles from plants by ultracentrifugation on sucrose/deuterium oxide (D2O) density cushions. Methods Mol Biol. 2016;1459:259–269. doi:10.1007/978-1-4939-3804-9_18
21. Tan S, Yang Y, Yang W, et al. Exosomal cargos-mediated metabolic reprogramming in tumor microenvironment. J Exp Clin Cancer Res. 2023;42(1):59. doi:10.1186/s13046-023-02634-z
22. Leidal AM, Debnath J. Emerging roles for the autophagy machinery in extracellular vesicle biogenesis and secretion. FASEB Bioadv. 2021;3(5):377–386. doi:10.1096/fba.2020-00138
23. Xu L, Wu LF, Deng FY. Exosome: an emerging source of biomarkers for human diseases. Curr Mol Med. 2019;19(6):387–394. doi:10.2174/1566524019666190429144310
24. Gupta D, Liang X, Pavlova S, et al. Quantification of extracellular vesicles in vitro and in vivo using sensitive bioluminescence imaging. J Extracell Vesicles. 2020;9(1):1800222. doi:10.1080/20013078.2020.1800222
25. Németh K, Varga Z, Lenzinger D, et al. Extracellular vesicle release and uptake by the liver under normo- and hyperlipidemia. Cell Mol Life Sci. 2021;78(23):7589–7604. doi:10.1007/s00018-021-03969-6
26. Basthi Mohan P, Rajpurohit S, Musunuri B, Bhat G, Lochan R, Shetty S. Exosomes in chronic liver disease. Clin Chim Acta. 2023;540:117215. doi:10.1016/j.cca.2022.117215
27. Gong J, Tu W, Liu J, Tian D. Hepatocytes: a key role in liver inflammation. Front Immunol. 2022;13:1083780. doi:10.3389/fimmu.2022.1083780
28. Thietart S, Rautou PE. Extracellular vesicles as biomarkers in liver diseases: a clinician’s point of view. J Hepatol. 2020;73(6):1507–1525. doi:10.1016/j.jhep.2020.07.014
29. Matsuura S, Nakada H, Sawamura T, Tashiro Y. Distribution of an asialoglycoprotein receptor on rat hepatocyte cell surface. J Cell Biol. 1982;95(3):864–875. doi:10.1083/jcb.95.3.864
30. Trere D, Fiume L, De Giorgi LB, Di Stefano G, Migaldi M, Derenzini M. The asialoglycoprotein receptor in human hepatocellular carcinomas:its expression on proliferating cells. Br J Cancer. 1999;81(3):404–408. doi:10.1038/sj.bjc.6690708
31. Hyodo I, Mizuno M, Yamada G, Tsuji T. Distribution of asialoglycoprotein receptor in human hepatocellular carcinoma. Liver. 1993;13(2):80–85. doi:10.1111/j.1600-0676.1993.tb00611.x
32. Shi B, Abrams M, Sepp-Lorenzino L. Expression of asialoglycoprotein receptor 1 in human hepatocellular carcinoma. J Histochem Cytochem. 2013;61(12):901–909. doi:10.1369/0022155413503662
33. Aydin Y, Koksal AR, Reddy V, et al. Extracellular vesicle release promotes viral replication during persistent HCV infection. Cells. 2021;10(5):984. doi:10.3390/cells10050984
34. Aydin Y, Koksal AR, Thevenot P, et al. Experimental validation of novel glypican 3 exosomes for the detection of hepatocellular carcinoma in liver cirrhosis. J Hepatocell Carcinoma. 2021;8:1579–1596. doi:10.2147/jhc.S327339
35. Aydin Y, Stephens CM, Chava S, et al. Chaperone-mediated autophagy promotes beclin1 degradation in persistently infected hepatitis C virus cell culture. Am J Pathol. 2018;188(10):2339–2355. doi:10.1016/j.ajpath.2018.06.022
36. Chava S, Lee C, Aydin Y, et al. Chaperone-mediated autophagy compensates for impaired macroautophagy in the cirrhotic liver to promote hepatocellular carcinoma. Oncotarget. 2017;8(25):40019–40036. doi:10.18632/oncotarget.16685
37. Koksal AR, Thevenot P, Aydin Y, et al. Impaired autophagy response in Hepatocellular Carcinomas enriches glypican-3 in exosomes, not in the microvesicles. J Hepatocell Carcinoma. 2022;9:959–972. doi:10.2147/jhc.S376210
38. Bastos N, Ruivo CF, da Silva S, Melo SA. Exosomes in cancer: use them or target them? Semin Cell Dev Biol. 2018;78:13–21. doi:10.1016/j.semcdb.2017.08.009
39. Johnsen KB, Gudbergsson JM, Skov MN, Pilgaard L, Moos T, Duroux M. A comprehensive overview of exosomes as drug delivery vehicles - endogenous nanocarriers for targeted cancer therapy. Biochim Biophys Acta. 2014;1846(1):75–87. doi:10.1016/j.bbcan.2014.04.005
40. Kurian TK, Banik S, Gopal D, Chakrabarti S, Mazumder N. Elucidating methods for isolation and quantification of exosomes: a review. Mol Biotechnol. 2021;63(4):249–266. doi:10.1007/s12033-021-00300-3
41. Théry C, Witwer KW, Aikawa E, et al. Minimal information for studies of extracellular vesicles 2018 (MISEV2018): a position statement of the International Society for Extracellular Vesicles and update of the MISEV2014 guidelines. J Extracell Vesicles. 2018;7(1):1535750. doi:10.1080/20013078.2018.1535750
42. Koritzinsky EH, Street JM, Star RA, Yuen PS. Quantification of exosomes. J Cell Physiol. 2017;232(7):1587–1590. doi:10.1002/jcp.25387
43. Carnell-Morris P, Tannetta D, Siupa A, Hole P, Dragovic R. Analysis of extracellular vesicles using fluorescence nanoparticle tracking analysis. Methods Mol Biol. 2017;1660:153–173. doi:10.1007/978-1-4939-7253-1_13
44. Griffiths D, Carnell-Morris P, Wright M. Nanoparticle tracking analysis for multiparameter characterization and counting of nanoparticle suspensions. Methods Mol Biol. 2020;2118:289–303. doi:10.1007/978-1-0716-0319-2_22
45. Dragovic RA, Gardiner C, Brooks AS, et al. Sizing and phenotyping of cellular vesicles using nanoparticle tracking analysis. Nanomedicine. 2011;7(6):780–788. doi:10.1016/j.nano.2011.04.003
46. Giebel B, Helmbrecht C. Methods to analyze EVs. Methods Mol Biol. 2017;1545:1–20. doi:10.1007/978-1-4939-6728-5_1
47. Kestens V, Bozatzidis V, De Temmerman PJ, Ramaye Y, Roebben G. Validation of a particle tracking analysis method for the size determination of nano- and microparticles. J Nanopart Res. 2017;19(8):271. doi:10.1007/s11051-017-3966-8
48. Alberro A, Iparraguirre L, Fernandes A, Otaegui D. Extracellular vesicles in blood: sources, effects, and applications. Int J Mol Sci. 2021;22(15):8163. doi:10.3390/ijms22158163
49. Böing AN, van der Pol E, Grootemaat AE, Coumans FA, Sturk A, Nieuwland R. Single-step isolation of extracellular vesicles by size-exclusion chromatography. J Extracell Vesicles. 2014;3. doi: 10.3402/jev.v3.23430.
50. Gámez-Valero A, Monguió-Tortajada M, Carreras-Planella L, Franquesa M, Beyer K, Borràs FE. Size-exclusion chromatography-based isolation minimally alters extracellular vesicles’ characteristics compared to precipitating agents. Sci Rep. 2016;6:33641. doi:10.1038/srep33641
51. Buratta S, Tancini B, Sagini K, et al. Lysosomal exocytosis, exosome release and secretory autophagy: the autophagic- and endo-lysosomal systems go extracellular. Int J Mol Sci. 2020;21(7):2576. doi:10.3390/ijms21072576
52. Qiang L, Hu J, Tian M, et al. Extracellular vesicles from helicobacter pylori-infected cells and helicobacter pylori outer membrane vesicles in atherosclerosis. Helicobacter. 2022;27(2):e12877. doi:10.1111/hel.12877
53. Xu J, Yang KC, Go NE, et al. Chloroquine treatment induces secretion of autophagy-related proteins and inclusion of Atg8-family proteins in distinct extracellular vesicle populations. Autophagy. 2022;18(11):2547–2560. doi:10.1080/15548627.2022.2039535
54. Li Y, He X, Li Q, et al. EV-origin: enumerating the tissue-cellular origin of circulating extracellular vesicles using exLR profile. Comput Struct Biotechnol J. 2020;18:2851–2859. doi:10.1016/j.csbj.2020.10.002
55. Holcar M, Kandušer M, Lenassi M. Blood nanoparticles - influence on extracellular vesicle isolation and characterization. Front Pharmacol. 2021;12:773844. doi:10.3389/fphar.2021.773844
56. Karimi N, Dalirfardouei R, Dias T, Lötvall J, Lässer C. Tetraspanins distinguish separate extracellular vesicle subpopulations in human serum and plasma - contributions of platelet extracellular vesicles in plasma samples. J Extracell Vesicles. 2022;11(5):e12213. doi:10.1002/jev2.12213
57. Minakaki G, Menges S, Kittel A, et al. Autophagy inhibition promotes SNCA/alpha-synuclein release and transfer via extracellular vesicles with a hybrid autophagosome-exosome-like phenotype. Autophagy. 2018;14(1):98–119. doi:10.1080/15548627.2017.1395992
58. Tayob N, Kanwal F, Alsarraj A, Hernaez R, El-Serag HB. The performance of AFP, AFP-3, DCP as biomarkers for detection of Hepatocellular Carcinoma (HCC): a Phase 3 biomarker study in the United States. Clin Gastroenterol Hepatol. 2023;21(2):415–423.e4. doi:10.1016/j.cgh.2022.01.047
59. Beudeker BJB, Fu S, Balderramo D, et al. Validation and optimization of AFP-based biomarker panels for early HCC detection in Latin AMerica and Europe. Hepatol Commun. 2023;7(10):e0264. doi:10.1097/HC9.0264
60. Adeniji N, Dhanasekaran R. Current and emerging tools for Hepatocellular carcinoma surveillance. Hepatol Commun. 2021;5(12):1972–1986. doi:10.1002/hep4.1823
61. Chalasani NP, Ramasubramanian TS, Bhattacharya A, et al. A novel blood-based panel of methylated DNA and protein markers for detection of early-stage Hepatocellular Carcinoma. Clin Gastroenterol Hepatol. 2021;19(12):2597–2605.e4. doi:10.1016/j.cgh.2020.08.065
62. Chan LK, Tsui YM, Ho DW, Ng IO. Cellular heterogeneity and plasticity in liver cancer. Semin Cancer Biol. 2022;82:134–149. doi:10.1016/j.semcancer.2021.02.015
63. Chen VL, Xu D, Wicha MS, Lok AS, Parikh ND. Utility of liquid biopsy analysis in detection of hepatocellular carcinoma, determination of prognosis, and disease monitoring: a systematic review. Clin Gastroenterol Hepatol. 2020;18(13):2879–2902.e9. doi:10.1016/j.cgh.2020.04.019
64. Sun N, Lee YT, Zhang RY, et al. Purification of HCC-specific extracellular vesicles on nanosubstrates for early HCC detection by digital scoring. Nat Commun. 2020;11(1):4489. doi:10.1038/s41467-020-18311-0
65. Crosby D, Bhatia S, Brindle KM, et al. Early detection of cancer. Science. 2022;375(6586):eaay9040. doi:10.1126/science.aay9040
 © 2023 The Author(s). This work is published and licensed by Dove Medical Press Limited. The
full terms of this license are available at https://www.dovepress.com/terms
and incorporate the Creative Commons Attribution
- Non Commercial (unported, 3.0) License.
By accessing the work you hereby accept the Terms. Non-commercial uses of the work are permitted
without any further permission from Dove Medical Press Limited, provided the work is properly
attributed. For permission for commercial use of this work, please see paragraphs 4.2 and 5 of our Terms.
© 2023 The Author(s). This work is published and licensed by Dove Medical Press Limited. The
full terms of this license are available at https://www.dovepress.com/terms
and incorporate the Creative Commons Attribution
- Non Commercial (unported, 3.0) License.
By accessing the work you hereby accept the Terms. Non-commercial uses of the work are permitted
without any further permission from Dove Medical Press Limited, provided the work is properly
attributed. For permission for commercial use of this work, please see paragraphs 4.2 and 5 of our Terms.
Recommended articles
Predictive Value of Preoperative Serum AFP, CEA, and CA19-9 Levels in Patients with Single Small Hepatocellular Carcinoma: Retrospective Study
Gan L, Ren S, Lang M, Li G, Fang F, Chen L, Liu Y, Han R, Zhu K, Song T
Journal of Hepatocellular Carcinoma 2022, 9:799-810
Published Date: 13 August 2022
Impaired Autophagy Response in Hepatocellular Carcinomas Enriches Glypican-3 in Exosomes, Not in the Microvesicles
Koksal AR, Thevenot P, Aydin Y, Nunez K, Sandow T, Widmer K, Nayak L, Scott J, Delk M, Moehlen MW, Cohen AJ, Dash S
Journal of Hepatocellular Carcinoma 2022, 9:959-972
Published Date: 7 September 2022
Identification of the Level of Exosomal Protein by Parallel Reaction Monitoring Technology in HCC Patients
Huang H, Zhang Q, Zhang Y, Sun X, Liu C, Wang Q, Huang Y, Li Q, Wu Z, Pu C, Sun A
International Journal of General Medicine 2022, 15:7831-7842
Published Date: 14 October 2022
Surface Engineering of HEK293 Cell-Derived Extracellular Vesicles for Improved Pharmacokinetic Profile and Targeted Delivery of IL-12 for the Treatment of Hepatocellular Carcinoma
Zhang J, Song H, Dong Y, Li G, Li J, Cai Q, Yuan S, Wang Y, Song H
International Journal of Nanomedicine 2023, 18:209-223
Published Date: 13 January 2023
Serum Aldo-Keto Reductase Family 1 Member B10 (AKR1B10) as a Potential Biomarker for Diagnosis of Hepatocellular Carcinoma
Wang Z, Kong L, Zhang R, Yang X, Cao Z, Xu T, Zhang H, Dou Y
Journal of Hepatocellular Carcinoma 2024, 11:131-143
Published Date: 16 January 2024