")
Back to Journals » Journal of Multidisciplinary Healthcare » Volume 9
A simple dietary assessment tool to monitor food intake of hospitalized adult patients
Authors Budiningsari D, Shahar S, Abd Manaf Z, Susetyowati S
Received 25 January 2016
Accepted for publication 22 April 2016
Published 26 July 2016 Volume 2016:9 Pages 311—322
DOI https://doi.org/10.2147/JMDH.S105000
Checked for plagiarism Yes
Review by Single anonymous peer review
Peer reviewer comments 2
Editor who approved publication: Dr Scott Fraser
Dwi Budiningsari,1,2 Suzana Shahar,1 Zahara Abdul Manaf,1 Susetyowati Susetyowati2
1Dietetic Programme, School of Healthcare Sciences, Faculty of Health Sciences, Universiti Kebangsaan Malaysia, Kuala Lumpur, Malaysia; 2Department of Health Nutrition, Faculty of Medicine, Gadjah Mada University, Yogyakarta, Indonesia
Background/objectives: Monitoring food intake of patients during hospitalization using simple methods and minimal training is an ongoing problem in hospitals. Therefore, there is a need to develop and validate a simple, easy to use, and quick tool that enables staff to estimate dietary intake. Thus, this study aimed to develop and validate the Pictorial Dietary Assessment Tool (PDAT).
Subjects and methods: A total of 37 health care staff members consisting of dietitians, nurses, and serving assistants estimated 130 breakfast and lunch meals consumed by 67 patients using PDAT. PDAT was developed based on the hospital menu that consists of staple food (rice or porridge), animal source protein (chicken, meat, eggs, and fish), and non-animal source protein (tau fu and tempeh), with a total of six pictorials of food at each meal time. Weighed food intake was used as a gold standard to validate PDAT. Agreement between methods was analyzed using correlations, paired t-test, Bland–Altman plots, kappa statistics, and McNemar’s test. Sensitivity, specificity, and area under the curve of receiver operating characteristic were calculated to identify whether patients who had an inadequate food intake were categorized as at risk by the PDAT, based on the food weighing method. Agreement between different backgrounds of health care staff was calculated by intraclass correlation coefficient and analysis of variance test.
Results: There was a significant correlation between the weighing food method and PDAT for energy (r=0.919, P<0.05), protein (r=0.843, P<0.05), carbohydrate (r=0.912, P<0.05), and fat (r=0.952; P<0.05). Nutrient intakes as assessed using PDAT and food weighing were rather similar (295±163 vs 292±158 kcal for energy; 13.9±7.8 vs 14.1±8.0 g for protein; 46.1±21.4 vs 46.7±22.3 g for carbohydrate; 7.4±3.1 vs 7.4±3.1 g for fat; P>0.05). The PDAT and food weighing method showed a satisfactory agreement beyond chance (k) (0.81 for staple food and animal source protein; 0.735 for non-animal source protein). Intraclass correlation coefficient ranged between 0.91 and 0.96 among respondents. There were no differences in energy, protein, carbohydrate, and fat intake estimated among health care staff (P=0.967; P=0.951; P=0.888; P=0.847, respectively).
Conclusion: In conclusion, PDAT provides a valid estimation of macronutrient consumption among hospitalized adult patients.
Keywords: validation, dietary assessment tool, nutrient intake, plate waste, hospitalized patients
Introduction
Inadequate food intake among hospitalized patients is a common problem1-4 that can lead to malnutrition which is associated with an increased risk of complications, longer hospital stay leading to increased cost, frequent readmission, and mortality.5,6 Globally, malnutrition affects up to 40% of hospitalized patients,1 with higher prevalence in developing countries (47%–50%) in comparison to developed countries (20%–46%).2 A multicenter study involving 293 patients from three large hospitals in Indonesia revealed that as many as 56.9% of patients were malnourished as assessed using the Subjective Global Assessment.7 Similarly, 55.2% of 181 geriatric patients were classified as malnourished in a teaching hospital in Malaysia.8 Approximately 23% of 275 patients randomly assessed by Subjective Global Assessment on admission, in a tertiary teaching hospital in Melbourne, were malnourished.9 The European Society for Parenteral and Enteral Nutrition and the American Society for Parenteral and Enteral Nutrition have provided the guidelines of nutritional screening for patients admitted to hospital.10,11 Furthermore, the Ministry of Health of the Republic of Indonesia have emphasized the importance of the nutritional care process for all patients with nutritional risks, and one of these steps is the monitoring of patients’ food intake.12 Health care professionals often rely on food intake reports to identify patients who are at risk and to further plan, execute, and evaluate nutritional interventions.13-23 As the accurate collection of dietary intake information for patients is a difficult and resource-intensive task, it seems essential to develop and validate a simple and reliable method for tracking food intake under clinical settings.14-23 Several studies have acknowledged that the recording of food intake is generally poor, for a number of reasons.22-27 Nurse-completed food records are often incorrect or incomplete, which may be due to reasons such as removal of meal trays by the catering staff before the nursing staff have observed food intake, competing tasks and responsibilities of nurses at meal times, and inadequate training or understanding of the importance of food intake monitoring for nutritional assessment.28
While several studies have shown that visual estimation tools for measuring food intake are more valid,14-23 studies reporting the validity of estimating semisolid or amorphous food items are scarce.22,23 In addition, it is necessary to develop and validate food recording methods specific to countries and settings, particularly in Asian countries which have different food textures and characteristics. Thus, this study aims to develop and validate a simple dietary assessment tool for the estimation of macronutrient intake of hospitalized patients, by comparison with the food weighing method.
Methods
Study design and location
The study was conducted in the internal medicine wards at the Dr Sardjito Hospital, a 770-bed tertiary hospital in Yogyakarta, Indonesia. The study was performed in September 2015 and approval from both the ethical committee of the National University of Malaysia and the local ethics committee of the Dr Sardjito Hospital, Yogyakarta, Indonesia were obtained. Additionally, written informed consent was obtained from each respondent before they were recruited.
Development of Pictorial Dietary Assessment Tool (PDAT)
The Pictorial Dietary Assessment Tool (PDAT) was developed to estimate food intake by patients, as illustrated in Figure 1. It was developed based on the needs assessment conducted among 111 health care staff consisting of 53 nurses, 27 dieticians, and 31 serving assistants in six hospitals,29 as well as from literature review. The PDAT was adapted from the visual Comstock 6-point scale to estimate the proportion of food remaining after patients’ meal times, with additional information on energy and protein content of the meals. The PDAT tool is written as a ready reckoner, to enable observers to directly estimate the nutrient intake of patients at each meal. For each level of intake, there are two values given for energy and protein (eg, 390/513 kcal and 23/25 g if 100% has been consumed). These two values represent the energy and protein contents for soft texture food (lower value) and normal texture food (higher value). For example, “390/513 kcal” refers to 390 kcal for porridge or 513 kcal for rice. Observers simply select the pictures that best represent the amount of food consumed. The PDAT consists of six pictures of three food groups: staple food (rice/porridge), animal source protein (chicken, meat, eggs, and fish) and non-animal source protein (bean curd and tempeh). Each picture is partially to fully shaded, to represent the various consumption levels (0%, 25%, 50%, 75%, 80%, and 100%). Additionally, the PDAT comprises eight possible combinations of menu items.
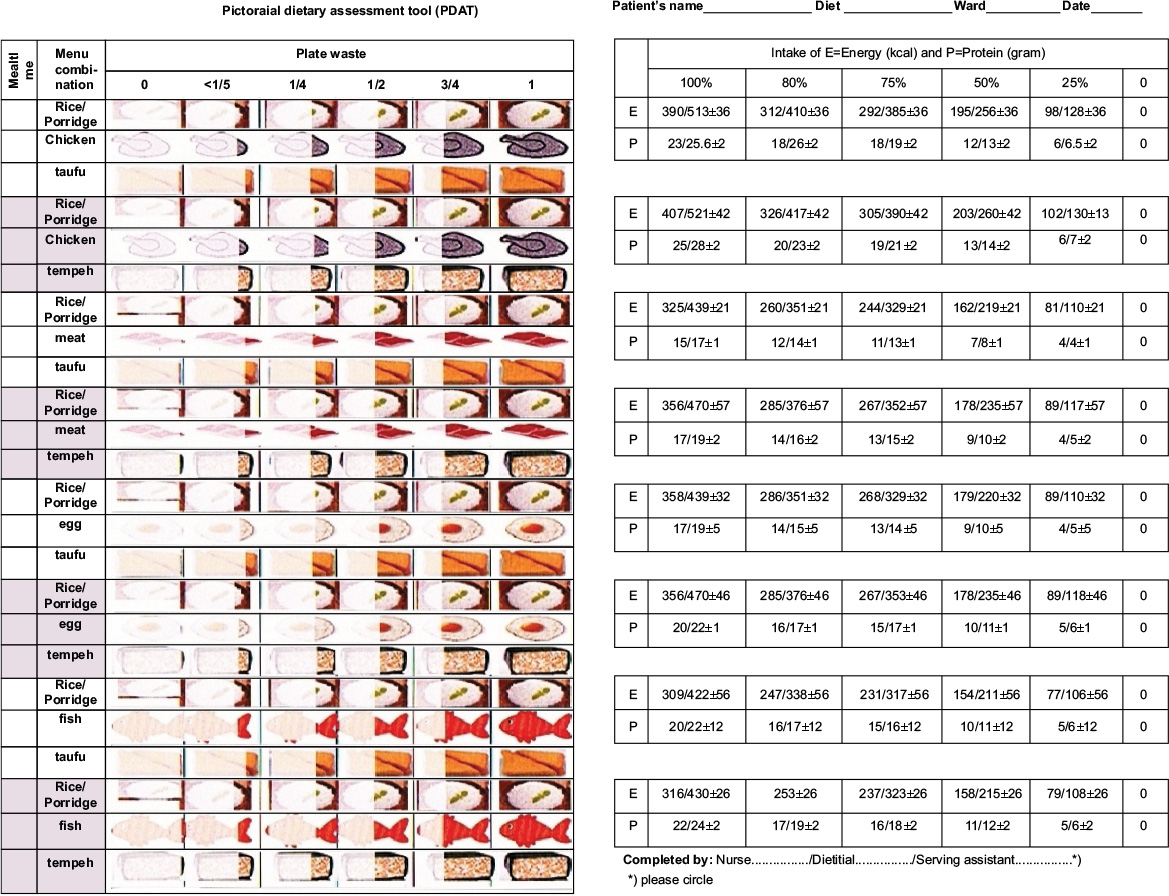 | Figure 1 Pictorial Dietary Assessment Tool (PDAT). Notes: Mealtime: breakfast/lunch/dinner. For each level of intake, there are two values given for energy and protein (eg, 390/513 kcal and 23/25 g if 100% has been consumed). These two values represent the energy and protein contents for soft texture food (lower value) and normal texture food (higher value). |
Food weighing method
The food weighing method was used as a gold standard. The plate waste was weighed soon after the patient had finished his meal, following the estimation of each patient’s single meal (breakfast and lunch) using the PDAT. The researcher was responsible for weighing all the food items individually using an electronic kitchen scale (2 kg capacity, accuracy to ±1 g), with automatic calibration. It should be noted that the same personnel was not assigned to weigh the patients’ plate waste and estimate the intakes using PDAT. The leftovers (grams of each individual food item remaining on the plate) were then subtracted from the standard portion provided to each patient.
Respondents and data collection
Health care staff consisting of eight dietitians, seven nurses, and 22 serving assistants were recruited through total sampling and trained to estimate the food intake of patients using the PDAT. The selection criteria for health care staff were a) currently working in the wards as nurse, dietitian, or serving assistant and b) having more than 3 months’ work experience in the wards. Additionally, the selection criteria for patients were a) adult patients from a nonintensive care department and b) not fasting or abstaining from oral food intake. The exclusion criteria were patients receiving only enteral or parenteral nutrition.
Health care staff were asked to estimate the intakes using the PDAT tool for plate waste for breakfast and lunch meals of two to three patients per day, for a total of 5 to 6 days. Energy and protein intakes were estimated by the staff using the known energy and protein content of the meals, included as a ready reckoner in the PDAT. Two repeated PDAT assessments of a single patient’s plate waste were performed by each of the six staff members of three different backgrounds (bringing a total of six observations for each patient’s plate waste). Two different persons with the same background observed a single patient’s plate waste (two nurses, two dietitians, and two serving assistants). Accordingly, inter-rater reliability among dietitians, nurses, and serving assistants was measured from these observations. The estimation of intake from the different observers (using PDAT) was then compared to the data obtained by the food weighing method as the gold standard. Food weighing was conducted by the researcher after the assessment using PDAT was completed, by using an electronic kitchen scale (2 kg capacity scale) weighed to the nearest 0.1 g. Additionally, the data collection procedure did not influence the patients’ meal time nor food intake.
The energy calculation from comparing two groups indicated that a minimum sample size of 50 meals was required in order to detect a mean difference in dietary energy intake between the test method and reference method of 52 kcal (given the within group standard deviation [SD] 114 kcal).18 In addition, this sample size would also allow the detection of a 16.7 g difference in dietary protein intake (given the within group SD 14.4 g) with 80% energy and type I error probability of ≤0.05. For reliability of the study, a minimum of 40 meals would have to be inspected by observers to detect an agreement of 80%, with energy of 80% at the 5% significance level.30
Data analysis
Distribution of the food intake data was described as mean ± SD. Pearson correlation was performed to assess the association of nutrient intake between two methods of food intake assessment. A paired t-test was used to compare the differences in mean nutrient intakes between the two methods. The McNemar’s test for percentage of estimates within 15% (P15) and 30% (P30) of the “gold standard” was performed to calculate the accuracy between PDAT vs food weighing. The overall agreement for macronutrient intake between the two methods was assessed by the Bland–Altman plot (average difference ±1.96 SD of the difference). The level of significance was defined as P-value ≤0.05. The agreement level between the weight method and the PDAT was calculated as agreement beyond chance using the kappa statistic. Given that the values of plate waste obtained by weighing were continuous numerical variables, weights were categorized into six levels using the following cutoff values: 0% from 0 to 9; 25% from 16 to 34; 50% from 41 to 59; 75% from 66 to 75; 80% from 76 to 88; and 100% from 91 to 100. If the value was 60% of an item, incremental estimates of either 50% or 75% would have been considered correct. Moreover, for the purpose of the statistical analysis, in the event that there were two possible correct incremental estimates, we assigned the incremental estimate that was closest to the staff’s recorded estimate.23
The sensitivity and specificity were calculated with regard to the clinical use of the PDAT targeting its capacity to identify the patients who have inadequate food intake, and who may be considered at risk of malnutrition. It was carried out with reference to the identification of patients who did not consume 50% or 75% or more of the offered foods. These values were then assessed to represent relevant quantities of food not consumed with potential negative clinical consequences.1
Sensitivity is the percentage of patients who have inadequate food intake and identified as being at risk by the PDAT, while specificity is the percentage of patients who have adequate food intake identified as not at risk of malnutrition by the PDAT. An analysis of the area under the curve of receiver operating characteristic (ROC) was performed to determine the accuracy of the PDAT, which was able to identify whether the patients were at risk or not at risk of malnutrition. Furthermore, an inter-rater reliability analysis of estimated nutrient intake using PDAT among health care staff was obtained using intraclass correlation coefficient. Likewise, differences in macronutrient intake assessed by health care staff of different backgrounds were tested by the analysis of variance (ANOVA) test. A statistical analysis was also performed with a Windows statistical program package (version 20, SPSS Inc., IBM Corporation, Armonk, NY, USA).
Results
Table 1 revealed that the mean ages of health care staff and patients were 40±6.57 and 44±15 years, respectively. The majority of both health care staff and patients were females (89.2% and 64.2%, respectively). Additionally, the mean ± SD years of employment among health care staff was 19±9.8 years. More than half of the patients (53.7%) were on a therapeutic diet and 50.7% of them were admitted to internal medicine wards.
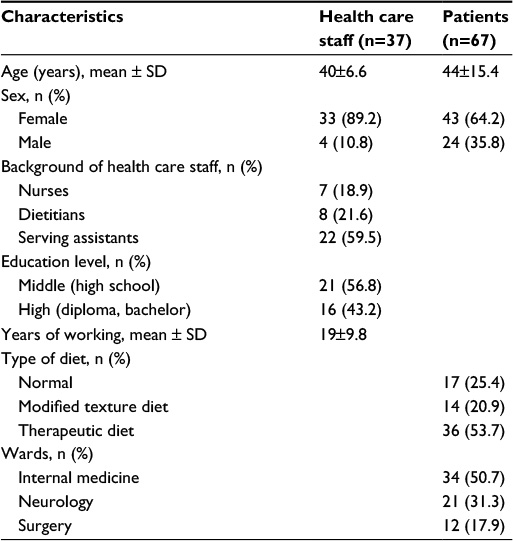 | Table 1 Characteristics of health care staff and patients Abbreviation: SD, standard deviation. |
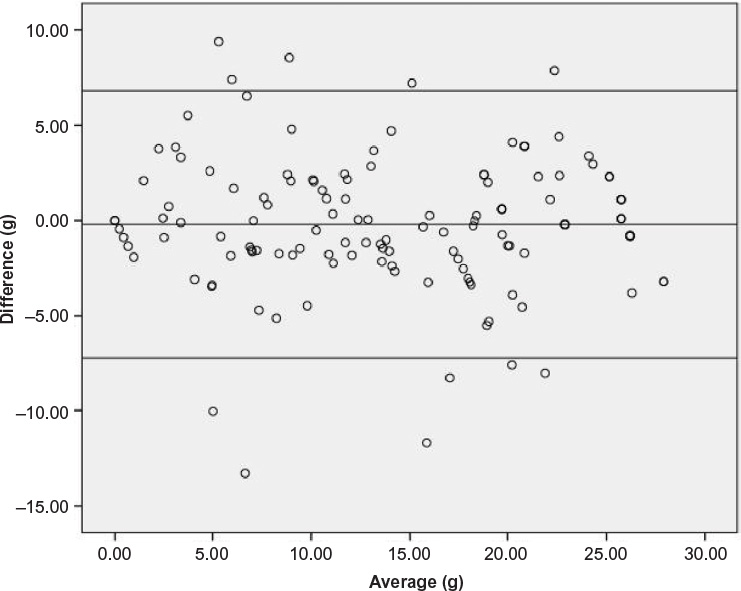
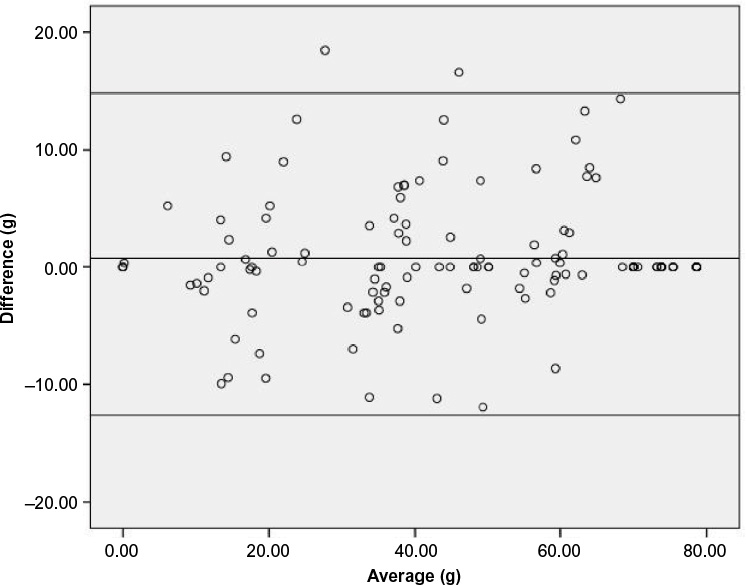
Table 2 depicted that significantly high correlations were obtained between the food weighing method and PDAT for energy (r=0.919, P<0.01), protein (r=0.843, P<0.01), carbohydrate (r=0.912, P<0.01), and fat (r=0.952; P<0.01). Macronutrient intake across meals was not different between PDAT and weighed food intake (295±163 vs 292±158 kcal energy; 13.9±7.8 vs 14.1±8.0 g protein; P>0.05; 46.08±21.4 vs 46.72±22.3 g carbohydrate; 7.4±3.1 vs 7.4±3.1 g protein; P>0.05). In addition, the Bland–Altman analysis indicated that the 95% limit of agreement between the two methods ranged from -108 to 115 (energy), -7.2 to 6.8 (protein), -12.6 to 14.8 (carbohydrate), and -1.9 to 1.8 (fat) (Figures 2–5).
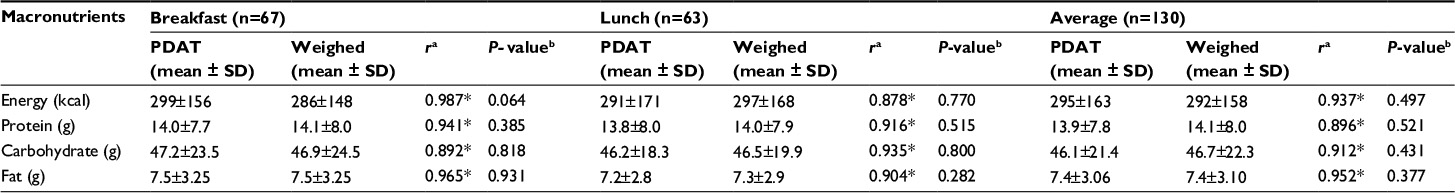 | Table 2 Macronutrient intake estimated by the Pictorial Dietary Assessment Tool (PDAT) compared to food weighing (weighed) Notes: aPearson’s correlation test (*P<0.01); bpaired t-test. Abbreviation: SD, standard deviation. |
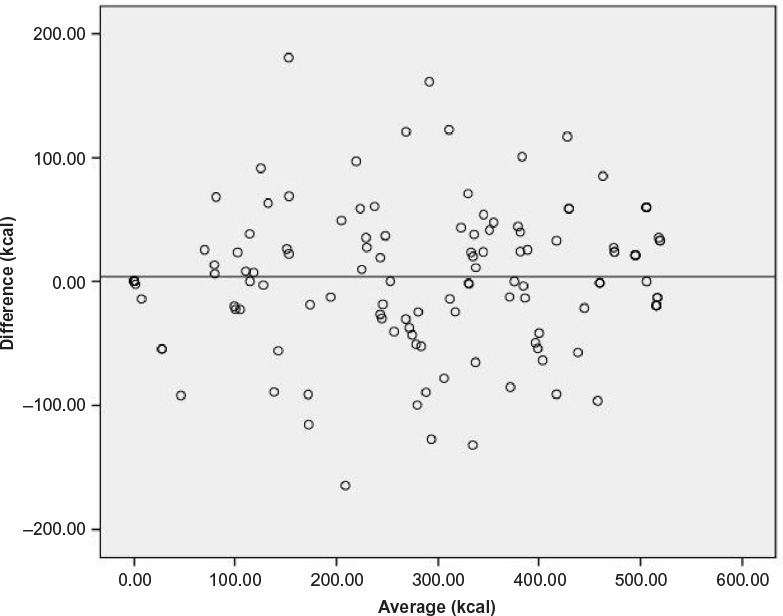 | Figure 2 Bland-Altman of the difference in energy intake (kcal) between PDAT and weighed food values. Abbreviation: PDAT, Pictorial Dietary Assessment Tool. |
 | Figure 3 Bland-Altman of the difference in protein intake (g) between PDAT and weighed food values. Abbreviation: PDAT, Pictorial Dietary Assessment Tool. |
 | Figure 4 Bland-Altman of the difference in carbohydrate intake (g) between PDAT and weighed food values. Abbreviation: PDAT, Pictorial Dietary Assessment Tool. |
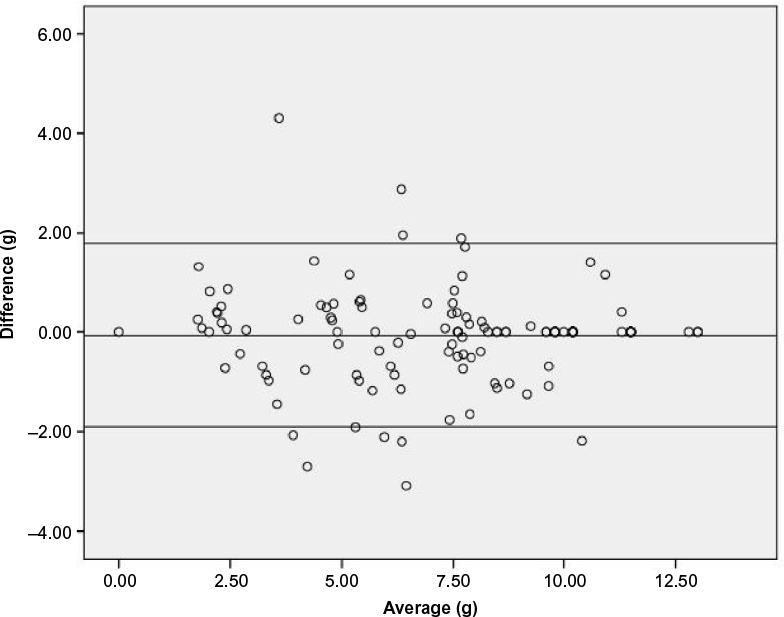 | Figure 5 Bland-Altman of the difference in fat intake (g) between PDAT and weighed food values. Abbreviation: PDAT, Pictorial Dietary Assessment Tool. |
The accuracy of the PDAT according to the P15 and P30 of the weighed intake (gold standard) was more than 90% for all macronutrients, with a bias percentage of less than 10% (Table 3). Table 4 illustrates the accuracy of the PDAT in estimating the six consumption levels of patient food intake. Essentially, there were some differences in the accuracy of the PDAT relative to food characteristics. The percentage of estimates correctly reported was 86% for staple food (110 out of 130), 88% for animal source protein (113 out of 129), and 80% for non-animal source protein (96 out of 120) (Table 3). The health care staff had the most difficulty in estimating consumption at the 75% level for staple food, with 60% accuracy; 75% and 25% level for animal source protein, with 50% and 57% accuracy, respectively; and 80% and 25% level for non-animal source protein, with 40% and 53% accuracy, respectively. Of the 130 weighed meal intakes of staple food, 39 meals (30%) were recorded as 100% of meal eaten, when in fact 41 (31.5%) of those meals should have been recorded as 100% consumed.
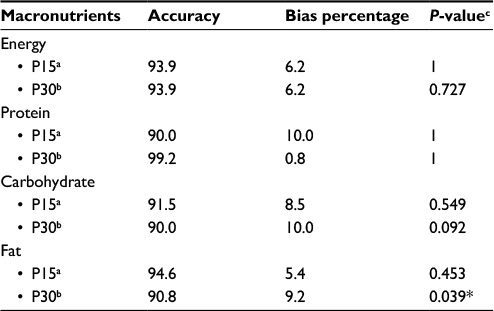 | Table 3 Accuracy of macronutrient intakes estimated by the PDAT in comparison with food weighing Notes: aPercentage of estimates within 15% of food weighing (gold standard); bpercentage of estimates within 30% of food weighing (gold standard); cMcNemar test (*P<0.05). Abbreviation: PDAT, Pictorial Dietary Assessment Tool. |
 | Table 4 Health care staff estimates of percentage food consumed by patients compared to food weighing method Notes: aBased on weighed plate waste; bnumber of accurate estimates at this consumption level; *significant (P<0.001). Abbreviation: PDAT, Pictorial Dietary Assessment Tool. |
The values of sensitivity and specificity for the estimation of intake of ≤50% and ≤75% of the food served using PDAT in comparison with food weighing were reported in Table 5. The sensitivity and specificity values were more than 80%, with the exception of specificity of animal source protein (ie, 75% for intake of ≤50% and 76.9% for intake of ≤75% specificity). However, the sensitivity for this kind of food was high, and was as much as 98.2% and 99.1%. Furthermore, the ROC curves for all types of dishes were more than 0.85. There was good consensus for the estimation of nutrient intake using PDAT among the health care staff from different backgrounds, with an intraclass correlation coefficient of 0.96, 0.91, 0.95, and 0.91 for energy, protein, carbohydrate and fat, respectively (Table 6). The health care staff did not tend to overestimate consumption; however, for protein, carbohydrate, and fat, the health care staff tended to marginally underestimate consumption, in comparison to the actual (weight) nutrient intake of patients. Nevertheless, the differences of macronutrient intake were similar across the different backgrounds of health care staff based on the ANOVA test (P=0.967; P=0.951; P=0.888; and P=0.847, respectively).
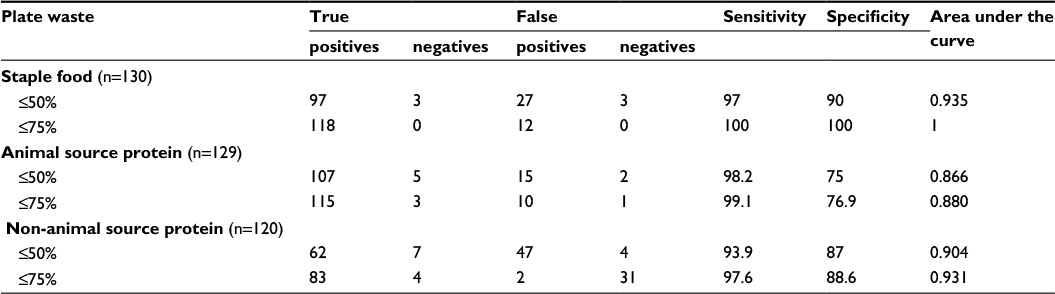 | Table 5 Values of sensitivity and specificity of PDAT according to different levels of plate waste (food weighing) Abbreviation: PDAT, Pictorial Dietary Assessment Tool. |
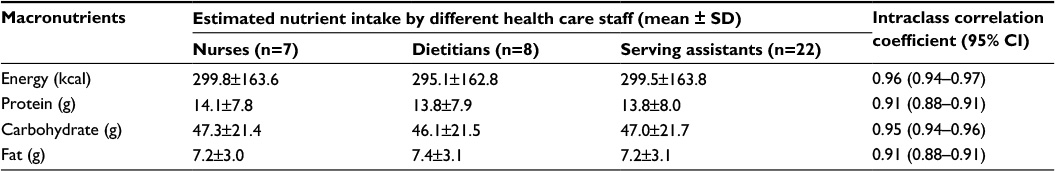 | Table 6 Inter-rater reliability analysis of estimated nutrient intake using PDAT among health care staff and comparison with food weighing Abbreviations: PDAT, Pictorial Dietary Assessment Tool; SD, standard deviation; CI, confidence interval. |
Discussion
This study has successfully developed the PDAT for the measurement of dietary intake by patients in hospitals, which consists of six pictures of three types of food typical in the Southeast Asian region: staple food (rice/porridge), animal source protein (chicken, meat, eggs, and fish), and non-animal source protein (bean curd and tempeh). The study has revealed high correlations (r>0.8) obtained for all macronutrients between the food weighing method and PDAT for 130 meals consumed by 67 patients (P<0.05 for all parameters). Moreover, the mean nutrient intake across meals was not statistically different between PDAT and the food weighing method (P>0.05 for all parameters). This was consistent with the accuracy analysis using McNemar’s test for P15 and P30 of the gold standard, which resulted in a higher than 90% accuracy for all macronutrients. This finding is in line with a study conducted by Bjornsdottir et al21 that reported significant and high correlations between a plate diagram sheet and food weighing for daily energy (r=0.922, P<0.001) and protein (r=0.896, P<0.001) intake, using a relatively similar sample size (n=73) and trained health care staff. However, Palmer et al14 have found poor correlations in energy intake between a ready reckoner food chart and weighed food intake in breakfast and lunch meals in a sample of 15 patients over 43 intake days. It appears that PDAT may provide a valid estimation of macronutrient intake with fair accuracy and could be useful for the monitoring of dietary intake.
Both PDAT and food weighing also displayed a very close consensus beyond chance (κ) for staple food, animal source protein, and non-animal source protein. Non-animal source protein resulted in the least consensus but was still above the clinically reasonable validity limit of 0.70 beyond chance. This may be due to the fact that dishes such as bean curd and tempe are often prepared and cooked in a way that changes its original portion and consistency. Low consensus among dietary intake estimation methods for specific dishes was also reported by Scognamiglio et al22 who discovered a consensus of as low as 0.289 for the first course of dinner, and Andrews and Castellanos23 who acquired a 0.54 consensus for semisolid or amorphous items, including oatmeal and soup.
The sensitivity and specificity analysis of the PDAT for identifying patients who have low food intakes was conducted in consideration of food weighing as the gold standard. Patient intakes of ≤50% and ≤75% of the provided foods as assessed by the PDAT were used to identify patients who may be at risk of malnutrition.1 In general, all kinds of dishes including staple food, animal source protein, and non-animal source protein exhibited good sensitivity (greater than 93%) and specificity (greater than 75%). An approximate proportion of 23% to 25% of animal source protein consumed at breakfast and lunch were higher than the 50% and 75% of intake as assessed using food weighing and were erroneously classified as intakes of less than 50% or 25% by the PDAT (false positives). This implies that the PDAT did not overestimate the intake of meals when ≤50% and ≤75% of the served meal was consumed. This may be considered as a strength rather than limitation, as was also found by Bjornsdottir et al21 using the plate diagram sheet. An overestimation of the actual intake may lead to the inadequate food intake among patients remaining unrecognized, and thereby placing them at risk of developing nutritional deficiencies.21 These results suggest that the PDAT can be considered as a potentially valid instrument for the screening of patients for nutritional risk due to inadequate food intake. This finding is in line with a validation study by Scognamiglio et al22 who revealed that the semiquantitative questionnaire appears to be a valid and suitable instrument for the identification of patients with poor food intake in a neurorehabilitation hospital. An analysis of the area under the ROC curve has also indicated the high accuracy of the PDAT, which was able to identify patients who were at risk of malnutrition and patients who were not at risk of malnutrition, based on its ability to categorize patients who have adequate food intake (plate waste ≤50% and 75%).
Intraclass correlation coefficient was high across different backgrounds of the health care staff (dieticians, nurses, and serving assistants), and the ANOVA test revealed that there were no differences in energy, protein, carbohydrate, and fat intake across different backgrounds of health care staff. Similarly, Berrut et al18 have uncovered that estimates of energy and protein consumption using a meal portion method were very similar between observers of different professional backgrounds, consisting of nursing staff, dieticians, and physicians.
The PDAT was developed based on three main dishes provided by hospital food service. Rice or porridge provided complex carbohydrates, while protein is provided by foods such as chicken, meat, fish, and eggs (animal source protein), as well as bean curd and tempeh (non-animal source protein). An accurate assessment of the consumption of these dishes by patients would allow for the identification of patients who are at risk of nutrient inadequacy, for further in-depth assessment or clinical and nutritional education and intervention. Additionally, information provided by PDAT may also be used by health care staff to identify plate waste and further improvise the food service system of the institution.
An earlier need assessment phase of the study revealed that health care staff were required to spend a considerable amount of time calculating the nutritional value from the hospital’s current dietary assessment tool.29 As the staff were required to calculate the nutritional intakes on a separate sheet, this resulted in more time spent to compute the patients’ intake.29 Health care staff, in particular dieticians, were required to refer to the food composition table in order to calculate nutrient intake, as was also reported in previous studies.15,23 On the other hand, PDAT provides a ready reckoner of energy and protein content of meals that facilitates the nutrient intake estimation without the need for detailed mathematical computation. Moreover, this reduces the time needed to perform the tasks, which lead to greater accuracy in the estimation of nutrient intake and food intake records, which is a limitation of food intake tools as reported by previous studies.15,23
Another strength of the present study was the use of weighed food intake as a gold standard in comparing the accuracy of the newly developed dietary assessment tool, as well as the deployment of all health care staff involved in the food intake provision for patients, including dietitians, nurses, and food serving assistants. The finding that PDAT demonstrates satisfactory reliability among the health care staff is encouraging, as this indicates that the task can be completed by the staff with minimal training. The importance of this is highlighted by Palmer et al14 who suggest that it is essential to develop and validate tools that are valid, with minimal training of staff in a clinical setting at which staff turnover can be high. However, it should be noted that tools that are only valid when on-going training and support is provided may not be useful in the actual clinical practice.14 Thus, further study to evaluate the cost effectiveness of the implementation of PDAT is essential.
One limitation of the present study is that we did not weigh all of the food items before the tray was served to the patients, but only the leftover food. This was due to practical reasons, as it would disrupt the food serving process and affect the temperature of food items. Nevertheless, a standard proportion of meals was used under a routine quality control conducted at the central kitchen of the hospital. Another limitation of the study is that we have only collected data during the daytime shifts (only during breakfast and lunch time). This was also due to practical reasons, as most health care staff do not work during the evening shifts. Furthermore, the recording of food intake often worsens through the day as reported by previous studies,21,27 owing to a high fluctuation of hospital employees during the evening shifts. Thus, it is advisable that future research examine the validity of the PDAT at all meal times, including the evening meal.
Conclusion
In conclusion, the newly developed PDAT has been demonstrated to be valid and reliable for usage among health care staff in the estimation of nutrient intake by hospitalized adult patients. This tool addresses some of the limitations of previously used methods in the collection of dietary intake information at the study hospital, including the provision of a more specific variety of foods served and a ready reckoner for calories and protein intake estimation. Additionally, research is also required to investigate the feasibility and cost effectiveness of the implementation of PDAT.
Acknowledgments
The authors greatly appreciate the cooperation and assistance provided by each respondent who allocated their valuable time and effort to participate in the study. Special thanks to the Dietetic and Food Service Department of Dr Sardjito Hospital, Yogyakarta, Indonesia. This study was partly funded by a research university grant from DPP-2015-115, Universiti Kebangsaan Malaysia.
Disclosure
The authors report no conflicts of interest in this work.
References
Williams P, Walton K. Plate waste in hospitals and strategies for change. e-SPEN, the European e-Journal of Clinical Nutrition and Metabolism. 2011;6:e235–e241. | ||
Norman K, Pichard C, Lochs H, Pirlich M. Prognostic impact of disease-related malnutrition. Clin Nutr. 2008;27(1):5–15. | ||
Leistra E, Willeboordse F, van Bokhorst–de van der Schueren MA, et al. Predictors for achieving protein and energy requirements in undernourished hospital patients. Clin Nutr. 2011;30(4):484–489. | ||
van Bokhorst–de van der Schueren MA, Roosemalen MM, Weijs PJ, Langius JA. High waste contributes to low food intake in hospitalized patients. Nutr Clin Pract. 2012;27(2):274–280. | ||
Hiesmayr M, Schindler K, Pernicka E, et al. Decreased food intake is a risk factor for mortality in hospitalised patients: the NutritionDay survey 2006. Clin Nutr. 2009;28(5):484–491. | ||
Agarwal E, Ferguson M, Banks M, et al. Malnutrition and poor food intake are associated with prolonged hospital stay, frequent readmissions, and greater in-hospital mortality: Results from the Nutrition Care Day Survey 2010. Clin Nutr. 2013;32(5):737–745. | ||
Budiningsari D, Hadi H. Pengaruh perubahan status gizi pasien dewasa terhadap lama rawat inap dan biaya rumah sakit [The impact of nutrition status changes of adult hospitalized patients to the length of stay and costs]. Jurnal gizi klinik Indonesia. 2004;1(1):35–45. Indonesian. | ||
Harith S, Shahar S, Yusoff NA, Kamaruzzaman SB, Poi PJ. (2010). The Magnitude of Malnutrition among Hospitalized Elderly Patients in University Malaya Medical Centre. Health and the Environment Journal. 2010;1(2):64–72. | ||
Gout BS, Barker LA, Crowe TC. Malnutrition identification, diagnosis and dietetic referrals: Are we doing a good enough job? Nutrition & Dietetics. 2009;66(4):206–211. | ||
Kondrup J, Allison SP, Elia M, Vellas B, Plauth M; Educational and Clinical Practice Committee, European Society of Parenteral and Enteral Nutrition (ESPEN). ESPEN guidelines for nutrition screening 2002. Clin Nutr. 2003;22(4):415–421. | ||
Mueller C, Compher C, Ellen DM; American Society for Parenteral and Enteral Nutrition (A.S.P.E.N.) Board of Directors. A.S.P.E.N. clinical guidelines: Nutrition screening, assessment and intervention in adults. JPEN J Parenter Enteral Nutr. 2011;35(1):16–24. | ||
Ministry of Health of Republic of Indonesia. Guidelines of hospital nutrition services. Ministry of Health of Republic of Indonesia; 2013. Available from: http://gizi.depkes.go.id/download/Pedoman%20Gizi/COVER%20PGRS_PGRS%20Final.pdf. Accessed May 16, 2016. Indonesian. | ||
Volkert D, Schrader E. Dietary assessment methods for older persons: what is the best approach? Curr Opin Clin Nutr Metab Care. 2013;16(5):534–540. | ||
Palmer M, Miller K, Noble S. The accuracy of food intake charts completed by nursing staff as part of usual care when no additional training in completing intake tools is provided. Clin Nutr. 2015;34(4):761–766. | ||
Castellanos VH, Andrews YN. Inherent flaws in a method of estimating meal intake commonly used in long-term-care facilities. J Am Diet Assoc. 2002;102(6):826–830. | ||
Førli L, Oppedal B, Skjelle K, Vatn M. Validation of a self-administered form for recording food intake in hospital patients. Eur J Clin Nutr. 1998;52(12):929–933. | ||
Lorefält B, Unosson M. Estimation of energy intake in clinical practice: a comparison between a food record protocol and a precoded food record book. J Clin Nurs. 2002;11(5):688–694. | ||
Berrut G, Favreau AM, Dizo E, et al. Estimation of calorie and protein intake in aged patients: validation of a method based on meal portions consumed. J Gerontol A Biol Sci Med Sci. 2002;57(1):M52–M56. | ||
Thibault R, Goujon N, Le Gallic E, et al. Use of 10-point analogue scales to estimate dietary intake: a prospective study in patients nutritionally at-risk. Clin Nutr. 2009;28(2):134–140. | ||
Van Den Hil EP, Leile P, Siebelink J, Huitinck JF, De Vries JH. Evaluation of a Precoded Food Record to Assess Energy and Protein Intake of Patients. Clin Nutr Suppl. 2009;4(2):170. | ||
Bjornsdottir R, Oskarsdottir ES, Thordardottir FR, Ramel A, Thorsdottir I, Gunnarsdottir I. Validation of a plate diagram sheet for estimation of energy and protein intake in hospitalized patients. Clin Nutr. 2013;32(5):746–751. | ||
Scognamiglio U, Salvia A, Paolucci S, Garbagnati F, Caltagirone C, Musicco M. Validity of a questionnaire for the semi-quantitative evaluation of dietary intake of hospitalised patients compared to weighed records. J Hum Nutr Diet. 2012;25(6):526–533. | ||
Andrews YN, Castellanos VH. Development of a method for estimation of food and fluid intakes by nursing assistants in long-term care facilities: a pilot study. J Am Diet Assoc. 2003;103(7):873–877. | ||
Almdal T, Viggers L, Beck AM, Jensen K. Food production and wastage in relation to nutritional intake in a general district hospital--wastage is not reduced by training the staff. Clin Nutr. 2003;22(1):47–51. | ||
Weekes CE, Spiro A, Baldwin C, et al. A review of the evidence for the impact of improving nutritional care on nutritional and clinical outcomes and cost. J Hum Nutr Diet. 2009;22(4):324–335. | ||
Holst M, Mortensen MN, Jacobsen BA, Rasmussen HH. Efficacy of serving bedside in-between meals–An intervention study in three medical departments. e-SPEN, the European e-Journal of Clinical Nutrition and Metabolism. 2010;5(1):e30–e36. | ||
Jenkins J, Richards D. Standardising approaches to food and fluid monitoring across Wales. Proc Nutr Soc. 2010;69:E204. | ||
Xia C, McCutcheon H. Mealtimes in hospital--who does what? J Clin Nurs. 2006;15(10):1221–1227. | ||
Budiningsari D, Shahar S, Abdul Manaf Z, Susetyowati S. A need assessment on monitoring food intake of hospitalised adult patients among healthcare staff. J Health Popul Nutr. Epub 2016. | ||
Walter SD, Eliasziw M, Donner A. Sample size and optimal designs for reliability studies. Stat Med. 1998;17(1):101–110. |
 © 2016 The Author(s). This work is published and licensed by Dove Medical Press Limited. The full terms of this license are available at https://www.dovepress.com/terms.php and incorporate the Creative Commons Attribution - Non Commercial (unported, v3.0) License.
By accessing the work you hereby accept the Terms. Non-commercial uses of the work are permitted without any further permission from Dove Medical Press Limited, provided the work is properly attributed. For permission for commercial use of this work, please see paragraphs 4.2 and 5 of our Terms.
© 2016 The Author(s). This work is published and licensed by Dove Medical Press Limited. The full terms of this license are available at https://www.dovepress.com/terms.php and incorporate the Creative Commons Attribution - Non Commercial (unported, v3.0) License.
By accessing the work you hereby accept the Terms. Non-commercial uses of the work are permitted without any further permission from Dove Medical Press Limited, provided the work is properly attributed. For permission for commercial use of this work, please see paragraphs 4.2 and 5 of our Terms.