Back to Journals » Journal of Hepatocellular Carcinoma » Volume 8
A Semi-Automatic Step-by-Step Expert-Guided LI-RADS Grading System Based on Gadoxetic Acid-Enhanced MRI
Authors Sheng R ![]() , Huang J, Zhang W, Jin K, Yang L, Chong H, Fan J, Zhou J, Wu D, Zeng M
, Huang J, Zhang W, Jin K, Yang L, Chong H, Fan J, Zhou J, Wu D, Zeng M ![]()
Received 18 April 2021
Accepted for publication 11 June 2021
Published 29 June 2021 Volume 2021:8 Pages 671—683
DOI https://doi.org/10.2147/JHC.S316385
Checked for plagiarism Yes
Review by Single anonymous peer review
Peer reviewer comments 2
Editor who approved publication: Dr Ahmed Kaseb
Ruofan Sheng,1,2,* Jing Huang,3,* Weiguo Zhang,4 Kaipu Jin,1,2 Li Yang,1,2 Huanhuan Chong,1,2 Jia Fan,5,6 Jian Zhou,5,6 Dijia Wu,3 Mengsu Zeng1,2,6
1Department of Radiology, Zhongshan Hospital, Fudan University, Shanghai, People’s Republic of China; 2Shanghai Institute of Medical Imaging, Shanghai, People’s Republic of China; 3Shanghai United Imaging Intelligence Co., Ltd., Shanghai, People’s Republic of China; 4Dushuhu District, No. 1 Affiliated Hospital, Suzhou University, Suzhou, Jiangsu, People’s Republic of China; 5Department of Liver Surgery, Zhongshan Hospital, Fudan University, Shanghai, People’s Republic of China; 6Cancer Center, Shanghai Zhongshan Hospital, Fudan University, Shanghai, People’s Republic of China
*These authors contributed equally to this work
Correspondence: Mengsu Zeng
Department of Radiology, Zhongshan Hospital, Fudan University, No. 180 Fenglin Road, Xuhui District, Shanghai, 200032, People’s Republic of China
Tel +86-021-64041990-2130
Fax +86-021-64439906
Email [email protected]
Dijia Wu
Shanghai United Imaging Intelligence Co., Ltd., No. 2879, Longteng Boulevard, Xuhui District, Shanghai, 200232, People’s Republic of China
Tel +86-021-67076888
Fax +86-021-64439906
Email [email protected]
Purpose: Liver imaging reporting and data system (LI-RADS) classification, especially the identification of LR-3 to 5 lesions with hepatocellular carcinoma (HCC) probability, is of great significance to treatment strategy determination. We aimed to develop a semi-automatic LI-RADS grading system on multiphase gadoxetic acid-enhanced MRI using deep convolutional neural networks (CNN).
Patients and Methods: An internal data set of 439 patients and external data set of 71 patients with suspected HCC were included and underwent gadoxetic acid-enhanced MRI. The expert-guided LI-RADS grading system consisted of four deep 3D CNN models including a tumor segmentation model for automatic diameter estimation and three classification models of LI-RADS major features including arterial phase hyper-enhancement (APHE), washout and enhancing capsule. An end-to-end learning system comprising single deep CNN model that directly classified the LI-RADS grade was developed for comparison.
Results: On internal testing set, the segmentation model reached a mean dice of 0.84, with the accuracy of mapped diameter intervals as 82.7% (95% CI: 74.4%, 91.7%). The area under the curves (AUCs) were 0.941 (95% CI: 0.914, 0.961), 0.859 (95% CI: 0.823, 0.890) and 0.712 (95% CI: 0.668, 0.754) for APHE, washout and capsule, respectively. The expert-guided system significantly outperformed the end-to-end system with a LI-RADS grading accuracy of 68.3% (95% CI: 60.8%, 76.5%) vs 55.6% (95% CI: 48.8%, 63.0%) (P< 0.0001). On external testing set, the accuracy of mapped diameter intervals was 91.5% (95% CI: 81.9%, 100.0%). The AUCs were 0.792 (95% CI: 0.745, 0.833), 0.654 (95% CI: 0.602, 0.703) and 0.658 (95% CI: 0.606, 0.707) for APHE, washout and capsule, respectively. The expert-guided system achieved an overall grading accuracy of 66.2% (95% CI: 58.0%, 75.2%), significantly higher than the end-to-end system of 50.1% (95% CI: 43.1%, 58.1%) (P< 0.0001).
Conclusion: We developed a semi-automatic step-by-step expert-guided LI-RADS grading system (LR-3 to 5), superior to the conventional end-to-end learning system. This deep learning-based system may improve workflow efficiency for HCC diagnosis in clinical practice.
Keywords: liver imaging reporting and data system, LI-RADS, hepatocellular carcinoma, HCC, magnetic resonance imaging, MRI, deep learning
Plain Language Summary
Hepatocellular carcinoma (HCC) is the most common primary liver cancer and the fourth leading cause of cancer-related mortality worldwide. The standardized liver imaging reporting and data system (LI-RADS) classification, especially the identification of LR-3 to 5 lesions with HCC probability, is of great significance to treatment strategy determination. However, the in-depth analysis using LI-RADS increases the workload for radiologists with inevitable interpretation difference. Thus, we developed a semi-automatic step-by-step expert-guided LI-RADS grading system on multiphase gadoxetic acid-enhanced magnetic resonance imaging (MRI) using deep 3D convolutional neural networks (CNNs), and proved its superiority compared to the conventional end-to-end black box learning system. This deep learning-based system may improve workflow efficiency for HCC diagnosis in clinical practice.
Introduction
Hepatocellular carcinoma (HCC) is the most common primary liver cancer and the fourth leading cause of cancer-related mortality worldwide, which constitutes a major health problem worldwide.1 Imaging plays a critical role in HCC diagnosis, as the diagnosis can be established based on noninvasive imaging without pathology confirmation according to the 2018 HCC clinical practice guidance by the American Association for the Study of Liver Diseases.2 The liver imaging reporting and data system (LI-RADS) is created for the standardized interpretation of liver imaging findings in patients at risk for developing HCC, and under specific criteria, LI-RADS permits a definitive diagnosis of HCC.3 The probability of HCC associated with each LI-RADS category informs the best approach to a hepatic lesion. LR-1 and LR-2 indicate definitely and probably benign; LR-3, 4 and 5 indicate an average probability of HCC of 33%, 80% and 96%, respectively.2 The cumulative incidence of progression of untreated observations rises with the increasing LI-RADS grade: LR-3 lesions are less invasive than those for LR-4 and LR-5, which can be followed for stability with imaging; whereas up to 68% of untreated LR-4 lesions become LR-5 within 2 years, and LR-5 score indicates HCC diagnostic certainty and an aggressive treatment is necessary.2 Thus, in clinical practice, LI-RADS classification of hepatic lesions, especially the identification of LR-3 to 5 lesions with HCC probability is of great significance to treatment strategy determination. A diagnostic table with the combination of major features and observation size is used to determine whether a lesion is categorized as LR-3, LR-4 or LR-5 in LI-RADS v2018.3
However, the in-depth analysis using LI-RADS increases the workload for radiologists. Meanwhile, most studies demonstrated a substantial to moderate inter-observer consistency in LI-RADS categorization.4–6 Thus, even though LI-RADS offers a standardized diagnostic algorithm, interpretation difference remains between inexperienced and expert radiologists. Deep-learning methods may help to solve these problems and improve workload efficiency.
Recently, deep learning technique based on convolutional neural network (CNN) has gained great attention and rapid development in medical image processing,7–10 with applications to multiple clinical tasks such as disease detection,11–13 tissue segmentation,14–16 lesion classification,17–19 diagnosis and evaluation.20–22 Although promising progress has been made in such areas, deep learning-based techniques were still subject to several limitations that required further investigation.23 Specifically, most of such CNN models demanded large-scale training data set and lacked sufficient interpretability of the network output, which might impede their clinical acceptance.24
The multiphase contrast-enhanced magnetic resonance imaging (MRI), especially the Gadoxetic acid-enhanced MRI is recommended as the most accurate imaging method for HCC diagnosis.25,26 To our knowledge, the deep-learning method has been rarely reported for automatic LI-RADS grading based on MRI:27,28 Wu et al27 employed MRI transfer learning to fine-tune the weights of pre-trained AlexNet CNN to distinguish LR-3 liver tumors from combined LR-4/5 tumors, with a small data set of 89 liver tumors in 59 patients. Yamashita et al28 collected a data set comprising 314 hepatic observations (163 CT, 151 MRI) with manually-measured tumor diameters and LI-RADS categories to develop two CNNs (transfer learning network derived from pre-trained VGG16 and custom-made network trained from scratch) for categorizing LR1/2, LR-3, LR-4 and LR-5. Similar to most other deep learning-based computer-aided diagnosis methods, both works developed the models in an end-to-end fashion by training the networks directly to predict the LR grades. In addition, both studies adopted 2D CNNs and required manual pre-selection of a representative tumor slice showing either the best lesion delineation27 or the maximum observed lesion diameter.28 However, the use of single 2D image slice might cause information loss, leading to suboptimal network performance. Nie et al20 demonstrated the advantages of using 3D CNN architectures over traditional 2D CNN in their study on survival time prediction of brain tumor patients with multi-modal MRI images. Accordingly, 3D convolutional kernels would be adopted in all CNNs development throughout this article. Relevant previous works29,30 also investigated fourteen different radiologic features associated with six types of hepatic lesions, but their work aimed to reveal the implicit correlation between liver lesion classification and presence of relevant radiologic features to make the lesion classification network more interpretable, without exploiting such features to help improve the classification accuracy.
In this study, we aimed to develop a semi-automatic LI-RADS grading system on multiphase gadoxetic acid-enhanced MRI using deep 3D CNNs. The original contributions of our work are mainly as follows: Firstly, we proposed an almost completely automated LI-RADS grading system with the only manual input as the region of interest (ROI) around the target tumor. Secondly, to alleviate the issue of limited size of annotated training data and provide better result interpretability, we would decompose the task into several relatively easier sub-tasks including developing a liver tumor segmentation model for automatic tumor diameter estimation and three classification models of LI-RADS major features including non-rim arterial phase hyper-enhancement (APHE), non-peripheral washout and enhancing capsule. The LI-RADS category (LR-3, LR-4 and LR-5) were subsequently assigned according to the diagnostic table defined in LI-RADS v2018, as opposed to training an end-to-end LI-RADS classification model to directly assign LI-RADS categories. Moreover, we adopted 3D CNN models instead of 2D CNN, and the data set in this study was also larger than any of the previously published literature in the area. We assessed model performance in both internal and external data sets.
Patients and Methods
Data sets
This retrospective study was approved by the institutional Ethical Review Committee (Approval Number: B2021-113R) and the requirement for written informed consent was waived. For model development and internal evaluation, we searched the electronic health record system in Zhongshan Hospital, Fudan University, from August 2011 to April 2020. For external validation, we searched the electronic health record system in No. 1 Affiliated Hospital, Suzhou University from April 2015 to January 2020. For both internal and external data sets, patients who were suspected of HCC without previous treatment and underwent baseline gadoxetic acid-enhanced MRI were included consecutively. Cases with poor image quality due to severe artifacts were excluded for analysis.
Imaging Acquisition
All patients were examined with 1.5 or 3.0 Tesla MR scanner (Magnetom Aera, Siemens, Erlangen, Germany; uMR 770, United Imaging Healthcare, Shanghai, China). Dynamic imaging was performed with a breath-hold T1-weighted 3-dimensional fat-suppressed gradient-echo sequence, before and after the intravenous administration of gadoxetic acid (Primovist; Bayer HealthCare, Berlin, Germany). Contrast was administered at a dose of 0.025 mmol/kg at a rate of 2 mL/s, followed by a 20 mL saline flush using a power injector (Spectris; Medrad, Pittsburgh, PA, USA). The arterial phase (AP) acquisitions were triggered automatically when contrast media reached the ascending aorta. For subsequent acquisitions, dynamic T1-weighted MRI at 60 s (portal venous phase, PVP) and 180 s (transitional phase, TP) and 20 min (hepatobiliary phase) were performed. Other routine liver protocols consisted of a breath-hold T2-weighted fat-suppressed fast spin-echo sequence, T1-weighted in-phase and opposed-phase gradient echo sequence, and free-breathing diffusion-weighted imaging with transverse single-shot spin-echo echo-planar sequences (b values, 0, 50 and 500 s/mm2).
Imaging Analysis
MR images were independently evaluated by 3 radiologists (with 6, 8 and 13 years of experience in liver MRI, respectively) for internal data and another 3 radiologists (with 5, 9 and 15 years of experience in liver MRI, respectively) for external data using picture archiving and communication system (Pathspeed, GE Medical Systems Integrated Imaging Solutions, Prospect, IL, USA). The reviewers were aware that the patients had liver tumors, but were blinded to all other information, including patient history, laboratory results, and pathologic results. Inter-observer agreements were assessed, and when disagreement occurred, consensus review was made for final decisions as the reference standard. When multiple nodules were observed, only the largest nodule was analyzed.
Major features based on the LI-RADS version 2018 diagnostic algorithm3 were evaluated as follows: non-rim APHE (non-rim like enhancement in AP unequivocally greater in whole or in part than liver); non-peripheral washout (non-peripheral visually assessed temporal reduction in enhancement in whole or in part relative to composite liver tissue from earlier to PVP, resulting in hypo-enhancement); enhancing capsule (smooth, uniform, sharp border around most or all of an observation, unequivocally thicker or more conspicuous than fibrotic tissue around background nodules, and visible as an enhancing rim in PVP or TP). Lesion size was measured at the largest cross-sectional diameter (the maximum dimension) on the axial planes of TP.
Expert-Guided LI-RADS Grading System
The expert-guided LI-RADS grading system proposed in this article consisted of three modules as shown in Figure 1. The inputs to the system were the MRI images acquired at four different time points with specified bounding boxes centering around the target tumor on each phase. The outputs of the system were the LI-RADS category assigned to the target tumor by the system, together with the intermediate results of automatic tumor segmentation as well as presence estimation of the three LI-RADS major imaging features.
 |
Figure 1 The proposed expert-guided LI-RADS grading system consisted of three modules: the data preprocessing module that cropped, resized and normalized the ROI centering around the target tumor; the CNN modules comprising the tumor segmentation model and three major imaging feature classification models; and the post-processing module which calculated the maximum tumor diameter from the segmentation mask and obtained the LI-RADS grade according to the diameter and inferred presence of the major features. Abbreviations: TP, transitional phase; pre, pre-contrast; AP, arterial phase; PVP, portal venous phase; FC, fully connected; APHE, arterial phase hyper-enhancement; PCA, principal component analysis. |
Data Preprocessing
All MRI scans used in this work were provided with a bounding box centering around the target tumor on all phases. For the internal data set, the liver tumors were manually segmented to train and validate the automatic liver tumor segmentation model, thus the bounding boxes of the tumor can be obtained. For the external data set, the radiologist directly drew bounding boxes for liver tumors on each phase, to indicate the size and location of the tumor. To align it across all phases of one exam, cubic image patches of the same size were cropped around the tumor centroid of all four phases. The cubic patch size was selected as the largest dimension of the same tumor of all different phases, expanded by five millimeters along each axis to include a margin of peri-observation liver parenchyma, yet away from non-liver structures. The cropped cubic image patches of different tumors were all resized to 48×48×48 voxels and applied with simple z-score normalization.
CNN Architectures
Segmentation Model
In the expert-guided grading system, the segmentation model adopted an architecture as shown in Figure 2 by combining U-Net31 with multiple bottleneck layers. The U-Net architecture supplements conventional contracting network with successive expansive network to propagate both global image context and local image cues to higher resolution layers, achieving the state-of-the-art segmentation results. The bottleneck layer was introduced to reduce the number of feature maps, thereof the model complexity and operations, so the inference time and memory cost can be kept lower. As previously mentioned, only the TP was segmented to estimate the tumor diameter. The obtained tumor segmentation mask was used to derive the centroid and leading eigenvector of the covariance matrix. The leading eigenvector corresponds to the major axis of the tumor from which the maximum lesion diameter can be automatically measured by computing the distance between the boundary points along the major axis crossing the centroid.
 |
Figure 2 The convolutional neural network architecture of liver tumor segmentation model, which combines U-Net with bottleneck layer (BL). Abbreviations: Conv, convolution; BN, batch normalization; RELU, rectified linear unit. |
Despite the fact that the segmentation model was only meant to segment the TP images, all phases including the pre-contrast phase, AP, PVP and TP were used to train the segmentation model which showed better segmentation accuracy compared to training with TP only.
Classification Models
The three imaging feature classification models were all based on the optimized 3D ResNet architecture with significantly reduced layers to alleviate the over-fitting problem as shown in Figure 3. Given the fact that the presence of APHE and washout features needs to be determined by jointly observing multiple phases, i.e., APHE depends on the pre-contrast and AP, whereas for washout the AP and PVP are compared, the classification networks of these two features contained two CNN sub-networks and each sub-network extracted information from one phase input, which were then combined at a later stage of the network to make the final classification (Figure 3A). The feature maps from two separated CNN branches were fused by channel-wise concatenation, and the concatenated feature maps were fed to the next layer in the network as input. To compensate for the possible tumor misalignment due to respiratory motion across different phases, the phase specific sub-network consisted of downsampling blocks where the max pooling layers made the extracted information less sensitive to the exact spatial location.
 |
Figure 3 The convolutional neural network architectures of classification models: (A) the models for arterial phase hyper-enhancement and washout, (B) the model for capsule feature. Abbreviations: Conv, convolution; BN, batch normalization; RELU, rectified linear unit; GAP, global average pooling; FC, fully connected; MP, maximum pooling. |
Different from the previous two imaging features, the capsule feature is independently observed on the PVP and TP. In this study, the tumor was labelled as positive if the capsule feature was observed on either of the two phases, but without noting on which phase the feature was found. In view of this, we adopted the approach of multiple instance learning32,33 to classify the capsule features. As shown in Figure 3B, the same network was shared by both PVP and TP. Denote the output probability of the tumor on PVP being capsule positive as pv1, and the positive probability on TP as pt1, then the joint probability of the tumor being capsule positive is 1 – (1– pv1) × (1 – pt1). The objective loss function was hence formulated to minimize the difference between the labels and this joint probability, instead of the probability of separate phases.
Model Training
All the models in the study were developed based on PyTorch version 1.4 (https://pytorch.org/)20 in Python 3.7 (https://www.python.org/). The models were trained using the Adam34 optimizer with a momentum of 0.9, initial learning rate of 0.001 reduced by a factor of 10 after every 400 epochs, a weight decay of 0.001, and a batch size of 24 to minimize the Dice loss (43) and Focal loss (44) for segmentation and classification models, respectively. Training was stopped and the best model snapshot was selected based on tuning cohort randomly chosen from the training data. Data augmentation was applied including random translation up to 20% of the tumor diameter along each axis, rotation up to 10 degrees around any rotation axis and a random scaling factor of the tumor margin width in the range of 0.8 to 1.2. All CNN models were trained on 4 NVidia Titan Xp GPUs each with 12 GB of GDDR5 memory.
Step-by-Step Expert-Guided System vs End-to-End Black Box System
For comparison, we trained a model of conventional end-to-end black box system to directly predict the LI-RADS category using the same network architecture of Figure 3A, nevertheless extended to four sub-networks each processing a specified phase input. The black box network, shown in Figure S1, was trained with the same hyper-parameters and highly similar network as the expert-guided system, and validated both on the internal and external data set. In order to optimize the black box system, the same optimized ResNet architecture with weight decay and a variety of data augmentation methods as the expert-guided system was also employed to improve the model generalization performance.
ROI Scale Robustness
The final deep learning-based LI-RADS grading system in the article was almost completely automated with the only manual input as the ROI around the target tumor. The observers were required to crop a bounding box tightly surrounding the tumor when inter-observer errors could occur during this manual process. To evaluate the impact of bounding box variation on the model performance, we simulated different ROIs by multiplying the 5mm margin width with a scale factor in the range of 0.6 to 1.6 with a step size of 0.2, which slightly exceeds the range of 0.8 to 1.2 used in data augmentation aforementioned.
Multi-Phase Tumor Segmentation Models
As mentioned above, the tumor segmentation model used in this study, shown in Figure 2, was trained with MRI images of all four different phases mixed as the training data, which was denoted as the single mixed model. Given the fact that the tumor appearance might be different depending on the contrast phase, we also developed four segmentation models of the same architecture as shown in Figure 2, each being trained separately with MRI images of only a specific phase, namely, the phase-specific model. Furthermore, a joint segmentation model was also developed by feeding images of all four phases in parallel to a single network using four input channels and simultaneously obtained the segmentation of all phases with four output channels, and this approach was named as the single joint model.
Statistical Analyses
All statistical analyses were performed using the SPSS software (version 22.0; Chicago, IL, USA) and MedCalc software (version 15.0; Mariakerke, Belgium). In order to analyze the reliability of the ground truth establishment of lesion LI-RADS category assigned by three radiologists, the inter-observer agreement was assessed by intraclass correlation coefficient (ICC) (ICC <0.50: poor; 0.50–0.75: moderate; 0.75–0.90: good; 0.90: excellent). In expert-guided LI-RADS grading system, the receiver operating characteristic (ROC) analysis and the area under the curve (AUC) were calculated to evaluate the performance of three CNN classification models for three major imaging features, respectively. The AUCs among these three models were compared using DeLong’s method. The CNN segmentation models were evaluated using Dice coefficient35 and the average absolute error of obtained tumor diameters was computed. Finally, to evaluate the grading performance of both step-by-step LI-RADS system and end-to-end system, the overall accuracy was calculated for the 3-class classification (LR-3, LR-4, LR-5), and the McNemar’s test was performed to compare the final LI-RADS category accuracy between the two systems. A of P value less than 0.05 indicated statistically significant difference.
Results
Data sets
The internal data set comprised 439 patients (370 males and 69 females) with a mean age of 53.9 ± 11.6 years. The mean diameter of all 439 tumors was 20.58 ± 15.52 mm. The external data set consisted of 71 patients (53 males and 18 females) with a mean age of 57.8 ± 13.5 years. The mean diameter of all 71 tumors was 56.3 ± 37.3 mm.
The detailed distributions of tumor diameters, presence of three major imaging features, and LI-RADS categories assigned therefrom of both internal and external data set were listed in Table 1. The internal data set was randomly split into five folds with roughly equivalent ratios of each LI-RADS category across each fold. The tumor diameters were mapped into three discrete intervals of (0, 10), [10, 20) and [20, +∞) according to LI-RADS v2018.
 |
Table 1 The Distribution of Tumor Diameters, Presence of Major Features and Assigned LI-RADS Categories for Both Internal and External Data Set |
Internal Data set Analyses
Segmentation Model and Diameter Calculation
The Dice coefficient was used to evaluate the segmentation model in this study, a mean dice of 0.85 on training set and 0.84 on testing set were achieved. The mean absolute error of diameter was 2.75 ± 5.6 mm on training set and 2.71 ± 5.6 mm on testing set. The continuous diameter values were mapped into three intervals as specified in LI-RADS v2018, and the accuracy of the mapped diameter intervals reached 82.2% (95% CI: 78.0%, 86.5%) on the training data set and 82.7% (95% CI: 74.4%, 91.7%) on the testing set. In particular, the confusion matrices across the three diameter intervals are given in Table S1, it shows that the accuracy of estimated diameter increased with the size of the tumors.
Classification Model
The classification models of three major imaging features were trained with the same data set and hyper-parameters such as epochs and learning rates. The obtained ROC curves were plotted in Figure 4A. The sensitivity and specificity of the three models under the threshold of 0.5 were listed in Table 2. Considerable performance difference was observed across the three feature classification models. Specifically, the model of the APHE accomplished the highest AUC of 0.941 (95% CI: 0.914, 0.961) on the testing data set, better than the washout model with the AUC of 0.859 (95% CI: 0.823, 0.890) (P = 0.0012), and the capsule model with the AUC of 0.712 (95% CI: 0.668, 0.754) which was the lowest among all three models (P < 0.0001). The consistency among the three radiologists were 0.946 (95% CI 0.937, 0.954), 0.952 (95% CI 0.944, 0.960), and 0.917 (95% CI 0.903, 0.930) for APHE, washout and capsule, respectively.
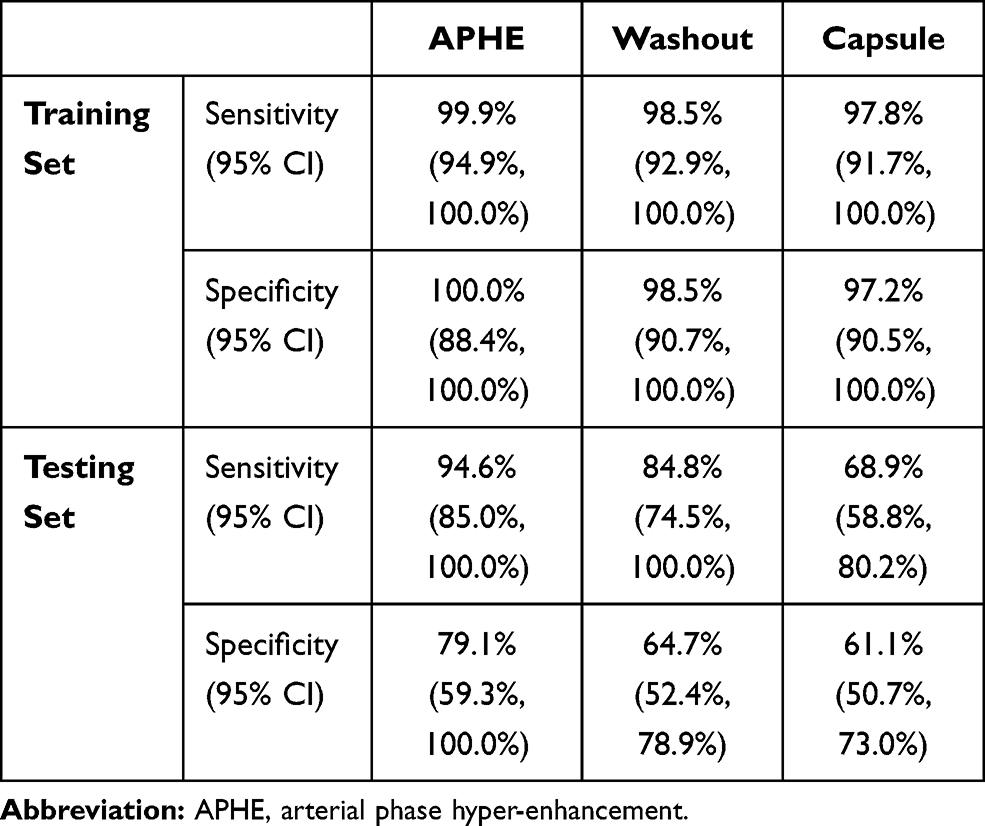 |
Table 2 The Sensitivity and Specificity of Three Feature Classification Models on Internal Data Set |
 |
Figure 4 The ROC curves of three major imaging feature classification models on (A) internal data set and (B) external data set. The blue, red and green lines represented arterial phase hyper-enhancement (APHE), washout and capsule, respectively. The solid lines stand for the training data set and the dashed lines stand for the testing data set. Abbreviation: AUC, area under the curve. |
LI-RADS Grade
Once the maximum tumor diameter and presence of imaging features were obtained, the LI-RADS categories (LR-3, LR-4 and LR-5) could be easily assigned according to the diagnostic table defined in LI-RADS v2018. The proposed system achieved an overall LI-RADS category accuracy of 90.9% (95% CI: 86.5%, 95.5%) on training data set and 68.3% (95% CI: 60.8%, 76.5%) on testing data set. From the resulting confusion matrices shown in Table S2, most of LI-RADS grading errors occurred between two neighboring categories, which was reasonable considering the continuous transition between the neighboring LI-RADS categories.
External Data Set Analyses
Segmentation Model and Diameter Calculation
The mean diameter error was 5.2 ± 4.5 mm, which was greater than the internal data set, but the overall accuracy of diameters mapped to three intervals was much higher as 91.5% (95% CI: 81.9%, 100.0%). The confusion matrix on external data the set is shown in Table S3, the diameter calculation achieved relatively better accuracy for larger tumors.
Classification Model
The ROC curves of the three feature classification models on the external data set were plotted in Figure 4B, with the sensitivity and specificity of each model under the threshold of 0.5 given in Table 3. All three models were subject to performance downgrades on the external data set, the APHE model still considerably outperformed the washout and capsule models, achieving the highest AUC of 0.792 (95% CI: 0.745, 0.833) compared to 0.654 (95% CI: 0.602, 0.703) for washout (P = 0.0148) and 0.658 (95% CI: 0.606, 0.707) for capsule (P = 0.0188). The consistency among the 3 radiologists were 0.974 (95% CI 0.961, 0.983), 0.960 (95% CI 0.940, 0.973), and 0.965 (95% CI 0.949, 0.977) for APHE, washout and capsule, respectively.
 |
Table 3 The Sensitivity and Specificity of Three Feature Classification Models on External Data Set |
LI-RADS Grade
The obtained LI-RADS category classification accuracy was 66.2% (95% CI: 58.0%, 75.2%) and the confusion matrix are shown in Table S4. The LI-RADS grading accuracy was subject to the same performance drop due to the downgrade of the three feature classification models on the external data set.
Step-by-Step Expert-Guided System vs End-to-End Black Box System
The resulting confusion matrices of the end-to-end black box LI-RADS grading system on both internal and external data set are shown in Table S5, demonstrating that the proposed expert-guided system outperformed the black box model on both internal testing data with grading accuracy of 68.3% (95% CI: 60.8%, 76.5%) vs 55.6% (95% CI: 48.8%, 63.0%) (P < 0.0001), and the external testing data as well with accuracy of 66.2% (95% CI: 58.0%, 75.2%) vs 50.1% (95% CI: 43.1%, 58.1%) (P < 0.0001).
ROI Scale Robustness
Figure S2 demonstrated the robustness of the trained models against the variation of the cropped ROI size. On the testing data, the AUC of three imaging feature models fluctuated slightly in the range of 0.92 to 0.95, 0.84 to 0.86, and 0.69 to 0.72 for APHE, washout and capsule, respectively. The accuracy of estimated lesion diameter intervals ranged from 80.0% to 82.6%, with the final LI-RADS category classification accuracy in the range of 66.3% to 69.0%. It can be observed that the difference of the model performance was even more negligible when the scale factor varied between 0.8 and 1.2.
Multi-Phase Tumor Segmentation Models
The resulting dice coefficient of all three different segmentation models were compared in Table 4. As shown in the table, on the testing data, the single mixed model achieved the best segmentation accuracy on all four different phases. On the other hand, the phase-specific model achieved the best segmentation results on the training data for all phases. The single joint model performed the worst of all models. Moreover, all segmentation models obtained the lowest segmentation accuracy on the PVP images for both the training and testing sets.
 |
Table 4 The Dice Coefficient of Three Segmentation Models on All Phase Images of the Internal Data Set |
Discussion
In this study, we developed a deep learning-based LI-RADS grading system on multiphase gadoxetic acid-enhanced MRI, comprising four deep 3D CNN models including a tumor segmentation network and three major imaging feature classification networks. The system was almost completely automated without the need of lesion size measurement or manual selection of the optimal axial slice. Furthermore, the step-by-step expert-guided system devised in this study outperformed the conventional end-to-end black box network.
We firstly developed an almost automated tumor segmentation network with the only manual input as an ROI around the target tumor, and we proved that the impact of bounding box variation on the model performance was negligible. By using this automated segmentation method, we achieved satisfied accuracy for the mapped diameter intervals. The accuracy increased with the size of the tumors, possibly because the diameter computation was less sensitive to the segmentation errors for larger lesions, and also larger tumors were in general more visually distinguishable with better enhanced boundaries and less affected by potential artifacts. Besides, the mean diameter error of the external data set was greater than the internal data set, although the overall accuracy of diameters mapped to three intervals was high (91.5%), this may result from the much greater percentage of large tumors (≥ 20 mm) in the external group (78.9%), larger diameter may lead to relatively larger absolute errors in value.
Moreover, we made a comparison study of three multi-phase tumor segmentation models, i.e., the single mixed model, the phase-specific model, and the single joint model. On the testing data, the single mixed model achieved the best segmentation accuracy on all four different phases. It is suggested that in the case of limited training data size, in spite of the difference across phases, the mixed use of training images of all phases can boost the data size, thus benefit the generalization performance of the model, which is possibly due to partly common imaging characteristic shared across phases.31 On the other hand, the phase-specific model achieved the best segmentation results on the training data for all phases, indicating the over-fitting problem for this approach because the model was trained only with data of single phase. However, given sufficient training data, the phase-specific model is expected to outperform the single mixed model eventually. The single joint model performed the worst of all models, which was possibly caused by the lesion misalignment across phases as mentioned above. Meanwhile, it was noted that all segmentation models obtained the lowest segmentation accuracy on PVP for both training and testing set. To a large extent, it was attributed to the lower contrast between HCC and liver parenchyma on PVP. Because of continued contrast medium uptake and progressively increasing enhancement of the adjacent liver parenchyma in the late dynamic phase, the contrast of HCC on PVP was usually lower than TP.36 In addition, previous results also showed that the contrast of HCC on PVP was lower for EOB than extracellular agent.37,38
We subsequently developed three imaging feature classification networks, including APHE, washout, and capsule. Considerable performance differences were observed across the three major feature classification models, even though all three networks were of similar architecture and trained with the same amount of training data and same hyper-parameters. APHE performed the best, followed by washout, and capsule performing the worst. The results implied possible different levels of ambiguity of the three imaging features and well fit the consistency observed among the manual labels individually rated by the three radiologists. The capsule performed the worst and presented the lowest consistency across the raters, consistent with previous studies.5,30,36,37 Earlier researches showed a lower detection rate of enhancing capsule with EOB than with extracellular agent, as with EOB-MRI, early contrast uptake by the adjacent hepatocytes led to strong liver parenchyma enhancement on TP; thus, a capsule became less conspicuous and the visual contrast between the liver and capsule was diminished.36,37,39 Meanwhile, the performance in the training data outperformed the testing data, the possible reason is that compared to tumor segmentation, classification models may be more prone to the over-fitting problem given the same limited size of the training data. It was partly caused by the disparate difficulty of two tasks, and also possibly because each voxel in the image contributed as a training sample for segmentation problem while the whole image was counted as one sample for the classification model. The LI-RADS grading accuracy was subject to the same performance drop due to the downgrade of the three feature classification models on the testing data set. Due to the over-fitting problem mentioned above, both feature classification models and the LI-RADS grading system showed certain performance downgrades on the external data set, the data differences between internal and external data sets as well as the limited training data volume may also lead to the poor generalization performance of the model on external data set. Despite all the endeavors such as various data augmentation and network depth reduction, over-fitting problem still occurred due to the limitation of the training data size, further research with a larger sample size and an attempt of other techniques such as transfer learning may be of help to improve the generalization performance of the models.
Different from most prevailing deep learning methods where the network was trained end-to-end directly for a specific task, namely, LI-RADS grading in this study; we proposed a step-by-step deep learning-based LI-RADS grading system comprising several models which were trained to segment the tumor and infer three major imaging features respectively, the obtained results were subsequently easily joined to estimate the LR category. By decomposing the complex task into several more intuitive and easier sub-tasks, such separate knowledge is more visually perceivable and interpretable than LR grades, thus plausibly easier to learn by the network especially when the data set size is relatively small. It was assumed that the proposed system may be superior to the conventional black box network with limited training sample size. Our research confirmed this hypothesis, and concluded that the step-by-step expert-guided system outperformed the end-to-end black box model; furthermore, our experiment results revealed that under the same circumstances, the end-to-end CNN network was more prone to the over-fitting problem than the step-by-step CNN, given the limited amount of training data.
This study had several limitations. Firstly, the data set, albeit larger than any of previous reported studies is this area, was still small for deep learning methods. Even in the proposed system, drastic over-fitting problem was still observed, and the feature classification models were more susceptible to a small data set than the segmentation model. A larger data set, preferably collected from multiple institutions, was critical to improve the generalization performance of the models, and techniques such as transfer learning may also be employed in the proposed system when the data size is small. Secondly, we focused on the major features of lesion size, APHE, washout and capsule and categorized LI-RADS grading 3 to 5 in this study. Future work accounting the numerous ancillary features and threshold growth is warranted. Thirdly, the proposed system still required manual input of the tumor bounding boxes on all four phases. It is desirable to develop focal liver lesion detection and registration models to automatically locate the lesions across phases, thus the whole LI-RADS grading system would become completely automated. Lastly, it remains to evaluate the LI-RADS categories automatically assigned by the deep learning models using the pathology test results as the ground truth.
Conclusions
In conclusion, we developed a step-by-step expert-guided LI-RADS grading system (LR-3, LR-4 and LR-5) on multiphase gadoxetic acid-enhanced MRI, using 3D CNN models including a tumor segmentation model for automatic tumor diameter estimation and three major feature classification models, superior to the conventional end-to-end black box system. This deep learning-based system may improve workflow efficiency for HCC diagnosis in clinical practice.
Abbreviations
HCC, hepatocellular carcinoma; LI-RADS, liver imaging reporting and data system; CNN, convolutional neural network; MRI, magnetic resonance imaging; ROI, region of interest; APHE, arterial phase hyper-enhancement; AP, arterial phase; PVP, portal venous phase; TP, transitional phase; ICC, intraclass correlation coefficient; ROC, receiver operating characteristic; AUC, area under the curve.
Data Sharing Statement
The data sets used and/or analysed during the current study are available from the corresponding author on reasonable request.
Ethics Approval and Informed Consent
This retrospective study was conducted in accordance with the declaration of Helsinki, which was approved and exempted from written informed consent by the Ethical Review Committee of Zhongshan Hospital, Fudan University, Shanghai, China (approval No. B2021-113R). The reason for exemption of informed consent is that this MRI-based deep-learning study was based on clinical history data related to previous diagnosis, and did not involve personal privacy and commercial interests. Specifically, all the original images were deleted from the subject’s personal information (name, address, telephone number, hospitalization number, etc.), and then desensitized and encrypted for imaging analysis. During the analysis, all imaging data were stored anonymously in our hospital database, with the anonymous code saved by our team leader (Mengsu Zeng).
Author Contributions
All authors made a significant contribution to the work reported in the conception, study design, execution, acquisition of data, analysis and interpretation, or in all these areas; took part in drafting or writing, revising or critically reviewing the article; agreed on the journal to which the article would be submitted; reviewed and agreed on all versions of the article before submission, during revision, the final version accepted for publication, and any significant changes introduced at the proofing stage; and agreed to take responsibility and be accountable for all aspects of the work.
Funding
This study was supported by the Shanghai “Rising Stars of Medical Talent” Youth Development Program [grant number SHWRS(2020)_087], the Shanghai Municipal Key Clinical Specialty [grant number W2019-018], the Zhongshan Hospital, Fudan University [grant number 2020ZSLC61], and the National Natural Science Foundation of China [grant number 91859107].
Disclosure
The authors declare that they have no competing interests in this work.
References
1. Singal AG, Lampertico P, Nahon P. Epidemiology and surveillance for hepatocellular carcinoma: new trends. J Hepatol. 2020;72(2):250–261. doi:10.1016/j.jhep.2019.08.025
2. Marrero JA, Kulik LM, Sirlin CB, et al. Diagnosis, staging, and management of hepatocellular carcinoma: 2018 practice guidance by the American Association for the Study of Liver Diseases. Hepatology. 2018;68(2):723–750. doi:10.1002/hep.29913
3. Chernyak V, Fowler KJ, Kamaya A, et al. Liver Imaging Reporting and Data System (LI-RADS) version 2018: imaging of hepatocellular carcinoma in at-risk patients. Radiology. 2018;289(3):816–830. doi:10.1148/radiol.2018181494
4. Fowler KJ, Tang A, Santillan C, et al. Interreader reliability of LI-RADS version 2014 algorithm and imaging features for diagnosis of hepatocellular carcinoma: a large international multireader study. Radiology. 2018;286(1):173–185. doi:10.1148/radiol.2017170376
5. Ehman EC, Behr SC, Umetsu SE, et al. Rate of observation and inter-observer agreement for LI-RADS major features at CT and MRI in 184 pathology proven hepatocellular carcinomas. Abdom Radiol (NY). 2016;41(5):963–969. doi:10.1007/s00261-015-0623-5
6. Schellhaas B, Hammon M, Strobel D, et al. Interobserver and intermodality agreement of standardized algorithms for non-invasive diagnosis of hepatocellular carcinoma in high-risk patients: CEUS-LI-RADS versus MRI-LI-RADS. Eur Radiol. 2018;28(10):4254–4264. doi:10.1007/s00330-018-5379-1
7. Krizhevsky A, Sutskever I, Hinton G. ImageNet classification with deep convolutional neural networks. NIPS Curran Assoc Inc. 2012.
8. Huang G, Liu Z, Laurens VDM, Weinberger KQ. Densely connected convolutional networks. IEEE Conf Comp Vision Pattern Recogn. 2017. doi:10.1109/CVPR.2017.243
9. He K, Zhang X, Ren S, Sun J. Deep residual learning for image recognition. IEEE Conf Comp Vision Pattern Recogn. 2016. doi:10.1109/CVPR.2016.90
10. Lecun Y, Bengio Y, Hinton GJN. Deep learning. Nature. 2015;521(7553):436–444. doi:10.1038/nature14539
11. Shin HC, Roth HR, Gao M, et al. Deep convolutional neural networks for computer-aided detection: CNN architectures, dataset characteristics and transfer learning. IEEE Trans Med Imaging. 2016;35(5):1285–1298. doi:10.1109/TMI.2016.2528162
12. Rajpurkar P, Irvin J, Zhu K, et al. CheXNet: radiologist-level pneumonia detection on chest X-rays with deep learning. arXiv. 2017.
13. Wang X, Peng Y, Lu L, Lu Z, Bagheri M, Summers RM. ChestX-ray8: hospital-scale chest X-ray database and benchmarks on weakly-supervised classification and localization of common thorax diseases. IEEE Conf Comp Vision Pattern Recogn. 2017. doi:10.1109/CVPR.2017.369
14. Akkus Z, Galimzianova A, Hoogi A, Rubin DL, Erickson BJ. Deep learning for brain MRI segmentation: state of the art and future directions. J Digit Imaging. 2017;30(4):449–459. doi:10.1007/s10278-017-9983-4
15. Park B, Park H, Lee SM, Seo JB, Kim NJ. Lung segmentation on HRCT and volumetric CT for diffuse interstitial lung disease using deep convolutional neural networks. J Digit Imaging. 2019;32(6):1019–1026. doi:10.1007/s10278-019-00254-8
16. Pang T, Guo S, Zhang X, Zhao L. Automatic lung segmentation based on texture and deep features of HRCT images with interstitial lung disease. Biomed Res Int. 2019;2019:2045432. doi:10.1155/2019/2045432
17. Romero-Lopez A, Giro-I-Nieto X, Burdick J, Marques O. Skin lesion classification from dermoscopic images using deep learning techniques. IASTED Int Conf Biomed Eng. 2017. doi:10.2316/P.2017.852-053
18. Shiraishi J, Sugimoto K, Moriyasu F, Kamiyama N, Doi KJMP. Computer-aided diagnosis for the classification of focal liver lesions by use of contrast-enhanced ultrasonography. Med Phys. 2008;35(5):1734–1746. doi:10.1118/1.2900109
19. Hwang YN, Lee JH, Kim GY, et al. Classification of focal liver lesions on ultrasound images by extracting hybrid textural features and using an artificial neural network. Biomed Mater Eng. 2015;26(s1):S1599–S611. doi:10.3233/BME-151459
20. Nie D, Lu J, Zhang H, et al. Multi-channel 3D deep feature learning for survival time prediction of brain tumor patients using multi-modal neuroimages. Sci Rep. 2019;9(1):1103. doi:10.1038/s41598-018-37387-9
21. Ouyang X, Huo J, Xia L, et al. Dual-sampling attention network for diagnosis of COVID-19 from community acquired pneumonia. IEEE Trans Med Imaging. 2020;39(8):2595–2605. doi:10.1109/TMI.2020.2995508
22. Yasaka K, Akai H, Abe O, Kiryu S. Deep learning with convolutional neural network for differentiation of liver masses at dynamic contrast-enhanced CT: a preliminary study. Radiology. 2018;286(3):887–896. doi:10.1148/radiol.2017170706
23. Chartrand G, Cheng PM, Vorontsov E, et al. Deep learning: a primer for radiologists. Radiographics. 2017;37(7):2113–2131. doi:10.1148/rg.2017170077
24. Zhang QS, Zhu SC. Visual interpretability for deep learning: a survey. Front IT EE. 2018;19(01):27–39.
25. Roberts LR, Sirlin CB, Zaiem F, et al. Imaging for the diagnosis of hepatocellular carcinoma: a systematic review and meta-analysis. Hepatology. 2018;67(1):401–421. doi:10.1002/hep.29487
26. Lee YJ, Lee JM, Lee JS, et al. Hepatocellular carcinoma: diagnostic performance of multidetector CT and MR imaging-a systematic review and meta-analysis. Radiology. 2015;275(1):97–109. doi:10.1148/radiol.14140690
27. Wu Y, White GM, Cornelius T, et al. Deep learning LI-RADS grading system based on contrast enhanced multiphase MRI for differentiation between LR-3 and LR-4/LR-5 liver tumors. Ann Transl Med. 2020;8(11):701. doi:10.21037/atm.2019.12.151
28. Yamashita R, Mittendorf A, Zhu Z, et al. Deep convolutional neural network applied to the liver imaging reporting and data system (LI-RADS) version 2014 category classification: a pilot study. Abdom Radiol (NY). 2020;45(1):24–35. doi:10.1007/s00261-019-02306-7
29. Hamm CA, Wang CJ, Savic LJ, et al. Deep learning for liver tumor diagnosis part I: development of a convolutional neural network classifier for multi-phasic MRI. Eur Radiol. 2019;29(7):3338–3347. doi:10.1007/s00330-019-06205-9
30. Wang CJ, Hamm CA, Savic LJ, et al. Deep learning for liver tumor diagnosis part II: convolutional neural network interpretation using radiologic imaging features. Eur Radiol. 2019;29(7):3348–3357. doi:10.1007/s00330-019-06214-8
31. Ronneberger O, Fischer P, Brox T. U-net: convolutional networks for biomedical image segmentation. Int Conf Med Image Comp Comp Assist Interven. 2015;9351:234–241.
32. Xu Y, Mo T, Feng Q, Zhong P, Chang IC. Deep learning of feature representation with multiple instance learning for medical image analysis. IEEE Int Conf Acoust. 2014. doi:10.1109/ICASSP.2014.6853873
33. Babenko B, Yang MH, Belongie S. Visual tracking with online multiple instance learning. IEEE Conf Comp Vision Pattern Recogn. 2009. doi:10.1109/CVPR.2009.5206737
34. Wangperawong A, Brun C, Laudy O, Pavasuthipaisit R. Churn analysis using deep convolutional neural networks and autoencoders. arXiv. 2016.
35. Dice LR. Measures of the amount of ecologic association between species. Ecology. 1945;26(3):297–302. doi:10.2307/1932409
36. Allen BC, Ho LM, Jaffe TA, Miller CM, Mazurowski MA, Bashir MR. Comparison of visualization rates of LI-RADS version 2014 major features with IV gadobenate dimeglumine or gadoxetate disodium in patients at risk for hepatocellular carcinoma. AJR Am J Roentgenol. 2018;210(6):1266–1272. doi:10.2214/AJR.17.18981
37. Son J, Hwang SH, Park S, et al. Imaging features of hepatocellular carcinoma: quantitative and qualitative comparison between mri-enhanced with Gd-EOB-DTPA and Gd-DTPA. Invest Radiol. 2019;54(8):494–499. doi:10.1097/RLI.0000000000000562
38. Chen CZ, Rao SX, Ding Y, et al. Hepatocellular carcinoma 20 mm or smaller in cirrhosis patients: early magnetic resonance enhancement by gadoxetic acid compared with gadopentetate dimeglumine. Hepatol Int. 2014;8(1):104–111. doi:10.1007/s12072-013-9467-7
39. Hope TA, Fowler KJ, Sirlin CB, et al. Hepatobiliary agents and their role in LI-RADS. Abdom Imaging. 2015;40(3):613–625. doi:10.1007/s00261-014-0227-5
 © 2021 The Author(s). This work is published and licensed by Dove Medical Press Limited. The
full terms of this license are available at https://www.dovepress.com/terms
and incorporate the Creative Commons Attribution
- Non Commercial (unported, 3.0) License.
By accessing the work you hereby accept the Terms. Non-commercial uses of the work are permitted
without any further permission from Dove Medical Press Limited, provided the work is properly
attributed. For permission for commercial use of this work, please see paragraphs 4.2 and 5 of our Terms.
© 2021 The Author(s). This work is published and licensed by Dove Medical Press Limited. The
full terms of this license are available at https://www.dovepress.com/terms
and incorporate the Creative Commons Attribution
- Non Commercial (unported, 3.0) License.
By accessing the work you hereby accept the Terms. Non-commercial uses of the work are permitted
without any further permission from Dove Medical Press Limited, provided the work is properly
attributed. For permission for commercial use of this work, please see paragraphs 4.2 and 5 of our Terms.