Back to Journals » Blood and Lymphatic Cancer: Targets and Therapy » Volume 16
A Risk Model Using Refined Disease Risk Index and 1-Month NK-Cell Count for Relapse in Children and Adults with T-ALL/LBL After Myeloablative Umbilical Cord Blood Transplantation
Authors Zhao N, Chi R ![]() , Song K, Wu Y, Yan B, Wang D
, Song K, Wu Y, Yan B, Wang D ![]() , Tang B, Zhu X
, Tang B, Zhu X ![]()
Received 30 November 2025
Accepted for publication 24 April 2026
Published 22 May 2026 Volume 2026:16 582933
DOI https://doi.org/10.2147/BLCTT.S582933
Checked for plagiarism Yes
Review by Single anonymous peer review
Peer reviewer comments 2
Editor who approved publication: Dr Wilson Gonsalves
Na Zhao,1– 4,* Rong Chi,1,3,4,* Kaidi Song,1,3,4,* Yue Wu,1,3,4 Bingbing Yan,1,3,4 Dongyao Wang,1,3,4 Baolin Tang,1,3,4 Xiaoyu Zhu1,3,4
1Department of Hematology, The First Affiliated Hospital of USTC, Division of Life Sciences and Medicine, University of Science and Technology of China, Hefei, Anhui, People’s Republic of China; 2State Key Laboratory of Immune Response and Immunotherapy, Division of Life Sciences and Medicine, University of Science and Technology of China, Hefei, Anhui, People’s Republic of China; 3Anhui Provincial Key Laboratory of Blood Research and Applications, Hefei, Anhui, People’s Republic of China; 4Blood and Cell Therapy Institute, Division of Life Sciences and Medicine, University of Science and Technology of China, Hefei, Anhui, People’s Republic of China
*These authors contributed equally to this work
Correspondence: Xiaoyu Zhu, Department of Hematology, The First Affiliated Hospital of USTC, Division of Life Sciences and Medicine, University of Science and Technology of China, Hefei, Anhui, 230001, People’s Republic of China, Email [email protected]
Purpose: To assess transplant outcomes after umbilical cord blood transplantation (UCBT) in patients with T-cell acute lymphoblastic leukemia/lymphoblastic lymphoma (T-ALL/LBL) and identify factors associated with relapse.
Patients and Methods: We retrospectively analyzed 105 patients with T-ALL/LBL (age, 2– 53 years), who underwent single-unit UCBT as their first transplant at our center between January 2014 and June 2024. Transplant outcomes were assessed in the overall cohort. Relapse-associated factors were identified using Fine–Gray competing-risk regression in the subgroup with available 1-month peripheral blood natural killer (NK) cell measurements (58/105, 55.2%). The 1-month NK-cell count was dichotomized based on the median number in the analyzed cohort. A simplified risk score was derived from the final multivariable model. Model performance was assessed using time-dependent area under the curve (AUC) and calibration analysis.
Results: In the overall cohort, the 3-year overall survival, progression-free survival, and GVHD-free relapse-free survival were 57.3% (95% CI, 46.9– 66.4%), 54.9% (95% CI, 44.9– 63.9%), and 49.3% (95% CI, 39.5– 58.5%), respectively, and the 3-year cumulative incidence of relapse was 34.5% (95% CI, 25.5– 43.6%). In the NK-measured subgroup, multivariable Fine–Gray analysis identified high refined Disease Risk Index (R-DRI) (sHR, 4.561; 95% CI, 1.662– 12.51; P = 0.003) and low 1-month NK-cell count (< 0.165 × 10⁹/L) (sHR, 6.175; 95% CI, 1.711– 22.280; P = 0.005) as independent factors associated with relapse. A 2-point score stratified patients into low-, intermediate-, and high-risk groups with 3-year relapse incidences of 0, 43.5% (95% CI, 23.3– 62.1%), and 89.7% (95% CI, 48.6– 98.4%), respectively (P < 0.001). The apparent 3-year AUC was 0.539 (95% CI, 0.255– 0.823), and the optimism-corrected AUC was 0.523.
Conclusion: Relapse remains a major cause of treatment failure after UCBT in T-ALL/LBL. High R-DRI and low 1-month NK-cell count were independently associated with relapse and allowed apparent risk stratification in the development cohort. This exploratory 2-factor model may provide a basis for future studies of relapse assessment incorporating early immune recovery.
Keywords: immune recovery, competing risks, prognosis, stratification
Introduction
T-cell acute lymphoblastic leukemia/lymphoblastic lymphoma (T-ALL/LBL) is an aggressive malignancy of immature T-cell precursors, accounting for 10%–15% of pediatric and up to 25% of adult ALL, and nearly 3%–4% of adult and nearly 25%–35% of pediatric/adolescent non-Hodgkin lymphomas.1–3 Despite advances in chemotherapy and allogeneic hematopoietic stem cell transplantation (allo-HSCT), relapse remains the main cause of treatment failure, with poor long-term survival.2–5 In a multicenter cohort of 102 T-ALL patients after general allo-HSCT, the 3-year overall survival (OS) and progression-free survival (PFS) were 35% and 33%, respectively, with a cumulative incidence of progression of 55% and non-relapse mortality (NRM) of 11%.6 In a multicenter analysis of T-LBL patients undergoing general allo-HSCT, the 2-year disease progression rate was 21.0%, with OS, PFS, and NRM rates of 79.5%, 69.8%, and 9.2%, respectively.7 These findings underscore the urgent need to address post-transplant relapse in this population.
Umbilical cord blood transplantation (UCBT) is an established alternative donor source, with rapid availability and distinct biological and immunological features.8,9 However, studies specifically addressing UCBT in T-ALL/LBL remain limited. Consequently, data on transplant outcomes and prognostic markers in this setting are still scarce. The refined Disease Risk Index (R-DRI) has been shown to predict transplant outcomes in heterogeneous hematologic malignancies.10,11 Early post-transplant immune recovery, particularly natural killer (NK) cell reconstitution, has likewise been associated with outcomes after transplantation.12,13 Together, these prior observations suggest that relapse after transplantation may be influenced by both pre-transplant disease-related risk and early post-transplant immune reconstitution. However, their relevance in T-ALL/LBL patients undergoing UCBT remains unclear. Thus, we conducted a retrospective cohort study to evaluate transplant outcomes in T-ALL/LBL patients after UCBT and to identify factors associated with relapse. We sought to identify readily available clinical and early immunologic predictors and to construct a risk-stratification tool that, following validation, could potentially guide intensified surveillance and preemptive interventions for high-risk patients.
Materials and Methods
Patient Eligibility
Between January 2014 and June 2024, data from 105 consecutive patients with T-ALL/LBL who underwent single-unit UCBT as their first transplant at the First Affiliated Hospital of the University of Science and Technology of China (USTC) were reviewed (Figure 1).
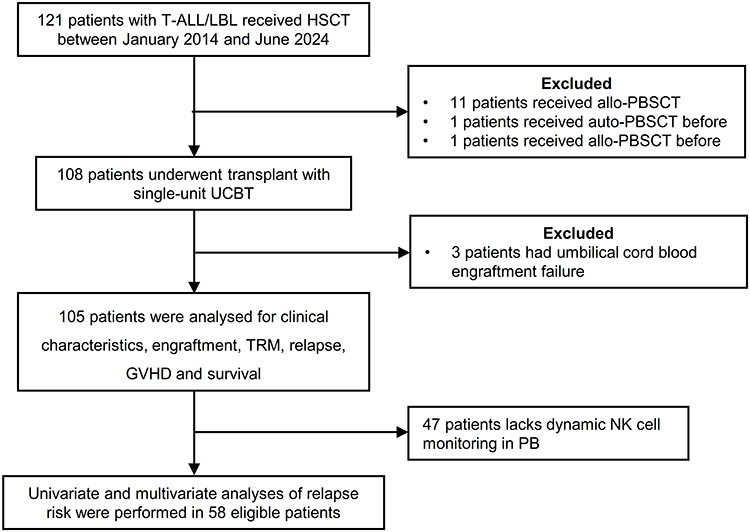 |
Figure 1 Flowchart of patients’ enrollment in this study. Abbreviations: T-ALL/LBL, T-cell acute lymphoblastic leukemia/lymphoma; HSCT, hematopoietic stem cell transplantation; UCBT, umbilical cord blood transplantation; TRM, transplant-related mortality; GVHD, graft-versus-host disease; allo-PBSCT, allogeneic peripheral blood stem cell transplantation; auto-PBSCT, autologous peripheral blood stem cell transplantation; PB, peripheral blood. |
All patients or their legal guardians had provided written informed consent at the time of admission and prior to transplantation, including consent for treatment and for the future use of de-identified clinical data for research purposes in accordance with the Declaration of Helsinki. Given the retrospective nature of the study and the use of existing data, the requirement for additional study-specific informed consent was waived by the Ethics Committee of the First Affiliated Hospital of the University of Science and Technology of China (Approval No. 2025-RE-232).
Cord Blood Selection and HLA Typing
All cord blood units were sourced from accredited cord blood banks, where donors had previously provided written informed consent for cord blood donation and clinical use in accordance with applicable institutional and regulatory requirements. The strategies for human leukocyte antigen (HLA) typing and cord blood unit selection were as previously described.14,15 Briefly, according to our institutional UCB unit-selection protocol, single cord blood units from the Chinese Cord Blood Bank were selected based on high-resolution HLA typing at HLA-A, -B, -C, -DRB1, and -DQB1, with preference given to units meeting a minimum of 5/10 allele-level matching. Unit selection also required an adequate cell dose, including at least 3.0×10⁷ total nucleated cells/kg and at least 1.2×10⁵ CD34+ cells/kg. In addition, anti-HLA antibody screening was performed to exclude donor-specific antigens.
Transplant Procedures
All patients received myeloablative conditioning. A busulfan (Bu)/cyclophosphamide (Cy)-based regimen was administered to 80 patients (Bu 0.8 mg/kg every 6 hours for 3 or 4 days; Cy 60 mg/kg daily for 2 days). The remaining 25 patients received an irradiation/Cy-based regimen: 8 received total marrow irradiation (TMI) at 12–15 Gy in 3 fractions, and 17 received total body irradiation (TBI) at 12 Gy in 3 fractions, both combined with Cy 60 mg/kg for 2 days. Fludarabine (Flu, 30 mg/m2 daily for 4 days) was added to all Bu/Cy regimens and to the TMI/Cy regimen. Patients in the TBI/Cy group received either fludarabine or cytarabine (Ara-C, 2 g/m2 daily for 4 days) in addition to irradiation/Cy. T-cell depletion using antithymocyte globulin (ATG) was not incorporated into the conditioning regimen. In addition, busulfan dosing was based on body weight, and therapeutic drug monitoring was not routinely performed. For graft-versus-host disease (GVHD) prophylaxis, all patients received cyclosporine combined with mycophenolate mofetil.14,15 Other supportive care and transplant procedures followed previously published institutional UCBT protocols.14,15
Peripheral Blood Sampling and Flow Cytometry
Peripheral blood samples were collected in EDTA tubes after routine complete blood count testing and processed within 24 hours. Red blood cells were lysed (RBC lysis buffer, Solarbio), and mononuclear cells were stained with anti-CD3-APC-Cy7, anti-CD45-Alexa Fluor 700, and anti-CD56-BV650 (BD Biosciences) at 4 °C for 15–20 minutes. After washing, at least 10,000 lymphocyte-gated events were acquired on a 4-laser, 18-color BD cytometer (Diva software) and analyzed using FlowJo v10.0. NK cells were identified as CD45+CD3−CD56+ lymphocytes (Supplementary Figure S1). The absolute NK-cell count was calculated by multiplying the percentage of NK cells within the lymphocyte gate by the absolute lymphocyte count obtained from the complete blood count.
R-DRI and Outcome Definitions
Disease risk was classified using R-DRI, and disease status at transplantation was assigned to the corresponding R-DRI categories according to published criteria.16 Treatment response in T-ALL/LBL was assessed according to standard criteria.1,17 Complete remission (CR) was defined as < 5% bone marrow blasts without evidence of extramedullary disease, as confirmed by computed tomography or positron emission tomography imaging. Non-response or refractory disease was defined as ≥ 25% bone marrow blasts, a < 50% reduction in extramedullary disease, or emergence of new lesions. Relapse was defined as reappearance of disease after CR, including ≥ 5% bone marrow blasts or involvement of the central nervous system or other extramedullary sites. Acute GVHD (aGVHD) was graded according to MAGIC criteria,18 and chronic GVHD (cGVHD) according to the National Institutes of Health consensus criteria.19 Neutrophil engraftment was defined as the first of three consecutive days with an absolute neutrophil count ≥ 0.5 × 10⁹/L, and platelet engraftment as the first of seven consecutive days with platelet counts ≥20 × 109/L without transfusion support. PFS was defined as survival without relapse or progression; transplant-related mortality (TRM) as death without relapse or progression; OS as survival regardless of disease status; and GVHD-free, relapse-free survival (GRFS) as survival without grade III–IV acute GVHD, chronic GVHD requiring systemic therapy, relapse, or death within the first year after transplantation.
Statistical Analysis
This study comprised two related analytic components. First, clinical characteristics and transplant outcomes were described in the overall cohort of 105 consecutive patients undergoing first single-unit UCBT for T-ALL/LBL. Second, an exploratory relapse model was developed in the subgroup of 58 patients with available peripheral blood NK-cell measurements at one month after transplantation.
Categorical variables were compared using the chi-square test or Fisher’s exact test, as appropriate. Continuous variables were summarized as median (range) and compared using the Mann–Whitney U-test. Peripheral blood NK-cell counts at 1 month after UCBT were available for 58 of the 105 patients. To assess potential selection bias, baseline pre-transplant patient and disease characteristics were compared between patients with and without available NK-cell measurements (Supplementary Table S1). Subsequent analyses involving 1-month NK-cell recovery were then restricted to the 58 patients with available measurements and were interpreted as exploratory analyses within the NK-measured subgroup.
OS, PFS, and GRFS were estimated using the Kaplan–Meier method and compared using the Log rank test. Median follow-up was estimated using the reverse Kaplan–Meier method. Cumulative incidences of relapse, TRM, engraftment, and GVHD were estimated in a competing-risks framework and compared using Gray’s test. For relapse analyses, death without relapse was treated as the competing event. For TRM analyses, relapse was treated as the competing event. For engraftment and GVHD analyses, death or relapse before the event of interest were treated as competing events. For time-to-event analyses, patients who had not experienced the endpoint of interest by the data cutoff date were censored at last follow-up.
Fine–Gray Regression Model
Risk factors for relapse were first evaluated using univariable Fine–Gray competing-risks regression, including clinically relevant pre-transplant and transplant-related variables. Variables associated with relapse at P < 0.10 in univariable analysis were subsequently entered into the multivariable Fine–Gray subdistribution hazard model. The multivariable model was derived using stepwise selection based on P value. Continuous variables were analyzed as continuous measures unless otherwise specified. 1-month NK-cell count was dichotomized at the cohort median to facilitate risk stratification. As this cutoff was data-driven, sensitivity analyses were additionally performed treating NK-cell count as a continuous variable, including a log2-transformed model to improve interpretability. Regression coefficients were used to assign weighted integer points by scaling each coefficient relative to the smallest coefficient and rounding to the nearest whole number. The total score was calculated by summing the assigned points for each predictor, and patients were categorized into low-, intermediate-, and high-risk groups according to the total score. Confidence intervals for the regression coefficients were calculated using the Wald method, which is based on the standard errors of the estimated coefficients from the model. Fine–Gray regression was performed using the crr() function from the cmprsk package in R. Tied event times were handled according to the default method of this function, which assigns each tied event a unique failure time. All analyses were performed using R (version 4.5.1). Two-sided P value < 0.05 were considered statistically significant.
Model Performance and Internal Validation
Model performance was assessed in the development cohort at 3 years. Discrimination was quantified using the time-dependent area under the curve (AUC), and overall prediction error was assessed using the time-dependent Brier score. Calibration was assessed using a calibration plot and an approximate calibration slope at 3 years. The apparent calibration slope was estimated from a logistic regression model with 3-year relapse status as the outcome and the logit-transformed predicted 3-year relapse probability as the predictor. Internal validation was performed using bootstrap resampling (500 iterations). For each bootstrap sample, the model was refitted and evaluated in both the bootstrap sample and the original dataset. Optimism was estimated as the average difference between apparent and test performance, and optimism-corrected estimates of 3-year AUC, Brier score, and calibration slope were then obtained.
Sample Size and Events per Variable
The sample size for the relapse model was determined by the availability of 1-month NK-cell measurements. In the NK-measured subgroup, 58 patients were included, among whom 21 relapse events were observed. The final multivariable model included 2 predictors, yielding an events-per-variable (EPV) ratio of approximately 10.5. While the EPV in this analysis is lower than the threshold of 20 recommended in some methodological studies, the sample size of this specific transplant population limited the potential for model overfitting. The model was developed as an exploratory analysis, with internal validation performed using bootstrap resampling (500 iterations), and optimism-corrected performance estimates reported.
Results
Patient Characteristics in the Overall Cohort
Follow-up was updated by May 31, 2025. Among surviving patients, the median observed follow-up duration was 57.5 months (range, 9.9–135 months). The median follow-up estimated using the reverse Kaplan–Meier method was 57.9 months (95% CI, 53.9–77.6 months) (Supplementary Figure S2). 28 patients (26.7%) had follow-up shorter than 12 months, and 14 patients (13.3%) were censored before reaching 3 years of follow-up. A total of 49 patients (46.7%) had potential follow-up of at least 3 years. Among the 105 patients included in the study, 77 (73.3%) were male, with a median age of 14 years (range, 2–53 years). Forty-eight patients were younger than 14 years old. Based on primary disease presentation, 72 patients (68.6%) had been diagnosed with T-ALL, 7 (6.7%) T-LBL, and 26 (24.8%) patients had T-ALL with concurrent lymphadenopathy manifestations at presentation. A total of 38 patients (36.2%) received more than 5 cycles of chemotherapy prior to UCBT. Most patients (89.5%) achieved minimal residual disease (MRD) negativity by flow cytometry and 94.3% had no evidence of extramedullary disease (EMD) before UCBT. The median duration from diagnosis to UCBT was 6.9 months (1.9–80.5 months). Based on R-DRI, 15 patients (14.3%) were classified as very high-risk (R-DRI score: 4), 17 (16.2%) as high-risk (R-DRI score: 3), and 73 (69.6%) as intermediate-risk (R-DRI score: 2). A detailed breakdown of R-DRI assignment according to disease presentation is provided in Supplementary Table S2. Among donor-recipient pairs, 41 patients (39.0%) received grafts from female donors into male recipients. HLA mismatches were distributed as follows: 0–1/10 in 15 patients, 2–3/10 in 57 patients, and 4–5/10 in 33 patients, involving loci such as HLA-A, -B, -C, -DRB1, and -DQB1. Regarding ABO incompatibility, the identical, major incompatibility, minor incompatibility and bidirectional incompatibility were 26.7%, 29.5%, 28.6% and 15.2% respectively. The median infused TNC count was 3.13 × 10⁷/kg (range, 1.02–10.20 × 10⁷/kg), the median infused CD34+ cell count was 2.20 × 10⁵/kg (range, 0.25–9.40 × 10⁵/kg) and the median infused CD56⁺ cell count was 2.58 × 10⁵/kg (range, 0.20–17.50 × 10⁵/kg). Detailed demographics and transplantation characteristics are summarized in Table 1.
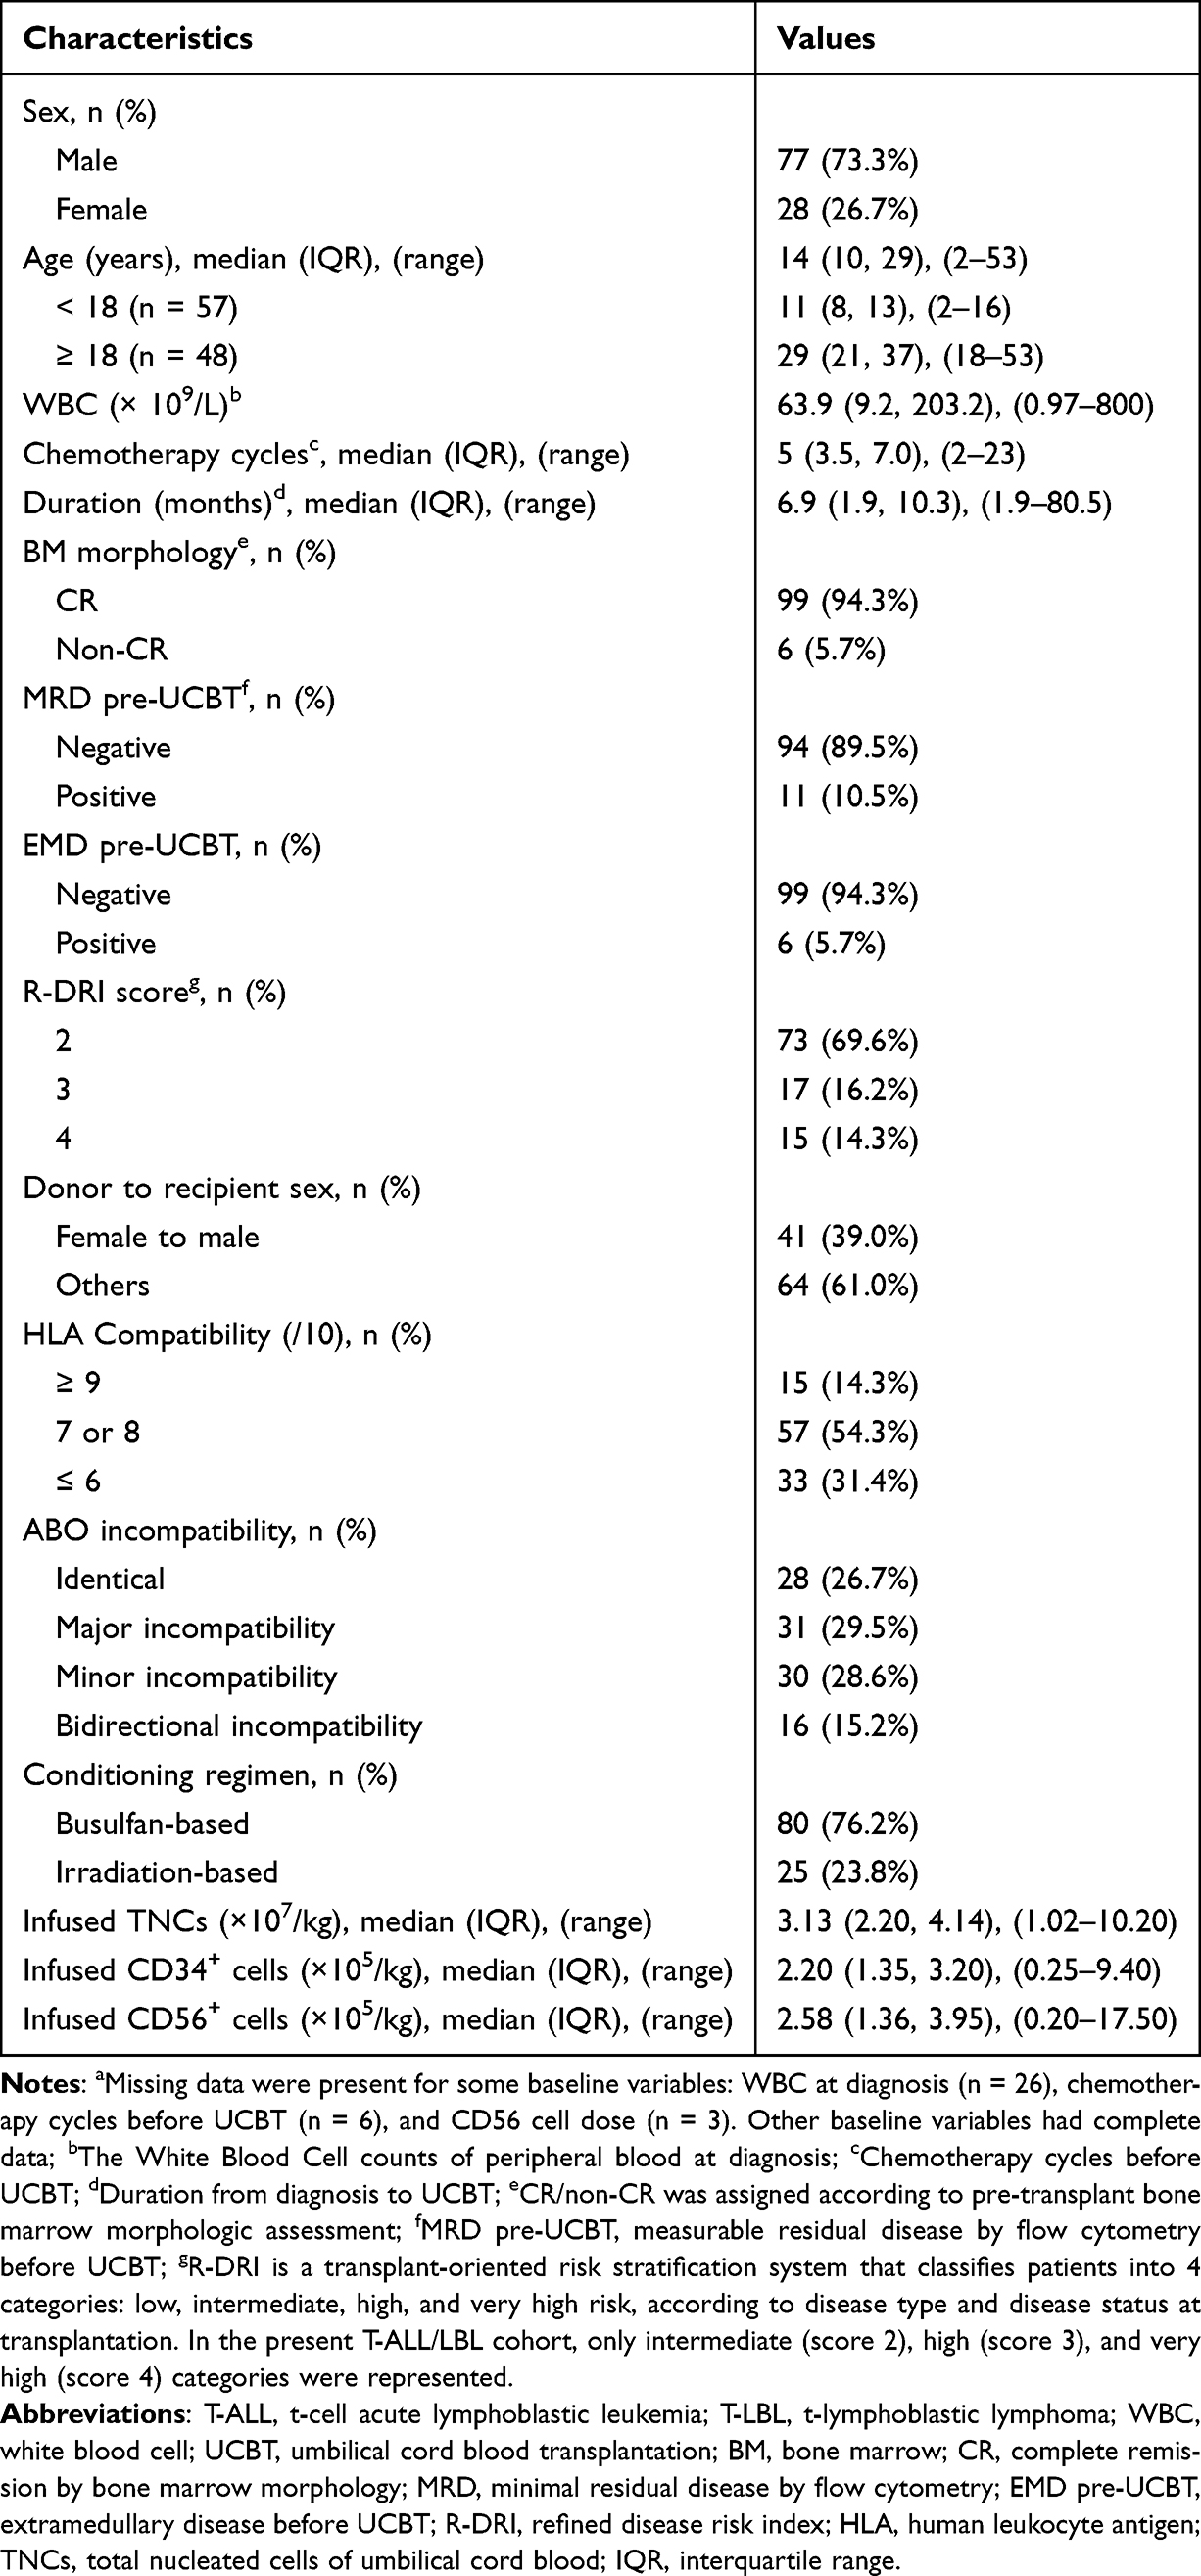 |
Table 1 Characteristics of T-ALL/LBL Patients (n = 105)a |
Engraftment and GVHD
All patients achieved neutrophil engraftment by day 42 post-UCBT, with a median time of 16 days (range, 11–32 days). The cumulative incidence of platelet engraftment by day 60 post-UCBT was 78.1% (95% CI: 68.9–84.9%), with a median platelet engraftment time of 37 days (range, 15–300 days). Among 46 patients who developed aGVHD, 26 (56.5%) patients had gastrointestinal involvement. The cumulative incidences of grade II–IV and grade III–IV aGVHD were 30.8% (95% CI: 22.2–39.7%) and 19.1% (95% CI: 12.2–27.1%), respectively. The 3-year cumulative incidence of cGVHD of any grade was 22.1% (95% CI: 14.7–30.5%), and the 3-year cumulative incidence of moderate to severe cGVHD was 9.7% (95% CI: 5.0–16.4%). Detailed data are presented in Table 2 and Supplementary Figures S3–S5.
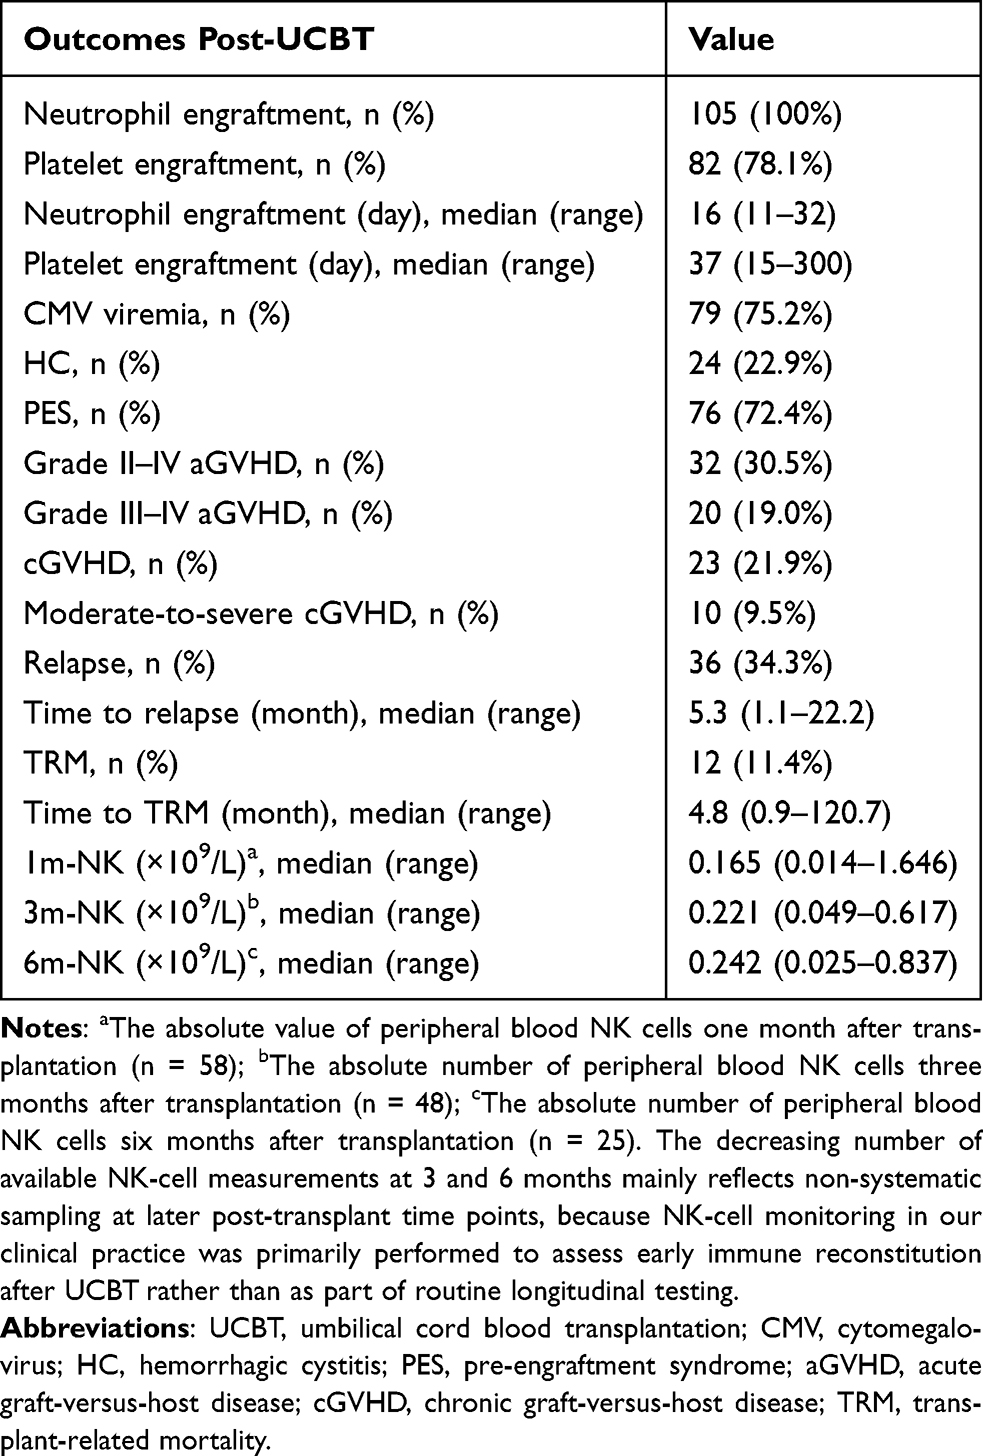 |
Table 2 Outcomes Post-UCBT of T-ALL/LBL Patients (n = 105) |
Survival Outcomes
Transplant-Related Mortality (TRM) and Relapse
A total of 12 transplant-related deaths occurred in patients without disease relapse. The most common causes of TRM were infections (n = 9) and gastrointestinal aGVHD (n = 5), with significant overlap as five fatal infections occurred in patients with active gastrointestinal aGVHD. Other fatal events included thrombotic microangiopathy (n = 1), veno-occlusive disease complicated by extensive cGVHD (n = 1), and late-onset bronchiolitis obliterans syndrome (n = 1). The 3-year cumulative incidence of TRM was 10.6% (95% CI: 5.6–17.4%) (Figure 2A). 34.3% (36/105) patients relapsed and the median time to relapse was 5.3 months (range, 1.1–22.2 months). The 3-year cumulative incidence of relapse (CIR) was 34.5% (95% CI: 25.5–43.6%) (Figure 2B). To further illustrate the temporal distribution of relapse events, a descriptive supplementary Kaplan–Meier curve showing the distribution of time from UCBT to relapse among patients who experienced relapse was added (Supplementary Figure S6), indicating that relapse events were concentrated in the early post-transplant period.
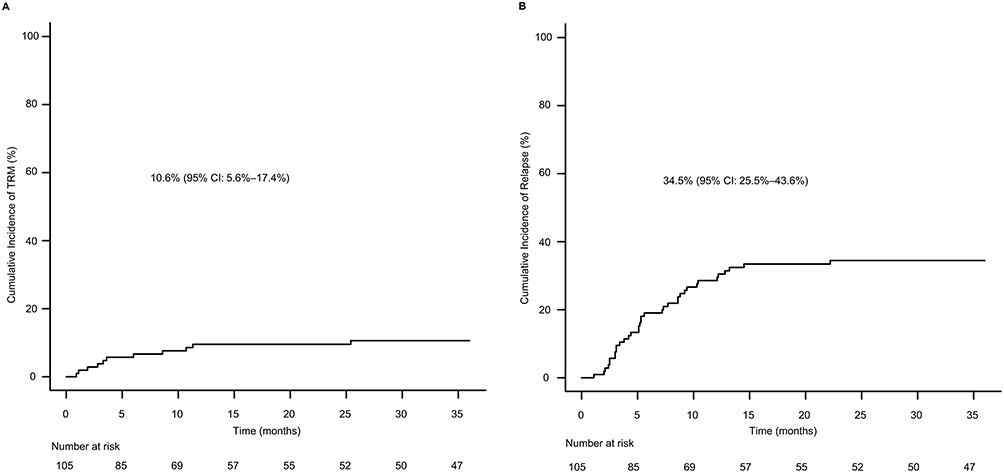 |
Figure 2 Cumulative incidence of 3-year TRM, n = 105 (A); Cumulative incidence of 3-year relapse, n = 105 (B). Cumulative incidence estimated using competing risks methods, treating relapse as the competing event in (A), and death without relapse as the competing event in (B). Abbreviation: TRM, transplant-related mortality. |
OS, PFS, and GRFS
The probabilities of 3-year OS, PFS, and GRFS were 57.3% (95% CI: 46.9–66.4%), 54.9% (95% CI: 44.9–63.9%) and 49.3% (95% CI: 39.5–58.5%), respectively (Figure 3A–C).
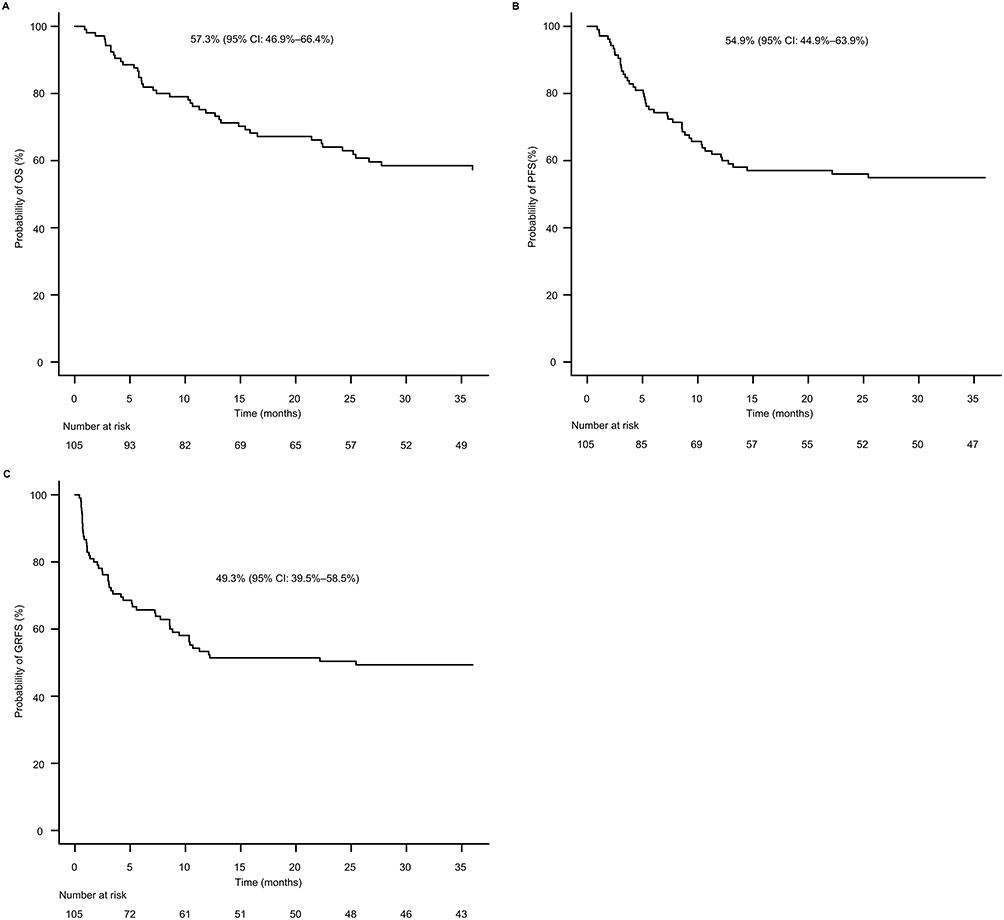 |
Figure 3 Probability of 3-year OS, n = 105 (A); Probability of 3-year PFS, n = 105 (B); Probability of 3-year GRFS, n = 105 (C). Abbreviations: OS, overall survival; PFS, progression-free survival (survival without relapse or death); GRFS, GVHD-free, relapse-free survival (survival without grade III–IV acute GVHD, chronic GVHD requiring systemic therapy, relapse, or death). |
Exploratory Analysis by Age Group
Pre-transplant baseline comparisons showed that pediatric patients (< 18 years, n = 57) had higher WBC counts at diagnosis and received more chemotherapy cycles before UCBT than adults (≥ 18 years, n = 48). WBC counts at diagnosis were 108.0 (range, 1.21–800.0) × 109/L in pediatrics versus 15.6 (range, 0.97–350.0) × 109/L in adults (P < 0.001), and the number of chemotherapy cycles before UCBT was 6 (range, 2–23) versus 4 (range, 2–12), respectively (P < 0.001). The 3-year OS was 59.3% (95% CI, 45.4–70.8%) in pediatric patients and 53.3% (95% CI, 36.8–67.2%) in adults (log-rank P = 0.939). The corresponding 3-year CIR was 36.8% (95% CI, 24.6–49.1%) and 31.8% (95% CI, 19.1–45.1%) (Gray’s test P = 0.489), and the 3-year TRM was 5.3% (95% CI, 1.4–13.2%) and 17.3% (95% CI, 8.0–29.4%) (Gray’s test P = 0.058), respectively.
Relapse Risk Analysis in the NK-Measured Subgroup
Given that relapse remained a major cause of treatment failure after UCBT, we next explored factors associated with relapse. Prior studies had demonstrated that early NK cell reconstitution is associated with transplant outcomes.12,13,20 On this basis, we examined early NK-cell recovery in peripheral blood (PB) as a candidate predictor in the subgroup with available measurements. Peripheral blood NK-cell counts at one month after UCBT were available for 58 of the 105 patients (55.2%).
To assess potential selection bias related to missing NK-cell data, we compared baseline characteristics between patients with (n = 58) and without (n = 47) available 1-month NK-cell measurements. Compared with patients without available NK-cell measurements, those included in the NK-measured subgroup were broadly comparable with respect to major pre-transplant patient and disease characteristics, although some transplant-related differences were observed (Supplementary Table S1). In an exploratory analysis, the availability of NK cell data was not significantly associated with the risk of 3-year relapse (sHR = 1.11, 95% CI: 0.58–2.16, P = 0.75). Although a trend toward higher 3-year OS was observed in the group without 1-month post-transplant NK cell data (63.2% [95% CI: 48.7–74.5%]) compared with those with available NK cell data (50.3% [95% CI: 35.1–63.6%]), this difference was not statistically significant (P = 0.07). Given the biological relevance of early NK-cell recovery after transplantation, and after assessing comparability between patients with and without available NK-cell measurements, relapse risk was further explored in this subgroup.
In univariable Fine–Gray analyses, time from diagnosis to UCBT, high R-DRI, and low 1-month NK-cell count were significantly associated with relapse (Table 3). These variables were subsequently entered into the multivariable Fine–Gray model. The association of duration from diagnosis to UCBT with relapse was attenuated after multivariable adjustment and was not retained as an independent predictor in the final model. High R-DRI and low 1-month NK-cell count remained independently associated with relapse (Table 4). High R-DRI was associated with a high subdistribution hazard of relapse (sHR, 4.561; 95% CI, 1.662–12.51; P = 0.003), as was low 1-month NK-cell count (< 0.165 × 10⁹/L; sHR, 6.175; 95% CI, 1.711–22.280; P = 0.005). To address concerns regarding post hoc dichotomization of 1-month NK-cell count, sensitivity analyses were performed treating NK-cell count as a continuous predictor in multivariable Fine–Gray models adjusted for R-DRI. On the original scale, a higher 1-month NK-cell count remained associated with a lower subdistribution hazard of relapse (β = −6.56, SE = 3.116; sHR, 0.001; 95% CI, 0.000003–0.634; P = 0.035), although interpretation of the effect size on the original scale was limited by the unit of measurement. To improve interpretability, NK count was additionally modeled on a log2 scale. Each doubling of 1-month NK-cell count was associated with a significantly lower relapse risk (β = −0.529, SE = 0.178; sHR, 0.589; 95% CI, 0.416–0.835; P = 0.003), consistent with the primary dichotomized analysis.
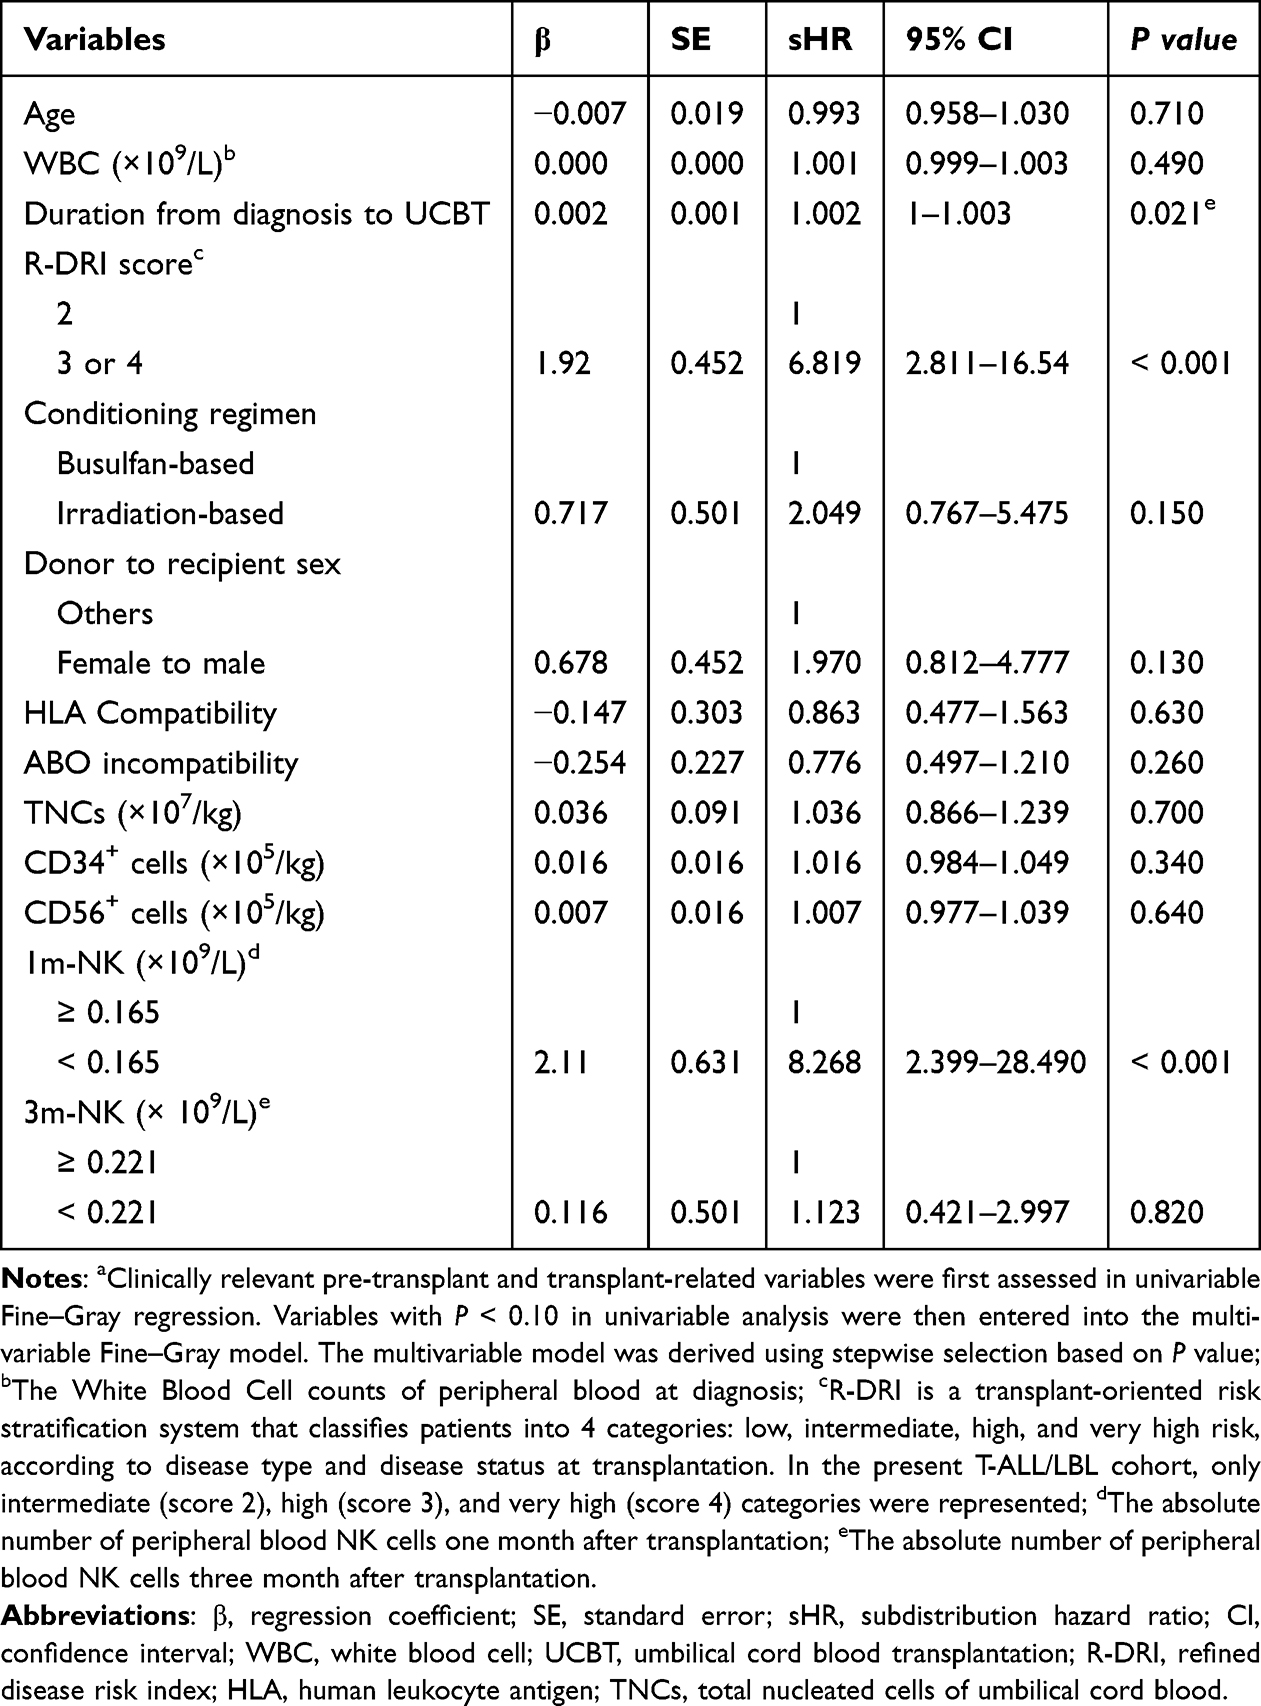 |
Table 3 Univariable Analysis of the Factors Associated with Relapse (n=58)a |
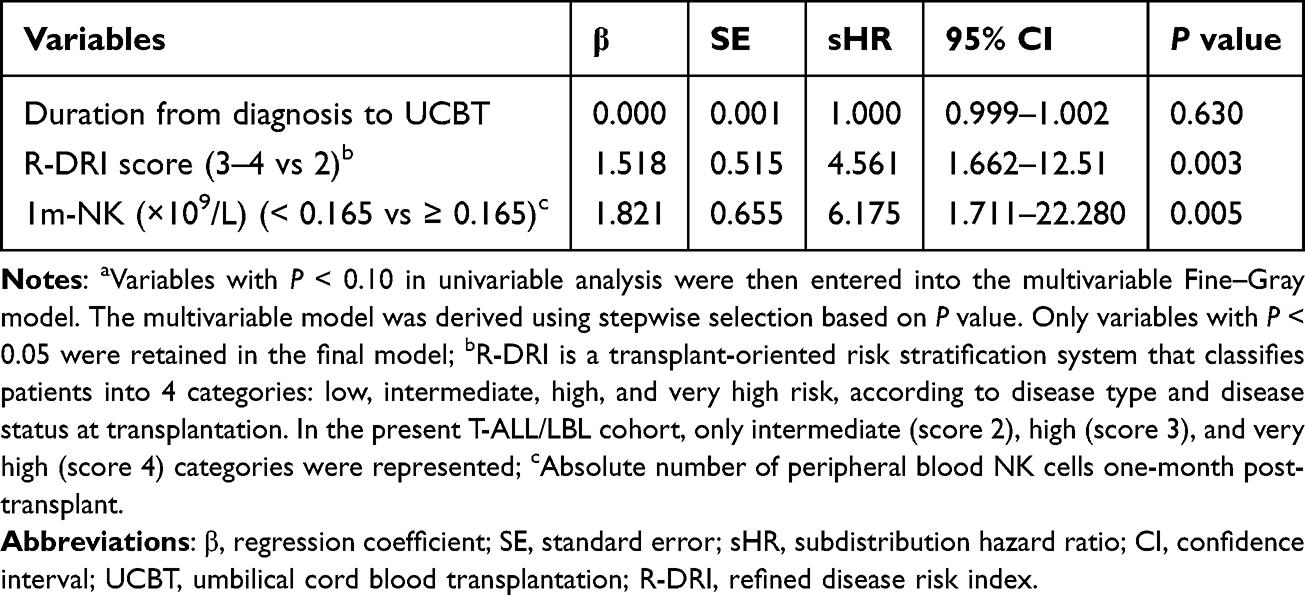 |
Table 4 Multivariable Analysis of the Factors Associated with Relapse (n = 58)a |
Development and Performance of the Relapse Risk Score
Based on the final multivariable Fine–Gray model, a simplified relapse risk score was constructed using the 2 independent predictors: high R-DRI and low 1-month NK-cell count. Regression coefficients were derived as the natural logarithm of the subdistribution hazard ratios, yielding β values of approximately 1.52 for high R-DRI and 1.82 for low 1-month NK-cell count. After scaling each coefficient relative to the smaller β value and rounding to the nearest whole number, 1 point was assigned to each predictor. For example, a patient with high R-DRI (score 3 or 4) and a 1-month NK-cell count <0.165 × 10⁹/L would receive 2 points and be classified as high risk, whereas a patient with neither risk factor would receive 0 points and be classified as low risk; patients with one risk factor would be classified as intermediate risk.
The total score therefore ranged from 0 to 2, defining low-risk (0 points; n = 22), intermediate-risk (1 point; n = 23), and high-risk (2 points; n = 13) groups. The cumulative incidence of relapse at 1 year was 0 in the low-risk group, 34.8% (95% CI, 14.7–54.8%) in the intermediate-risk group, and 61.5% (95% CI, 33.3–89.8%) in the high-risk group. At 2 years, the corresponding estimates increased to 0, 43.5% (95% CI, 23.3–62.1%), and 89.7% (95% CI, 48.6–98.4%), respectively. At 3 years, which was the primary time point of interest, these estimates remained stable at 0, 43.5% (95% CI, 23.3–62.1%), and 89.7% (95% CI, 48.6–98.4%) (Figure 4). These findings provide clinically interpretable absolute risks of relapse for each risk category. Over 3 years, relapse events occurred in 0, 10, and 11 patients in the low-, intermediate-, and high-risk groups, respectively, indicating apparent risk stratification within the development cohort.
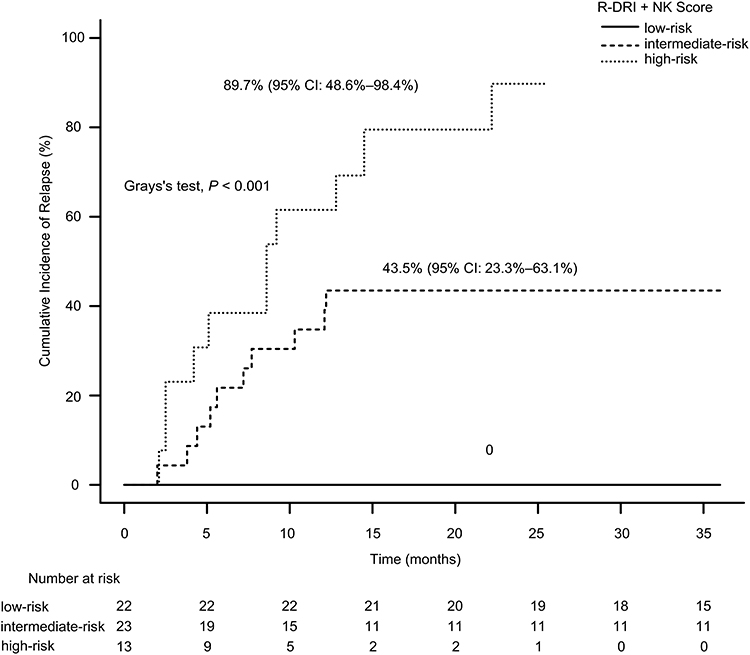 |
Figure 4 Cumulative incidence of relapse according to the composite relapse risk score derived from R-DRI and 1-month peripheral blood NK-cell count in the NK-measured subgroup (n = 58). Patients were stratified into low-risk (score 0; n = 22, relapse events = 0), intermediate-risk (score 1; n = 23, relapse events = 10), and high-risk (score 2; n = 13, relapse events = 11) groups. The 3-year cumulative incidence of relapse was 0% in the low-risk group, 43.5% (95% CI, 23.3–62.1%) in the intermediate-risk group, and 89.7% (95% CI, 48.6–98.4%) in the high-risk group (Gray’s test, P < 0.001). Pairwise comparisons analysis showed the high-risk group had a significantly higher subdistribution hazard of relapse than the intermediate-risk group (sHR, 2.67; 95% CI, 1.20–5.93; P = 0.016). Comparisons involving the low-risk group were not estimated because no relapse events occurred in that group. Numbers at risk are shown below the x-axis. Abbreviation: CI, confidence interval. |
Pairwise Fine–Gray analyses were consistent with the overall risk stratification. The high-risk group had a significantly higher subdistribution hazard of relapse than the intermediate-risk group (sHR, 2.67; 95% CI, 1.20–5.93; P = 0.016). Comparisons involving the low-risk group were not estimable because no relapse events occurred in that group.
Model performance was further evaluated at 3 years in the 58-patient development cohort. The apparent 3-year time-dependent AUC of the Fine–Gray model was 0.539 (95% CI, 0.255–0.823), and the apparent 3-year Brier score was 0.154. The optimism-corrected Brier score was 0.158. Calibration analysis showed approximate agreement between predicted and observed relapse risk in the lower predicted-risk range, whereas observed relapse risk tended to exceed predicted risk in the intermediate-to-higher predicted-risk range, suggesting that relapse risk was underestimated in these patients (Supplementary Figure S7). Bootstrap internal validation with 500 resamples showed a mean optimism of 0.015 for the 3-year AUC, yielding an optimism-corrected AUC of 0.523. The apparent calibration slope was 2.273, and the optimism-corrected calibration slope was 0.775, suggesting some degree of overfitting.
Discussion
This retrospective study evaluated transplant outcomes in patients with T-ALL/LBL undergoing first single-unit UCBT. Three main findings emerged. First, relapse remained the leading cause of treatment failure after UCBT. Second, in the subgroup of 58 patients with available 1-month NK-cell counts, high R-DRI and low peripheral blood NK-cell count at one month were associated with relapse. Third, a simplified score integrating these 2 variables showed apparent risk stratification in the development cohort. Collectively, these findings suggest that relapse risk after UCBT in T-ALL/LBL may be related to pre-transplant disease risk and early post-transplant immune reconstitution.
T-ALL/LBL is an aggressive malignancy of immature T-cell precursors characterized by rapid progression, high tumor burden, and early relapse risk.21,22 In our cohort, the 3-year CIR was 34.5%, consistent with previous reports from different transplant platforms (approximately 20–50%).6,23–25 These observations highlight the clinical importance of identifying patients at increased risk of relapse after transplant. Relapse after allogeneic transplantation is increasingly understood not only as a manifestation of adverse leukemia biology, but also as a consequence of inadequate post-transplant immune control.26
NK cells are among the earliest lymphocyte subsets to recover after UCBT, with early differences detectable by approximately day 28–30.27 NK-cell count, as a component of immune reconstitution, has been reported to be associated with transplantation outcomes.12,13,28,29 Our previous work in acute myeloid leukemia likewise suggested that both NK-cell quantity and functional integrity are associated with protection against relapse.30 However, the mechanisms underlying NK-cell roles may differ between myeloid and T-lineage malignancies. Against those backgrounds, we focused further analyses on the subgroup with available early NK-cell measurements. Consistent with this biological rationale, low 1-month NK-cell count (< 0.165 × 10⁹/L) remained independently associated with relapse in multivariable Fine–Gray analysis (sHR, 6.175; 95% CI, 1.711–22.280; P = 0.005). This association was not solely dependent on dichotomization, as sensitivity analyses treating 1-month NK-cell count as a continuous variable showed a consistent direction of effect, and in the log2-transformed model, each doubling of NK-cell count remained associated with a significantly lower subdistribution hazard of relapse. Together, these findings suggest that early NK recovery may reflect a broader gradient of post-transplant immune competence rather than merely an arbitrary cutoff effect.
By contrast, 3-month NK-cell count was not associated with relapse in our cohort. This may reflect both biological and methodological factors. Biologically, 1-month NK-cell recovery likely captures the earliest phase of immune reconstitution after UCBT, when NK cells are among the first lymphocyte subsets to recover and may contribute most directly to early graft-versus-leukemia effects. Moreover, NK-cell counts at 3 months may be more strongly influenced by post-transplant events and treatments, including infections, CMV reactivation, GVHD, corticosteroid exposure, and ongoing immunosuppression, thereby reducing their specificity as a marker of relapse risk. Methodologically, fewer patients had available 3-month NK-cell measurements than 1-month measurements, which may also have limited statistical power.
Relapse risk after transplantation, however, is unlikely to depend on immune reconstitution alone. It is also shaped by disease-related risk before transplantation. R-DRI offers a transplant-oriented summary of pre-transplant disease-risk heterogeneity.10,11 Although the present study was restricted to T-ALL/LBL, patients were still not homogeneous with respect to disease status at transplantation and also pre-transplant disease risk, which means R-DRI still retained prognostic relevance in this cohort. Indeed, high R-DRI remained associated with relapse in multivariable analysis (sHR, 4.561; 95% CI, 1.662–12.51; P = 0.003), suggesting that relapse risk after UCBT is shaped not only by early immune reconstitution but also by disease risk before transplantation.
By contrast, the association between duration from diagnosis to UCBT and relapse was attenuated after multivariable adjustment and was not retained as an independent predictor in the final model. This finding suggests that the diagnosis-to-transplant interval may function more as a surrogate for pre-transplant treatment course and disease status than as an independent determinant of post-transplant relapse. In clinical practice, a longer interval to transplantation may reflect prolonged chemotherapy exposure, relapse requiring re-induction therapy, suboptimal disease control, or delays in proceeding to transplant, all of which may overlap with the broader disease-risk information captured by R-DRI.
Based on these 2 independent factors, we constructed a simple 2-point relapse risk score. Because both R-DRI and 1-month NK-cell count are readily available in routine practice, this score may provide a preliminary framework for exploratory post-transplant risk stratification. At the same time, its performance should be interpreted cautiously. Although the score separated low-, intermediate-, and high-risk groups within the development cohort, the apparent 3-year AUC was only 0.539 and the optimism-corrected AUC was 0.523. Calibration was acceptable in the lower predicted-risk range but suggested underestimation of relapse risk in the intermediate- to high-risk range, while the optimism-corrected calibration slope of 0.775 indicated some degree of overfitting.
Established prognostic approaches such as the European Group for Blood and Marrow Transplantation (EBMT) risk score and MRD-based stratification have demonstrated clinical relevance in predicting post-transplant outcomes.7,31 The EBMT risk score integrates patient- and transplant-related factors, while MRD-based strategies primarily reflect pre-transplant disease burden and treatment response. In contrast, the present model combines pre-transplant disease risk, as captured by R-DRI, with early post-transplant immune reconstitution reflected by 1-month NK-cell recovery. This integrated approach may provide complementary prognostic information by incorporating both disease-related and immune-related determinants of relapse. However, absolute NK-cell count is only a crude surrogate of NK-cell recovery and does not capture functional heterogeneity. In particular, CD56bright and CD56dim NK-cell subsets differ in maturation state and cytotoxic potential, and Killer Immunoglobulin-Like Receptor (KIR)-ligand interactions may also influence the graft-versus-leukemia effect after cord blood transplantation. Moreover, emerging markers of NK-cell dysfunction or exhaustion, such as NKG2A and TIGIT, were not assessed in the present study. Therefore, future studies incorporating NK-cell subsets or functional parameters may further refine risk stratification.
Several limitations merit consideration. First, this was a retrospective single-center study with a 10-year enrollment period and no external validation. Therefore, its generalizability to other populations, centers, and transplant platforms remains uncertain. Second, although the overall cohort included 105 patients, only 58 patients had available 1-month NK-cell data, restricting all NK-related analyses to this subgroup and raising concerns about potential selection bias due to informative missingness. Therefore, the relapse model should be interpreted as applicable primarily to patients with available 1-month NK-cell measurements, and may not be generalizable to all UCBT recipients. Third, the 1-month NK-cell cutoff was data-driven, which introduces potential limitations related to the threshold selection. While sensitivity analyses using NK-cell count as continuous and log2-transformed variables showed consistent results, the cutoff remains exploratory. Fourth, the effective sample size for model development was limited (58 patients with 21 relapse events; EPV ≈ 10.5), and the use of stepwise selection increased the risk of model instability, overfitting, and inflated coefficients despite bootstrap internal validation. Fifth, although calibration assessment and optimism-corrected performance estimates were performed, the apparent and optimism-corrected AUC values remained modest, and the wide confidence interval for the NK-cell effect indicates limited precision. In addition, we did not perform multiple imputation for missing NK-cell data, and the absence of a significant association between missingness and relapse does not exclude informative missingness. Although regression coefficients used for score construction were reported, the baseline subdistribution hazard and full prediction equation were not provided. Accordingly, this model should be regarded as exploratory. The simplified 3-tier score may sacrifice some granularity compared with continuous risk prediction. The proportional-hazards assumption was not formally tested. While R-DRI and 1-month NK-cell count were analyzed as fixed predictors, their effects over time remain uncertain. Additionally, the impact of transplant-related factors, such as conditioning regimen, GVHD prophylaxis, and post-transplant interventions, on NK-cell recovery was not assessed. From a methodological perspective, and consistent with TRIPOD and PROBAST principles, it should not be considered ready for routine clinical use without further validation in larger independent cohorts.
Conclusion
In summary, the relapse rate remains high in T-ALL/LBL patients undergoing UCBT. In the subgroup with available early NK-cell measurements, high R-DRI and low 1-month NK-cell count were associated with relapse and allowed apparent risk stratification in the development cohort. Further validation in larger independent cohorts is needed before this simple 2-factor score can be considered for broader clinical use. More importantly, the value of this study is the incorporation of early post-transplant immune recovery into relapse assessment.
Data Sharing Statement
The datasets generated during and/or analyzed during the current study are available from the corresponding author on reasonable request.
Ethics Approval
This study was approved by the Ethics Committee of the First Affiliated Hospital of the University of Science and Technology of China (approval number: 2025-RE-232). Given the retrospective design and use of anonymized data, the requirement for additional study-specific informed consent was waived by the Ethics Committee.
Consent to Participate
All patients or their legal guardians had previously provided written informed consent for transplantation and for the future use of de-identified clinical data for research purposes, in accordance with institutional policies and the Declaration of Helsinki.
Consent to Publish
All authors provided consent for publication.
Author Contributions
X.Z. and N.Z. designed the study and revised the manuscript. N.Z., K.S., and R.C. collected the clinical data. N.Z., Y.W., B.Y., and D.W. analysed the data. N.Z. drafted the manuscript. K.S., B.T., and X.Z. treated the patients. All authors made a significant contribution to the work reported, whether in the conception, study design, execution, acquisition of data, analysis and interpretation, or in all these areas; took part in drafting, revising or critically reviewing the article; gave final approval of the version to be published; agreed on the journal to which the article has been submitted; and agreed to be accountable for all aspects of the work. N.Z., K.S., and R.C. contributed equally to this work.
Funding
This work was supported by the National Natural Science Foundation of China (grants # U23A20453, 82270223, 82170209, 82500227, and 82370217), Anhui Provincial Department of Education Scientific Research Project (grants # 2023AH010079), Anhui Provincial Natural Science Foundation (grants # 2308085J09), USTC Research Funds of the Double First-Class Initiative (grants # YD9110002047), International Cooperation Projects in Anhui Province (grants # 2023h11020005), the Anhui Provincial Department of Education Scientific Research Project (grants # 2022AH030128).
Disclosure
The authors declare no competing interests.
References
1. Shah B, Mattison RJ, Abboud R, et al. Acute lymphoblastic leukemia, version 2.2024, NCCN clinical practice guidelines in oncology. J Natl Compr Canc Netw. 2024;22(8):563–16. doi:10.6004/jnccn.2024.0051
2. Burkhardt B, Hermiston ML. Lymphoblastic lymphoma in children and adolescents: review of current challenges and future opportunities. Br J Haematol. 2019;185(6):1158–1170. doi:10.1111/bjh.15793
3. Pölönen P, Mullighan CG, Teachey DT. Classification and risk stratification in T-lineage acute lymphoblastic leukemia. Blood. 2025;145(14):1464–1474. doi:10.1182/blood.2023022920
4. Zhu H, Dong B, Zhang Y, et al. Integrated genomic analyses identify high-risk factors and actionable targets in T-cell acute lymphoblastic leukemia. Blood Sci. 2022;4(1):16–28. doi:10.1097/BS9.0000000000000102
5. Hu X, Wang Z, Qin Y, et al. Allogeneic haematopoietic stem cell transplantation might overcome the poor prognosis of adolescents and adult patients with T-lineage acute lymphoblastic leukaemia and CDKN2 deletion. Bone Marrow Transplant. 2024;59(8):1146–1153. doi:10.1038/s41409-024-02306-2
6. Brammer JE, Saliba RM, Jorgensen JL, et al. Multi-center analysis of the effect of T-cell acute lymphoblastic leukemia subtype and minimal residual disease on allogeneic stem cell transplantation outcomes. Bone Marrow Transplant. 2017;52(1):20–27. doi:10.1038/bmt.2016.194
7. Huo W, Gao L, Song K, et al. Allogeneic haematopoietic stem cell transplantation for adult T-lymphoblastic lymphoma: a real-world multicentre analysis in China. Br J Haematol. 2024;204(6):2390–2399. doi:10.1111/bjh.19481
8. Zhu X, Tang B, Sun Z. Umbilical cord blood transplantation: still growing and improving. Stem Cells Transl Med. 2021;10:S62–S74. doi:10.1002/sctm.20-0495
9. Kanda J, Morishima Y, Terakura S, et al. Impact of graft-versus-host disease on outcomes after unrelated cord blood transplantation. Leukemia. 2017;31(3):663–668. doi:10.1038/leu.2016.288
10. Armand P, Gibson CJ, Cutler C, et al. A disease risk index for patients undergoing allogeneic stem cell transplantation. Blood. 2012;120(4):905–913. doi:10.1182/blood-2012-03-418202
11. Armand P, Kim HT, Logan BR, et al. Validation and refinement of the Disease Risk Index for allogeneic stem cell transplantation. Blood. 2014;123(23):3664–3671. doi:10.1182/blood-2014-01-552984
12. Minculescu L, Marquart HV, Friis LS, et al. Early natural killer cell reconstitution predicts overall survival in T cell-replete allogeneic hematopoietic stem cell transplantation. Biol Blood Marrow Transplant. 2016;22(12):2187–2193. doi:10.1016/j.bbmt.2016.09.006
13. Mushtaq MU, Shahzad M, Shah AY, et al. Impact of natural killer cells on outcomes after allogeneic hematopoietic stem cell transplantation: a systematic review and meta-analysis. Front Immunol. 2022;13:1005031. doi:10.3389/fimmu.2022.1005031
14. Wu Y, Sun G, Cheng Y, et al. The clinical influence of complete remission with incomplete Count Recovery (CRi) on single-unit unrelated cord blood transplantation in patients with acute leukemia. Transplant Cell Ther. 2024;30(10):1029.e1–1029.e10. doi:10.1016/j.jtct.2024.08.004
15. Sun G, Tang B, Wan X, et al. Chimeric antigen receptor T cell therapy followed by unrelated cord blood transplantation for the treatment of relapsed/refractory B cell acute lymphoblastic leukemia in children and young adults: superior survival but relatively high post-transplantation relapse. Transplant Cell Ther. 2022;28(2):71.e1–71.e8. doi:10.1016/j.jtct.2021.11.011
16. Fujiwara S, Hattori N, Matsui T, et al. Refined disease risk index for hematological malignancies, including rare disorders, after allogeneic stem cell transplantation. Transplant Proc. 2019;51(10):3437–3443. doi:10.1016/j.transproceed.2019.08.044
17. Cheson BD, Fisher RI, Barrington SF, et al. Recommendations for initial evaluation, staging, and response assessment of Hodgkin and non-Hodgkin lymphoma: the Lugano classification. J Clin Oncol. 2014;32(27):3059–3068. doi:10.1200/JCO.2013.54.8800
18. Schoemans HM, Lee SJ, Ferrara JL, et al. EBMT-NIH-CIBMTR Task Force position statement on standardized terminology & guidance for graft-versus-host disease assessment. Bone Marrow Transplant. 2018;53(11):1401–1415. doi:10.1038/s41409-018-0204-7
19. Jagasia MH, Greinix HT, Arora M, et al. National institutes of health consensus development project on criteria for clinical trials in chronic graft-versus-host disease: I. The 2014 Diagnosis and Staging Working Group report. Biol Blood Marrow Transplant. 2015;21(3):389–401.e1. doi:10.1016/j.bbmt.2014.12.001
20. Russo A, Oliveira G, Berglund S, et al. NK cell recovery after haploidentical HSCT with posttransplant cyclophosphamide: dynamics and clinical implications. Blood. 2018;131(2):247–262. doi:10.1182/blood-2017-05-780668
21. Raetz EA, Rebora P, Conter V, et al. Outcome for children and young adults with T-Cell ALL and induction failure in contemporary trials. J Clin Oncol. 2023;41(32):5025–5034. doi:10.1200/JCO.23.00088
22. Mo XD, Tang BL, Zhang XH, et al. Comparison of outcomes after umbilical cord blood and unmanipulated haploidentical hematopoietic stem cell transplantation in children with high-risk acute lymphoblastic leukemia. Int J Cancer. 2016;139(9):2106–2115. doi:10.1002/ijc.30249
23. El Cheikh J, Ngoya M, Galimard JE, et al. Prognostic factors impacting post-transplant outcomes in adult T-cell acute lymphoblastic leukemia: a registry-based study by the EBMT acute leukemia working party. Bone Marrow Transplant. 2024;59(9):1239–1246. doi:10.1038/s41409-024-02300-8
24. Yu F, Niu J, Yang J, et al. Optimal timing and impact of allogeneic peripheral blood stem cell transplantation in adult T-cell lymphoblastic lymphoma: insights from a large cohort multi-center real-world study in Shanghai. Bone Marrow Transplant. 2025;60(3):380–388. doi:10.1038/s41409-024-02500-2
25. Cahu X, Labopin M, Giebel S, et al. Impact of conditioning with TBI in adult patients with T-cell ALL who receive a myeloablative allogeneic stem cell transplantation: a report from the acute leukemia working party of EBMT. Bone Marrow Transplant. 2016;51(3):351–357. doi:10.1038/bmt.2015.278
26. Zeiser R, Vago L. Mechanisms of immune escape after allogeneic hematopoietic cell transplantation. Blood. 2019;133(12):1290–1297. doi:10.1182/blood-2018-10-846824
27. Bejanyan N, Brunstein CG, Cao Q, et al. Delayed immune reconstitution after allogeneic transplantation increases the risks of mortality and chronic GVHD. Blood Adv. 2018;2(8):909–922. doi:10.1182/bloodadvances.2017014464
28. Zhou Z, Liu X, Zhang X, et al. Impact of early natural killer cell reconstitution on the outcomes of T cell-replete allogeneic hematopoietic stem cell transplantation. J Inflamm Res. 2023;16:2993–3008. doi:10.2147/JIR.S416708
29. Guo H, Xu ZL, Pei XY, et al. HLA haploidentical HSCT: from immune imbalance to a platform for immune homeostasis restoration. Immun Inflamm. 2025;1:12. doi:10.1007/s44466-025-00008-y
30. Wang D, Sun Z, Zhu X, et al. GARP-mediated active TGF-β1 induces bone marrow NK cell dysfunction in AML patients with early relapse post-allo-HSCT. Blood. 2022;140(26):2788–2804. doi:10.1182/blood.2022015474
31. Zhu X, Huang L, Zheng C, et al. European Group for Blood and Marrow Transplantation risk score predicts the outcome of patients with acute leukemia receiving single umbilical cord blood transplantation. Biol Blood Marrow Transplant. 2017;23(12):2118–2126. doi:10.1016/j.bbmt.2017.08.011
 © 2026 The Author(s). This work is published and licensed by Dove Medical Press Limited. The
full terms of this license are available at https://www.dovepress.com/terms
and incorporate the Creative Commons Attribution
- Non Commercial (unported, 4.0) License.
By accessing the work you hereby accept the Terms. Non-commercial uses of the work are permitted
without any further permission from Dove Medical Press Limited, provided the work is properly
attributed. For permission for commercial use of this work, please see paragraphs 4.2 and 5 of our Terms.
© 2026 The Author(s). This work is published and licensed by Dove Medical Press Limited. The
full terms of this license are available at https://www.dovepress.com/terms
and incorporate the Creative Commons Attribution
- Non Commercial (unported, 4.0) License.
By accessing the work you hereby accept the Terms. Non-commercial uses of the work are permitted
without any further permission from Dove Medical Press Limited, provided the work is properly
attributed. For permission for commercial use of this work, please see paragraphs 4.2 and 5 of our Terms.