Back to Journals » Journal of Multidisciplinary Healthcare » Volume 16
A Retrospective Cohort Study: Predicting 90-Day Mortality for ICU Trauma Patients with a Machine Learning Algorithm Using XGBoost Using MIMIC-III Database
Authors Yang S, Cao L, Zhou Y, Hu C ![]()
Received 8 June 2023
Accepted for publication 29 August 2023
Published 6 September 2023 Volume 2023:16 Pages 2625—2640
DOI https://doi.org/10.2147/JMDH.S416943
Checked for plagiarism Yes
Review by Single anonymous peer review
Peer reviewer comments 3
Editor who approved publication: Dr Scott Fraser
Shan Yang,1 Lirui Cao,2 Yongfang Zhou,3 Chenggong Hu1
1Department of Critical Care Medicine, West China Hospital of Sichuan University, Chengdu, Sichuan, 610041, People’s Republic of China; 2West China Hospital of Sichuan University, Chengdu, Sichuan, 610041, People’s Republic of China; 3Department of Respiratory Care, West China Hospital of Sichuan University, Chengdu, Sichuan, 610041, People’s Republic of China
Correspondence: Chenggong Hu; Yongfang Zhou, Email [email protected]; [email protected]
Objective: The aim of this study was to develop and validate a machine learning-based predictive model that predicts 90-day mortality in ICU trauma patients.
Methods: Data of patients with severe trauma were extracted from the Medical Information Mart for Intensive Care III (MIMIC-III) database. The performances of mortality prediction models generated using nine machine learning extreme gradient boosting (XGBoost), logistic regression, random forest, AdaBoost, multilayer perceptron (MLP) neural networks, support vector machine (SVM), light gradient boosting machine (GBM), k nearest neighbors (KNN) and gaussian naive bayes (GNB). The performance of the model was evaluated in terms of discrimination, calibration and clinical application.
Results: We found that the accuracy, sensitivity, specificity, PPV, NPV and F1 score of our proposed XGBoost model were 82.8%, 79.7%, 77.6%, 51.2%, 91.5% and 0.624, respectively. Among the nine models, the XGBoost model performed best. Compared with traditional logistic regression, the calibration curves of the XGBoost model and decision curve analysis (DCA) performed well.
Conclusion: Our study shows that the XGBoost model outperforms other machine learning models in predicting 90-day mortality in trauma patients. It can be used to assist clinicians in the early identification of mortality risk factors and early intervention to reduce mortality.
Keywords: MIMIC-III, severe trauma patient, intensive care unit, XGBoost, mortality, prediction model
Introduction
Trauma is a major cause of death in the United States, a worldwide public health issue with serious economic burdens, and an important cause of life expectancy loss.1,2 It has been reported that trauma is the main cause of death in the first forty years of life. Trauma causes 4.4 million deaths annually, accounting for almost 8% of global deaths.3,4 Patients with severe trauma usually require admission to the ICU, and trauma is a common disease in the ICU, with variable morbidity and mortality rates.5 For the assessment of trauma prognosis, several methods for assessing the severity of injury have been developed over the past decades. Common scoring systems include the Injury Severity Scale (ISS), Revised Trauma Score (RTS), and Trauma and Injury Severity Score (TRISS).6 Cook et al compared the Trauma Audit and Research Network (TARN) with the Trauma Mortality Prediction Mode (TMPM). TMPM should be considered a measure of injury severity.7
The above scores and models provide clinical importance, but these methods and scores require the assumption of independent and linear relationships between explanatory. The above scores and models and various modifications are evidence-based tools, and some research findings suggest that they may mislead doctors by misclassifying patients’ conditions. However, when there are collinearity, heteroscedasticity, high-order interactions, and nonlinear relationships between variables, the performance of these two types of models is poor.8,9 Therefore, more valuable and accurate prognostic tools that are not limited to these assumptions are needed to achieve better patient outcomes and maximize resource utilization. The new machine learning technology performs better prediction than traditional prediction methods. Modern ICUs are rich in data through continuous patient monitoring. Advances in computer technology and the establishment of specialized databases such as MIMIC have helped more doctors recognize and focus on machine learning, and machine learning methods are gaining acceptance, providing opportunities for data science and machine learning.10,11 In addition, machine learning can determine the combination of reliable prediction results by observing patients and automatically calculating important variables and empirical patterns based on a large number of variables.12
Machine learning (ML) “learns” models from past data to predict future data.13 Learning is one of the key processes in artificial intelligence. ML for predicting and extracting information from data is increasingly being applied in many different fields, from medicine to finance.14 Due to these algorithms, we can analyze the increasing amount of biological data generated by next-generation sequencing technology, infer the pathogenicity of genomic mutations or cell types,15 identify therapeutic targets, and design new therapeutic compounds. ML can also be used to extract information from EHR data to predict patients’ diagnosis, post hospitalization risk, or heart failure, and can also support the analysis of emerging diseases, such as the severity of results during COVID-19 infection.16 Many different statistical, probabilistic, and optimization techniques can be implemented as learning methods, such as logistic regression, artificial neural networks (ANN), K-nearest neighbors (KNN), etc. In this study, XGBoost, logistic regression, random forest, AdaBoost, multilayer perceptron neural networks (MLP), support vector machine (SVM), Light GBM, KNN, and Gaussian Naive Bayes (GNB) machine learning models were used to establish the model. MLP, a neural network (NN) model and other related algorithms used to predict the actual weight of pigs at different stages, which is a ML classification technique based on feedforward neural networks (FFNN), which consists of ordered layers similar to human neural processing.17 It consists of many neurons that act as processing components and are arranged in a fully connected stack order. As succinctly defined by Laudani et al, the internal architecture framework of FFNN is constructed in such a way that continuous neural layers and interconnections are created using the following guidelines: neurons in each layer are connected to all (and only) neurons in the next layer.18 In several studies, it is an effective tool in predicting biological activities in vivo.19 SVM learning is one of many ML methods. Compared with other ML methods, SVM is very powerful in identifying subtle patterns in complex datasets. SVM can be used for handwriting recognition, fraudulent credit card recognition, speaker recognition, and facial detection. SVM is a powerful method for building a classifier.20 It aims to create a decision boundary between two classes that enables the prediction of labels from one or more feature vectors. The application of support vector machine learning in cancer genomics is a popular and successful undertaking.21 The KNN method is an instance-based learning method that stores all available data points (instances) and classifies new data points based on similarity measures. The basic idea of the KNN method is to assign new unclassified examples to the classes to which most of its K nearest neighbors belong. The kNN classifier classifies unlabeled observations by assigning them to the most similar labeled instances. Collect observed features for training and testing datasets.22 When the number of samples in the training dataset is large, this algorithm has been proven to be very effective in reducing misclassification errors. Another advantage of the KNN method compared to many other supervised learning methods such as SVM, decision trees, neural networks, etc. is that it can easily handle problems with class sizes 3 or larger. Extreme gradient enhancement (XGBoost) is a machine learning technique that can efficiently and flexibly process missing data and assemble weak prediction models.23 XGBoost is widely recognized and highly praised in multiple data mining and prediction models.24–27 Therefore, the purpose of our study was two: first, we attempted to compare the performance of the machine learning XGBoost model with eight other commonly used machine learning models in predicting 90-day mortality in MIMIC-III database trauma patients. Second, we compared the characteristics and efficacy of the traditional logistic regression model and the XGBoost model, obtained clinical features based on the XGBoost model, and explained them according to their importance. XGBoost, logistic regression, random forest, AdaBoost, MLP, GNB, SVM, KNN, and LightGBM models were established by using the training set. The area under the curve (AUC), sensitivity, specificity, positive predictive value, negative predictive value, F1 score, and decision curve analysis (DCA) curve of each model were compared to evaluate and compare the performance of the models. The optimal model was compared with logistic regression in the validation set and test set. Determine the importance of risk factors based on the best model and explain the model.
Materials and Methods
Sources of Data
Our study is based on a retrospective cohort study of a critical care database, Medical Information Mart for Intensive Care III (MIMIC-III, Version 1.4). MIMIC-III is a publicly available single-center intensive care database approved by the Institutional Review Committee of Beth Israel Deaconess Medical Center (BIDMC, Boston, MA, USA) and Massachusetts Institute of Technology (MIT, Cambridge, MA, US), which includes information on 46,520 patients admitted to various ICUs of BIDMC in Boston, Massachusetts from 2001 to 2012.28,29 The patient dataset contains both static features (age, gender, etc.) and dynamic features (heart rate, blood pressure, etc.) and is suitable for the study of time-varying processes in trauma patients. This database includes demographic, vital signs, laboratory tests, fluid balance, and life state chart events; Document International Classification of Diseases and Ninth Revision (ICD-9) Code; Records the physiological data of the bedside monitor verified by ICU nurses per hour; And store written evaluations of radiology films by experts during the corresponding period. To establish a predictive model of mortality in ICU trauma patients, data from the MIMIC-III database were divided into a training set and an internal validation set.
One author obtained the qualification (Approval Code 48718265) to use the database after completing and passing the online course, and he was responsible for data extraction. Patient-related information in the database was anonymous, and personal informed consent was waived in this study. The study was reported according to the recommendations of the Transparent Reporting of a multivariable prediction model for Individual Prognosis or Diagnosis (TRIPOD) statement.30
Study Population
In MIMIC-III, patients were diagnosed with trauma in the ICU. The inclusion criteria were patients aged between 18 and 89 years, who chose the first hospitalization for analysis when admitted to the hospital or ICU multiple times. The exclusion criteria were as follows: (1) no trauma diagnosis within 24 years after admission to the ICU, (2) length of ICU stay less than 1 day, and (3) lack of age or gender information. This study was reviewed and approved by the ethics committee of our institution.
Data Collection and Variable Extraction
The structure query language (SQL) with code in MIMIC Code Repository was used for extracting the raw data. R software (version 3.6.3) was used for processing the data.31 All variables included basic characteristics (age, sex, ethnicity, and admission type), comorbidities (congestive heart failure, hypertension, chronic pulmonary disease, renal failure, liver disease, rheumatoid arthritis, obesity, diabetes, and anemia), laboratory tests (anion gap, bicarbonate, creatinine, chloride, glucose, hematocrit, hemoglobin, platelet, potassium, prothrombin time, activated partial thromboplastin time, international normalized ratio, sodium, blood urea nitrogen, white blood cell counts, red blood cell counts, calcium, mean corpuscular volume, red cell distribution width, and vital signs (heart rate, respiratory rate, body temperature, pulse oxygen saturation, diastolic pressure, systolic pressure, and mean arterial pressure). The Glasgow Coma Scale (GCS) score, SOFA score, and SAPS II score were evaluated within the first 24 h after ICU admission. Comorbidity was assessed according to recorded International Classification of Diseases (ICD)-9 and ICD-10 codes,32 and the Charlson comorbidity index was calculated.33 Variables were reported as the average value within 24 h admission to the ICU.
Data Analysis
A total of 5556 adult trauma patients in the MIMIC-III database, 3754 investigators met our inclusion criteria, with 645 deaths and 3100 patients surviving within 90 days. Patients were divided into two groups based on whether they died or survived within 90 days and variables were displayed and compared between groups. Continuous variables of the study were nonnormally distributed and reported as medians along with interquartile ranges (IQRs). Categorical variables are presented as numbers and percentages. Comparisons between groups were made using the Kruskal–Wallis test or Mann–Whitney U-test for continuous variables and chi-square or Fisher’s exact tests for categorical variables.
In the model construction stage, first, the traditional logistic regression model is carried out with significant variables determined by backward stepwise analysis with the chi-square test. Then we chose an entry probability of < 0.01 by the stepwise selection method. Second, MIMIC-III data were divided into two sets: 80% as the training set and 20% as the internal validation set. Models based on common ML classifiers including XGBoost, logistic regression (LR), random forest, AdaBoost, multilayer perceptron neural networks (MLP), SVM, Light GBM, k nearest neighbors (KNN), and Gaussian naive Bayes (GNB) models, were used to establish a 90-day death prediction model for ICU trauma patients. Receiver operating characteristic (ROC) curves were used to compare the prediction efficiency of these models. To further elucidate the performance of the model, calibration plotting and DCA were performed. The sensitivity, specificity, positive predictive value (PPV), negative predictive value (NPV), and F1 score of each model were calculated to evaluate the value of the model. The model with the best performance was selected for comparison with the traditional logistic regression, and then the model with the highest overall diagnostic value was selected for further verification. In addition, the recursive feature elimination (RFE) algorithm based on Shapley Additive explanations (Shap) values was used to identify key features, making the model more suitable for clinical practice. All statistical analyses were conducted using Python (version 3.9.0, Python Software Foundation, www.python.org) and R software (The R software environment is available for download from [https://www.r-project.org/]). A two-tailed test was performed, and P < 0.05 was considered to reflect statistical significance.
Results
Baseline Characteristics
A total of 5556 adult trauma patients in the MIMIC-III database, 3754 investigators met our inclusion criteria (Figure 1), with 645 deaths and 3100 patients surviving within 90 days. Table 1 summarizes the comparison of baseline characteristics, vital signs, and laboratory parameters between the nonsurvivors and the survivors within 90 days. The median length of ICU stay of survivors was 2.64 days [1.66, 5.31] and that of nonsurvivors was 3.77 days [2.0, 7.89] (p<0.001). The nonsurvivors were older and had higher SAPS II and SOFA scores. Among the dead patients, age, sex, ethnicity, congestive heart failure, hypertension, chronic pulmonary, renal failure, diabetes, and anemia, RBC mean, MCV mean, RDW mean, BNU mean, sodium mean, PT mean, INR mean, APTT mean, platelet mean, hemoglobin mean, hematocrit mean, glucose mean, creatinine mean, bicarbonate mean, anion gap mean, BT mean, Respirate mean, Mean bp mean, Dias bp mean, Sys bp mean, SAPS II, SOFA, Elixhauser scores, GCS, MV group, and ICU stay showed significant differences between the two groups. (p<0.05). The median age for survivors was 54 while 77 for nonsurvivors. The male gender account for 2% of 65.645% in the survivor group while 58.605% in the nonsurvivor group. A total of 8.387% survivors presented with congestive heart failure while 22.791% nonsurvivors presented with congestive heart failure. A total of 3.742% survivors presented with hypertension while 10.233% nonsurvivors presented with congestive heart failure. A total of 10.355% survivors presented with chronic pulmonary obstructive disease while 16.279% nonsurvivors presented with chronic pulmonary obstructive disease. A total of 4.419% survivors presented with renal failure while 13.023% nonsurvivors presented with renal failure. A total of 13.484% survivors presented with diabetes while 20.93% nonsurvivors presented with diabetes. A total of 11.065% survivors presented with diabetes while 17.209% nonsurvivors presented with diabetes. The median RBC for survivors was 4.09 while 3.84 for nonsurvivors. The median RDW for survivors was 14.62 while 16.1 for nonsurvivors. The median BNU for survivors was 20.67 while 31.0 for nonsurvivors. The median value of sodium mean for survivors was 141.0 while 142.5 for nonsurvivors. The median value of PT mean for survivors was 14.4 while 15.5 for nonsurvivors. The median value of INR mean for survivors was 1.3 while 1.44 for nonsurvivors. The median value of APTT mean for survivors was 31.03 while 36.2 for nonsurvivors. The median value of platelet mean for survivors was 246.0 while 243.0 for nonsurvivors. The median value of hemoglobin mean for survivors was 12.6 while 11.6 for nonsurvivors. The median value of hematocrit mean for survivors was 36.3 while 34.25 for nonsurvivors. The median value of glucose mean for survivors was 36.3 while 34.25 for nonsurvivors. The median value of chloride mean for survivors was 152.0 while 171.0 for nonsurvivors. The median value of creatinine mean for survivors was 1.0 while 1.4 for nonsurvivors. The median value of bicarbonate mean for survivors was 26.0 while 25.0 for nonsurvivors. The median value of anion gap mean for survivors was 15.0 while 16.4 for nonsurvivors. The median value of BT mean for survivors was 37.45 while 37.39 for nonsurvivors. The median value of RESP mean for survivors was 19.85 while 21.56 for nonsurvivors. The median value of BP mean for survivors was 87.85 while 86.23 for nonsurvivors. The median value of Dias BP mean for survivors was 69.89 while 67.31 for nonsurvivors. The median value of Sys BP mean for survivors was 134.0 while 132.47 for nonsurvivors. The median value of SAPSII for survivors was 134.0 while 132.47 for nonsurvivors. The median value of SOFA for survivors was 134.0 while 132.47 for nonsurvivors. The median value of GCS for survivors was 134.0 while 132.47 for nonsurvivors. The median value of ICU stay for survivors was 5.31 while 7.89 for nonsurvivors. However, admission type, liver disease, rheumatoid arthritis, obesity, calcium mean, WBC mean, potassium mean, chloride mean, SpO2 mean, heart rate mean, and hospital stay showed no statistical significance between the two groups.
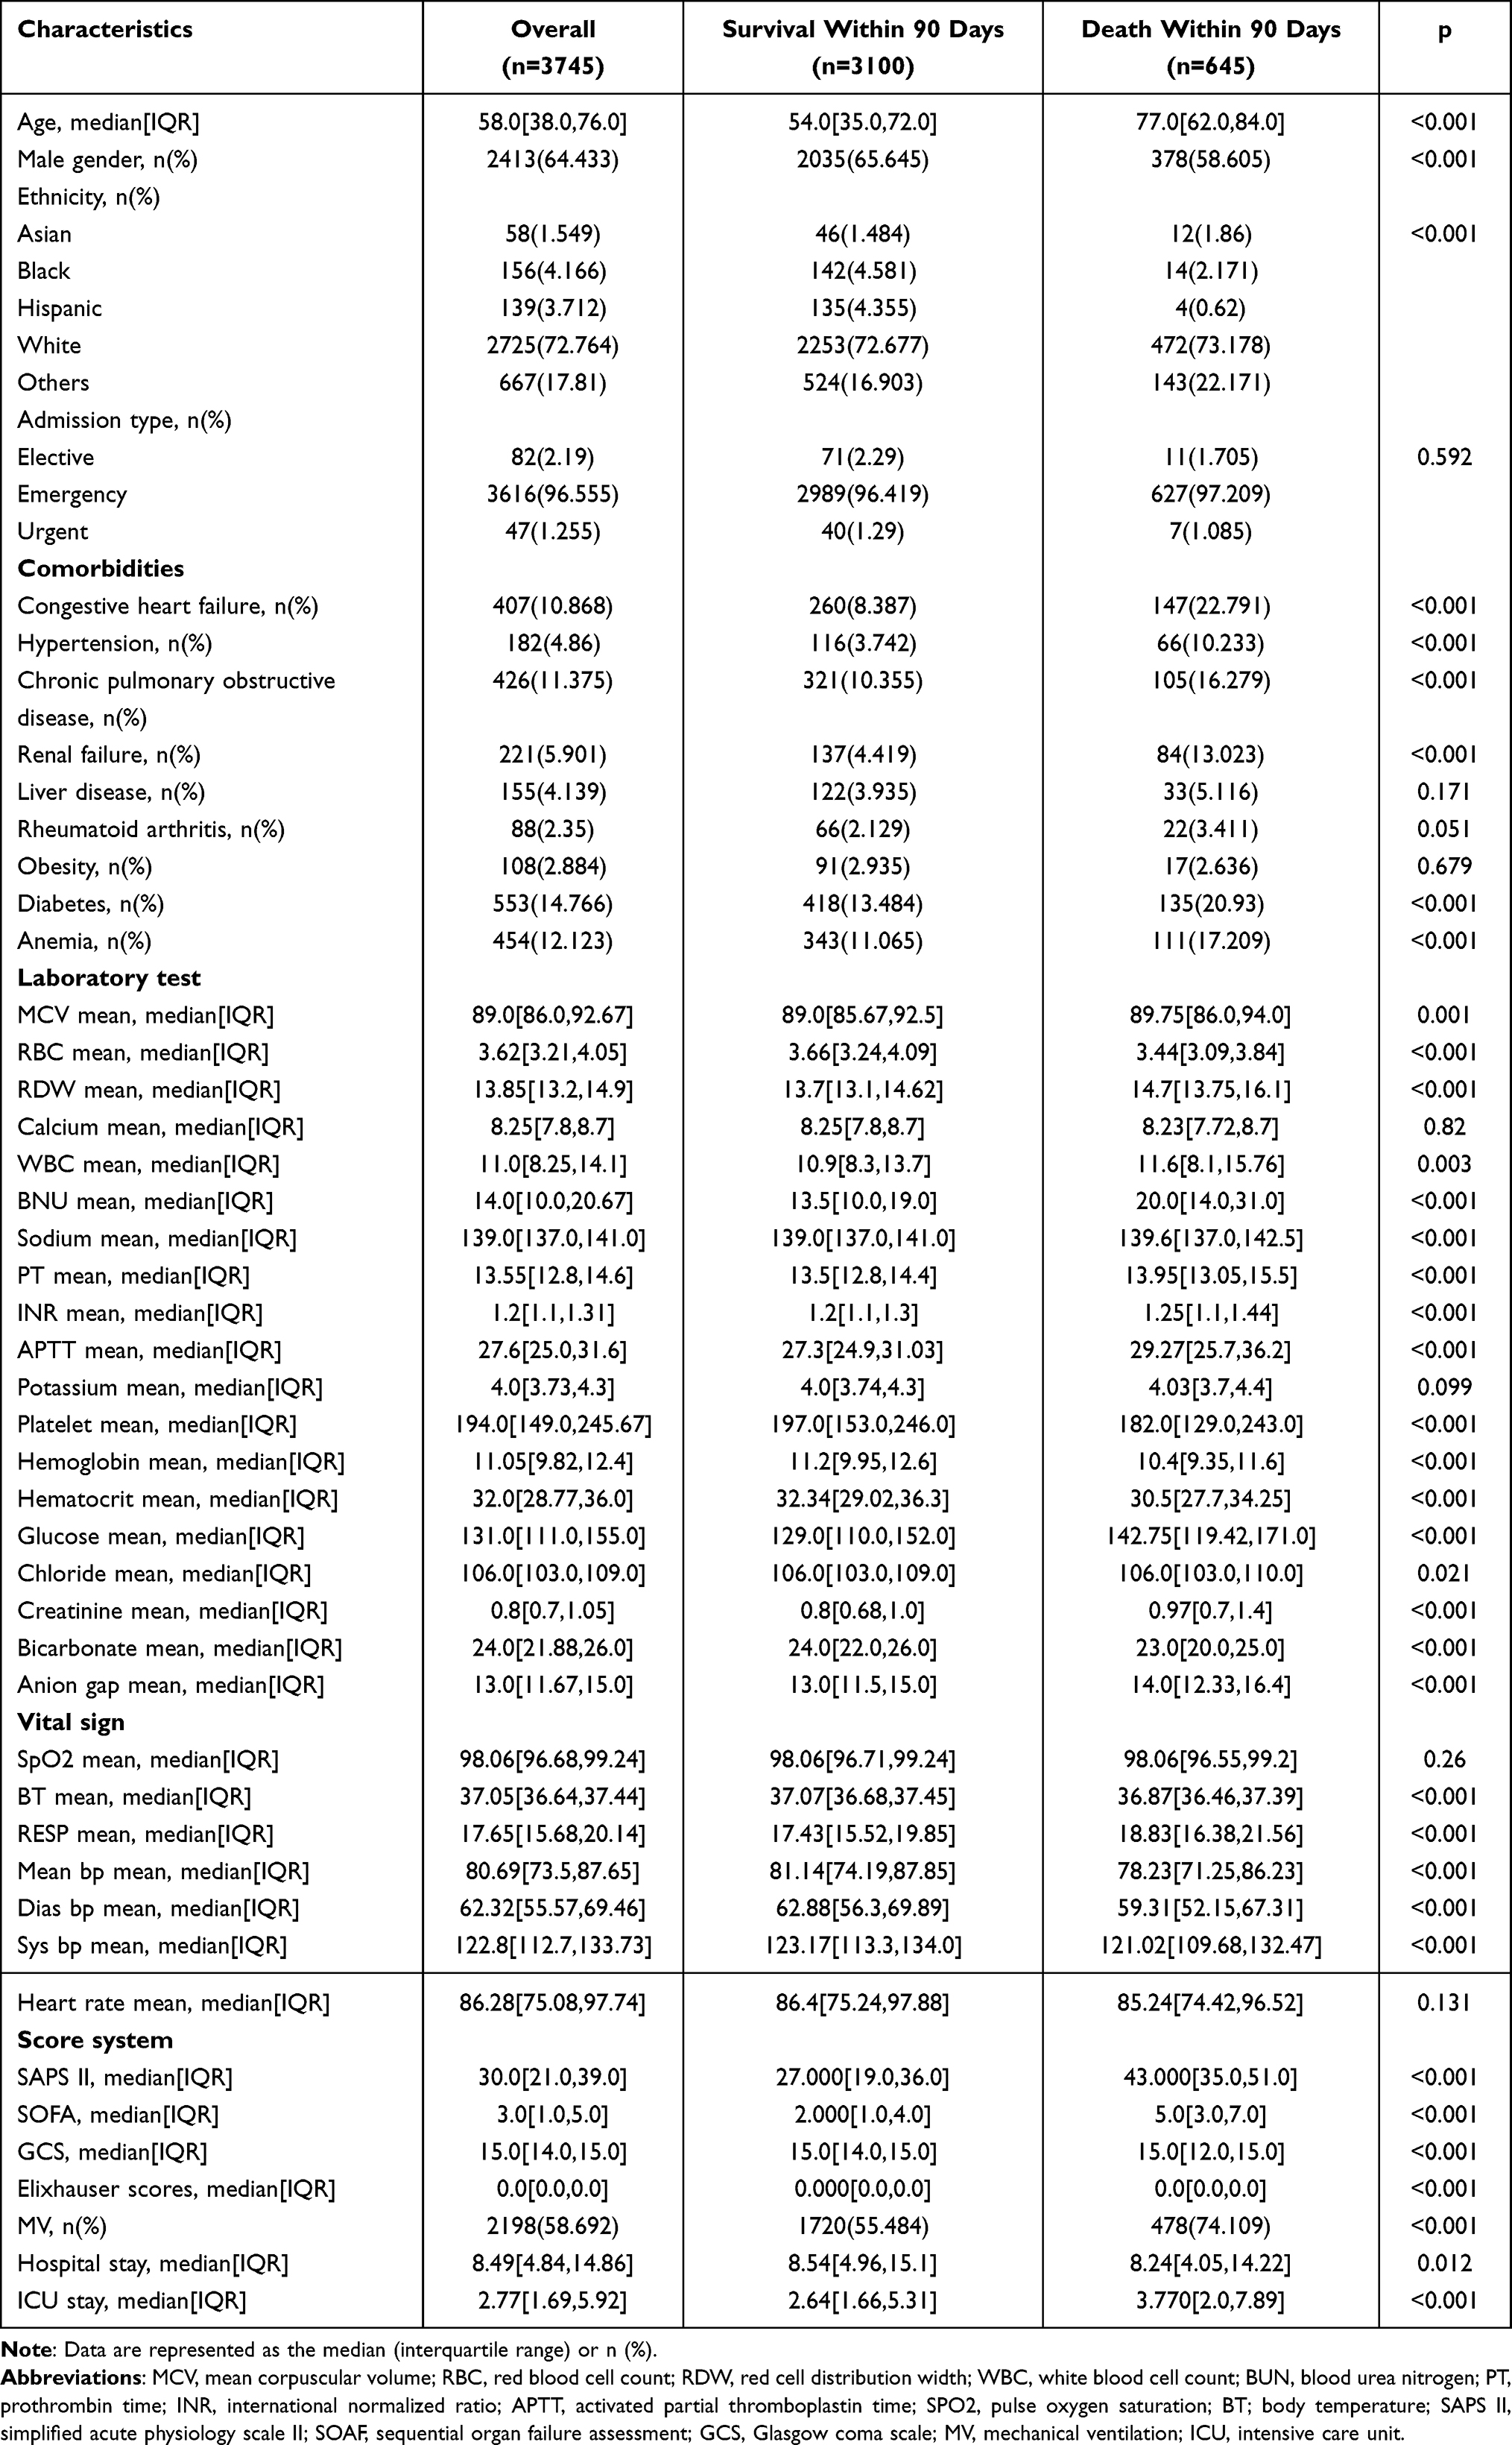 |
Table 1 Baseline Clinical Characteristics of Mimic-III Patients with Trauma Between Survivors and Nonsurvivors at 90 Days |
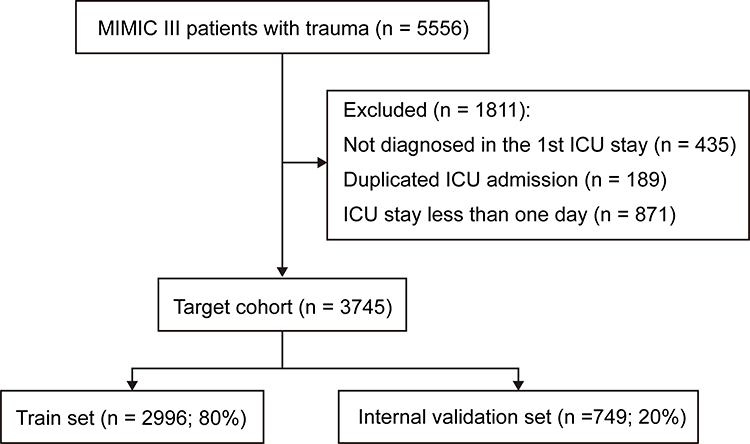 |
Figure 1 The flow chart of data extraction. Abbreviations: MIMIC-III, Medical Information Mart for Intensive Care-III; ICU, intensive care unit. |
Model Comparison
The XGBoost, logistic regression, random forest, AdaBoost, MLP, GNB, SVM, KNN, and LightGBM models were established with the training set; the AUCs of the testing set were 1.00, 0.858, 1.00, 0.884, 0.808, 0.809, 0.422, 0.898 and 0.722, respectively (Figure 2a). AUROC is one of the most used metrics and shows sensitivity against-specificity. AUROC was used in this study to measure the performance of the model. The AUCs of the validation set were 0.857, 0.807, 0.856, 0.857, 0.783, 0.781, 0.412, 0.722 and 0.707, respectively (Figure 2b). Other criteria included sensitivity, specificity, PPV, NPV, and F1-score (Table 2). Evaluate the sensitivity, specificity, sensitivity specificity gap, area under the subject working characteristic curve (AUC), positive predictive value (PPV), negative predictive value (NPV), and Matthews correlation coefficient (MCC) of the model. The sensitivity specificity gap is the linear distance between these two values and explains how far the model is from perfect predictive ability. Among all these models, the XGBoost model has the highest AUROC and accuracy in the training set. In addition, XGBoost’s accuracy in the internal validation set of the MIMIC-III database is second only to that of random forests. Therefore, the XGBoost algorithm was selected as the best model.
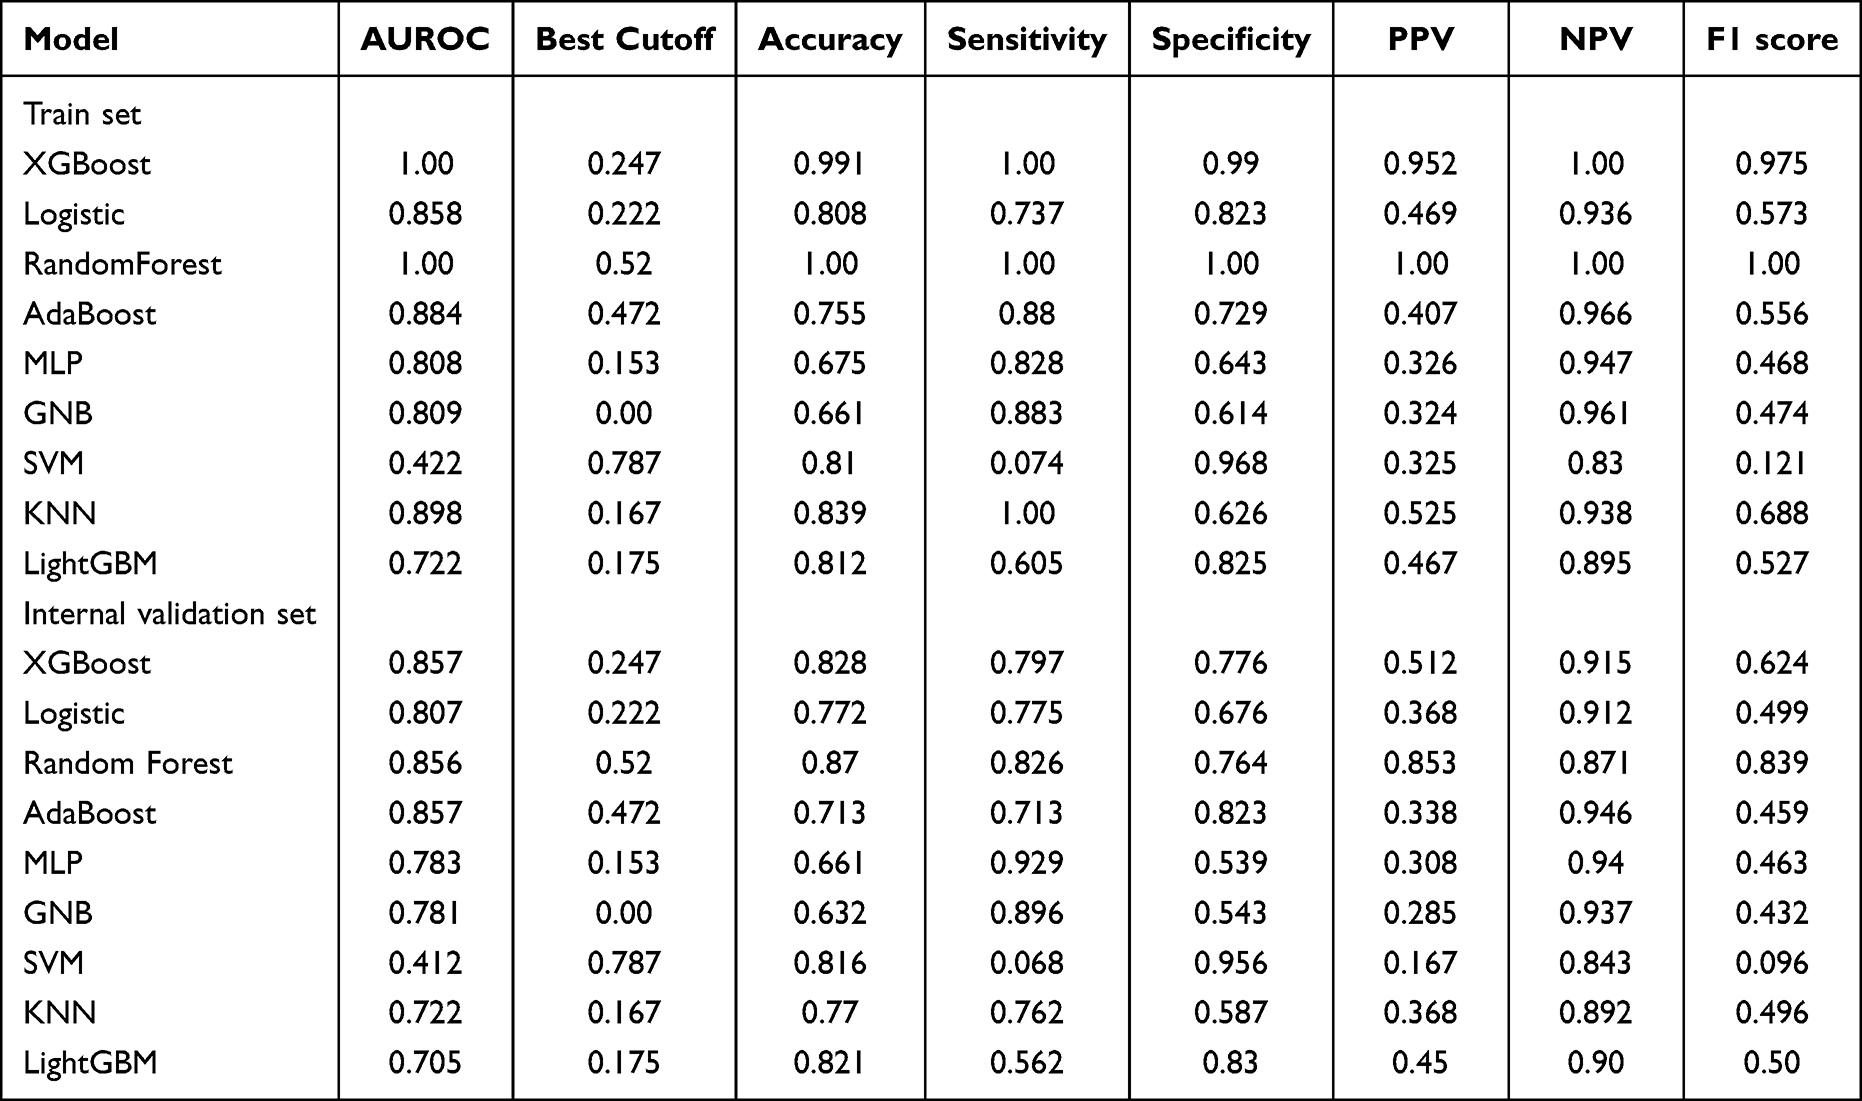 |
Table 2 Model Performance in the Training and Validation Sets |
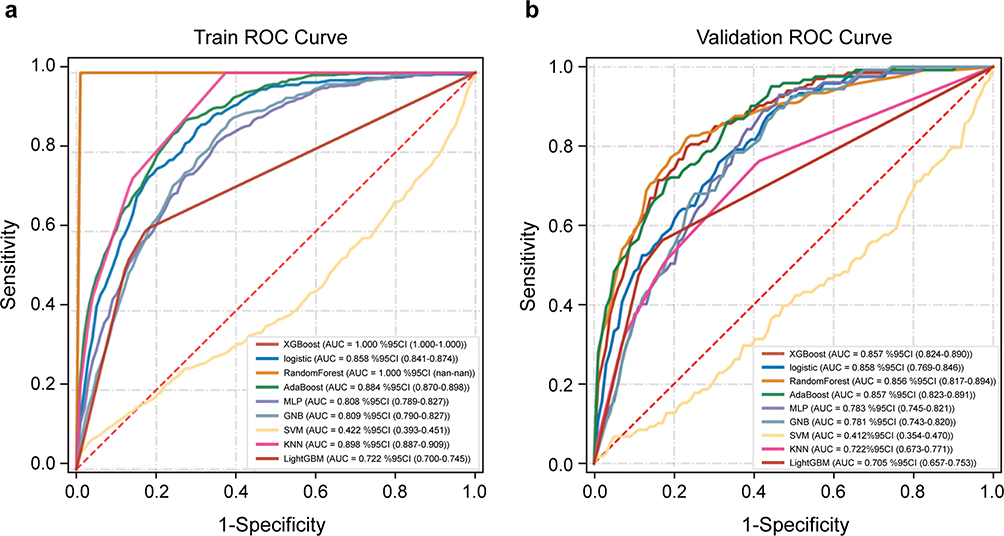 |
Figure 2 Receiver operating characteristic curves (ROCs) of the XGBoost, logistic regression, random forest, AdaBoost, MLP, GNB, SVM, KNN and LightGBM models. (a) Training sets. (b) Validation sets. |
Features Selected in Models
The dataset consists of static and dynamic variables. The commonly used method for processing dynamic patient data is to extract features based on the entire duration of the patient’s hospitalization. In this analysis, we performed a different method of dividing the evolution of the original patient’s vital signs into multiple subsequences with fixed step sizes and window lengths. This method implicitly assumes that short-term patient history is more important for patient outcomes than long-term patient history. The XGBoost model and logistic regression included the most important features (Table 3 and Table 4), which were determined by the results of reverse stepwise regression analysis and were strongly correlated with 90-day mortality, P<0.05. The 10 most important variables in the XGBoost model were age, RDW mean, sodium mean, glucose mean, respiration mean, SAPS II, Elixhauser scores, MV group, hospital interval, and ICU interval. Red blood cell distribution width (RDW) has been used to predict mortality during infection and inflammatory diseases. SAPS II as well as Elixhauser scores have been proposed to be effective tools for patient evaluation. Meanwhile, the mean value of glucose level and respiration rate have also been shown to correlate with the condition of the patient.34,35 In this study, these selected features were highly associated with the survival of patients.
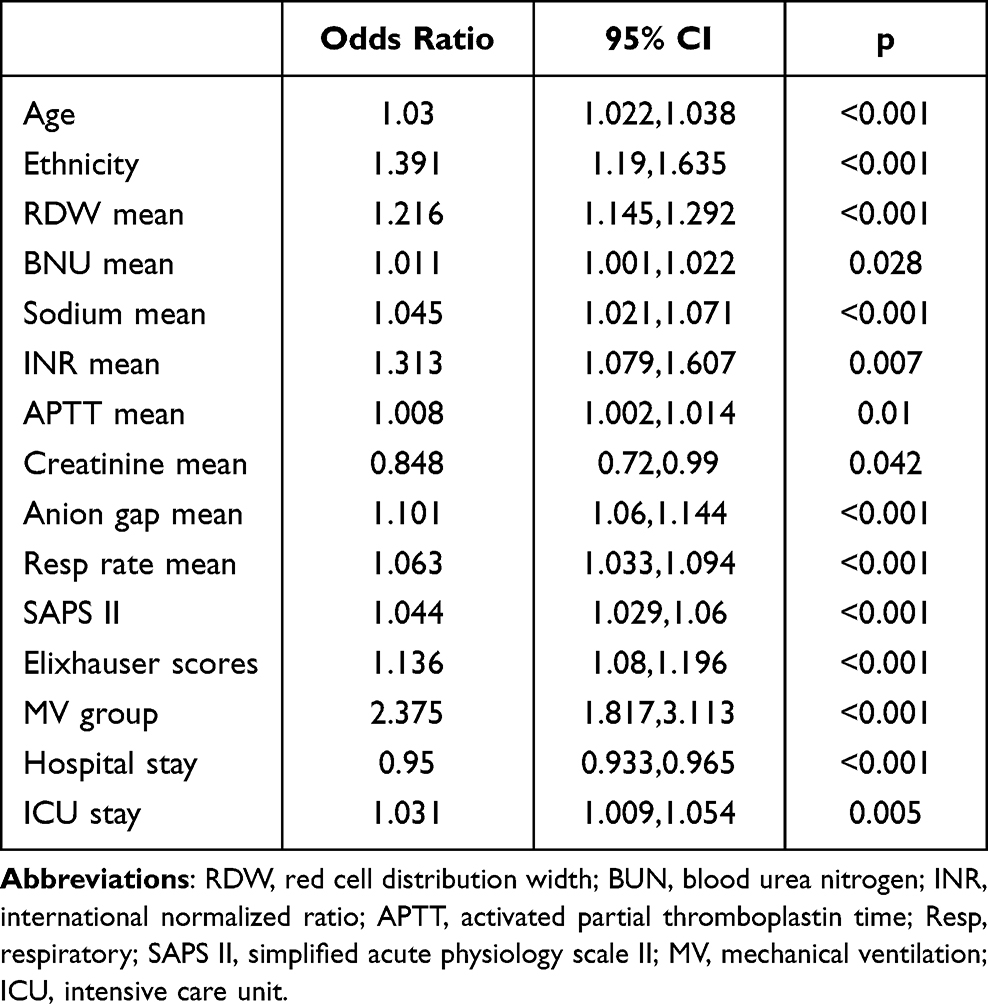 |
Table 3 Features Selected in the Conventional Logistic Regression |
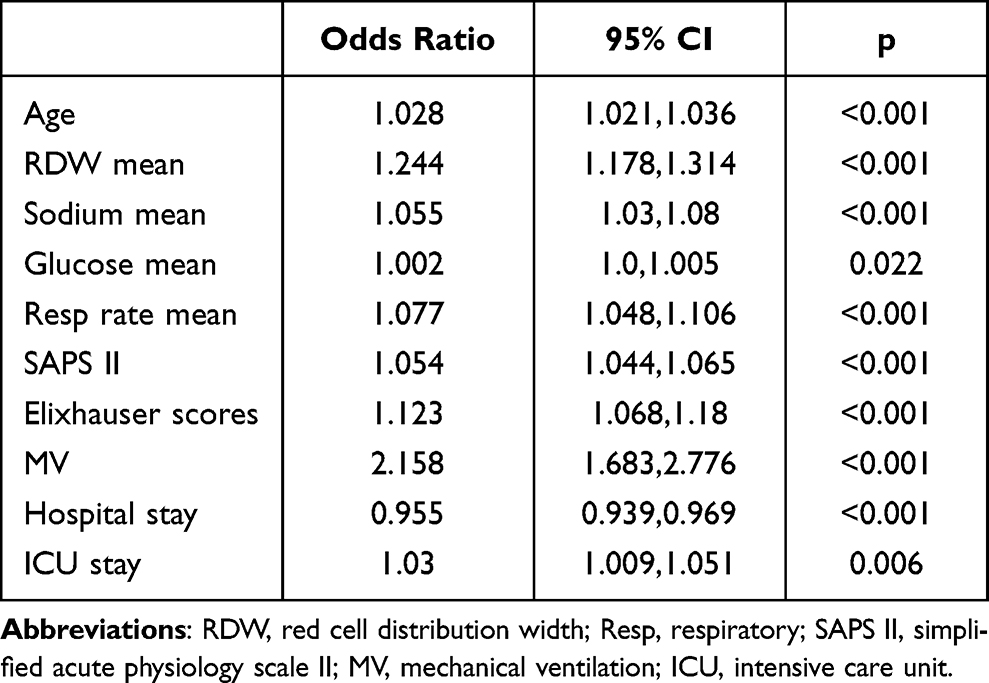 |
Table 4 Features Selected in the XGboost Model |
Model Evaluation and Validation
The calibration curve is used to determine the degree of consistency between the predicted probability and the observed results. R2 quantifies the goodness of fit of the model, with R2=1 indicating that the regression line fully fits the data. Among the machine learning models, the XGBoost model performs best. To further clarify the performance of the XGBoost model, calibration plots (Figure 3a) and DCA (Figure 3b)36 were conducted. For simplicity, only XGBoost and logistic regression results are demonstrated. The XGBoost calibration curves performed well, and the XGBoost model had a greater net benefit in DCA than the logistic regression model. At the same time, we compared the ROC curve (Figure 4a and b) and learning curve (Figure 4c) of XGBoost in the test set and verification set. Other criteria included sensitivity, specificity, PPV, NPV and F1-score (Table 5). The XGBoost model performed well in terms of the AUROC, sensitivity and specificity in the two sets.
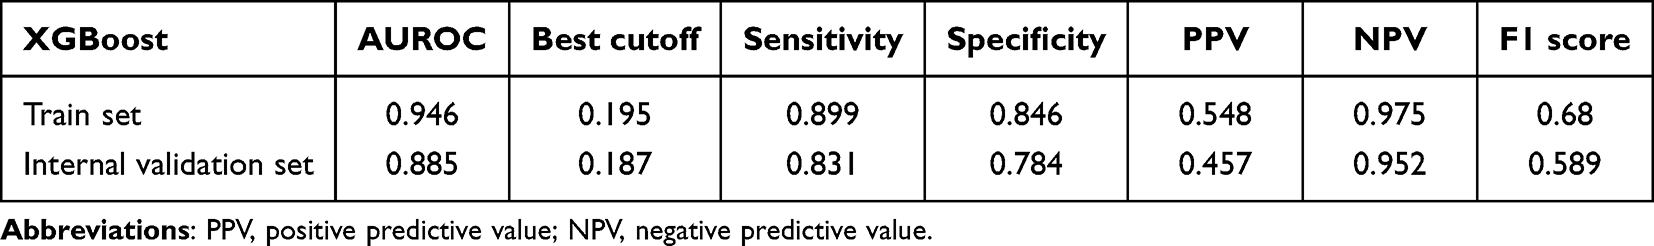 |
Table 5 XGBoost Model Performance in the Training and Validation Sets |
 |
Figure 3 (a) Calibration plots and (b) decision curve analysis (DCA) of the XGBoost model and conventional logistic regression prediction models. The XGBoost calibration curves performed well, and the XGBoost model had a greater net benefit in DCA than the logistic regression model. |
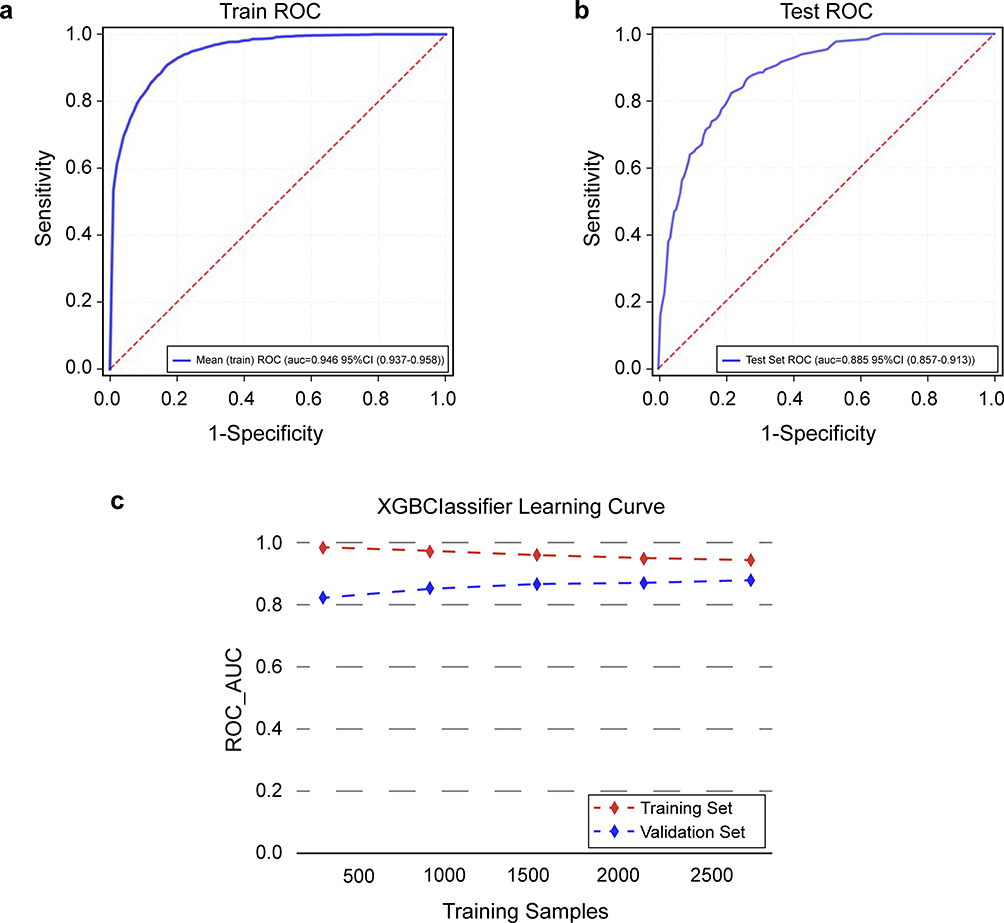 |
Figure 4 Model evaluation and validation in the training and validation sets. Receiver operating characteristic curves (ROCs) of XGBoost. (a) Training sets. (b) Test sets. (c) Learning curve. |
Model Interpretation
There is a new interpretation model in ML, called the SHapley Additive exPlanations (SHAP), was first articulated by Lundberg and Lee to explain individual predictions for both kernel-based approaches and tree-based models.37 We use the SHAP value of XGBoost to calculate feature importance, which has the greatest discriminative ability in the validation queue. The Shap values in Figure 5 are evaluated in an internal validation set, outlining the impact of the feature on the final model. Figure 5 provides an overview of the (positive or negative) impact of factors on the XGBoost model. We found that hospital interval, SAPS II and age were the three major risk factors. In addition, Figure 6 illustrates the predicted results for three specific instances. The red and blue bars represent risk factors and protective factors, respectively. Longer lines indicate that the eigenvalues are more important. In the example in Figure 6a, the patient’s condition is moderate, and our model predicts a lower risk than the base value. In the example in Figure 6b, the model predicts a value of risk slightly higher than the base value. In the example shown in Figure 6c, the predicted risk value of the model is significantly higher than the base value, and the largest influence value is RESP mean, SAPS II and age.
 |
Figure 5 Feature importance estimated using the Shapley Additive explanations (SHAP) values. The plot sorts features by the sum of SHAP value magnitudes over all samples. The color represents the feature value (red high, blue low). The x-axis measures the impact on the model output (right positive, left negative). Taking the feature SAPS II as an example, red points are on the right, whereas blue points are on the left. This means prediction scores will be smaller when patients have a lower SAPS II score. Abbreviations: SAPS II, simplified acute physiology scale II; RDW, red cell distribution width; MV, mechanical ventilation. |
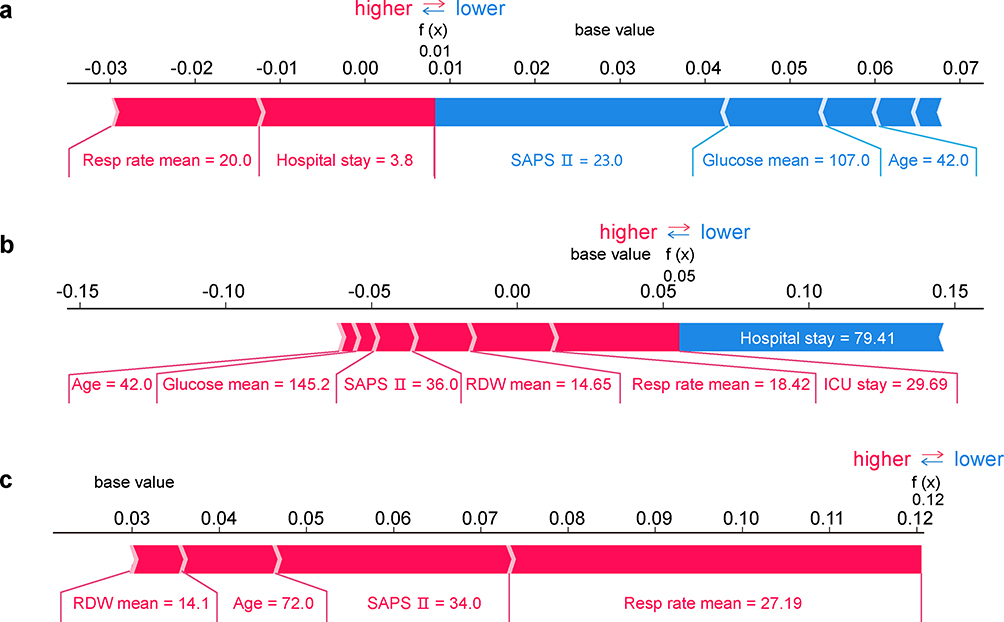 |
Figure 6 The predicted results for three specific instances. The red and blue bars represent risk factors and protective factors, respectively. Longer lines indicate that the eigenvalues are more important. This figure shows the explanation for a low-risk instance (a), a medium-risk instance (b) and a high-risk instance (c). Abbreviations: SAPS II, simplified acute physiology scale II; RDW, red cell distribution width. |
Discussion
In our study, a 90-day mortality prediction model for trauma patients in the ICU was established based on nine machine learning algorithms. A total of 3745 patients are included in MIMIC-III in the final cohort, in which, 645 patients died after 90 days, and 3100 survived. Of the nine models, the XGBoost model has the best predictive performance in the test set and the validation set. Compared with traditional logistic regression, the calibration curves of the XGBoost model and DCA performed well. Using XGBoost as the main model, 10 characteristics were found to be closely associated with 90-day mortality in trauma patients. We found that hospital stay, SAPS II and age were significant influencing factors. In addition, ICU stay, RDW mean, respiratory rate mean, glucose mean, sodium mean, MV and elixhauser score were closely related to the prediction model. The XGBoost prediction model shows good performance and provides an accurate tool for predicting the 90-day mortality of trauma patients in the ICU. The Shapley Additive Interpretation (SHAP) value illustrates the predicted results, which makes our model clinically interpretable.
This study shows that the importance of the SAPS II score in the model is second only to hospital stay (Figure 5). A. ULVIK et al found that SAPS II was a predictor of 30-day mortality in ICU trauma patients. SAPS II was a stronger predictor than SOFA score and ISS in both univariate and multivariate analyses.38 Our XGBoost model includes RDW, which is known to have shown good benefits in a variety of human diseases, with high negative predictive value for diagnosis. More importantly, RDW is now recognized as a strong independent mortality risk factor in a variety of diseases.39 RDW also has good predictive value in trauma.40 Increased RDW was found to be an independent predictor of 28-day mortality in patients with severe trauma by continuous monitoring of RDW.41 The models in the current study included glucose and sodium biochemical markers, which have been associated with prognosis in clinical practice, and Grant et al considered glucose change to be a highly accurate predictor of infection.42 Studies have shown that hyperglycemia is associated with increased mortality in critically ill patients.43 Dominic et al ‘s study showed that 28-day mortality was higher in patients with serum sodium disorder after surgery in the MIMIC II database.44 Mechanical ventilation (MV) is a supportive treatment method for patients with various forms of respiratory failure. Although mechanical ventilation has a wide range of applications and obvious benefits, it is not a risk-free intervention measure. At the same time, delayed weaning is associated with an increased risk of incidence rate, mortality, length of stay and discharge from long-term care institutions. For most patients (70%), detachment from mechanical ventilation is a simple process. This usually requires extubation after passing the first spontaneous breathing test (SBT). The remaining 30% of patients are a challenge for ICU doctors. Difficulties typically occur in patients with underlying causes such as chronic obstructive and restrictive pulmonary disease, heart failure, and neuromuscular disorders.45 It has also been found that MV is associated with mortality of ICU patients with tauma, which is in agreement with the prediction of the model.46 In machine learning algorithms, the interaction between variables is considered when important variables are selected to effectively extract prediction patterns from data. Most of the top 10 variables obtained by using XGBoost as the main model reflect the characteristics of critically ill patients. However, among the current characteristics, the Elixhauser score has rarely been explored in the ICU. Therefore, this study can also provide some enlightenment for further research.
Ahmed et al47 used the MIMIC-III database to explore early mortality prediction models for surgical patients in trauma ICUs. Among the Deep FLAIM, GNB Model, Decision Tree Model (CART), KNN Model and Linear Discriminant Analysis (LDA) machine learning models, the results showed that deep-field models perform better than others. Another study used mechanical ventilation patient characteristics in the MIMIC-III database and compared seven machine learning models to establish an in-hospital mortality prediction model for ICU mechanical ventilation patients based on the XGBoost algorithm.48 The AUC value of the XGBoost model was 0.8213, similar to the performance of XGBoost in our study. Among the important features, the first three are age, respiratory disease and SAPS II, two of which are consistent with our study. Therefore, our XGBoost model may have implications for predicting ICU patient mortality in other diseases.
Through further interpretation of the model, sample examples were used to predict and explain the results. As shown in Figure 6c, the patient was 72 years old with RDW 14.1, SAPS II 34 points, and respiratory rate 27 times per min. The predicted risk of death was significantly higher than the base value. Respiratory rate and SAPS II were more influential factors. Zhao et al found that coagulation disorders were the most important variable in predicting sepsis-induced coagulopathy.49 By explaining the model with examples, the model can be explained in the clinic. A more intuitive understanding of the model’s practicality and interpretability is needed.
A number of model have been employed in the prediction of prognosis of patients in ICU.50 For instance, four models (LR, SVM, NN, and TRISS) exhibited a similar high accuracy and sensitivity in predicting the survival of the trauma patients. In the test dataset, the NN model had the highest balanced accuracy and predictive specificity.9 In this study, we chose XGBoost model after comparing different models. Our results showed that the calibration curves of the XGBoost model and DCA performed well. The predicted results are illustrated by Shapley Additive explanations (SHAP) values, which makes our model clinically interpretable Our results were in agreement with previous studies, which showed that XGBoost model displayed good recall for the healthy recovery group.51 In this prior work, data was collected from 5871 patients. Then, two algorithms were created using the Extreme Gradient Enhancement (xGBT) machine learning model. The complete model showed 86% recovery recall, 30% chronic care recall, 67% mortality recall, and 80% complication recall; The short-term model applicable to ED shows a recovery recall rate of 89%, a chronic care recall rate of 25%, and a mortality recall rate of 41%.51 Wang et al also reported that the XGBoost algorithm is more effective and accurate than logistic regression in predicting mortality in patients with moderate to severe TBI. The XGBoost prediction method is beneficial for doctors to assess the high risk of poor prognosis in TBI patients.52 Combined with our findings, it is reasonable to believe that XGBoost algorism was superior to traditional logistic regression in predicting mortality of patients with trauma.
The main advantage of this study is that the XGBoost model was used for the first time to predict the 90-day mortality rate of MIMIC-III patients in ICU, and compared with traditional regression analysis and clinical scoring systems. However, this study has some limitations. Firstly, in addition to the patient’s clinical condition, the decision to send the patient to the intensive care unit may be the result of various other factors, including the doctor’s discretion, institutional policies and procedures, and the hospital’s capabilities, which may bias our predicted scores. Secondly, the data extracted from the MIMIC-III database is distributed over several years (2001–2012), during which there have been significant changes in the treatment of heart failure, which may weaken the application of our model. Thirdly, as a single-center study, the population is relatively small. Although the robustness of our column chart has been extensively tested through internal validation through bootstrap testing, it is still uncertain whether the results of this study can be applied to other populations, and further research is needed on more patients in various clinical settings to confirm our results. Fourthly, data is collected from patient’s medical records, and we rely on the accuracy of the records. Moreover, as this is a retrospective study, we cannot avoid selection bias. In addition, the proposed model is not intended to be validated by developing sets from databases or our clinical data. Nevertheless, we believe that the proposed model may help us further understand the prognosis of patients with trauma in ICU.
The highlights of our study are, first of all, that this is the first predictive model to predict 90-day mortality in trauma patients in the ICU. Second, we used 9 machine learning models for comparison, a 20% subset of the database for internal validation, ROC, and calibration graphs for evaluation of models.53 However, there are several limitations in our study. First, this was a retrospective observational study based only on the MIMIC-III database. Most of the patients were white and there may be potential bias. Second, there are many variable features in the MIMIC-III database, so our study did not explore all the features, and some key features may be omitted. Third, the lack of external validation of our model may reduce the importance and evidence of the model. Therefore, further external validation and prospective studies are needed to evaluate the universal applicability of the model.
Conclusions
In conclusion, this study shows that the prediction performance of the XGBoost model is superior to that of other models by comparing 9 other algorithms. Ten clinical features were found to be closely associated with 90-day mortality in ICU trauma patients. Our study shows that the XGBoost model outperforms other machine learning models in predicting 90-day mortality in trauma patients. This simple yet powerful mortality prediction model can be used to assist clinicians in early identification of mortality risk factors and early intervention to reduce mortality, particularly in patients whose condition is rapidly deteriorating.
Data Sharing Statement
The publicly available datasets in this study can be found online. The names of the repository/repositories and accession number(s) can be found below: https://mimic-iv.mit.edu/.
Ethics Statement
The establishment of the MIMIC-III database was approved by the Massachusetts Institute of Technology and Beth Israel Deaconess Medical Center, and informed consent was obtained for the collection of raw data. This project was approved by the Biomedical Ethics Review Committee of West China Hospital of Sichuan University and consent was granted to waive the informed consent form.
Author Contributions
All authors made a significant contribution to the work reported, whether that is in the conception, study design, execution, acquisition of data, analysis and interpretation, or in all these areas; took part in drafting, revising or critically reviewing the article; gave final approval of the version to be published; have agreed on the journal to which the article has been submitted; and agree to be accountable for all aspects of the work.
Funding
This study was supported by the Sichuan Science and Technology Program (Grant No.: 2021YFS0184, Grant No.: 2023YFS0322).
Disclosure
All authors have no competing interests in this work.
References
1. Collaborators GBDCo D. Global, regional, and national age-sex-specific mortality for 282 causes of death in 195 countries and territories, 1980-2017: a systematic analysis for the Global Burden of Disease Study 2017. Lancet. 2018;392(10159):1736–1788.
2. Rhee P, Joseph B, Pandit V, et al. Increasing trauma deaths in the United States. Ann Surg. 2014;260(1):13–21. doi:10.1097/SLA.0000000000000600
3. Azami-Aghdash S, Sadeghi-Bazargani H, Shabaninejad H, Abolghasem Gorji H. Injury epidemiology in Iran: a systematic review. J Inj Violence Res. 2017;9(1):27–40. doi:10.5249/jivr.v9i1.852
4. Yousefzadeh Chabok S, Ranjbar Taklimie F, Malekpouri R, Razzaghi A. Predicting mortality, hospital length of stay and need for surgery in pediatric trauma patients. Chin J Traumatol. 2017;20(6):339–342. doi:10.1016/j.cjtee.2017.04.011
5. Butcher N, Balogh ZJ. The definition of polytrauma: the need for international consensus. Injury. 2009;40 Suppl 4:S12–22. doi:10.1016/j.injury.2009.10.032
6. Boyd CR, Tolson MA, Copes WS. Evaluating trauma care: the TRISS method. Trauma Score and the Injury Severity Score. J Trauma. 1987;27(4):370–378. doi:10.1097/00005373-198704000-00005
7. Cook A, Osler T, Glance L, et al. Comparison of two prognostic models in trauma outcome. Br J Surg. 2018;105(5):513–519. doi:10.1002/bjs.10764
8. Kang WS, Chung H, Ko H, et al. Artificial intelligence to predict in-hospital mortality using novel anatomical injury score. Sci Rep. 2021;11(1):23534. doi:10.1038/s41598-021-03024-1
9. Rau CS, Wu SC, Chuang JF, et al. Machine learning models of survival prediction in trauma patients. J Clin Med. 2019;8(6):799. doi:10.3390/jcm8060799
10. Johnson AE, Stone DJ, Celi LA, Pollard TJ. The MIMIC Code Repository: enabling reproducibility in critical care research. J Am Med Inform Assoc. 2018;25(1):32–39. doi:10.1093/jamia/ocx084
11. Gruber WH, Powell AC, Torous JB. The power of capturing and using information at the point of care. Healthc. 2017;5(3):86–88. doi:10.1016/j.hjdsi.2016.09.004
12. Obermeyer Z, Emanuel EJ. Predicting the Future - Big Data, Machine Learning, and Clinical Medicine. N Engl J Med. 2016;375(13):1216–1219. doi:10.1056/NEJMp1606181
13. Cruz JA, Wishart DS. Applications of machine learning in cancer prediction and prognosis. Cancer Inform. 2007;2:59–77.
14. Mooney SJ, Pejaver V. Big Data in Public Health: terminology, Machine Learning, and Privacy. Annu Rev Public Health. 2018;39(1):95–112. doi:10.1146/annurev-publhealth-040617-014208
15. Do Nascimento PM, Medeiros IG, Falcao RM, Stransky B, de Souza JES. A decision tree to improve identification of pathogenic mutations in clinical practice. BMC Med Inform Decis Mak. 2020;20(1):52. doi:10.1186/s12911-020-1060-0
16. Nicora G, Rios M, Abu-Hanna A, Bellazzi R. Evaluating pointwise reliability of machine learning prediction. J Biomed Inform. 2022;127:103996. doi:10.1016/j.jbi.2022.103996
17. Abiodun OI, Jantan A, Omolara AE, Dada KV, Mohamed NA, Arshad H. State-of-the-art in artificial neural network applications: a survey. Heliyon. 2018;4(11):e00938. doi:10.1016/j.heliyon.2018.e00938
18. Laudani A, Lozito GM, Riganti Fulginei F, Salvini A. On Training Efficiency and Computational Costs of a Feed Forward Neural Network: a Review. Comput Intell Neurosci. 2015;2015:818243. doi:10.1155/2015/818243
19. Ositanwosu OE, Huang Q, Liang Y, Nwokoye CH. Automatic measurement and prediction of Chinese Grown Pigs weight using multilayer perceptron neural networks. Sci Rep. 2023;13(1):2573. doi:10.1038/s41598-023-28433-2
20. Ozer ME, Sarica PO, Arga KY. New Machine Learning Applications to Accelerate Personalized Medicine in Breast Cancer: rise of the Support Vector Machines. OMICS. 2020;24(5):241–246. doi:10.1089/omi.2020.0001
21. Huang S, Cai N, Pacheco PP, Narrandes S, Wang Y, Xu W. Applications of Support Vector Machine (SVM) Learning in Cancer Genomics. Cancer Genomics Proteomics. 2018;15(1):41–51. doi:10.21873/cgp.20063
22. Zhang Z. Introduction to machine learning: k-nearest neighbors. Ann Transl Med. 2016;4(11):218. doi:10.21037/atm.2016.03.37
23. Yuan KC, Tsai LW, Lee KH, et al. The development an artificial intelligence algorithm for early sepsis diagnosis in the intensive care unit. Int J Med Inform. 2020;141:104176. doi:10.1016/j.ijmedinf.2020.104176
24. Zhang Z, Ho KM, Hong Y. Machine learning for the prediction of volume responsiveness in patients with oliguric acute kidney injury in critical care. Crit Care. 2019;23(1):112. doi:10.1186/s13054-019-2411-z
25. Xu Y, Han D, Huang T, et al. Predicting ICU Mortality in Rheumatic Heart Disease: comparison of XGBoost and Logistic Regression. Front Cardiovasc Med. 2022;9:847206. doi:10.3389/fcvm.2022.847206
26. Hou N, Li M, He L, et al. Predicting 30-days mortality for MIMIC-III patients with sepsis-3: a machine learning approach using XGboost. J Transl Med. 2020;18(1):462. doi:10.1186/s12967-020-02620-5
27. Yijing L, Wenyu Y, Kang Y, et al. Prediction of cardiac arrest in critically ill patients based on bedside vital signs monitoring. Comput Methods Programs Biomed. 2022;214:106568. doi:10.1016/j.cmpb.2021.106568
28. Goldberger AL, Amaral LA, Glass L, et al. PhysioBank, PhysioToolkit, and PhysioNet: components of a new research resource for complex physiologic signals. Circulation. 2000;101(23):E215–220. doi:10.1161/01.CIR.101.23.e215
29. Johnson AE, Pollard TJ, Shen L, et al. MIMIC-III, a freely accessible critical care database. Sci Data. 2016;3:160035. doi:10.1038/sdata.2016.35
30. Collins GS, Reitsma JB, Altman DG, Moons KG. Transparent reporting of a multivariable prediction model for individual prognosis or diagnosis (TRIPOD): the TRIPOD statement. BMJ. 2015;350:g7594. doi:10.1136/bmj.g7594
31. Wu WT, Li YJ, Feng AZ, et al. Data mining in clinical big data: the frequently used databases, steps, and methodological models. Mil Med Res. 2021;8(1):44. doi:10.1186/s40779-021-00338-z
32. Quan H, Sundararajan V, Halfon P, et al. Coding algorithms for defining comorbidities in ICD-9-CM and ICD-10 administrative data. Med Care. 2005;43(11):1130–1139. doi:10.1097/01.mlr.0000182534.19832.83
33. Charlson ME, Pompei P, Ales KL, MacKenzie CR. A new method of classifying prognostic comorbidity in longitudinal studies: development and validation. J Chronic Dis. 1987;40(5):373–383. doi:10.1016/0021-9681(87)90171-8
34. Kutcher ME, Pepper MB, Morabito D, Sunjaya D, Knudson MM, Cohen MJ. Finding the sweet spot: identification of optimal glucose levels in critically injured patients. J Trauma. 2011;71(5):1108–1114. doi:10.1097/TA.0b013e318232e35b
35. Bahloul M, Chaari A, Chabchoub I, et al. Outcome analysis and outcome predictors of traumatic head injury in childhood: analysis of 454 observations. J Emerg Trauma Shock. 2011;4(2):198–206. doi:10.4103/0974-2700.82206
36. Zhang Z, Rousson V, Lee WC, et al. Decision curve analysis: a technical note. Ann Transl Med. 2018;6(15):308. doi:10.21037/atm.2018.07.02
37. Lundberg SM, Erion G, Chen H, et al. From Local Explanations to Global Understanding with Explainable AI for Trees. Nat Mach Intell. 2020;2(1):56–67. doi:10.1038/s42256-019-0138-9
38. Ulvik A, Wentzel-Larsen T, Flaatten H. Trauma patients in the intensive care unit: short- and long-term survival and predictors of 30-day mortality. Acta Anaesthesiol Scand. 2007;51(2):171–177. doi:10.1111/j.1399-6576.2006.01207.x
39. Salvagno GL, Sanchis-Gomar F, Picanza A, Lippi G. Red blood cell distribution width: a simple parameter with multiple clinical applications. Crit Rev Clin Lab Sci. 2015;52(2):86–105. doi:10.3109/10408363.2014.992064
40. Lippi G, Bovo C, Buonocore R, Mitaritonno M, Cervellin G. Red blood cell distribution width in patients with limb, chest and head trauma. Arch Med Sci. 2017;13(3):606–611. doi:10.5114/aoms.2017.67282
41. Kong T, Park JE, Park YS, et al. Usefulness of serial measurement of the red blood cell distribution width to predict 28-day mortality in patients with trauma. Am J Emerg Med. 2017;35(12):1819–1827. doi:10.1016/j.ajem.2017.06.008
42. Bochicchio GV, Bochicchio KM, Joshi M, Ilahi O, Scalea TM. Acute glucose elevation is highly predictive of infection and outcome in critically injured trauma patients. Ann Surg. 2010;252(4):597–602. doi:10.1097/SLA.0b013e3181f4e499
43. Falciglia M, Freyberg RW, Almenoff PL, D’Alessio DA, Render ML. Hyperglycemia-related mortality in critically ill patients varies with admission diagnosis. Crit Care Med. 2009;37(12):3001–3009. doi:10.1097/CCM.0b013e3181b083f7
44. Marshall DC, Salciccioli JD, Goodson RJ, et al. The association between sodium fluctuations and mortality in surgical patients requiring intensive care. J Crit Care. 2017;40:63–68. doi:10.1016/j.jcrc.2017.02.012
45. Fadila M, Rajasurya V, Regunath H. Ventilator Weaning. Treasure Island (FL): StatPearls; 2023.
46. Investigators I-R, the A, New Zealand Intensive Care Society Clinical Trials G. Conservative Oxygen Therapy during Mechanical Ventilation in the ICU. N Engl J Med. 2020;382(11):989–998. doi:10.1056/NEJMoa1903297
47. Ahmed FS, Ali L, Joseph BA, Ikram A, Ul Mustafa R, Bukhari SAC. A statistically rigorous deep neural network approach to predict mortality in trauma patients admitted to the intensive care unit. J Trauma Acute Care Surg. 2020;89(4):736–742. doi:10.1097/TA.0000000000002888
48. Zhu Y, Zhang J, Wang G, et al. Machine Learning Prediction Models for Mechanically Ventilated Patients: analyses of the MIMIC-III Database. Front Med. 2021;8:662340. doi:10.3389/fmed.2021.662340
49. Zhao QY, Liu LP, Luo JC, et al. A Machine-Learning Approach for Dynamic Prediction of Sepsis-Induced Coagulopathy in Critically Ill Patients With Sepsis. Front Med. 2020;7:637434. doi:10.3389/fmed.2020.637434
50. Mou Z, Godat LN, El-Kareh R, Berndtson AE, Doucet JJ, Costantini TW. Electronic health record machine learning model predicts trauma inpatient mortality in real time: a validation study. J Trauma Acute Care Surg. 2022;92(1):74–80. doi:10.1097/TA.0000000000003431
51. Lee KC, Hsu CC, Lin TC, Chiang HF, Horng GJ, Chen KT. Prediction of Prognosis in Patients with Trauma by Using Machine Learning. Medicina. 2022;58(10). doi:10.3390/medicina58101379
52. Wang R, Wang L, Zhang J, He M, Xu J. XGBoost Machine Learning Algorism Performed Better Than Regression Models in Predicting Mortality of Moderate-to-Severe Traumatic Brain Injury. World Neurosurg. 2022;163:e617–e622. doi:10.1016/j.wneu.2022.04.044
53. Van Calster B, McLernon DJ, van Smeden M, et al. Calibration: the Achilles heel of predictive analytics. BMC Med. 2019;17(1):230. doi:10.1186/s12916-019-1466-7
 © 2023 The Author(s). This work is published and licensed by Dove Medical Press Limited. The
full terms of this license are available at https://www.dovepress.com/terms
and incorporate the Creative Commons Attribution
- Non Commercial (unported, 3.0) License.
By accessing the work you hereby accept the Terms. Non-commercial uses of the work are permitted
without any further permission from Dove Medical Press Limited, provided the work is properly
attributed. For permission for commercial use of this work, please see paragraphs 4.2 and 5 of our Terms.
© 2023 The Author(s). This work is published and licensed by Dove Medical Press Limited. The
full terms of this license are available at https://www.dovepress.com/terms
and incorporate the Creative Commons Attribution
- Non Commercial (unported, 3.0) License.
By accessing the work you hereby accept the Terms. Non-commercial uses of the work are permitted
without any further permission from Dove Medical Press Limited, provided the work is properly
attributed. For permission for commercial use of this work, please see paragraphs 4.2 and 5 of our Terms.
Recommended articles
A Prediction Model Based on Blood Biomarker for Mortality Risk in Patients with Acute Venous Thromboembolism
Jiang J, Xue J, Liu Y
Journal of Inflammation Research 2022, 15:4725-4735
Published Date: 18 August 2022
Improving Mortality Risk Prediction with Routine Clinical Data: A Practical Machine Learning Model Based on eICU Patients
Zhao S, Tang G, Liu P, Wang Q, Li G, Ding Z
International Journal of General Medicine 2023, 16:3151-3161
Published Date: 26 July 2023
Associations Between Dysphagia and Adverse Health Outcomes in Older Adults with Dementia in Intensive Care Units: A Retrospective Cohort Study
Cheng H, Deng X, Li J, Tang Y, Yuan S, Huang X, Wang Z, Zhou F, Lyu J
Clinical Interventions in Aging 2023, 18:1233-1248
Published Date: 3 August 2023
Dynamic Nomogram for Subsyndromal Delirium in Adult Intensive Care Unit: A Prospective Cohort Study
Cheng J, Lao Y, Chen X, Qiao X, Sui W, Gong X, Zhuang Y
Neuropsychiatric Disease and Treatment 2023, 19:2535-2548
Published Date: 22 November 2023
Removal of Chlorhexidine for Ventilator-Associated Pneumonia Prevention with a Dentist Composing the Intensive Care Unit Team

Pains MB, Vieira IV, Figueiredo ARC, Diniz SCB, Figueiredo PTS
Journal of Multidisciplinary Healthcare 2024, 17:5299-5308
Published Date: 16 November 2024