Back to Journals » Cancer Management and Research » Volume 10
A radiomics-based formula for the preoperative prediction of postoperative pancreatic fistula in patients with pancreaticoduodenectomy
Authors Zhang WY ![]() , Cai W, He B
, Cai W, He B ![]() , Xiang N, Fang C, Jia F
, Xiang N, Fang C, Jia F ![]()
Received 30 August 2018
Accepted for publication 7 November 2018
Published 28 November 2018 Volume 2018:10 Pages 6469—6478
DOI https://doi.org/10.2147/CMAR.S185865
Checked for plagiarism Yes
Review by Single anonymous peer review
Peer reviewer comments 2
Editor who approved publication: Dr Rituraj Purohit
Wenyu Zhang,1,2 Wei Cai,1,2 Baochun He,2,3 Nan Xiang,1 Chihua Fang,1 Fucang Jia2,3
1Department of Hepatobiliary Surgery, Zhujiang Hospital, Southern Medical University, Guangzhou, People’s Republic of China; 2Research Lab for Medical Imaging and Digital Surgery, Shenzhen Institutes of Advanced Technology, Chinese Academy of Sciences, Shenzhen, People’s Republic of China; 3Shenzhen Key Laboratory of Minimally Invasive Surgical Robotics and System, Shenzhen Institutes of Advanced Technology, Chinese Academy of Sciences, Shenzhen, People’s Republic of China
Objective: The objective of the study was to develop and validate a radiomics-based formula for the preoperative prediction of postoperative pancreatic fistula (POPF) in patients undergoing pancreaticoduodenectomy (PD).
Materials and methods: A total of 117 consecutive patients who underwent PD were enrolled in this retrospective study. Radiomics features were extracted from portal venous phase computed tomography of the above patients. The least absolute shrinkage and selection operator logistic regression was used to construct a formula of Rad-score calculation. Then the performance of the formula was assessed with standard pancreatic Fistula Risk Score.
Results: The Rad-score could predict POPF with an area under the curve (AUC) of 0.8248 in the training cohort and of 0.7609 in the validation cohort. Patients who had experienced POPF generally had a statistically higher Rad-score than those who had not experienced POPF in both cohorts. The AUC of the Rad-score was statistically higher than the Fistula Risk Score for predicting POPF in both the training and validation cohort.
Conclusion: A novel radiomics-based formula was developed and validated for predicting POPF in patients who underwent PD, which provides a new method for identifying POPF risks and may help to improve informed decision-making in the prevention of POPF at low cost.
Keywords: pancreatoduodenectomy, postoperative pancreatic fistula, diagnostic imaging, radiomics
Introduction
Pancreaticoduodenectomy (PD) is one of the most complicated operations to perform and is the primary treatment for resectable periampullary and pancreatic tumors or benign occupying lesions. Although improvements in surgical techniques and perioperative management have led to a perioperative mortality rate of less than 5%,1–3 a high incidence of surgical complication remains. At present, postoperative pancreatic fistula (POPF) is one of the most harmful complications after pancreatic resection, with a rate of 3%–45% at high-volume centers.4 POPF is the major cause of complications, such as delayed gastric emptying, intra-abdominal infection, and postoperative hemorrhage. In certain situation, the POPF may lead to serious complications, for example, reoperation, multiple organ failures, and even death.5 It is important to identify the risk factors for the development of POPF, and the presurgical identification of patients who are at risk of POPF is also a significant step in the management of patients with the disease. Many studies have been published to find the risk factors associated with pancreatic fistula after a PD, such as sex, age, body mass index (BMI), heart disease, pancreatic texture, diameter of pancreas, and blood loss.6,7
Although many risk factors for POPF have been reported, it is still difficult to integrate various risk factors and significantly predict the accuracy of POPF. A scoring system that provides a good prediction of the occurrence of POPF will be helpful for the perioperative risk management of PD. Recent studies revealed that several scoring system could achieve relatively good predictive accuracy for predicting POPF.8
As an alternative approach, computed tomography (CT) is an important tool that has been widely used to assess tumoral and anatomical tissue characteristics for surgical management.9 However, before surgical management, CT has been typically used to comprehend the blood flow and other anatomical variations to help safely perform the surgery to some extent. But the large quantity of additional useful information, contained in CT images, has not been utilized. With technological advancements, medical imaging is not only applied to qualitative diagnoses but also to quantitative techniques. In recent years, radiomics, which has received increasing attention, has turned captured images into high fidelity and high throughput data.10
The hypothesis of radiomics is that a large number of imaging features can be quantified to apply for treatment management and predict cancer characteristic or as potential imaging biomarkers.11 Several studies have described that radiomics has an enormous potential value in cancer management and can promote the understanding of tumor biology and better implementation of precision medicine.12 As a newly established field, radiomics uses advanced computational methods to mine medical imaging data and transform these data into quantitative parameters for clinical application of cancer diagnosis, staging, prognosis, treatment response, disease monitoring,12–14 and even for the medical practice of nonneoplastic lesions, such as discriminating high-risk atherosclerotic plaque and detecting Meniere’s disease.15,16
As far as we know, no studies have previously used radiomics approach that integrated the data that can be collected into a radiomics scoring (Rad-score) system to assess normal pancreatic parenchyma, and determined whether this new method could provide better POPF predictions for patients undergoing PD surgery.
Thus, the aim of the present study was to develop and validate a radiomics formula for individual preoperative prediction of POPF in patients undergoing PD surgery.
Materials and methods
Data source and study population
A total of 117 consecutive patients who underwent PD in Zhujiang Hospital of Southern Medical University were enrolled in this retrospective study according to the following inclusion criteria: 1) patients who underwent standard procedures of PD surgery with curative intent; 2) standard contrast-enhanced CT performed less than 10 days before surgical resection, with the image data stored intact; and 3) pathologically confirmed benign and malignant occupying lesions. The exclusion criteria were: 1) patients had a missing pancreatic fistula variable; 2) pathologically confirmed diffuse lesions; and 3) other malignant tumors existed simultaneously. The patients were divided into two separate cohorts by using a random number table at a ratio of 2:1. Eighty patients constituted the training cohort and the other 37 constituted the validation cohort. This study was approved by the local ethics committee of Zhujiang Hospital. All patients signed a written informed consent and were treated in accordance with the Declaration of Helsinki.
For all cases, demographic and pretreatment clinical data (age, genders, alcohol and smoking history, family history, medical history, and BMI) and surgical details, detailed imaging studies, pathology findings, and laboratory values (serum CA-19–9, bilirubin, albumin, etc.) were obtained from electronic medical record. We used 3D Slicer for quantitative analysis of the portal venous phase of the CT,17 which were retrieved from the picture archiving and communication system. The CT image acquisition and segmentation of region of interests (ROIs) are described in Supplementary materials S1 and S2.
Surgical procedures for PD
All surgeries were performed by the corresponding authors, who have more than 30 years of pancreatic surgery experience, with the help of a professional team.
During the reconstruction phase, we implemented manual end-to-side pancreaticojejunostomy in double layer. At the end of each procedure, two intra-abdominal drainage tubes were inserted. One tube was left in the hepaticojejunostomy area and the other was left near the pancreaticojejunostomy. All patients were managed according to the standard postoperative procedures. To achieve the safety and quality of the surgery, all surgical treatment and postoperative management were supervised by the same surgical team.
Extraction of radiomics features
We obtained a total of 1,219 CT image features from the pancreatic parenchyma. Since the tumor can be completely removed after PD surgery, the preoperative analysis of the heterogeneity of the lesion was not necessary, and only the characteristics of the pancreatic parenchyma were extracted. Finally, we obtained several targeted features for the pancreatic parenchyma, and they were classified into the following four groups: parenchyma shape and size-based features (n=16), intensity for pancreatic parenchyma (n=19), pancreatic textural features (n=74), and wavelet (n=1,110). The mathematical description of all features can be found in the online documentation of the PyRadiomics software,18 and in Supplementary material S3.
Definitions
The diagnosis of POPF was judged according to the definitions and classifications described in the International Study Group of Pancreatic Surgery guidelines.4 The amylase content of any measurable volume of drainage liquid on or after postoperative day 3 that is more than thrice the upper normal serum value (125 IU/L) was defined as POPF. POPF was then determined as follows: biochemical leakage ([BL] formerly grade A POPF) – the presence of a BL is defined as the pancreatic amylase output that is three times higher than the upper normal serum level (>375 IU/L), from the drain tube placed during surgery. The patient with BL was fed orally and maintained in good clinical condition. In clinically significant grade B, pancreatic fistula is present in the increased amylase activity in fluid from any drain tube and the increased amylase is associated with clinically relevant conditions necessitating any change in the management of the intended postoperative route. In the presence of grade B POPF, whenever organ failure or clinical instability develops, this condition is called grade C POPF and usually requires reoperation, prolonged hospitalization, stay in intensive care units, results in organ failure, and even death. In the present study, patients with fistula (BL, grade B, and grade C) were grouped as POPF (+) group and the other patients were grouped as POPF (-) group.
For each patient, the following composite variables were calculated and recorded. According to Callery et al, the Fistula Risk Score (FRS) was obtained using five parameters: gland texture (0–2 points), pathology (0–1 points), main pancreatic duct diameter (0–4 points), and intraoperative blood loss (0–3 points).19
Data analysis
Feature selection and construction of the Rad-score system
In order to avoid the “curse of dimensionality,”20,21 which would lead to a large false-positive result, we used a logistic regression with least absolute shrinkage and selection operator (LASSO) regularization to obtain the most informative features from the primary cohort. The penalty parameter adjustment was performed by tenfold cross-validation based on minimum criteria. Each patient then obtained a score through a Rad-score calculation, constructed with a linear combination of selected features weighted by their respective coefficients.22
Predictive validation of Rad-score and comparison to other existing methods
The potential predictive value of the Rad-score system with POPF was first evaluated in the primary cohort and then verified in the validation cohort by using the area under the curve (AUC) of the receiver operating characteristic (ROC). The AUCs of the FRS scores in predicting POPF were also calculated, and the comparisons between the Rad-score and FRS were performed using DeLong’s test in both the cohorts.
Statistical analysis
Statistical analyses were performed with R software version 3.4.2 (https://www.r-project.org). Categorical variables were compared using the chi-squared test or Fisher’s exact test, and continuous variables were compared using the Mann–Whitney U test. The “glmnet” package was used to perform LASSO logistic regression analysis. The “pROC” package was used in the creation of ROC curves and the calculation and comparisons of AUCs. A two-sided P-value <0.05 was accepted as indicative of statistical significance.
Results
Patient characteristics
The patient characteristics of the study participants are described in Table 1. The pretreatment clinical data, surgical details, pathology types, and laboratory values have no statistical differences between the two cohorts. In the primary cohort, 38 patients were female and 42 were male, while in the validation cohort, there were 16 females and 21 males. The ratio of female to male is basically equal. The ages (mean ± SD) of the primary and validation cohorts were 56.34±13.84 and 60.16±10.41 years. There were 34 and 14 patients experiencing POPF in the primary and validation cohorts, respectively. The characteristics of POPF in the primary and validation cohorts are given in Table 2. There are no significant differences between the two cohorts in POPF prevalence (P=0.234). Four patients (5.0%) in the training cohort and none in the validation cohort died in the hospital from surgical complications: massive bleeding caused by POPF in 3 patients, and organ failure in 1.
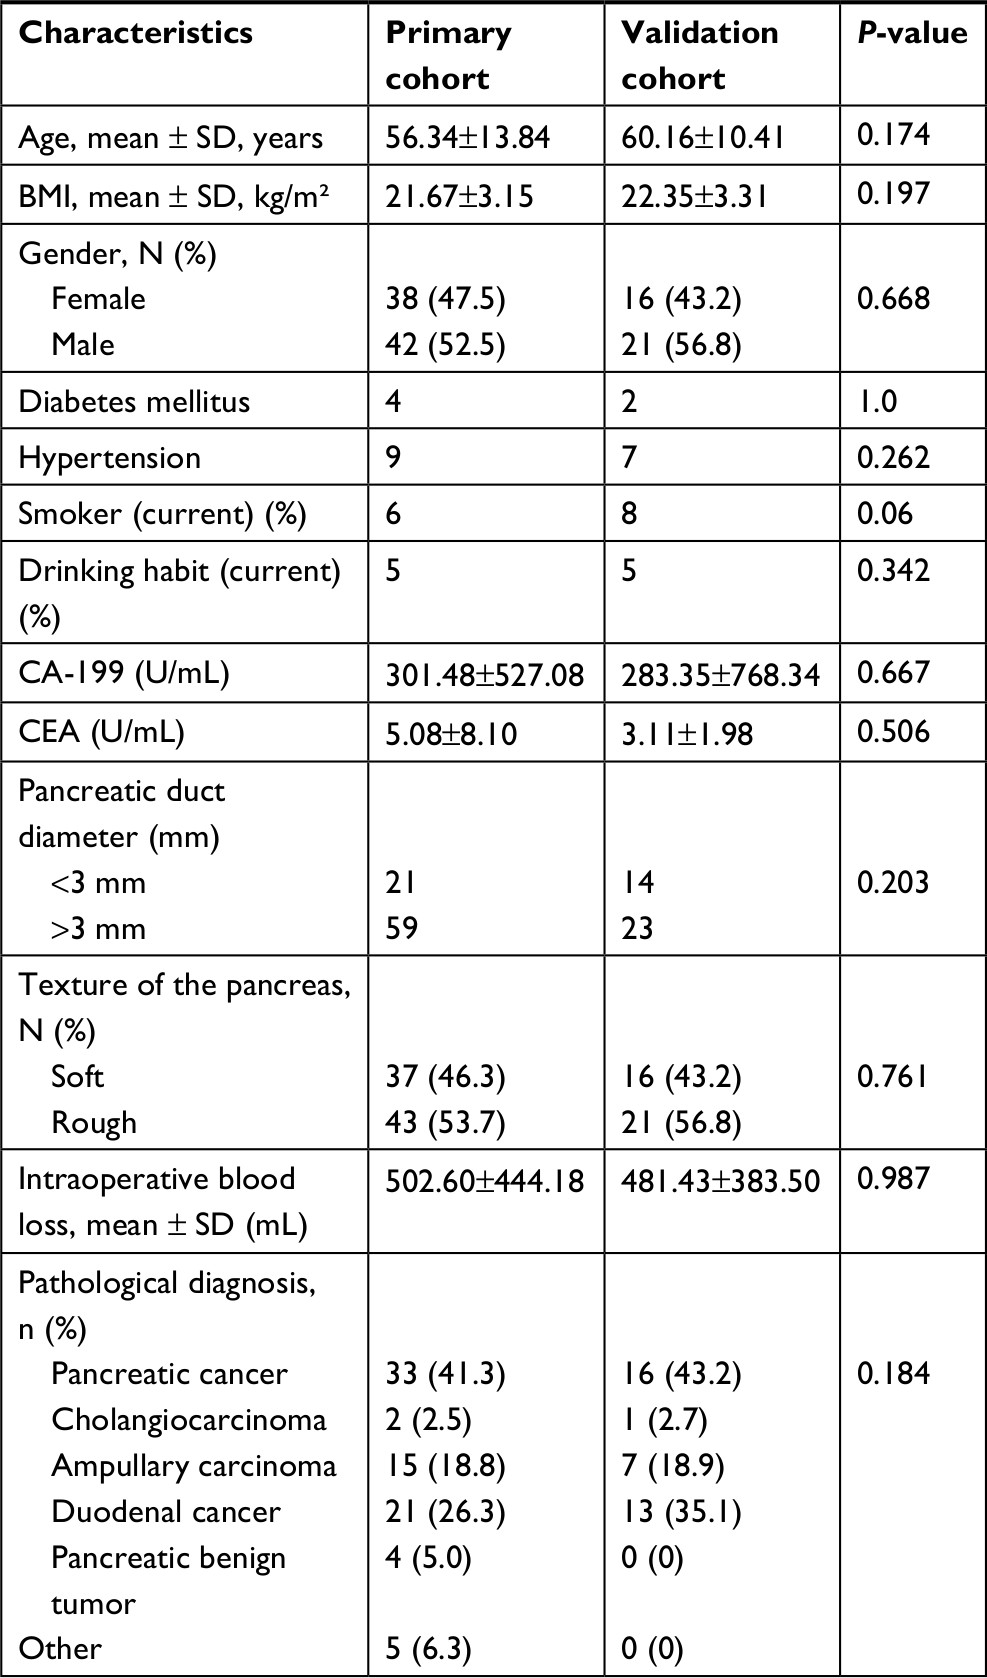 | Table 1 Characteristics of patients in the primary and validation cohorts Note: Other includes pancreatic pseudocyst and pancreatic cyst. Abbreviations: BMI, body mass index; CEA, carcinoembryonic antigen. |
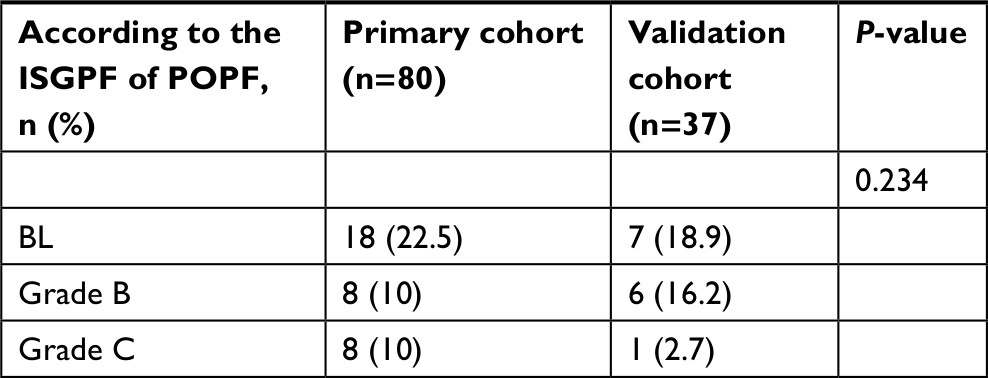 | Table 2 Postoperative characteristics of patients in the primary and validation cohorts Abbreviations: BL, biochemical leakage; ISGPF, International Study Group of Pancreatic Fistula; POPF, postoperative pancreatic fistula. |
Radiomics feature selection and Rad-score calculation
A total of 1,219 radiomics features of pancreatic parenchyma were extracted from preoperative CT images. In the primary cohort, eleven potential predictive features of POPF-related features with nonzero coefficients were selected in the LASSO logistic regression model (Figure 1A and B). The eleven features were all derived from the pancreatic parenchyma. The formula for the Rad-score calculation is listed in Table 3.
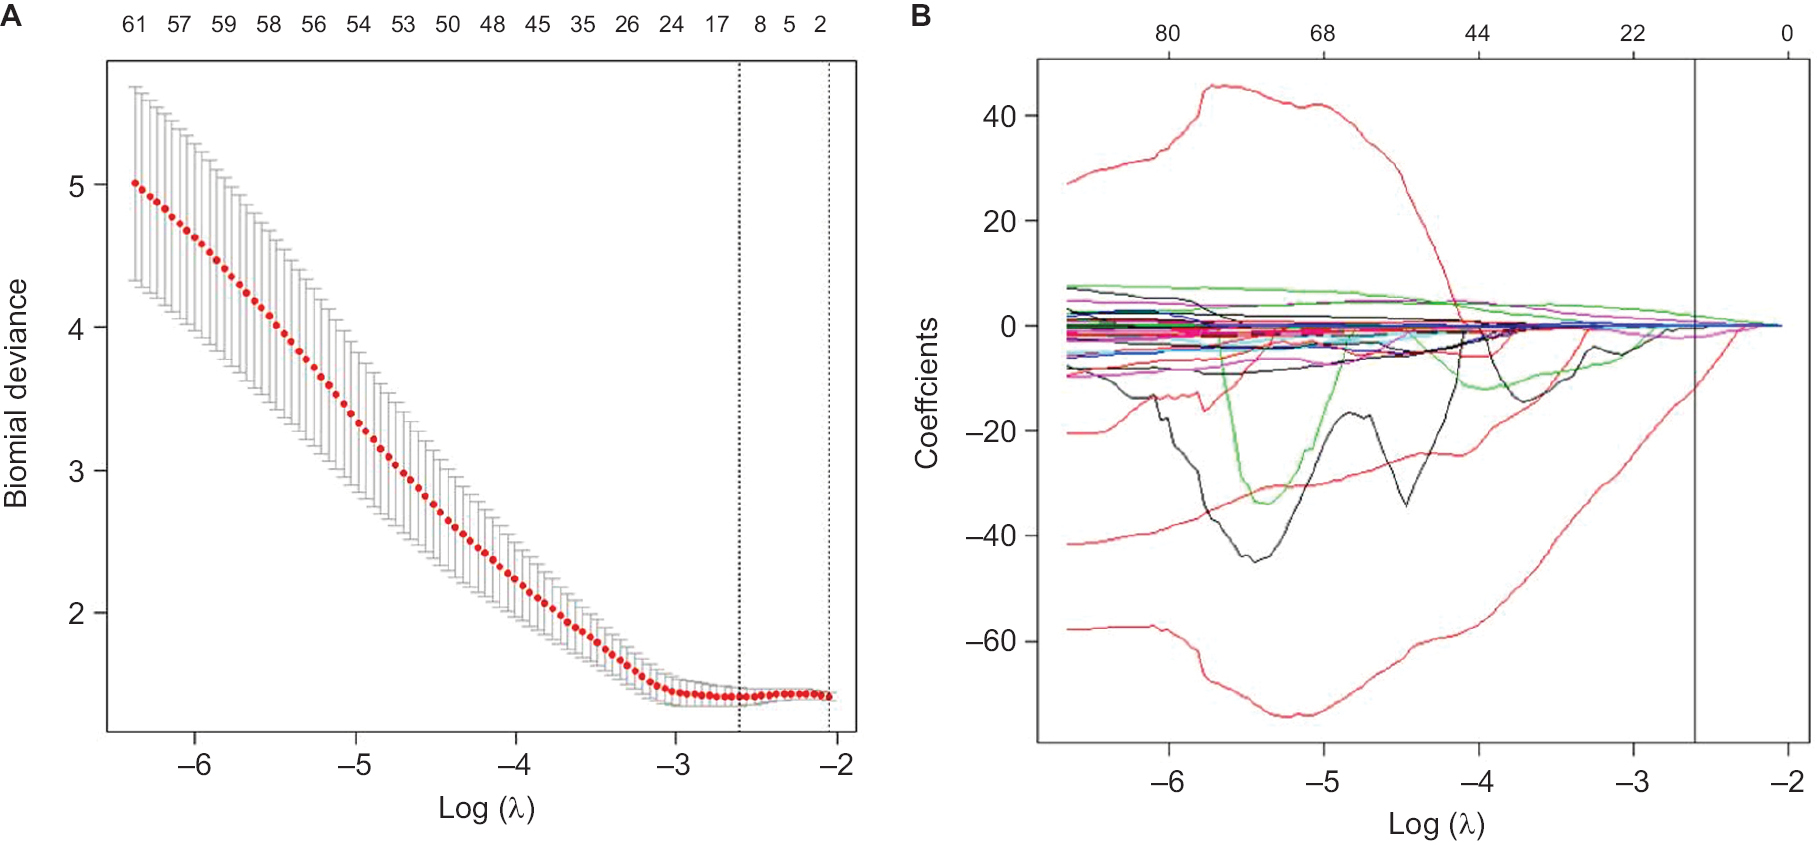 | Figure 1 Radiomics feature selection using the LASSO regression. Notes: (A) The tuning parameter (lambda) was selected in the LASSO model using tenfold cross-validation via minimum criteria. Two dashed vertical lines were drawn at the optimal values by using the minimum criteria and the standard error of the minimum criteria. The value of 0.0736 with log (λ), −2.6097, was chosen (minimum criteria) according to tenfold cross-validation. (B) LASSO coefficient profiles of the 1,219 texture features. A coefficient profile plot was produced against the log (λ) sequence. Vertical line was drawn at the value selected using tenfold cross-validation, where optimal lambda resulted in eleven nonzero coefficients. Abbreviation: LASSO, least absolute shrinkage and selection operator. |
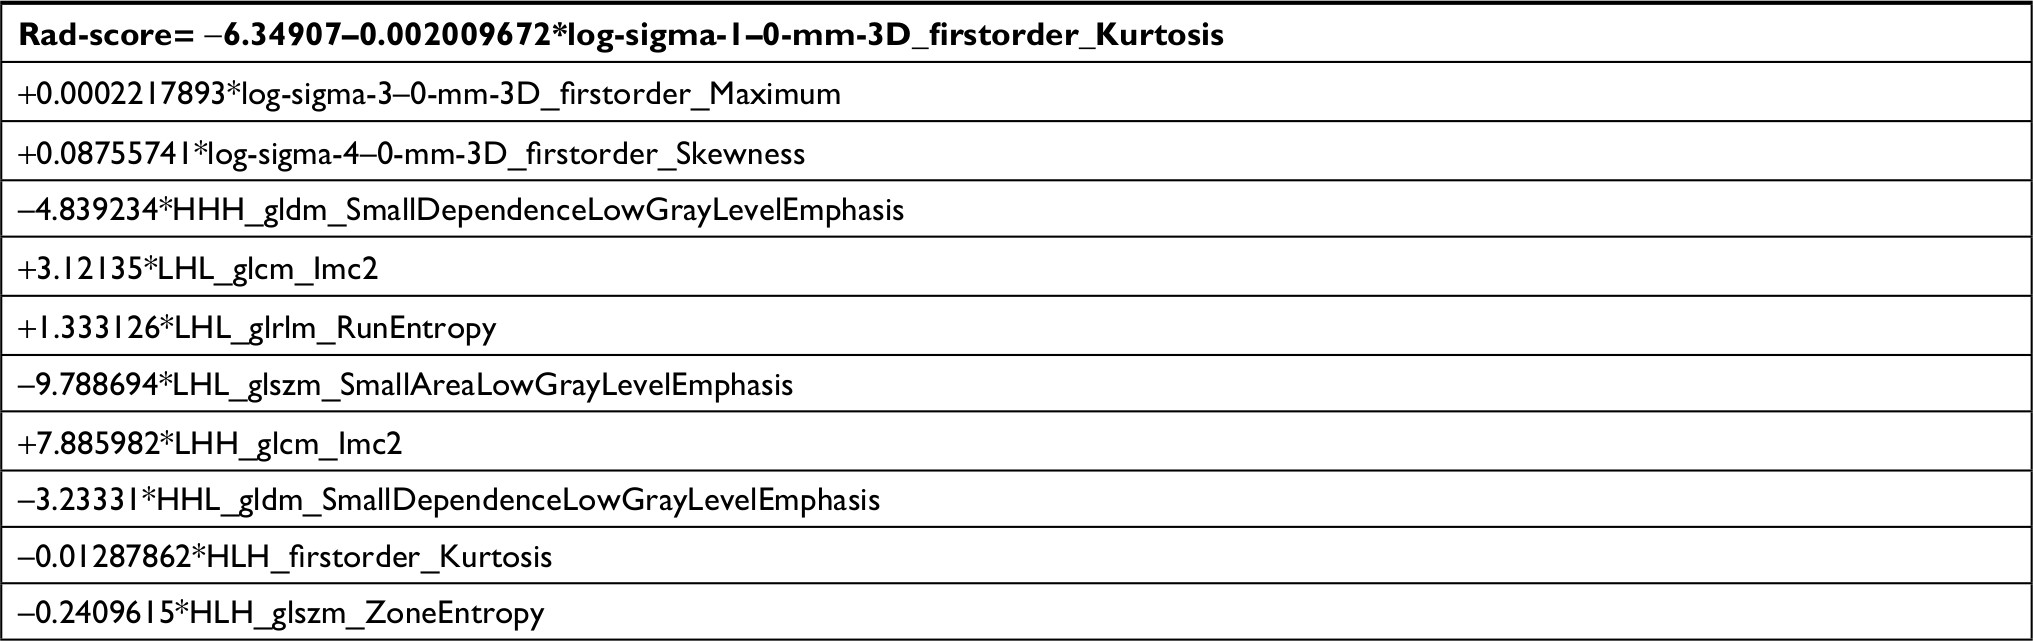 | Table 3 Rad-score calculation formula Notes: L and H indicate a low-pass (ie, scaling) and a high-pass (ie, wavelet) function, respectively. The decompositions are constructed in this manner, applying their respective ordering of low- or high-pass filtering in x, y and z-direction. For example, LHH is then interpreted as the high-pass sub band, resulting from directional filtering of X with a low-pass filter along x-direction, a high-pass filter along y-direction and a high-pass filter along z-direction. Abbreviation: Rad-score, radiomics score. |
Patients who had experienced POPF generally had higher Rad-scores than those who had not suffered from POPF (Figure 2A and B). As shown in Table 4, there was a significant difference between the Rad-scores of these two groups (POPF (−) vs POPF (+)) in the primary cohort and in the validation cohort.
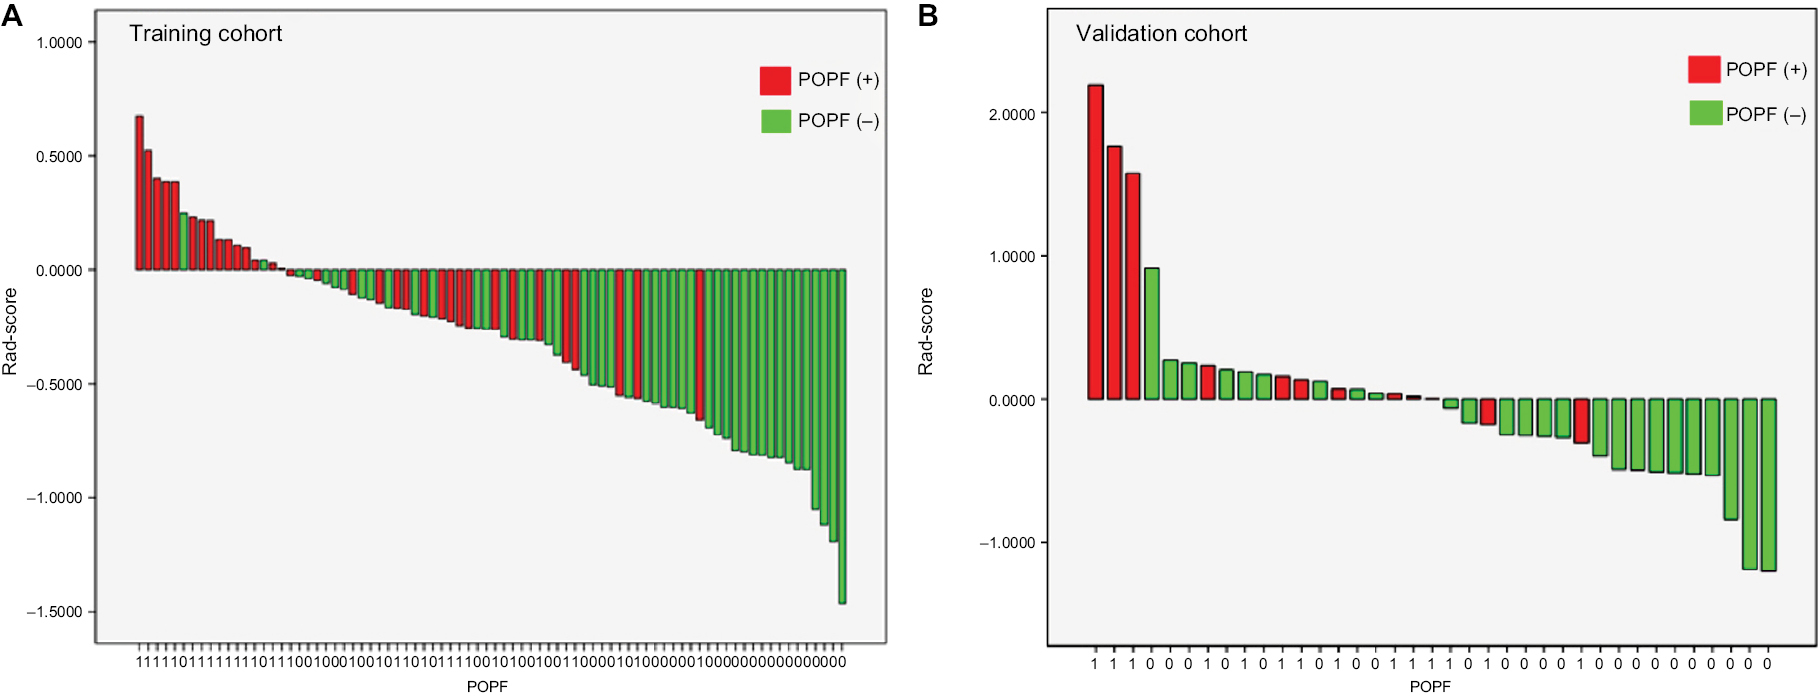 | Figure 2 Rad-score for each patient in (A) the training cohort and (B) the validation cohort. Abbreviations: POPF, postoperative pancreatic fistula; Rad-score, radiomics score. |
 | Table 4 Rad-score results Abbreviations: POPF, postoperative pancreatic fistula; Rad-score, radiomics score. |
Discrimination power of the Rad-score and comparison with FRS system
The predictive accuracy of the Rad-score formula was satisfactory, with an AUC of 0.8248 (95% CI, 0.7364–0.9132) in the primary cohort. In order to validate the formula, the conducted formula was applied to the validation cohort and the AUC was found to be 0.7609 (95% CI, 0.6066–0.9152) (Figure 3A and B).
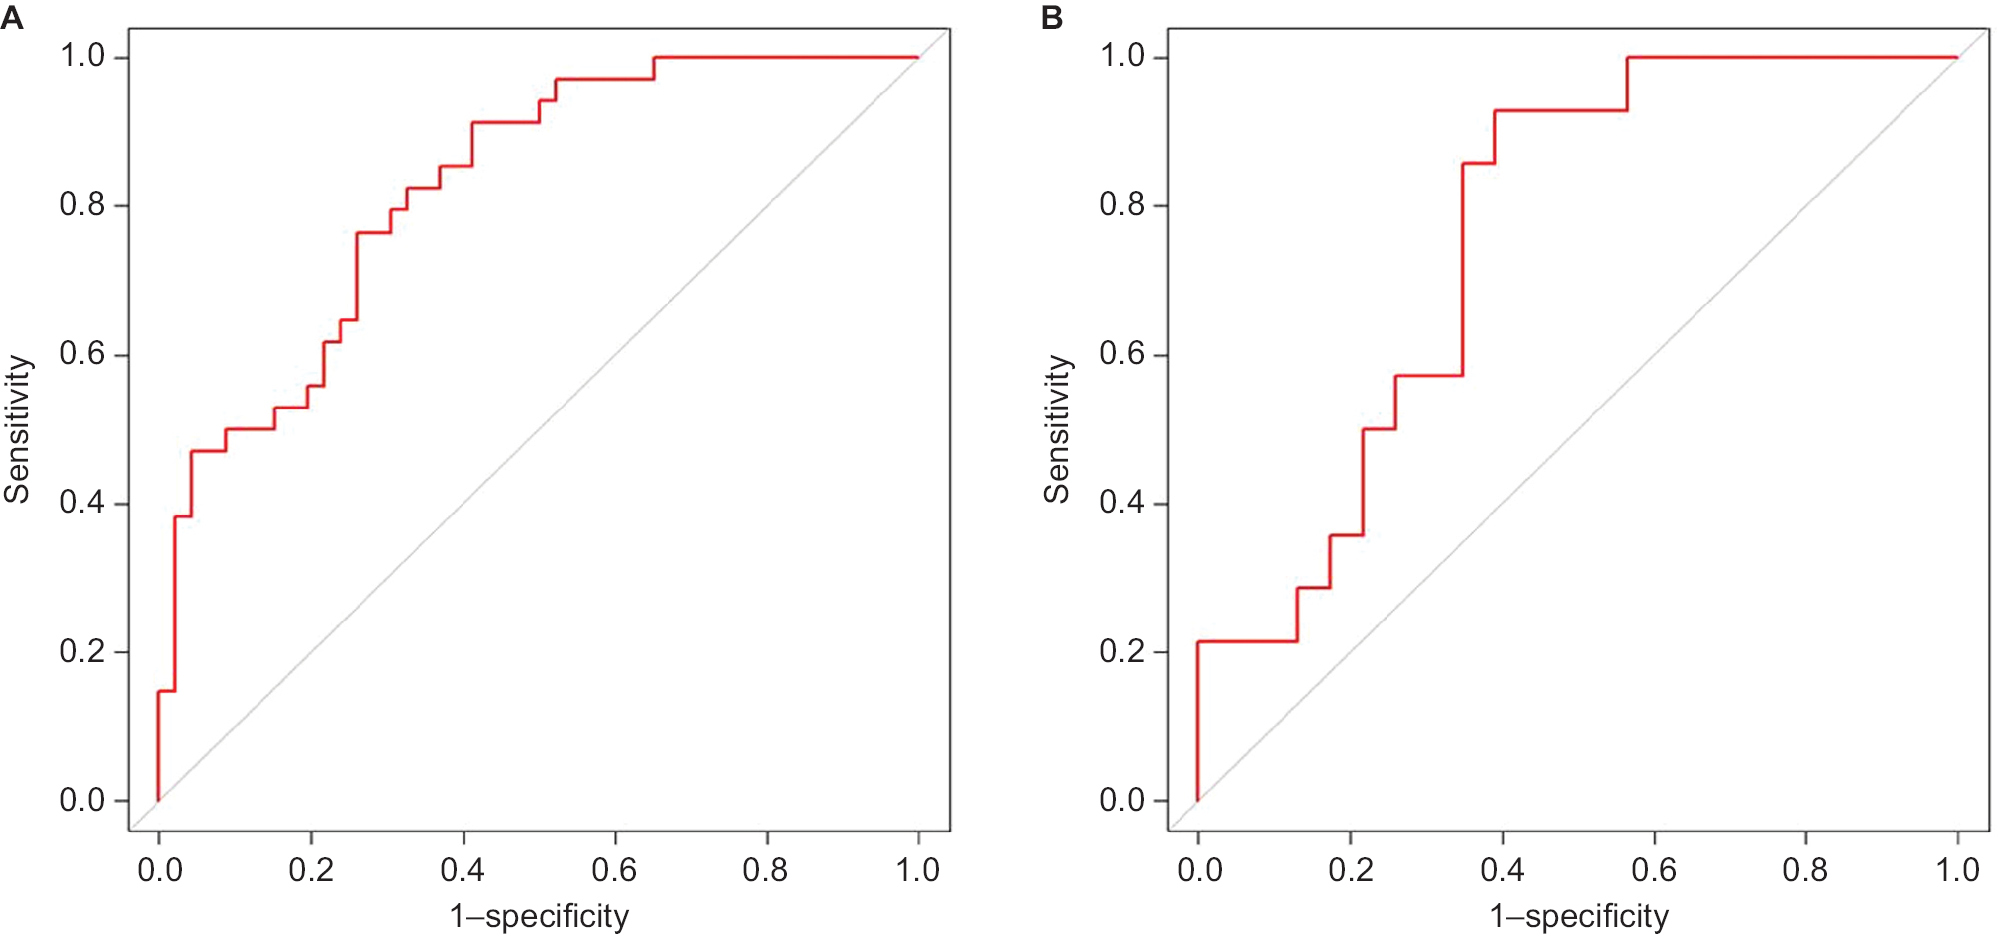 | Figure 3 ROC curve of Rad-score in (A) the training cohort and (B) the validation cohort. Note: The area under the ROC curve was 0.8248 and 0.7609, respectively, for training and validation cohort. Abbreviations: Rad-score, radiomics score; ROC, receiver operating characteristic. |
In the training cohort, the AUC of the Rad-score was higher than the FRS for predicting POPF (P<0.05). In the validation cohort, there was still statistically significant differences between the Rad-score and the FRS (P<0.05). The detailed results of the discrimination power are shown in Figure 4A and B.
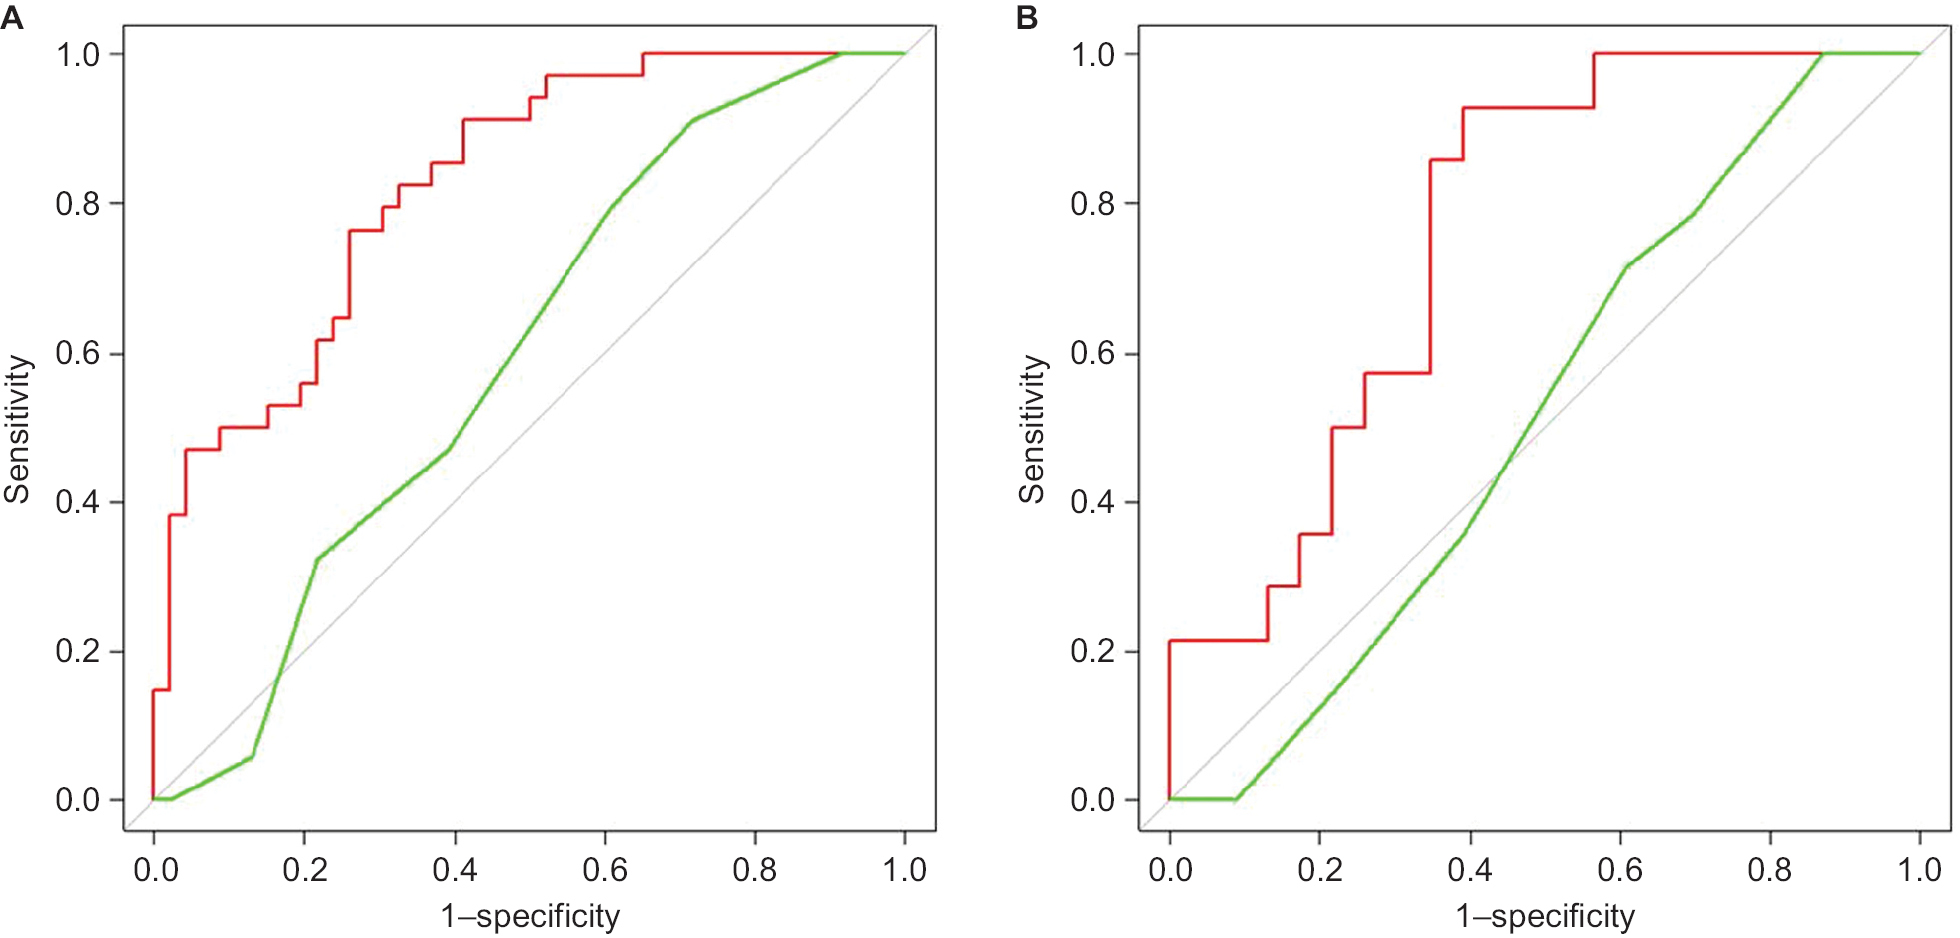 | Figure 4 ROC curve of Rad-score and FRS. Notes: (A) ROC curve of Rad-score in the training cohort (red). ROC curve of FRS in the training cohort (green) (0.8248 vs 0.5930, P<0.05). (B) ROC curve of Rad-score in the training cohort (red); ROC curve of FRS in the validation cohort (green) (0.7609 vs 0.5202, P<0.05). Abbreviations: FRS, fistula risk score; Rad-score, radiomics score; ROC, receiver operating characteristic. |
Discussion
In the present study, a new approach was conducted to predict the incidence of POPF with patients who underwent PD. The results of the present study support our hypothesis that potential POPF-predictive imaging biomarker which contain pancreatic features in a radiomics context can well predict POPF.
Texture analysis is a form of quantitative image processing that is used to evaluate the spatial interrelationships of pixel intensities and is useful in medical (clinical) practice.23–25 Radiomics is a class of quantitative imaging features of texture analysis and is considered as a potential bridge between medical imaging and personalized precise medicine.12
Radiomics was originally focused on tumor tissues. However, several findings considered that radiomics could also be applied to nonneoplastic lesions.15,16 There is no study that has previously used radiomics approach to predict POPF.
For the construction of the Rad-score calculation formula, 1,219 candidate radiomics features were reduced to 11 potential predictors by LASSO method. Based on the formula, we found that patients who had experienced POPF generally had a statistically higher Rad-score than those who had not suffered from POPF in the primary cohort, and the same was also confirmed in the validation cohort. The result suggests that patients with higher Rad-scores are at greater risk of developing POPF. The radiomics signature demonstrated adequate discrimination with an AUC of 0.8248 in the primary cohort and 0.7609 in the validation cohort, respectively. The result also suggests that this model has a good predictive ability.
In recent years, a number of countries have successfully established a variety of systems for predicting POPF.8 In 2011, Yamamoto et al conducted an indicator, including five parameters to assess the risk of pancreatic fistula, and it had good accuracy after clinical verification, but the acquisition of the indicators requires cumbersome measurement and calculation.26
Roberts et al established a predictive model based on the BMI index and the main pancreatic duct diameter, and the model has been further verified.27 Gaujoux et al established a predictive model based on BMI index, pancreatic defibration, and pancreatic steatosis while Graham et al established a predictive model based on age, BMI index, pancreatic duct diameter, and amylase on the first day after surgery.28,29 The above two sets of predictive models require the precise determination of postoperative indicators and have not been verified.
Compared to other predictive systems, FRS system that was proposed by Callery et al is only used for the prediction of postoperative clinical pancreatic fistula.19 It is of great value for clinical prediction of grade B and C pancreatic fistula. The FRS system is easily grasped by clinicians and helps to better predict the occurrence of pancreatic fistula in clinical work. There are three external validation articles to confirm the usefulness of this approach.30–32 Because of the above reasons, the FRS is widely used in the clinical practice.
In the present study, the performance of the Rad-score is good and superior to the performance of FRS system, and hence we think radiomics could well apply to predict POPF. However, we can see that one discrepancy of note between the current and original studies is the lower AUC (0.5930 or 0.5202) that was found in the present study and it was abnormally lower than the original study. This difference might be due to characteristics of the patients, particular POPF risk factor profiles, variations in management styles between surgeons, and different definitions of predictive fistula at the end point. A large-scale sample of prospective study is required for high-quality evidence.
In our study, the POPF (+) group includes BL, grade B, and grade C. The reason for this classification is that although this will increase the incidence of pancreatic leakage, early prevention is the key to complications, so it is necessary to improve the sensitivity of the diagnosis for early intervention. (At our institution, this involves amylase-rich effluents that exceed 375 IU/L. Those below are designated in the “no fistula” group.)
There are several potential limitations to this study. The major limitation is its retrospective nature. The result we obtained is from a single-center study and it does not have a large number of patients, and lacked external validation from other hospitals. Since the present study is a retrospective study, based on available variables, we only compared the formula to some of the proposed methods. Multicenter large-scale samples are required for high-quality evidence for future clinical applications. But this study shows us the possibility that radiomics can be applied for the prediction of POPF.
Conclusion
A novel radiomics-based formula was developed and validated for predicting POPF in patients who underwent PD. The formula provides a new method for identifying POPF risks and may improve informed decision-making in the prevention of POPF at low cost.
Acknowledgments
This work was partly supported by the grants as follows: the National Natural Science Foundation of China Program (U1401254, U1613221, and 81601576), the National Key Research and Development Program (2016YFC0106500/1/2 and SQ2017ZY040217/03), the Guangdong Scientific and Technology Program (2015B020214005 and 2016A030313180), the Shenzhen Key Basic Science Program (JCYJ20170413162213765), and the Shenzhen Key Laboratory Program (ZDSYS201707271637577).
Disclosure
The authors report no conflicts of interest in this work.
References
McMillan MT, Vollmer CM Jr, Asbun HJ, et al. The characterization and prediction of ISGPF Grade C fistulas following pancreatoduodenectomy. J Gastrointest Surg. 2016;20(2):262–276. | ||
Hackert T, Hinz U, Pausch T, et al. Postoperative pancreatic fistula: we need to redefine grades B and C. Surgery. 2016;159(3):872–877. | ||
Kimura W, Miyata H, Gotoh M, et al. A pancreaticoduodenectomy risk model derived from 8575 cases from a national single-race population (Japanese) using a web-based data entry system: the 30-day and in-hospital mortality rates for pancreaticoduodenectomy. Ann Surg. 2014;259(4):773–780. | ||
Bassi C, Marchegiani G, Dervenis C, et al; International Study Group on Pancreatic Surgery (ISGPS). The 2016 update of the International Study Group (ISGPS) definition and grading of postoperative pancreatic fistula: 11 Years After. Surgery. 2017;161(3):584–591. | ||
Cameron JL, Riall TS, Coleman J, Belcher KA. One thousand consecutive pancreaticoduodenectomies. Ann Surg. 2006;244(1):10–15. | ||
Enestvedt CK, Diggs BS, Cassera MA, Hammill C, Hansen PD, Wolf RF. Complications nearly double the cost of care after pancreaticoduodenectomy. Am J Surg. 2012;204(3):332–338. | ||
Allen PJ, Gönen M, Brennan MF, et al. Pasireotide for postoperative pancreatic fistula. N Engl J Med. 2014;370(21):2014–2022. | ||
Sandini M, Malleo G, Gianotti L. Scores for prediction of fistula after pancreatoduodenectomy: a systematic review. Dig Surg. 2016;33(5):392–400. | ||
Aerts HJ, Velazquez ER, Leijenaar RT, et al. Decoding tumour phenotype by noninvasive imaging using a quantitative radiomics approach. Nat Commun. 2014;5:4006. | ||
Gillies RJ, Kinahan PE, Hricak H. Radiomics: images are more than pictures, they are data. Radiology. 2016;278(2):563–577. | ||
Yip SS, Aerts HJ. Applications and limitations of radiomics. Phys Med Biol. 2016;61(13):R150–R166. | ||
Lambin P, Leijenaar RTH, Deist TM, et al. Radiomics: the bridge between medical imaging and personalized medicine. Nat Rev Clin Oncol. 2017;14(12):749–762. | ||
Hanania AN, Bantis LE, Feng Z, et al. Quantitative imaging to evaluate malignant potential of IPMNs. Oncotarget. 2016;7(52):85776–85784. | ||
Permuth JB, Choi J, Balarunathan Y, et al; Florida Pancreas Collaborative. Combining radiomic features with a miRNA classifier may improve prediction of malignant pathology for pancreatic intraductal papillary mucinous neoplasms. Oncotarget. 2016;7(52):85785–85797. | ||
Kolossváry M, Karády J, Szilveszter B, et al. Radiomic features are superior to conventional quantitative computed tomographic metrics to identify coronary plaques with Napkin-ring sign. Circ Cardiovasc Imaging. 2017;10(12):e006843. | ||
van den Burg EL, van Hoof M, Postma AA, et al. An exploratory study to detect Ménière’s disease in conventional MRI scans using radiomics. Front Neurol. 2016;7:190. | ||
Chu LC, Goggins MG, Fishman EK. Diagnosis and detection of pancreatic cancer. Cancer J. 2017;23(6):333–342. | ||
van Griethuysen JJM, Fedorov A, Parmar C, et al. Computational radiomics system to decode the radiographic phenotype. Cancer Res. 2017;77(21):e104–e107. | ||
Callery MP, Pratt WB, Kent TS, Chaikof EL, Vollmer CM Jr. A prospectively validated clinical risk score accurately predicts pancreatic fistula after pancreatoduodenectomy. J Am Coll Surg. 2013;216(1):1–14. | ||
Zauleck JP, Thallmair S, Loipersberger M, de Vivie-Riedle R. Two new methods to generate internal coordinates for molecular wave packet dynamics in reduced dimensions. J Chem Theory Comput. 2016;12(12):5698–5708. | ||
Sauerbrei W, Royston P, Binder H. Selection of important variables and determination of functional form for continuous predictors in multivariable model building. Stat Med. 2007;26(30):5512–5528. | ||
Huang Y, Liu Z, He L, et al. Radiomics signature: A potential biomarker for the prediction of disease-free survival in early-stage (I or II) non-small cell lung cancer. Radiology. 2016;281(3):947–957. | ||
Summers RM. Texture analysis in radiology: Does the emperor have no clothes? Abdom Radiol (NY). 2017;42(2):342–345. | ||
Tian F, Hayano K, Kambadakone AR, Sahani DV. Response assessment to neoadjuvant therapy in soft tissue sarcomas: using CT texture analysis in comparison to tumor size, density, and perfusion. Abdom Imaging. 2015;40(6):1705–1712. | ||
Al Ajmi E, Forghani B, Reinhold C, Bayat M, Forghani R. Spectral multi-energy CT texture analysis with machine learning for tissue classification: an investigation using classification of benign parotid tumours as a testing paradigm. Eur Radiol. 2018;28(6):2604–2611. | ||
Yamamoto Y, Sakamoto Y, Nara S, Esaki M, Shimada K, Kosuge T. A preoperative predictive scoring system for postoperative pancreatic fistula after pancreaticoduodenectomy. World J Surg. 2011;35(12):2747–2755. | ||
Roberts KJ, Hodson J, Mehrzad H, et al. A preoperative predictive score of pancreatic fistula following pancreatoduodenectomy. HPB (Oxford). 2014;16(7):620–628. | ||
Gaujoux S, Cortes A, Couvelard A, et al. Fatty pancreas and increased body mass index are risk factors of pancreatic fistula after pancreaticoduodenectomy. Surgery. 2010;148(1):15–23. | ||
Graham JA, Kayser R, Smirniotopoulos J, Nusbaum JD, Johnson LB. Probability prediction of a postoperative pancreatic fistula after a pancreaticoduodenectomy allows for more transparency with patients and can facilitate management of expectations. J Surg Oncol. 2013;108(2):137–138. | ||
Miller BC, Christein JD, Behrman SW, et al. A multi-institutional external validation of the fistula risk score for pancreatoduodenectomy. J Gastrointest Surg. 2014;18(1):172–179; discussion 179–80. | ||
Shubert CR, Wagie AE, Farnell MB, et al. Clinical risk score to predict pancreatic fistula after pancreatoduodenectomy: independent external validation for open and laparoscopic approaches. J Am Coll Surg. 2015;221(3):689–698. | ||
McMillan MT, Vollmer CM Jr, Asbun HJ, et al. The characterization and prediction of ISGPF Grade C fistulas following pancreatoduodenectomy. J Gastrointest Surg. 2016;20(2):262–276. |
Supplementary materials
CT image acquisition
All patients underwent contrast-enhanced abdominal CT using a Philips Brilliance 64-MDCT scanner. The scanning parameters included a current of 200 mA, voltage of 120 kV, rotation time of 0.5 seconds, detector combination of 0.625×64 mm, pitch of 0.894, and bed speed of 47.5 mm/s. After non-enhanced CT, thin slice and dynamic abdominal three-phase tomography were performed after an intravenous contrast agent, namely nonionic Iopamiro was administered. Each patient received 80–100 mL of vascular contrast agents at a rate of 5 mL/s with a pump injector. Arterial phase scan, which was automatically triggered 8 seconds after the vascular CT value of diaphragm portion of the abdominal aorta reached 100 HU, was achieved by contrast tracking. The portal venous phase scan was started with the same standard and with a 60 second delay. Contrast-enhanced CT data were reconstructed to a thickness of 1.0 mm.
Portal venous phase CT images were chosen for segmentation and radiomics feature extraction for two reasons: 1) good differentiation of the tumor tissue and pancreatic parenchyma from other tissues was evident; and 2) several previous studies have shown that the analysis of radiomics features in this phase is useful and that the analysis of this phase is the condign standard for most institutions.1–3
Segmentation of ROIs
The ROIs of this study only included the remaining pancreatic parenchyma portion that the tumor was removed from, after PD. Portal venous phase CT data were retrieved from the institution archive. By using the Medical Imaging Interaction Toolkit, ROI of the largest cross-sectional area was initially depicted around the tumor contour. The ROI was further refined by excluding air regions having a range of thresholds from which any pixels with attenuation values <−50 HU and >300 HU were removed from the analysis. In total, 1,219 imaging texture features from the category of histogram were finally extracted.
Radiomics features
The PyRadiomics software (http://www.radiomics.io/index.html) was used to compute image features. All of the features can be found on the website https://pyradiomics.readthedocs.io/en/latest/features.html.4–5
We obtained a total number of 1,219 CT image features from pancreatic parenchyma. Because the tumor was totally removed after PD, we do not consider that the preoperative heterogeneous analysis of lesions is necessary. Finally, we choose to evaluate some targeted features for pancreatic parenchyma, which are divided into the following four groups:
- Group 1: first-order features for pancreatic parenchyma.
- Group 2: shape- and size-based features for pancreatic parenchyma.
- Group 3: textural features for pancreatic parenchyma.
- Group 4: wavelet features for pancreatic parenchyma.
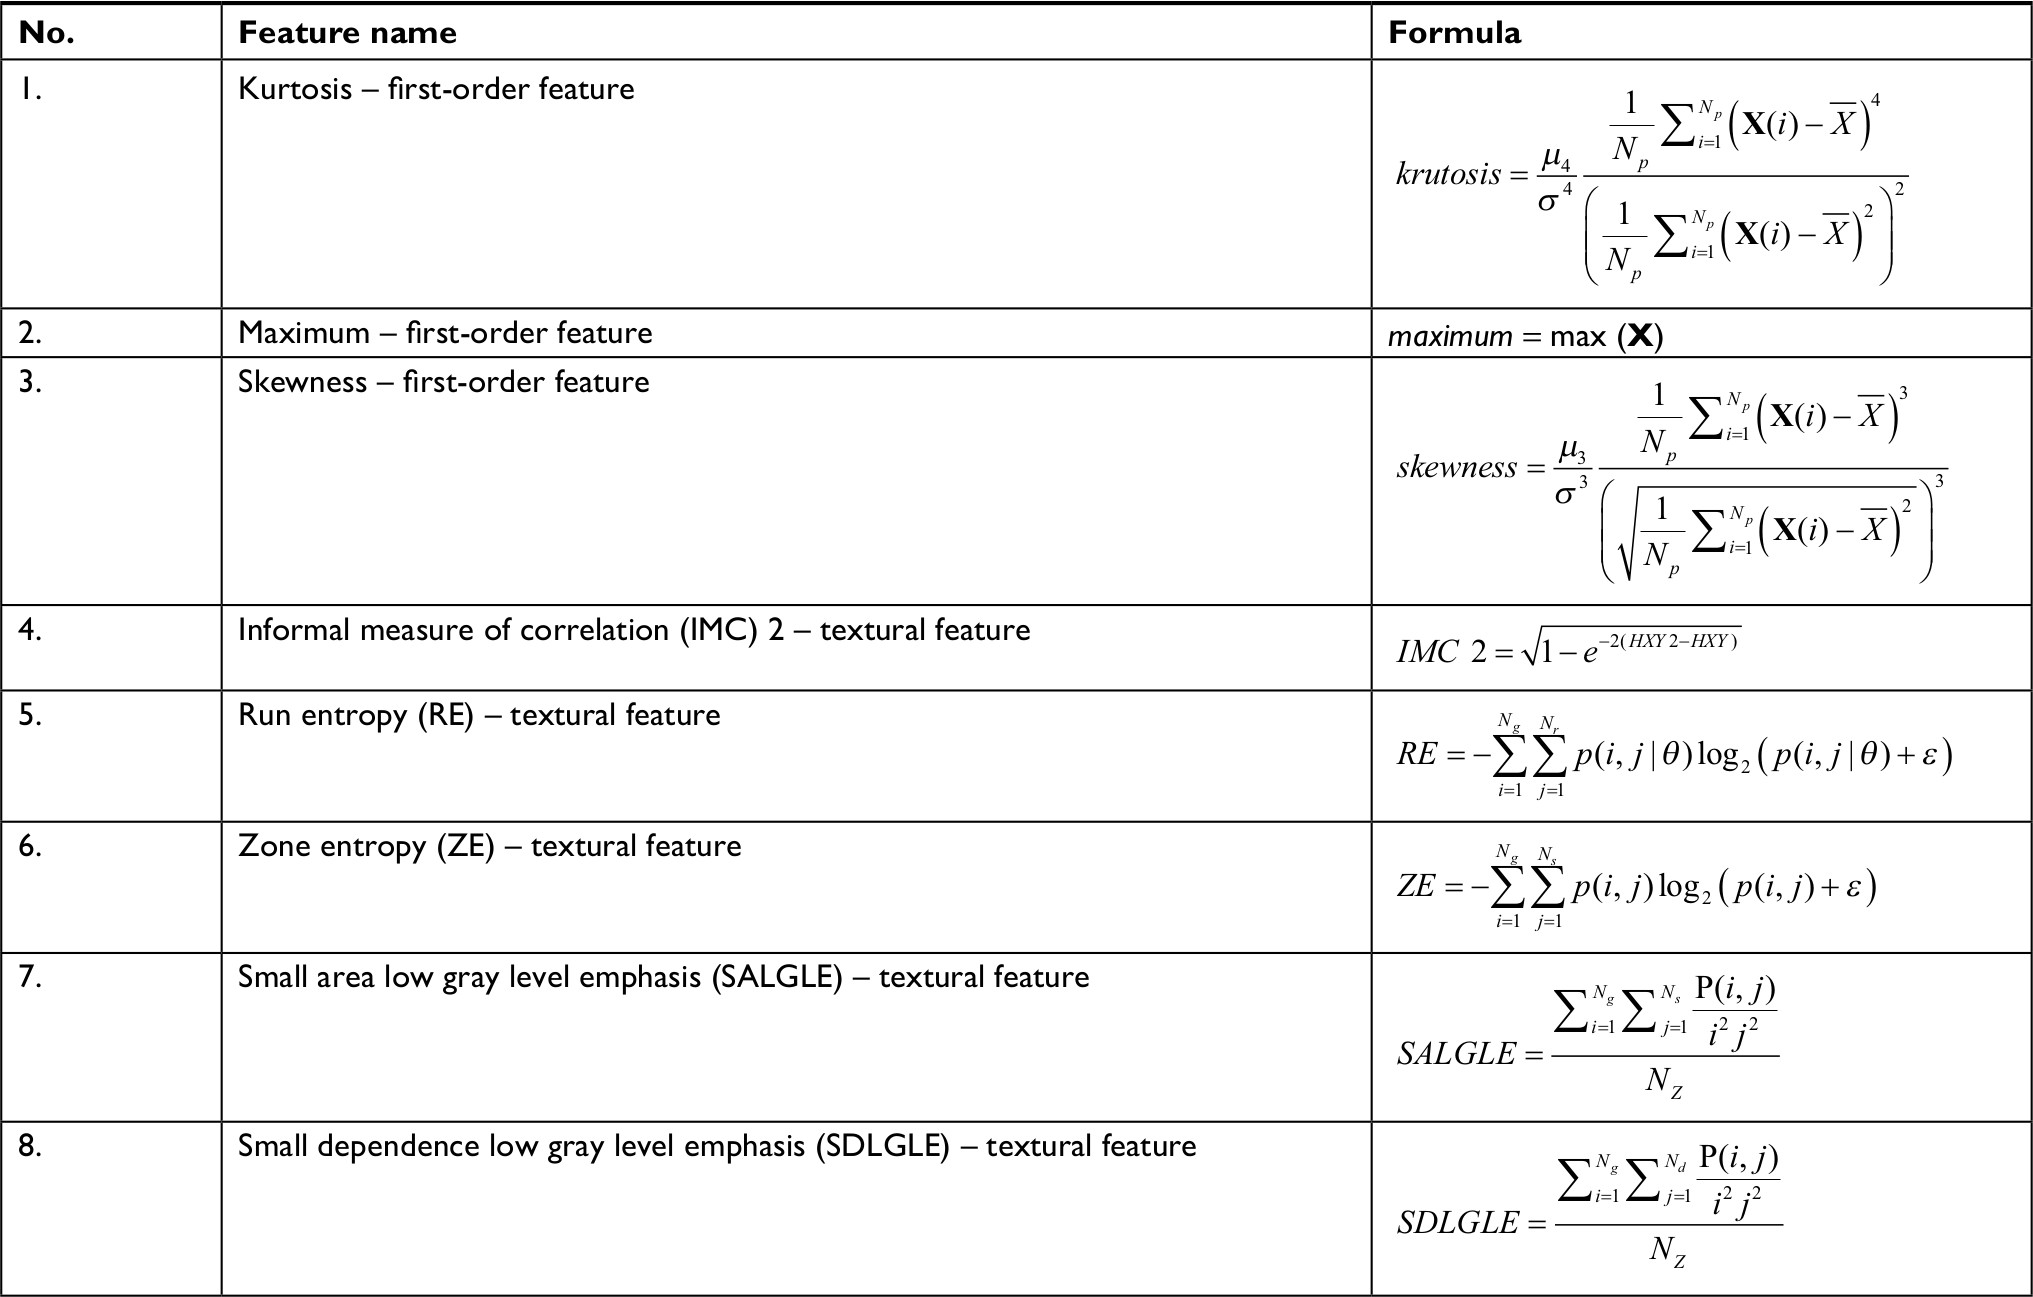 |
We only show the corresponding features of Rad-score calculation formula, and their description can be found on the website.5
References
Chu LC, Goggins MG, Fishman EK. Diagnosis and detection of pancreatic cancer. Cancer J. 2017;23(6):333–342. | ||
Hanania AN, Bantis LE, Feng Z, et al. Quantitative imaging to evaluate malignant potential of IPMNs. Oncotarget. 2016;7(52):85776–85784. | ||
Permuth JB, Choi J, Balarunathan Y, et al; Florida Pancreas Collaborative. Combining radiomic features with a miRNA classifier may improve prediction of malignant pathology for pancreatic intraductal papillary mucinous neoplasms. Oncotarget. 2016;7(52):85785–85797. | ||
van Griethuysen JJM, Fedorov A, Parmar C, et al. Computational radiomics system to decode the radiographic phenotype. Cancer Res. 2017;77(21): e104–e107. | ||
Pyradiomics. Radiomic features [2016]. Available from: https://pyradiomics.readthedocs.io/en/latest/features.html. Accessed October 25, 2018. |
 © 2018 The Author(s). This work is published and licensed by Dove Medical Press Limited. The
full terms of this license are available at https://www.dovepress.com/terms
and incorporate the Creative Commons Attribution
- Non Commercial (unported, 3.0) License.
By accessing the work you hereby accept the Terms. Non-commercial uses of the work are permitted
without any further permission from Dove Medical Press Limited, provided the work is properly
attributed. For permission for commercial use of this work, please see paragraphs 4.2 and 5 of our Terms.
© 2018 The Author(s). This work is published and licensed by Dove Medical Press Limited. The
full terms of this license are available at https://www.dovepress.com/terms
and incorporate the Creative Commons Attribution
- Non Commercial (unported, 3.0) License.
By accessing the work you hereby accept the Terms. Non-commercial uses of the work are permitted
without any further permission from Dove Medical Press Limited, provided the work is properly
attributed. For permission for commercial use of this work, please see paragraphs 4.2 and 5 of our Terms.