Back to Journals » Journal of Inflammation Research » Volume 15
A Pyroptosis-Related Gene Prognostic Index Correlated with Survival and Immune Microenvironment in Glioma
Authors Zheng J, Zhou Z, Qiu Y, Wang M, Yu H, Wu Z, Wang X, Jiang X ![]()
Received 4 October 2021
Accepted for publication 22 December 2021
Published 4 January 2022 Volume 2022:15 Pages 17—32
DOI https://doi.org/10.2147/JIR.S341774
Checked for plagiarism Yes
Review by Single anonymous peer review
Peer reviewer comments 2
Editor who approved publication: Professor Ning Quan
Jianglin Zheng,1,* Zijie Zhou,1,* Yue Qiu,2,* Minjie Wang,1 Hao Yu,1 Zhipeng Wu,1 Xuan Wang,1 Xiaobing Jiang1
1Department of Neurosurgery, Union Hospital, Tongji Medical College, Huazhong University of Science and Technology, Wuhan, People’s Republic of China; 2Department of Otolaryngology, Union Hospital, Tongji Medical College, Huazhong University of Science and Technology, Wuhan, People’s Republic of China
*These authors contributed equally to this work
Correspondence: Xuan Wang; Xiaobing Jiang
Department of Neurosurgery, Union Hospital, Tongji Medical College, Huazhong University of Science and Technology, Wuhan, People’s Republic of China
Email [email protected]; [email protected]
Purpose: As an inflammatory form of programmed cell death, pyroptosis has been well established to be associated with tumorigenesis and tumor immune microenvironment. In this paper, we aimed at the construction of a pyroptosis-related gene prognostic index (PRGPI) for predicting prognosis and guiding individualized immunotherapy in glioma patients.
Patients and Methods: Pyroptosis-related genes (PRGs) were identified based on a detailed review of published literatures. The transcriptome data and clinical information of glioma patients were obtained from CGGA and TCGA databases. PRGPI was constructed by using the multivariate Cox regression method. The immune cell infiltration level was analyzed via CIBERSORT algorithm. The tumor immune dysfunction and exclusion (TIDE) algorithm was applied to evaluate the potential response to immune checkpoint inhibitor (ICI) therapy. The expression patterns of PRGs in PRGPI were validated in cell lines and pathological specimens.
Results: We identified a total of 31 PRGs. Among them, PRGs (CASP3, DPP9, MAPK8, PELP1 and TOMM20) were selected for the construction of PRGPI. In both training (CGGA693) and validation (CGGA325 and TCGA) cohorts, PRGPI-high patients showed an inferior survival outcome compared with PRGPI-low patients. ROC curves illustrated that the prognostic prediction power of PRGPI was robust. A nomogram was developed based on independent prognostic indicators (PRGPI, age and WHO grade), and also exhibited a strong forecasting ability for overall survival (OS). Additionally, PRGPI-high patients exhibited higher immune, stroma and ESTIMATE scores, lower tumor purity, higher infiltration of M2-type macrophages, lower infiltration of CD8+ T cells and activated NK cells, higher tumor mutation burden (TMB), and higher expression of immune checkpoints. TIDE showed that PRGPI-high group had more responders of ICI therapy than PRGPI-low group. Finally, the expression patterns of five selected PRGs in PRGPI were significantly different between normal and glioma.
Conclusion: The constructed PRGPI can be used for predicting prognosis and guiding individualized immunotherapy in glioma patients.
Keywords: pyroptosis, glioma, prognosis, immune microenvironment, ICI therapy
Introduction
Glioma is the most frequent primary malignant tumor in the central nervous system,1 which is characterized by high recurrence rate and high mortality. According to the 2016 World Health Organization (WHO) classification, diffuse glioma is further categorized into lower-grade glioma (LGG, WHO II–III) and glioblastoma (GBM, WHO IV).2,3 Despite the continuous development of multiple treatment modalities, including surgical resection, chemoradiotherapy and immunotherapy, the prognosis of glioma remains dismal, especially for GBM. Based on the Central Brain Tumor Registry of the United States (CBTRUS) statistical report, the median survival time of all GBM patients (regardless of treatment) is approximately 8 months.1 Currently, therapeutic options and prognostic evaluation for glioma patients are primarily based on the WHO grading system and molecular subtypes, represented by IDH mutation, 1p19q codeletion and MGMT promoter (MGMTp) methylation, etc.4–6 However, even for the same category of glioma patients, nonnegligible heterogeneities in terms of the therapy resistance, recurrence rate, and overall survival (OS) still exist. The existing markers for glioma are unable to fully satisfy the requirements of individualized therapies and survival prediction. Thus, the identification of indicators for treatment guidance and prognosis evaluation is of utmost urgency in glioma.
Programmed cell death (PCD) is the fundamental mode under which the organism obliterates the damaged or aberrant cells.7 There are several known PCD types, including necrosis, apoptosis, necroptosis, autophagy, ferroptosis and pyroptosis. Among them, pyroptosis, an inflammatory form of PCD, is distinguished from other types by its specialized morphological traits, such as the nuclear integrity and a bit of DNA laddering, pore-formation, cell swing and osmotic lysis.8–10 Pyroptosis is triggered by caspase-1/4/5/11, which is activated by some inflammasomes.11 The cleavage of GSDMD and GSDME acts as the effector of pyroptosis, which leads to the formation of the pores and secretion of IL-1β and IL-18 from cytoplasm to microenvironment.12 Accumulating evidences have shown that pyroptosis is closely correlated with malignant tumors.13–15 The inflammatory mediators IL-1β and IL-18 can provide an environment conducive to tumorigenesis and tumor progression.16 Meanwhile, the induction of pyroptosis can also inhibit the proliferation and migration of tumor cells.11,17 Exploring the potential dual role of pyroptosis in cancer should be fruitful in cancer research. In addition, pyroptosis may be able to function as a form of immunogenic cell death (ICD) which can synergize with cancer immunotherapy. It has been reported that a biomimetic nanoparticle was generated to induce systemic anti-tumor immunity via photo-activated pyroptosis.18 An inspired chemo-photodynamic therapy using the presented nano-prodrug strategy could induce pyroptotic tumor cells, which release DAMPs, thus initiating adaptive immunity, boosting immune checkpoint inhibition (ICI) efficiency.19 Hence, the immunotherapy strategy that harnessing pyroptosis to enhance anti-tumor immune response hold significant promise.
Unfortunately, there is little research investigating the role of pyroptosis in glioma, and its correlations with prognosis and response to ICI therapy in glioma patients have never been explored. In this case, we focused on the genes involved in the regulation of pyroptosis, namely pyroptosis-related genes (PRGs), and screened prognostic PRGs to construct a pyroptosis-related gene prognostic index (PRGPI). We then evaluated the prognostic value of PRGPI in glioma patients, characterized it’s molecular and immune profiles, and explore its applications in ICI therapy. Our findings demonstrated that PRGPI was a promising prognostic and ICI therapy indicator for glioma patients.
Methods and Materials
Data Collection
RNA sequencing (RNA-seq) data and clinical information of enrolled patients were downloaded from the Chinese Glioma Genome Atlas (CGGA; http://www.cgga.org.cn/) and The Cancer Genome Atlas (TCGA; https://portal.gdc.cancer.gov/) databases. Excluding the patients with missing survival data or OS <30 days, and those without definitive histopathological, a total of 638 patients were extracted from CGGA database (mRNAseq_693 dataset) and set as the training cohort. Besides, a total of 298 patients were extracted from CGGA database (mRNAseq_325 dataset) and 550 patients were extracted from TCGA database, both of which were defined as the validation cohorts. The RNA-seq data of 1152 normal brain tissues were downloaded from the Genotype-Tissue Expression (GTEx; https://gtexportal.org/home/) database. All RNA-seq data were obtained in the format of fragments per kilobase of exon model per million mapped reads (FPKM) normalized. The clinicopathological characteristics of glioma patients in three cohorts are summarized in Table 1.
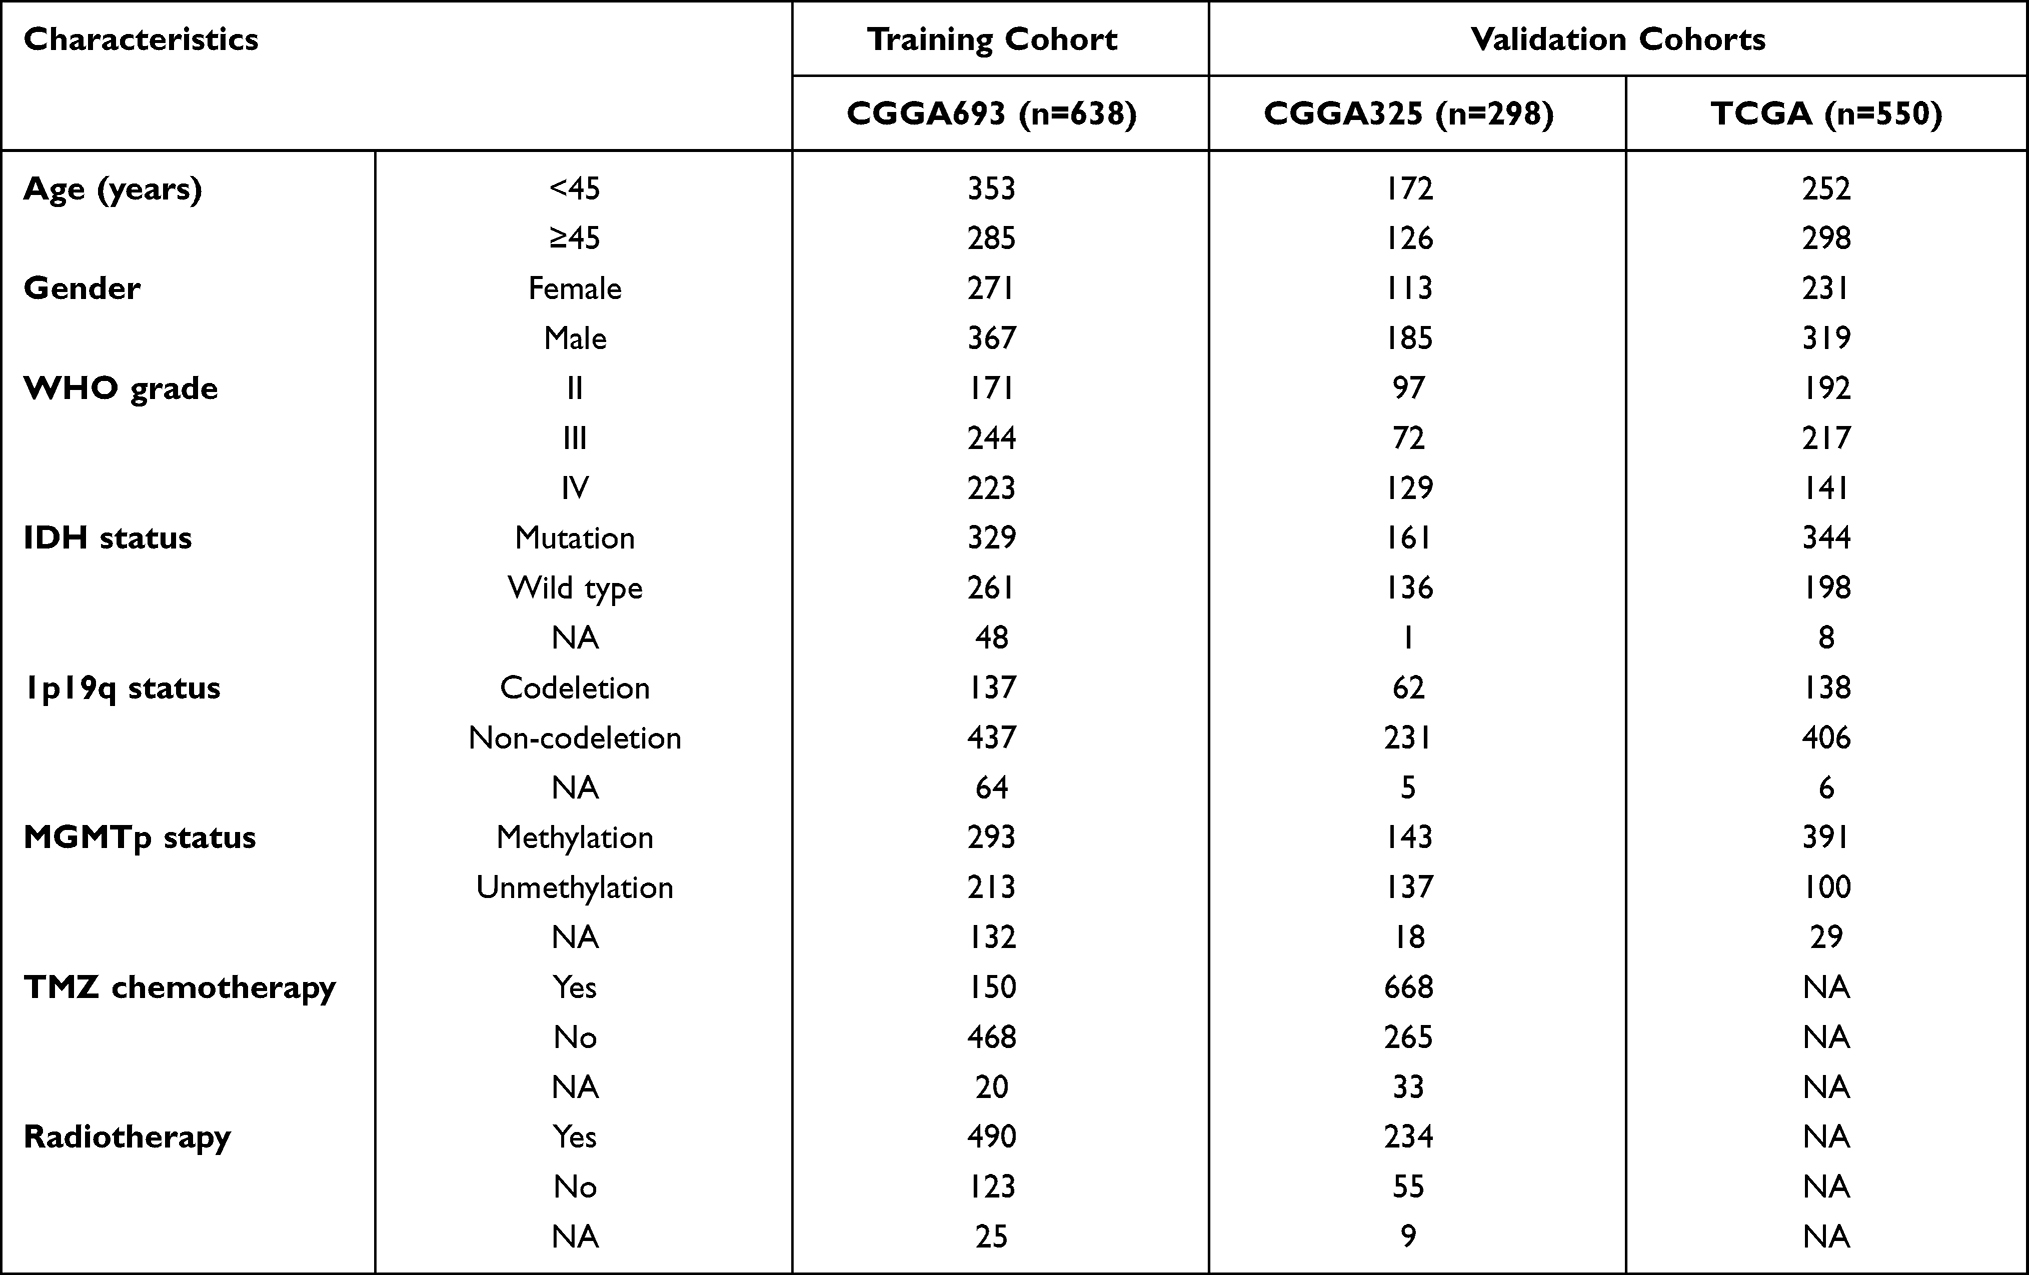 |
Table 1 Characteristics of Glioma Patients in Training and Validation Cohorts |
Expression and Prognostic Value of PRGs
Through a detailed review of published literatures, we identified a total of 31 PRGs (Supplementary Table S1). Subsequently, the expression data of 31 PRGs was normalized with log2(FPKM+1) transformation for the differential expression analysis. By using the STRING database (https://www.string-db.org/), interactions among PRGs were presented via a protein-protein interaction (PPI) network. The minimum required interaction score was set as 0.700 (high confidence). The Gene Ontology (GO) and Kyoto Encyclopedia of Genes and Genomes (KEGG) pathway analyses were conducted for the functional annotation of PRGs via the “clusterProfiler” package of R. To identify the prognostic PRGs, univariate Cox regression analysis was performed with the criterion of p<0.05.
Construction and Validation of the PRGPI
The prognosis-associated PRGs in training cohort were incorporated into the least absolute shrinkage and selection operator (LASSO) Cox regression by using the R package “glmnet”. The minimum 10-fold cross-validation was used to select the optimal value of λ, and 10 PRGs were identified. Subsequently, the multivariate Cox regression analysis of these 10 PRGs was performed to construct the PRGPI. The calculation formula of PRGPI is shown as follows:
where  and
and  refer to the expression level of selected PRGs and corresponding coefficient in the Cox model, respectively. The median PRGPI was taken as the cut-off value to stratify patients into different PRGPI subgroups. By using the R package “survminer”, the Kaplan–Meier curve with Log rank test was plotted for the comparison of OS between PRGPI subgroups. To quantify the prognostic power of PRGPI, we performed receiver operating characteristic (ROC) curve analysis by using the R package “timeROC”. The independent prognostic value of PRGPI was determined by univariate and multivariate Cox regression analyses. All validation tests of PRGPI were performed in both training and validation cohorts. Next, we developed a nomogram based on independent prognostic factors in training cohort. The availability of this nomogram was evaluated by the C-indices and calibration curves.
Mutation Profile of Different PRGPI Subgroups
The available information on genetic alterations was obtained from TCGA database. The tumor mutation burden (TMB) was calculated as mutations per megabase (mut/Mb). Mutation annotation format (MAF) was used to store the somatic variant data. We then qualitatively and quantitatively analyzed the somatic variant data among different PRGPI subgroups by using the R package “Maftools”.
Immune Characteristics and ICI Therapy in Different PRGPI Subgroups
To determine the enrichment of differentially expressed genes (DEGs; |log2FC|>2 and adjusted p<0.05) between PRGPI-high and PRGPI-low groups, the gene set enrichment analysis (GSEA) was carried out based on the “h.all.v7.4.symbols.gmt” and “c2.cp.kegg.v7.4.symbols.gmt” gene sets by using the JAVA program. The immune scores, stromal scores, ESTIMATE scores and tumor purity of each patient were calculated using the ESTIMATE algorithm with the R package “estimate”.20 The relative proportion of 22 immune cell types for each patient was calculated through CIBERSORT (https://cibersort.stanford.edu/) algorithm with 1000 permutations.21 Moreover, we used tumor immune dysfunction and exclusion (TIDE; http://tide.dfci.harvard.edu) algorithm to evaluate the potential response to ICI therapy of each patient.22
Cell Lines and Quantitative Real-Time Polymerase Chain Reaction (qRT-PCR)
The human glioma cell lines (U87, U251 and T98G) and the normal human astrocyte (NHA) cell line were obtained from Cell Bank of the Chinese Academy of Sciences. These cell lines were cultured in a humidified incubator at 37°C and 5% CO2, and maintained in Dulbecco’s Modified Eagle Medium (DMEM) with 10% fetal bovine serum (FBS) and 1% penicillin/streptomycin (P/S). Total RNA was extracted from cells using RNAiso Plus (Takara 9109). Referring to the manufacturer instruction, cDNA was synthesized by reverse transcription using reverse transcription kit (Takara RR036A). The qRT-PCR analysis was further performed on the LightCycler 480 Real-Time PCR system using TB Green® Premix Ex Taq™ II (Takara RR820A). All expression data was normalized to GAPDH as an internal control using the 2−ΔΔCt method. All primers were chemically synthesised by Sangon Biotech (Sangon Biotech, Shanghai, China). The primer sequences were listed in Supplementary Table S2.
Tissue Samples and Immunohistochemistry (IHC)
A total of 12 paired glioma and adjacent non-tumor tissue samples were collected from 12 glioma patients (3WHO grade II, 4 WHO grade III and 5 GBM), who underwent tumor resection in the Neurosurgery Department of Wuhan Union Hospital from January 2017 to May 2019. The informed consent was acquired from each involved patient, in accordance with the Declaration of Helsinki. The ethical approval was obtained from the Medical Ethics Committee of the hospital. After that, we validated the protein level of selected PRGs through IHC experiment. All specimens were fixed with 10% formalin at room temperature, embedded in paraffin, and sectioned (4um). Briefly, the specimen slices were dewaxed, then hydrated and boiled in citrate buffer (pH=6) for 8 minutes to recover the antigen. The slices were treated with methanol containing 3% hydrogen peroxide to inactivate the endogenous peroxidase. The 3% bovine serum albumin (BSA) was incubated in phosphate buffer saline (PBS) for 30 minutes to block non-specific binding. In addition, the slices were stained with primary antibody and incubated overnight at 4°C. These sections were treated with three 5-min mild washing in PBS, followed by staining with secondary antibody (HRP polymer) for 50 minutes. Diaminobenzidine was applied before being counterstained with hematoxylin. Finally, the samples were sealed, viewed and photographed by light microscope. The primary antibodies used in this work were summarized in Supplementary Table S3. Image-ProPlus 6.0 software was used to quantify the expression of protein, which was presented as the ratio of integral optical density (IOD): IOD = average optical density × positive area.
Statistical Analysis
PERL programming language (version 5.32.0) was used to preprocess the RNA-seq data. R software (version 4.0.2) were applied for all statistical analyses and graph visualizations. The Chi-square test was executed for the comparison of categorical variables between PRGPI subgroups. The Mann–Whitney U-test was utilized to compare the continuous variables (including PRGPI, immune score, stromal score, ESTIMATE score, tumor purity, fraction of immune cells, TMB, and the expression of immune checkpoints) between two groups. The expression levels and the IOD of PRGs were compared by using the Wilcoxon test. The correlation between TMB and PRGPI was assessed through Spearman correlation analysis. Two-tailed p < 0.05 was considered statistically significant.
Results
Pyroptosis-Related Genes
The expression levels of 31 PRGs were compared between the glioma tissues from TCGA dataset and the normal brain tissues from GTEx dataset. Among these 31 PRGs, 30 DEGs were identified, including 15 upregulated genes (AIM2, CASP1, CASP3, CASP5, CIB1, DPP8, EEF2K, GSDMA, GSDMC, NFKB1, NLRC4, NLRP3, SIRT1, TOMM20 and TXNIP) and 15 downregulated genes (BAX, CARD8, CASP11, CASP4, CASP8, CIB2, DPP9, GSDMB, GSDMD, GSDME, MAP1LC3B, MAPK8, NLRP1, NR1H2 and PLEP1) in glioma tissues compared with normal brain tissues (Figure 1A). Additionally, the expression levels of most PRGs were significantly correlated with WHO grades (Supplementary Figure S1A and B). These results suggested that the PRGs might exert an influence on the malignant progression of glioma.
 |
Figure 1 Expression, function and prognosis analyses of 31 PRGs in glioma. (A) The expression comparison of PRGs between glioma tissues (TCGA) and normal brain tissues (GTEx). (B) PPI network of PRGs. Elements not connected to others were hidden. (C, D) GO and KEGG pathway analysis of PRGs. (E) Univariate Cox regression analysis of PRGs in CGGA693 cohort. * p<0.05, *** p<0.001, and ns No significance. |
The interactions among the PRGs were illustrated as the PPI network (Figure 1B). The top 10 significantly enriched GO terms and KEGG pathways for these PRGs were presented separately in Figure 1C and D. As can be seen from the GO analysis, PRGs were mainly enriched in inflammasome complex, pyroptosis and regulation of interleukin-1 beta and interleukin-1 production. The KEGG pathway analysis showed that PRGs were closely enriched in NOD-like receptor signaling pathway.
We then assessed the prognostic significance of theses 31 PRGs by performing the univariate Cox regression analysis in both CGGA693 cohort and TCGA cohort (Figure 1E and Supplementary Figure S2). A total of 20 OS-associated PRGs (all p < 0.05) were identified in CGGA693 cohort, including 17 risky factors (BAX, CARD8, CASP1, CASP3, CASP4, CASP5, CASP8, GSDME, DPP9, EEF2K, GSDMA, GSDMD, NEXN, NFKB1, NLRC4, NR1H2 and CASP11) and 3 protective factors (MAPK8, PELP1 and TOMM20) for prognosis. The result of univariate Cox regression analysis in TCGA cohort was broadly consistent with that in CGGA693 cohort.
Prognosis Differences Between PRGPI Subgroups
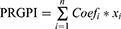
In CGGA693 cohort, twenty OS-associated PRGs were incorporated into the LASSO regression, ten of which were screened out for further multivariate Cox regression analysis (Figure 2A and B). Consequently, only five PRGs (CASP3, DPP9, MAPK8, PELP1 and TOMM20) were independent predictors for OS (Figure 2C). The Kaplan–Meier survival curves of five selected PRGs were shown in Supplementary Figure S2. Then, a prognostic index was constructed and calculated by the following formula: PRGPI = (0.400 * expression level of CASP3) + (0.330 * expression level of DPP9) + (−0.236 * expression level of MAPK8) + (−0.427 * expression level of PELP1) + (−0.323 * expression level of TOMM20).
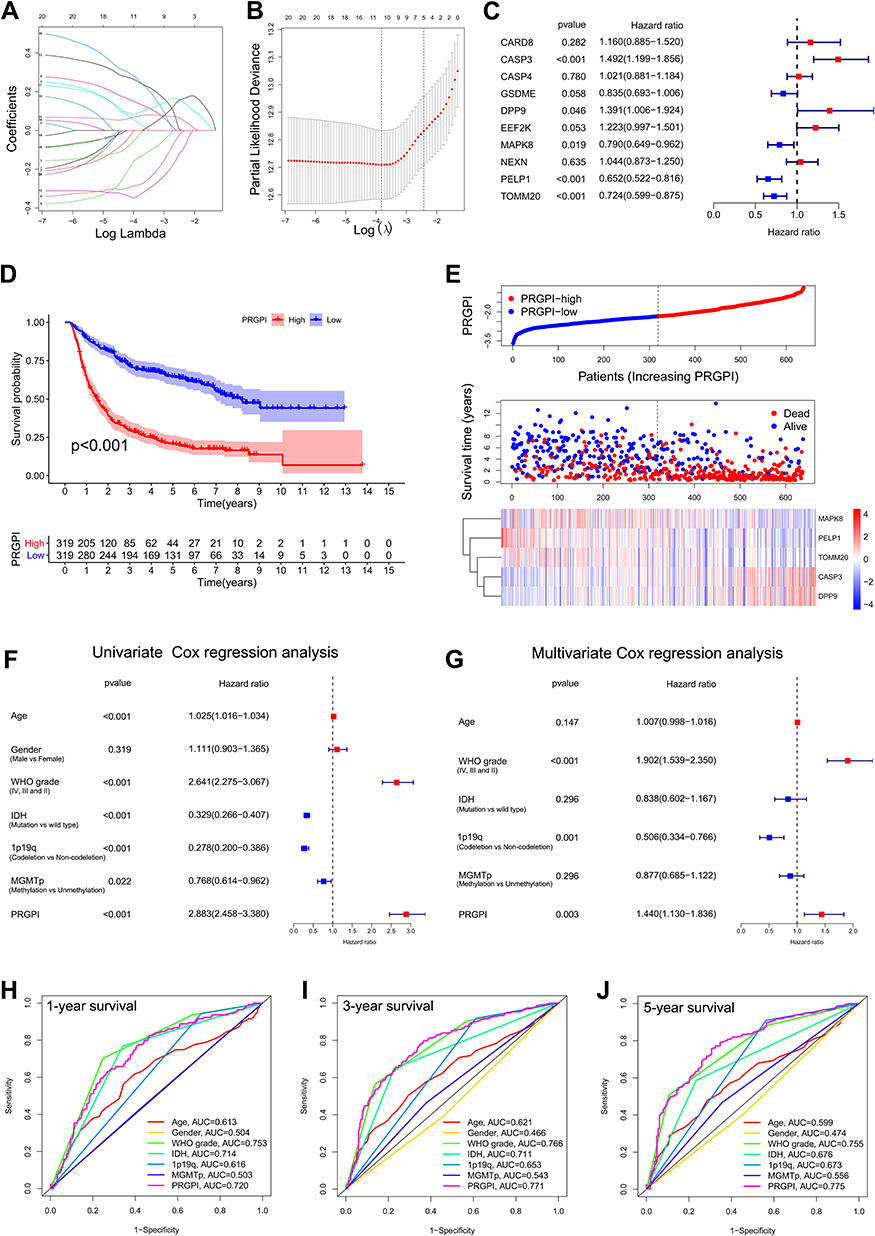 |
Figure 2 Construction and validation of the PRGPI in CGGA693 cohort. (A and B) The LASSO regression was performed with the minimum criteria. (C) Multivariate Cox regression was used to construct a PRGPI. (D) Kaplan–Meier curves of PRGPI subgroups for survival. (E) The distribution plots of PRGPI, survival status and expression of five selected PRGs. (F and G) Univariate and multivariate Cox regression analyses for identifying independent prognostic factors. (H–J) ROC curve analysis of PRGPI and clinicopathological characteristics in predicting 1-, 3- and 5-year OS. |
With the median PRGPI as the cut-off value, we categorized glioma patients into different PRGPI subgroups. In CGGA693cohort, PRGPI-high patients had a shorter OS than PRGPI-low patients (Figure 2D). The heterogeneity of OS between PRGPI-high/-low patients remained significant in the subgroups based on different clinicopathological characteristics (Supplementary Figure S3). PRGPI and survival status distributions showed that patients with higher PRGPI had shorter OS and more dead status (Figure 2E). Moreover, significant differences were observed between PRGPI subgroups with respect to age, WHO grade, IDH status and 1p19q status (Supplementary Table S4). According to Univariate Cox regression analysis, age, WHO grade, IDH status, 1p19q status, MGMTp status and PRGPI were significantly correlated with the OS of glioma patients (Figure 2F). It was confirmed by Multivariate Cox regression analysis that PRGPI was an independent prognostic factor after being adjusted for other clinicopathological characteristics (Figure 2G and Supplementary Table S5). The ROC curves showed that PRGPI had a strong ability to predict OS (1-year AUC = 0.720, 3-year AUC = 0.771, 5-year AUC = 0.775; Figure 2H–J). The accuracy of PRGPI was highest in predicting 3-year and 5-year OS compared with other clinicopathological characteristics.
Then, the prognostic power of PRGPI was validated in CGGA325 and TCGA cohorts. A significantly shorter OS was observed in PRGPI-high patients (Figure 3A and B). PRGPI and survival status distributions also showed that the higher the PRGPI, the shorter OS and the more dead status (Figure 3C and D). The ROC curves confirmed the potent capability of PRGPI to predict OS in both CGGA325 cohort (1-year AUC = 0.724, 3-year AUC = 0.793, 5-year AUC = 0.816; Figure 3E) and TCGA cohort (1-year AUC = 0.817, 3-year AUC = 0.847, 5-year AUC = 0.796; Figure 3F). Furthermore, PRGPI was still verified as an independent prognostic factor after being adjusted for other clinicopathological characteristics in these two cohorts (Supplementary Figure S4 and Supplementary Table S5).
 |
Figure 3 Validation of PRGPI in CGGA325 and TCGA cohorts. (A and B) Kaplan–Meier curves of PRGPI subgroups for survival in CGGA325 and TCGA cohorts. (C and D) The distribution plots of PRGPI, survival status and expression of five selected PRGs in CGGA325 and TCGA cohorts. (E and F) ROC curve analysis of PRGPI in predicting 1-, 3- and 5-year OS in CGGA325 and TCGA cohorts. |
Nomogram Construction and Evaluation
Based on the independent prognostic indicators in CGGA693 cohort, we constructed a nomogram to predict the 1-, 3- and 5-year OS of glioma patients (Figure 4A). The C-indices of this nomogram were 0.81 ± 0.03 in CGGA693 cohort, 0.83 ± 0.05 in CGGA325 cohort, and 0.81 ± 0.03 in TCGA cohort. The calibration plots exhibited a perfect fit between the actual and nomogram-predicted probability of 1-, 3- and 5-year OS in all three cohorts (Figure 4B–D). Importantly, these results indicated that the nomogram had the potential to develop into a quantitative tool to predict the prognosis of glioma patients.
 |
Figure 4 Construction and evaluation of a nomogram. (A) A nomogram was constructed based on PRGPI, 1p19q codeletion status and WHO grade in CGGA693 cohort. (B–D) Calibration curves showing the concordance between predicted and observed 1-, 3- and 5-year OS in CGGA693, CGGA325 and TCGA cohorts. |
Immune Characteristics of Different PRGPI Subgroups
In CGGA693 cohort, the gene set enrichment analysis (GSEA) revealed that the gene sets of PRGPI-high patients were enriched in immune-related pathways (p < 0.05, FDR < 0.25; Figure 5A), including antigen processing and presentation, B cell receptor signaling pathway, T cell receptor signaling pathway and interferon gamma response, etc. Further analysis showed that the PRGPI-high patients had significantly higher immune, stromal, and ESTIMATE scores, but lower tumor purity compared with the PRGPI-low patients (Figure 5B). Next, we compared the distribution of immune cells in different PRGPI subgroups. Significant difference in the distribution of immune cells was observed in PRGPI-high patients with higher infiltration of CD4+ T cells memory resting, T cells gamma delta, M0-type macrophages, M1-type macrophages, M2-type macrophages, activated dendritic cells and neutrophils, but lower infiltration of B cells memory, CD8+ T cells, CD4+ T cells naïve, activated NK cells and monocytes (Figure 5C). The proportion of immune cells, and the clinicopathologic characteristics of different PRGPI subgroups, are displayed in Figure 5D. Moreover, similar differences in the immune characteristics of different PRGPI subgroups were observed in TCGA cohort (Supplementary Figure S5).
 |
Figure 5 The immune microenvironment of different PRGPI subgroups in CGGA693 cohort. (A) Gene set enrichment analysis (GSEA) in PRGPI-high group (p < 0.05, FDR < 0.25). (B) The comparison of immune score, stromal score, ESTIMATE score and tumor purity between PRGPI-high and PRGPI-low groups. (C) The infiltration of 22 immune cells in PRGPI-high and PRGPI-low groups. (D) The proportions of 22 immune cells, and the clinicopathologic characteristics of different PRGPI subgroups. * p<0.05, ** p<0.01, *** p<0.001, and ns No significance. |
Mutation Profile of Different PRGPI Subgroups
To get further insight into the immunologic nature of different PRGPI subgroups, we analyzed the genetic mutation profile in TCGA cohort. We identified the top 20 genes with the highest mutation rates in PRGPI subgroups (Figure 6A and B). The mutation of TP53, IDH1, ATRX and TTN were frequent in both PRGPI-high and PRGPI-low groups. The top 1 gene was TP53 in PRGPI-high group, and IDH1 in PRGPI-low group. The mutation of EGFR was more common in PRGPI-high group, but the mutation of CIC was more common in PRGPI-low group. Next, we found that TMB of PRGPI-high patients was significantly higher than that of PRGPI-low patients (Figure 6C), and there was a positive correlation between TMB and PRGPI (Figure 6D). The Kaplan–Meier survival curve for the combination of PRGPI and TMB showed significant differences in survival outcome, which was the worst for patients with high PRGPI and high TMB, but the best for patients with low PRGPI and low TMB (Figure 6E).
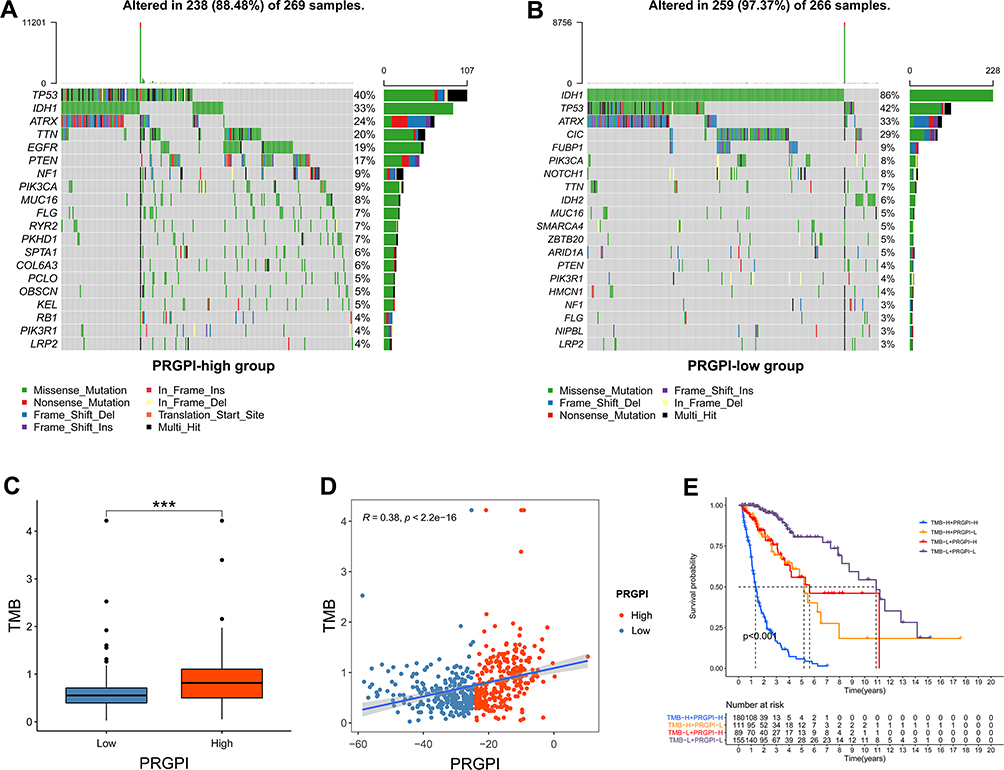 |
Figure 6 The mutation profile and tumor mutation burden (TMB) of different PRGPI subgroups in TCGA cohort. (A) Mutation profile in PRGPI-high group. (B) Mutation profile in PRGPI-low group. (C) The comparison of TMB between PRGPI-high group and PRGPI-low group. (D) The correlation of TMB with PRGPI. (E) Kaplan–Meier curves of different TMB and PRGPI subgroups for survival. *** p<0.001. |
Response to ICI Therapy of Different PRGPI Subgroups
In order to investigate the response to ICI therapy of different PRGPI subgroups, we first compared the expression levels of representative immune checkpoints between PRGPI-high and PRGPI-low groups. In both CGGA693 and TCGA cohorts, PRGPI-high patients had significantly higher expression levels of all seven immune checkpoints compared with PRGPI-low patients (Figure 7A and B). As clearly seen from the correlation analysis, the risky PRGs (CASP3 and DPP9) were positively correlated with nearly all immune checkpoints, but the protective gene, MAPK8, had a negative correlation with most immune checkpoints (Figure 7C and D). We then used TIDE algorithm to evaluate the potential response to ICI therapy of different PRGPI subgroups. The output information of TIDE algorithm in CGGA693 cohort and TCGA cohort was detailed in Supplementary Tables S6 and S7, respectively. In both cohorts, there were more responders of ICI therapy in PRGPI-high group compared with PRGPI-low group (CGGA693: 89/319 vs 10/319, p<0.0001 and TCGA: 36/275 vs 1/275, p<0.0001; Figure 7E and F). Consistent results were observed in subgroup analysis based on WHO grade (Supplementary Figures S6A and B, S7). Additionally, the PRGPI of responders was significantly higher than that of non-responders (Figure 7G and H). The ROC curves revealed high accuracy of PRGPI in predicting the response to ICI therapy (AUC of CGGA693 = 0.795, AUC of TCGA = 0.814; Figure 7I and J). Taken together, PRGPI may has the potential to serve as an indicator for predicting the response to ICI therapy in glioma.
 |
Figure 7 Evaluation of the PRGPI in indicating the response to ICI therapy. (A and B) The expression of immune checkpoints between PRGPI subgroups in CGGA693 and TCGA cohorts. (C and D) The correlations between immune checkpoints and five selected PRGs in CGGA693 and TCGA cohorts. (E and F) The distribution of ICI therapy responders in different PRGPI subgroups. (G and H) The comparison of PRGPI between responders and non-responders in CGGA693 and TCGA cohorts. (I and J) ROC curve analysis of PRGPI in predicting the response to ICI therapy in CGGA693 and TCGA cohorts. * p<0.05, ** p<0.01 and *** p<0.001. |
Expression Patterns of Selected PRGs
To validate the expression patterns of five selected PRGs, we detected their mRNA expression in cell lines and their protein level in glioma and adjacent non-tumor tissues. According to the results of qRT-PCR, the mRNA expressions of CASP3 and DPP9 were overall elevated in human glioma cell lines compared with NHA cell lines, while the mRNA expressions of MAPK8, PELP1 and TOMM20 showed an overall downward trend in human glioma cell lines (Figure 8A). The protein level of these five PRGs was quantified by IOD in IHC staining. Compared with adjacent non-tumor tissues, DPP9 was up-regulated, but MAPK8, PELP1 and TOMM20 were down-regulated in glioma tissues. There was no significant difference in the protein level of CASP3 between glioma and adjacent non-tumor tissues (Figure 8B). Representative pictures of IHC staining are shown in Figure 8C.
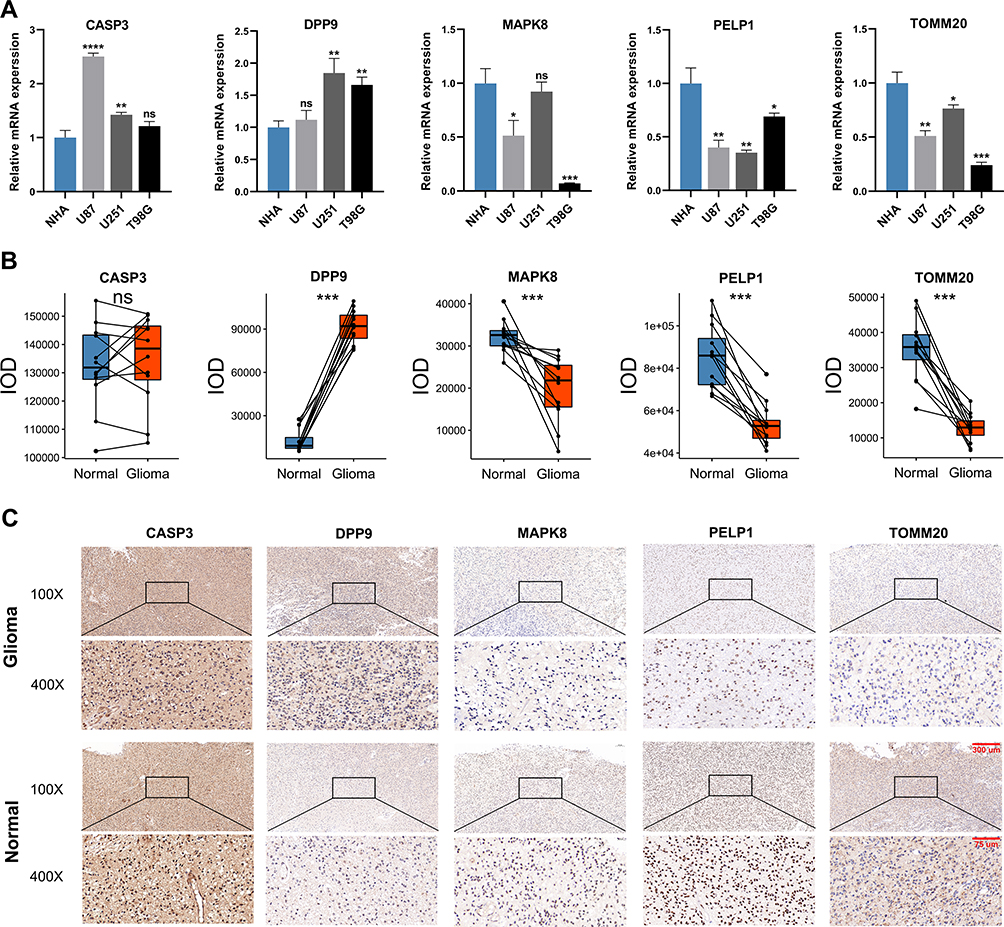 |
Figure 8 The expression patterns of five selected PRGs in cell lines and pathological specimens. (A) The expression of five selected PRGs in normal cell line, NHA, and three glioma cell lines, U87, U251, and T98G. (B) The protein level of five selected PRGs quantified by IOD in immunohistochemistry (IHC) staining. (C) Representative IHC staining of five selected PRGs in glioma and adjacent non-tumor tissues. * p<0.05, ** p<0.01, *** p<0.001, **** p<0.0001 and ns No significance. |
Discussion
Genes associated with PCD have been confirmed to function as reliable prognostic biomarkers for glioma, such as autophagy-related genes and ferroptosis-related genes.23,24 However, the role of PRGs in glioma has never been systematically investigated. As an emerging type of PCD, pyroptosis was thought to play a dual role in cancer. On one hand, inflammatory factors released by pyroptosis can promote the transformation of normal cells into tumor cells.25 On the other hand, inducing pyroptosis of tumor cells is a promising strategy to kill tumor cells.17 In addition, some studies suggested that pyroptosis is associated with tumor immune microenvironment and response to ICI therapy due to its potent proinflammatory effect.26,27 These previous findings piqued our intense interest in revealing the prognostic value of PRGs, and their correlation with anti-tumor immunity in glioma.
In this study, we identified a total of 31 currently known PRGs, most of which were differentially expressed between glioma and normal brain tissues, and were also correlated with OS of glioma patients. Next, five PRGs stood out to construct the PRGPI. Both in the training cohort and validation cohorts, PRGPI showed robust capacity in predicting the survival outcomes of glioma patients, with worse survival in PRGPI-high group and better survival in PRGPI-low group. Moreover, the prognostic value of PRGPI remained significant in patients with different clinicopathological characteristics. Univariate and multivariate Cox regression analysis demonstrated that PRGPI was an independent prognostic factor for OS. These results confirmed that PRGPI had stable power of prognosis prediction, and it could be widely applicable to glioma patients with various clinicopathological characteristics.
PRGPI was composed of five PRGs, which were CASP3, DPP9, MAPK8, PELP1 and TOMM20. Caspase 3 (CASP3) was an executioner caspase of caspases family.28 Activated CASP3 could degrade intracellular structural proteins and functional proteins, thereby inducing cell death.29 A study suggested that chemotherapy drug-activated CASP3 could trigger pyroptosis by cleaving GSDME.30 Dipeptidyl peptidase 9 (DPP9), a member of the S9B family in clan SC of the serine proteases, could cleave Xaa-Pro dipeptides from the N-termini of proteins. It has been reported that inhibiting DPP9 by Val-boroPro induce pyroptosis in human acute myeloid leukemia (AML) cell lines.31 As for mitogen-activated protein kinase 8 (MAPK8), also known as JNK1, played a pivotal role in many cellular events, including pyroptosis. The latest research reported that the phosphorylation of MAPK8 caused by lobaplatin-elevated ROS could activate caspase-3, and ultimately inducing the cleavage of GSDME and pyroptosis of colon cancer cells.32 Proline, glutamate and leucine-rich protein 1 (PELP1), a transcriptional coregulator, acted as scaffolding oncogenic protein interacting with different epigenetic modifiers.33 A study found that the miR-497-PELP1 axis targeted by metformin could induce GSDMD-mediated cell pyroptosis in esophageal squamous cell carcinoma.34 As for translocase of outer mitochondrial membrane 20 (TOMM20), it was responsible for the recognition and translocation of cytosolically synthesized mitochondrial preproteins. There was experimental evidence indicating that the oxidation and oligomerization of TOMM20 could promote pyroptotic death of melanoma cell via the BAX-CASP3-GSDME axis.35 In summary, these five selected PRGs were directly or indirectly involved in the regulation of pyroptosis in cancer. According to the available evidences, three PRGs (CASP3, MAPK8 and TOMM20) were pyroptosis promoters, and another two PRGs (DPP3 and PELP 1) were pyroptosis inhibitors. Such classification was not exactly matched with the classification of protective or risky factors for survival. One explanation is that pyroptosis may play a dual role as pro-cancer and anti-cancer simultaneously. There is currently no way to completely clear the association between pyroptosis and prognosis of patients. Another explanation is that these PRGs are correlated with other biological characteristics. For instance, CASP3 was also recognized as a marker of apoptosis.28 Furthermore, it should be mentioned that the role and mechanism of these five PRGs in pyroptosis of glioma has not been reported yet. Future experiments are deeply needed to provide more evidences.
Recently, several studies have demonstrated how pyroptosis affects the tumor microenvironment (TME) and anticancer immunity. The expression of GSDMB or GSDME was reported to sensitize cancer cells to cytotoxic lymphocyte-induced pyroptosis in a granzyme-dependent manner.36,37 Wang et al showed that pyroptosis induction in less than 15% of tumor cells led to the entire T cell-dependent clearance of mammary tumor, accompanied with increased T cells, NK cells, M1-type macrophages and decreased regulatory T cells, M2-type macrophages, neutrophils, and myeloid-derived suppressor cell populations.27 To get further biological insight into the immunologic nature of the PRGPI subgroups, we first performed GSEA, which revealed that the gene sets of the PRGPI-high patients were enriched in several immune-related pathways. Further analyses indicated that higher immune, stromal, and ESTIMATE scores, and lower tumor purity were observed in PRGPI-high group compared with PRGPI-low group. The composition of some immune cells was also different between two PRGPI subgroups. There is a fact that up to 30–50% of the immune cells in glioma are tumor-associated macrophages (TAMs).38 Previous investigators have classified TAMs into M1-type macrophages, a proinflammatory phenotype associated with a favorable survival outcome, and M2-type macrophages, an immunosuppressive phenotype associated with a poor survival outcome.39 Our results suggested that M2-type macrophages had an overwhelming advantage in numbers compared with other immune cells, and the PRGPI-high group with poor survival outcome had significantly higher enrichment of M2-type macrophages. These findings supported the previous conclusions to a certain extent. Furthermore, M2-type macrophages contribute to the formation of immunosuppressive microenvironment, which hamper for tumor-killing cells eradicating the tumor cells. Therefore, the infiltration of CD8+ T cells and activated NK cells in the PRGPI-high group was less than that in PRGPI-low group in our study, which implied that PRGPI-high group was characteristics of immunosuppression.
Next, we speculated that PRGPI-based differences in the immune characteristics might reflect different response to ICI therapy. TMB is strongly associated with the number of neoantigens arising in TME and has emerged as a novel potential biomarker in ICI therapy.40,41 In our study, the PRGPI-high group with higher TMB might yield a better response to ICI therapy. Another promising biomarker for ICI therapy is the expression of immune checkpoints, including PD-1, PD-L1, and CTLA-4 et al, which act as an immunosuppressive role by suppressing the activation of protective immune cells.42 Our results showed that PRGPI-high group had higher expression of immune checkpoints, which further indicated that ICI therapy might be more effective in PRGPI-high group. Recently, a computational method, called TIDE, has been developed to predict the ICI therapy response. It was reported that TIDE achieved a higher accuracy in predicting the outcome of melanoma patients treated with first-line anti-PD1 or anti-CTLA4 than other biomarkers, such as PD-L1 level and TMB.22 Thus, we applied the TIDE algorithm to estimate the response to ICI therapy in PRGPI subgroups. The results showed that there were more responders of ICI therapy in PRGPI-high group compared with PRGPI-low group in both cohorts. Consistent results were observed in subgroup analysis based on WHO grade. Further investigations revealed that the responders had higher PRGPI than non-responders. The ROC analysis confirmed a high discriminative ability of PRGPI for the response to ICI therapy. All the above results suggested that the PRGPI was a promising biomarker for predicting the response to ICI therapy in glioma.
Nonetheless, some limitations should be addressed in our study. Firstly, there is little research available on pyroptosis, especially on its mechanism in cancer. The known PRGs may be just a tip of the iceberg. Due to a lack of experimental evidence, we could not determine whether the selected PRGs also exert corresponding roles in pyroptosis pathways of glioma. Thus, further experiments would be essential to provide more conclusive evidence. Secondly, the data of genetic alterations was not available in CGGA database. We could only analyze the genetic mutation profile in TCGA cohort. Thirdly, the TIDE algorithm has only been validated in several melanoma datasets and a limited dataset of non-small cell lung cancer (NSCLC). Additional research is required to verify the relevance between TIDE results and ICI therapy benefits in glioma. Finally, the PRGPI was constructed and validated with retrospective data from public databases. Using prospective data to assess its value would be more convincing.
Conclusion
To sum up, our work fills a research gap on the prognostic analysis of PRGs in glioma. The PRGPI constructed in this study showed robust power in predicting survival outcomes of glioma patients and was correlated with immune microenvironment of glioma patients and their response to ICI therapy. We believe that our findings are able to provide valuable insights for subsequent studies and clinical practice.
Data Sharing Statement
Publicly available datasets were analyzed in this study. These data can be found here: the data analyzed in this study can be acquired in the TCGA (https://portal.gdc.cancer.gov/), CGGA (http://www.cgga.org.cn/) and GTEx (https://gtexportal.org/home/) websites.
Acknowledgments
All authors sincerely acknowledge the contributions from the TCGA, CGGA and GTEx projects.
Funding
This work was supported by National Natural Science Foundation of China (No. 81974390).
Disclosure
The authors have declared that no competing interests exist.
References
1. Ostrom QT, Patil N, Cioffi G, et al. CBTRUS statistical report: primary brain and other central nervous system tumors diagnosed in the United States in 2013–2017. Neuro-Oncology. 2020;22(12 Suppl 2):iv1–iv96. doi:10.1093/neuonc/noaa200
2. Louis DN, Perry A, Reifenberger G, et al. The 2016 World Health Organization classification of tumors of the central nervous system: a summary. Acta Neuropathol. 2016;131(6):803–820. doi:10.1007/s00401-016-1545-1
3. Wen PY, Huse JT. 2016 World Health Organization classification of central nervous system tumors. Continuum. 2017;23(6):1531–1547. doi:10.1212/con.0000000000000536
4. Yan H, Parsons DW, Jin G, et al. IDH1 and IDH2 mutations in gliomas. N Engl J Med. 2009;360(8):765–773. doi:10.1056/NEJMoa0808710
5. Rasheed BK, Wiltshire RN, Bigner SH, Bigner DD. Molecular pathogenesis of malignant gliomas. Curr Opin Oncol. 1999;11(3):162–167. doi:10.1097/00001622-199905000-00004
6. Costello JF, Futscher BW, Tano K, Graunke DM, Pieper RO. Graded methylation in the promoter and body of the O6-methylguanine DNA methyltransferase (MGMT) gene correlates with MGMT expression in human glioma cells. J Biol Chem. 1994;269(25):17228–17237. doi:10.1016/S0021-9258(17)32544-9
7. Bedoui S, Herold MJ, Strasser A. Emerging connectivity of programmed cell death pathways and its physiological implications. Nat Rev Mol Cell Biol. 2020;21(11):678–695. doi:10.1038/s41580-020-0270-8
8. Jorgensen I, Miao EA. Pyroptotic cell death defends against intracellular pathogens. Immunol Rev. 2015;265(1):130–142. doi:10.1111/imr.12287
9. Fernandes-Alnemri T, Wu J, Yu JW, et al. The pyroptosome: a supramolecular assembly of ASC dimers mediating inflammatory cell death via caspase-1 activation. Cell Death Differ. 2007;14(9):1590–1604. doi:10.1038/sj.cdd.4402194
10. Fink SL, Cookson BT. Caspase-1-dependent pore formation during pyroptosis leads to osmotic lysis of infected host macrophages. Cell Microbiol. 2006;8(11):1812–1825. doi:10.1111/j.1462-5822.2006.00751.x
11. Fang Y, Tian S, Pan Y, et al. Pyroptosis: a new frontier in cancer. Biomed Pharmacother. 2020;121:109595. doi:10.1016/j.biopha.2019.109595
12. Liu X, Zhang Z, Ruan J, et al. Inflammasome-activated gasdermin D causes pyroptosis by forming membrane pores. Nature. 2016;535(7610):153–158. doi:10.1038/nature18629
13. Wei Q, Mu K, Li T, et al. Deregulation of the NLRP3 inflammasome in hepatic parenchymal cells during liver cancer progression. Lab Invest. 2014;94(1):52–62. doi:10.1038/labinvest.2013.126
14. Ju X, Yang Z, Zhang H, Wang Q. Role of pyroptosis in cancer cells and clinical applications. Biochimie. 2021;185:78–86. doi:10.1016/j.biochi.2021.03.007
15. Wu M, Wang Y, Yang D, et al. A PLK1 kinase inhibitor enhances the chemosensitivity of cisplatin by inducing pyroptosis in oesophageal squamous cell carcinoma. EBioMedicine. 2019;41:244–255. doi:10.1016/j.ebiom.2019.02.012
16. Carmi Y, Dotan S, Rider P, et al. The role of IL-1β in the early tumor cell-induced angiogenic response. J Immunol. 2013;190(7):3500–3509. doi:10.4049/jimmunol.1202769
17. Nagarajan K, Soundarapandian K, Thorne RF, Li D, Li D. Activation of pyroptotic cell death pathways in cancer: an alternative therapeutic approach. Transl Oncol. 2019;12(7):925–931. doi:10.1016/j.tranon.2019.04.010
18. Zhao P, Wang M, Chen M, et al. Programming cell pyroptosis with biomimetic nanoparticles for solid tumor immunotherapy. Biomaterials. 2020;254:120142. doi:10.1016/j.biomaterials.2020.120142
19. Xiao Y, Zhang T, Ma X, et al. Microenvironment-responsive prodrug-induced pyroptosis boosts cancer immunotherapy. Adv Sci. 2021;27:e2101840. doi:10.1002/advs.202101840
20. Yoshihara K, Shahmoradgoli M, Martínez E, et al. Inferring tumour purity and stromal and immune cell admixture from expression data. Nat Commun. 2013;4(1):2612. doi:10.1038/ncomms3612
21. Newman AM, Liu CL, Green MR, et al. Robust enumeration of cell subsets from tissue expression profiles. Nat Methods. 2015;12(5):453–457. doi:10.1038/nmeth.3337
22. Jiang P, Gu S, Pan D, et al. Signatures of T cell dysfunction and exclusion predict cancer immunotherapy response. Nat Med. 2018;24(10):1550–1558. doi:10.1038/s41591-018-0136-1
23. Xu Y, Li R, Li X, et al. An autophagy-related gene signature associated with clinical prognosis and immune microenvironment in gliomas. Front Oncol. 2020;10:571189. doi:10.3389/fonc.2020.571189
24. Liu HJ, Hu HM, Li GZ, et al. Ferroptosis-related gene signature predicts glioma cell death and glioma patient progression. Front Cell Dev Biol. 2020;8:538. doi:10.3389/fcell.2020.00538
25. Karki R, Kanneganti TD. Diverging inflammasome signals in tumorigenesis and potential targeting. Nat Rev Cancer. 2019;19(4):197–214. doi:10.1038/s41568-019-0123-y
26. Xi G, Gao J, Wan B, et al. GSDMD is required for effector CD8(+) T cell responses to lung cancer cells. Int Immunopharmacol. 2019;74:105713. doi:10.1016/j.intimp.2019.105713
27. Wang Q, Wang Y, Ding J, et al. A bioorthogonal system reveals antitumour immune function of pyroptosis. Nature. 2020;579(7799):421–426. doi:10.1038/s41586-020-2079-1
28. Jiang M, Qi L, Li L, Li Y. The caspase-3/GSDME signal pathway as a switch between apoptosis and pyroptosis in cancer. Cell Death Discov. 2020;6(1):112. doi:10.1038/s41420-020-00349-0
29. Yuan J, Shaham S, Ledoux S, Ellis HM, Horvitz HR. The C. elegans cell death gene ced-3 encodes a protein similar to mammalian interleukin-1 beta-converting enzyme. Cell. 1993;75(4):641–652. doi:10.1016/0092-8674(93)90485-9
30. Wang Y, Gao W, Shi X, et al. Chemotherapy drugs induce pyroptosis through caspase-3 cleavage of a gasdermin. Nature. 2017;547(7661):99–103. doi:10.1038/nature22393
31. Johnson DC, Taabazuing CY, Okondo MC, et al. DPP8/DPP9 inhibitor-induced pyroptosis for treatment of acute myeloid leukemia. Nat Med. 2018;24(8):1151–1156. doi:10.1038/s41591-018-0082-y
32. Yu J, Li S, Qi J, et al. Cleavage of GSDME by caspase-3 determines lobaplatin-induced pyroptosis in colon cancer cells. Cell Death Dis. 2019;10(3):193. doi:10.1038/s41419-019-1441-4
33. Chakravarty D, Roy SS, Babu CR, et al. Therapeutic targeting of PELP1 prevents ovarian cancer growth and metastasis. Clin Cancer Res. 2011;17(8):2250–2259. doi:10.1158/1078-0432.Ccr-10-2718
34. Wang L, Li K, Lin X, et al. Metformin induces human esophageal carcinoma cell pyroptosis by targeting the miR-497/PELP1 axis. Cancer Lett. 2019;450:22–31. doi:10.1016/j.canlet.2019.02.014
35. Zhou B, Zhang JY, Liu XS, et al. Tom20 senses iron-activated ROS signaling to promote melanoma cell pyroptosis. Cell Res. 2018;28(12):1171–1185. doi:10.1038/s41422-018-0090-y
36. Zhang Z, Zhang Y, Xia S, et al. Gasdermin E suppresses tumour growth by activating anti-tumour immunity. Nature. 2020;579(7799):415–420. doi:10.1038/s41586-020-2071-9
37. Zhou Z, He H, Wang K, et al. Granzyme A from cytotoxic lymphocytes cleaves GSDMB to trigger pyroptosis in target cells. Science. 2020;368(6494). doi:10.1126/science.aaz7548
38. Qi B, Yang C, Zhu Z, Chen H. EZH2-inhibited microRNA-454-3p promotes M2 macrophage polarization in glioma. Front Cell Dev Biol. 2020;8:574940. doi:10.3389/fcell.2020.574940
39. Zhu C, Kros JM, Cheng C, Mustafa D. The contribution of tumor-associated macrophages in glioma neo-angiogenesis and implications for anti-angiogenic strategies. Neuro-Oncology. 2017;19(11):1435–1446. doi:10.1093/neuonc/nox081
40. Conway JR, Kofman E, Mo SS, Elmarakeby H, Van Allen E. Genomics of response to immune checkpoint therapies for cancer: implications for precision medicine. Genome Med. 2018;10(1):93. doi:10.1186/s13073-018-0605-7
41. Samstein RM, Lee CH, Shoushtari AN, et al. Tumor mutational load predicts survival after immunotherapy across multiple cancer types. Nat Genet. 2019;51(2):202–206. doi:10.1038/s41588-018-0312-8
42. Okazaki T, Chikuma S, Iwai Y, Fagarasan S, Honjo T. A rheostat for immune responses: the unique properties of PD-1 and their advantages for clinical application. Nat Immunol. 2013;14(12):1212–1218. doi:10.1038/ni.2762
 © 2022 The Author(s). This work is published and licensed by Dove Medical Press Limited. The
full terms of this license are available at https://www.dovepress.com/terms
and incorporate the Creative Commons Attribution
- Non Commercial (unported, 3.0) License.
By accessing the work you hereby accept the Terms. Non-commercial uses of the work are permitted
without any further permission from Dove Medical Press Limited, provided the work is properly
attributed. For permission for commercial use of this work, please see paragraphs 4.2 and 5 of our Terms.
© 2022 The Author(s). This work is published and licensed by Dove Medical Press Limited. The
full terms of this license are available at https://www.dovepress.com/terms
and incorporate the Creative Commons Attribution
- Non Commercial (unported, 3.0) License.
By accessing the work you hereby accept the Terms. Non-commercial uses of the work are permitted
without any further permission from Dove Medical Press Limited, provided the work is properly
attributed. For permission for commercial use of this work, please see paragraphs 4.2 and 5 of our Terms.