")
Back to Journals » International Journal of General Medicine » Volume 14
A Promising Esophageal Cancer Prognostic Signature of Ferroptosis-Related LncRNA to Predict Immune Scenery and Immunotherapy Response
Authors Liu X , Shi X , Guo W, Ke Y, Li Y, Pan S, Li X, Liu M, Liu M, Wang Y, Ruan Q, Ma H
Received 2 July 2021
Accepted for publication 23 August 2021
Published 18 September 2021 Volume 2021:14 Pages 5845—5862
DOI https://doi.org/10.2147/IJGM.S327555
Checked for plagiarism Yes
Review by Single anonymous peer review
Peer reviewer comments 2
Editor who approved publication: Dr Scott Fraser
Xiaoxiao Liu,1 Xiaobo Shi,1 Wei Guo,1 Yue Ke,1 Yuxing Li,1 Shupei Pan,1 Xiaona Li,2 Mei Liu,3 Mingzhu Liu,4 Yuchen Wang,1 Qinli Ruan,1 Hongbing Ma1
1Department of Radiation Oncology, Second Affiliated Hospital of Xi’an Jiaotong University, Xi’an, 710004, People’s Republic of China; 2Department of Dermatology, Second Affiliated Hospital of Xi’an Jiaotong University, Xi’an, 710004, People’s Republic of China; 3Department of Respiratory and Critical Care Medicine, Second Affiliated Hospital of Xi’an Jiaotong University, Xi’an, 710004, People’s Republic of China; 4Department of Gastroenterology, Second Affiliated Hospital of Xi’an Jiaotong University, Xi’an, 710004, People’s Republic of China
Correspondence: Hongbing Ma
Department of Radiation Oncology, Second Affiliated Hospital of Xi’an Jiaotong University, Xi’an, 710004, People’s Republic of China
Tel +86 13991845066
Email [email protected]
Purpose: Ferroptosis and long non-coding RNA (lncRNA) expression signatures have been associated with the clinical progression and immune-contexture of different solid tumors. The study aimed to identify a prognostic signature of ferroptosis-related lncRNAs (falncRNAs) to forecast the immune scenery and immunotherapy response in esophageal cancer (EC).
Patients and Methods: Gene expression profiles of EC were extracted from The Cancer Genome Atlas (TCGA) database, and ferroptosis-related genes were downloaded from the FerrDb database, which identified differentially expressed falncRNAs (DEfalncRNAs) via differential analysis. DEfalncRNA pairs associated with prognosis were identified by constructing a matrix, univariate and least absolute shrinkage and selection operator (LASSO) analysis. The prognostic signature was constructed by multivariate analysis. We appraised the forecasting capability of prognostic signature in survival, clinicopathological features, immune landscape, efficacy of immunotherapy, and drug sensitivity. The potential molecular mechanism of signature was investigated by gene set enrichment analysis (GSEA).
Results: We obtained 18 DEfalncRNA pairs to define a novel prognostic signature that was determined on a discovery cohort of 158 tumor samples and 11 adjacent normal tissues from TCGA and internally validated, with the definition of high- vs low-risk groups based on 3 years overall survival. We demonstrated that the high- vs low-risk groups differed for clinical parameters and computationally predicted drug sensitivity and tumor immune contexture, with the high-risk group having worse survival, more aggressive disease (node involvement, metastasis), reduced drug sensitivity, higher tumor mutation load, and gene signatures of infiltration of pro-tumoral immune cell subsets. The GSEA results revealed that ferroptosis and immunoregulatory pathways were significantly enriched in the high-risk group.
Conclusion: The prognostic signature based on falncRNAs has the potential to forecast the survival, immune scenery, efficacy of immunotherapy, and drug sensitivity of EC, which is helpful for clinical prediction and individualized treatment.
Keywords: esophageal cancer, ferroptosis, lncRNA, immune, signature, prognosis
Introduction
Esophageal cancer (EC) is not only one of the most life-threatening gastrointestinal tumors but also one of the primary causes of cancer death worldwide.1,2 In the cancer statistics of the United States in 2021, the number of new invasive EC cases is approximated to be 19,260 and 15,530 deaths from EC.3 Almost half of EC patients worldwide are in China.4 The morbidity and mortality of EC in Asia are expected to increase in the coming years.5 By the high degree of malignancy, the 5-year relative survival rate of patients with EC is only 20%.3 Prognostic risk factors for EC include smoking, alcohol consumption, obesity, age, tumor staging, and pathological type.6–8 At present, surgery, chemotherapy, radiotherapy, immunotherapy, and molecular targeted therapy are the chief treatments for cancer in the world.9–11 It has been found that ferroptosis is closely correlated with tumor cell growth inhibition.12–15 Therefore, targeting ferroptosis has become a promising cancer therapeutic strategy.
Ferroptosis is distinguished from the novel mode of programmed cell death of apoptosis, necrosis, and autophagy, which is chiefly characterized by cell death induced by iron-dependent phospholipid peroxide damage occurring within mitochondria.14–16 Interferon-gamma (IFN-γ) released by CD8+T cells activated by immunotherapy downregulated the expression of SLC3A2 and SLC7A11 (two subunits of the glutamate-cystine reversal protein SystemXc-), contributing to the promotion of tumor cell peroxidation and ferroptosis.17 It has been found that ferroptosis of tumor cells is generated by synergistic inhibition of SLC7A11 expression by radiotherapy and immunotherapy.18 Ferroptosis plays a consequential role in emerging immunotherapy and provides a theoretical basis for combination therapy.
Long non-coding RNAs (lncRNAs) generally refer to a class of RNA molecules greater than 200 nucleotides in length and without protein-coding capacity.19 With the continuous deepening of research in recent years, lncRNAs have engaged much attention. LncRNA AFAP1-AS1 facilitated the migration, descent, and lung metastasis of EC cells by downregulating miR-26a.20 In addition, lncRNAs have been reported to be involved in the regulation of ferroptosis and immunity in tumor cells.21–23 LncRNAs play a vital role in the development and headway of tumors, which envisages that they may be targets for treatment.24 The only ferroptosis-based prognostic signatures in EC published so far are based on mRNA absolute gene expression levels.25,26 Prognostic signatures based on the absolute gene expression level of ferroptosis-related lncRNAs (falncRNAs) have been recently defined for other solid tumors.27–29 Remarkably, studies on the relationship between EC and falncRNAs are particularly scarce, which still needs to be further elucidated. Accordingly, the identification of falncRNAs to predict the prognosis and immune landscape and immunotherapy response of EC is helpful for the individualized treatment of patients.
In the present study, the relationship between falncRNAs and the prognosis of patients with EC was explored by analyzing gene expression profiles in The Cancer Genome Atlas (TCGA) database and a prognostic signature was established to predict survival, clinicopathological features, immune landscape, response to immunotherapy, and drug sensitivity of patients with EC.
Patients and Methods
Acquisition of EC Data
The transcriptome profiling data (RNA-Sep) and corresponding clinical data of EC were acquired from TCGA database (https://portal.gdc.cancer.gov/). The sequencing results of 160 EC tissues and 11 adjacent normal tissues were included in this study, and a total of 185 samples had clinical data including gender, age, ethnicity, Body Mass Index (BMI), alcohol status, pathological stage, histological grade, radiotherapy, survival status, and survival time. By matching 160 tumor samples with clinical data and deleting the case with the survival time of 0, a total of 158 tumor samples with transcriptome profiling data and clinical data were finally obtained for subsequent analysis. Owing to the freely accessible resource TCGA database, the study let off the institutional review board approval.
Identification of Ferroptosis-Associated lncRNAs
Human GTF explanation files were downloaded from Ensembl (http://asia.ensembl.org), a total of 19,604 mRNAs and 14,086 lncRNAs were distinguished and extracted by manipulating Strawberry Perl software. A total of 259 ferroptosis-related genes contained driver, suppressor, and marker that were extracted from the FerrDb database (http://www.zhounan.org/ferrdb), and they were presented in Supplementary Table S1.30 The correlation between ferroptosis-related genes and all lncRNAs was analyzed via the R cor.test function. To obtain falncRNAs, the filter criteria correlation coefficient and P-value were set to 0.4 and 0.001, respectively. Differentially expressed falncRNAs (DEfalncRNAs) were attained by the R limma package, which was confirmed to both P-value less than 0.05 and |logFC| more than 1 and was used to draw the heatmap and volcano plot.
Establishment of the Ferroptosis-Related lncRNA-mRNA Coexpression Network
Prognostically relevant DEfalncRNAs were obtained by univariate analysis, and the results were visualized as a forest plot. To investigate the relationship between the falncRNA and ferroptosis-associated mRNA (famRNA), it was extremely important for us to construct the falncRNA-famRNA coexpression network by Cytoscape software (version 3.6.0, https://cytoscape.org/), which was visualized as the Sankey diagram by the R ggplot2 and ggalluvial packages. Gene Ontology (GO) enrichment analysis was performed by the R GOplot package.31
Construction of DEfalncRNA Pairs
For the model of the constructed transcriptome data to be applied in the clinic, DEfalncRNAs were paired, which only needed to take into account the internal comparison of the data without considering batch correction. If the expression of lncRNA-X was lower than that of lncRNA-Y, the DEfalncRNA pair would be considered as 1, and otherwise 0, which was performed to construct the matrix.32 When the proportion of DEfalncRNA pairs was between 20% and 80% of the total pairs, DEfalncRNA pairs were regarded as a valid match.
Construction and Verification of the Prognostic Signature
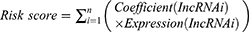
Univariate Cox regression was carried out on DEfalncRNA pairs, and the least absolute shrinkage and selection operator (LASSO) regression analysis was harnessed to further pick representative DEfalncRNA pairs associated with prognosis. Multivariate Cox regression analysis was utilized to calculate the correlation coefficient and construct a prognostic hazard model and draw a forest plot. The patient’s risk score was computed by the following equation.
According to the R survivalROC package, the receiver operating characteristic (ROC) curves were plotted and the area under the curve (AUC) of the 1-year, 2-year, and 3-year survival was calculated to weigh up the accuracy of the prognostic signature.33 The optimal cutoff value of the risk score was calculated based on the ROC curve for 3-year survival, which split EC patients into high-risk and low-risk groups. To ensure the predictive power of the prognostic model, we plotted the calibration graphs by the riskRegression package.34 Additionally, the risk model was internally validated using the Bootstrap method with 1000 equal numbers of put-back repeated samples. Comparison of survival differences between high-risk and low-risk groups was performed by the Kaplan-Meier method.35 The relationship between the risk score and survival status of patients was observed by plotting the risk curves.
Clinical Influence of Prognostic Signature and Enrichment Analysis
To demonstrate whether the prognostic hazard model could be assumed as a standalone prognostic factor, univariate and multivariate Cox regression analyses were implemented by combining the risk score with clinicopathological variables, and the results were drawn in forest plots. Compared to clinicopathological variables, the property of the prognostic hazard model was appraised by plotting multi-indicator ROC curves. We compared whether there were differences in risk score between clinical variables and the results were drawn plot boxplots. The relationship between the prognostic hazard model and clinical variables was measured by the Wilcoxon rank-sum test, and the results were visualized as a clinical relevance heatmap. Additionally, **and * represented P-value < 0.01 and 0.05, respectively. The results of the clinical role of the prognostic model were generated by the R survivalROC, limma, ggpubr, and ComplexHeatmap packages. We performed gene set enrichment analysis (GSEA) between high-risk and low-risk groups based on the GO (v7.4) and Hallmark (v7.4) gene set collections by the R clusterProfiler package.36
Condition of Tumor-Infiltrating Immune Cells in Prognostic Signature
The file of tumor-infiltrating immune cells was downloaded in TIMER2.0 (http://timer.cistrome.org/).37 Spearman correlation analysis was implemented between the prognostic signature and tumor-infiltrating immune cells to calculate the correlation coefficient, and the results were visualized as bubble charts using different software including XCELL, QUANTISEQ, MCPCOUNTER, EPIC, CIBERSORT-ABS, and CIBERSORT.38 The Wilcoxon rank-sum test was implemented to determine which immune cells were distinction in the high-risk and low-risk groups, and the results were presented in box graphs. These operations were done by the R ggplot2, ggtext, limma, and ggpubr packages.
Efficacy of Immunotherapy in Prognostic Signature
To assess the efficacy of immunotherapy, we compared whether the expression of immune checkpoints differentiated between the high-risk and low-risk groups, which were used to draw violin plots by R limma and ggpubr packages, including PD-L1 (programmed cell death protein Ligand-1), PD-1 (programmed cell death 1), CTLA-4 (cytotoxic T-lymphocyte associated protein 4), TIM-3 (T-cell immunoglobulin mucin 3), LAG-3 (Lymphocyte-activation gene 3) and TIGIT (T-cell immunoreceptor with immunoglobulin and ITIM domain). Furthermore, tumor mutation load (TMB) is an emerging and quantifiable biomarker that reflects the number of mutations contained in tumor cells.39 We downloaded data on mutations in EC from TCGA database and visualized somatic mutations in the high-risk and low-risk groups using the maftools package in R software.40
Drug Sensitivity Analysis of Prognostic Signature
To appraise the application of the prognostic model in chemotherapy and targeted therapy for EC, the Wilcoxon rank-sum test was implemented to compare whether there were discriminations in half-inhibitory concentration (IC50) between high-risk and low-risk groups, which the results were visualized as boxplots. The chemical and targeted drugs of paclitaxel, vinorelbine, cisplatin, gefitinib, lapatinib, and erlotinib were used in clinical practice for EC, which were selected for sensitivity analysis. The analysis processes were realized by R packages pRRophetic and ggplot2, and IC50 was estimated by the Genomics of Drug Sensitivity in Cancer (GDSC, https://www.cancerrxgene.org/).41
Statistical Analysis
Univariate, LASSO, and multivariate regression analyses were implemented to qualitatively investigate the appropriate molecules and variables. The survival curve was plotted using the Kaplan-Meier method, and the Log rank test was implemented for differences between groups. Wilcoxon rank-sum test was adopted to investigate the differences between high-risk and low-risk groups. All statistical analyses and visualization of results were performed with R software (version 4.0.3, http://www.r-project.org/). P < 0.05 was regarded as statistically significant.
Results
Clinical Characteristics of Patients with EC
All clinicopathological characteristics were shown in Table 1. A total of 158 patients with EC were incorporated in this study, including 98 patients (62.0%) aged less than or equal to 65 and 60 patients (38.0%) aged more than 65. Of all patients with EC, 136 (86.1%) patients were male and 22 (13.9%) patients were female. We found that the majority of patients with EC were Caucasian (61.4%). BMI < 25 kg/m2 accounted for 52.5% and ≥ 25 kg/m2 for 41.8% of all patients with EC. There were 110 EC patients with a history of alcohol consumption, which accounted for 69.6%. The pathological types of adenocarcinoma and squamous cell carcinoma accounted for half each. In addition, 42 (26.6%) patients with EC had poorly differentiated (G3). T3 (46.8%), N0 (39.9%), N1 (39.9%), and M0 (75.3%) were relatively common in tumor staging. The majority of patients (71.5%) did not accept alternative radiotherapy at presentation. Among the survival status of patients, alive and death accounted for 60.1% and 39.9%, respectively. The median survival time was 13.3 months (7.7–22.8).
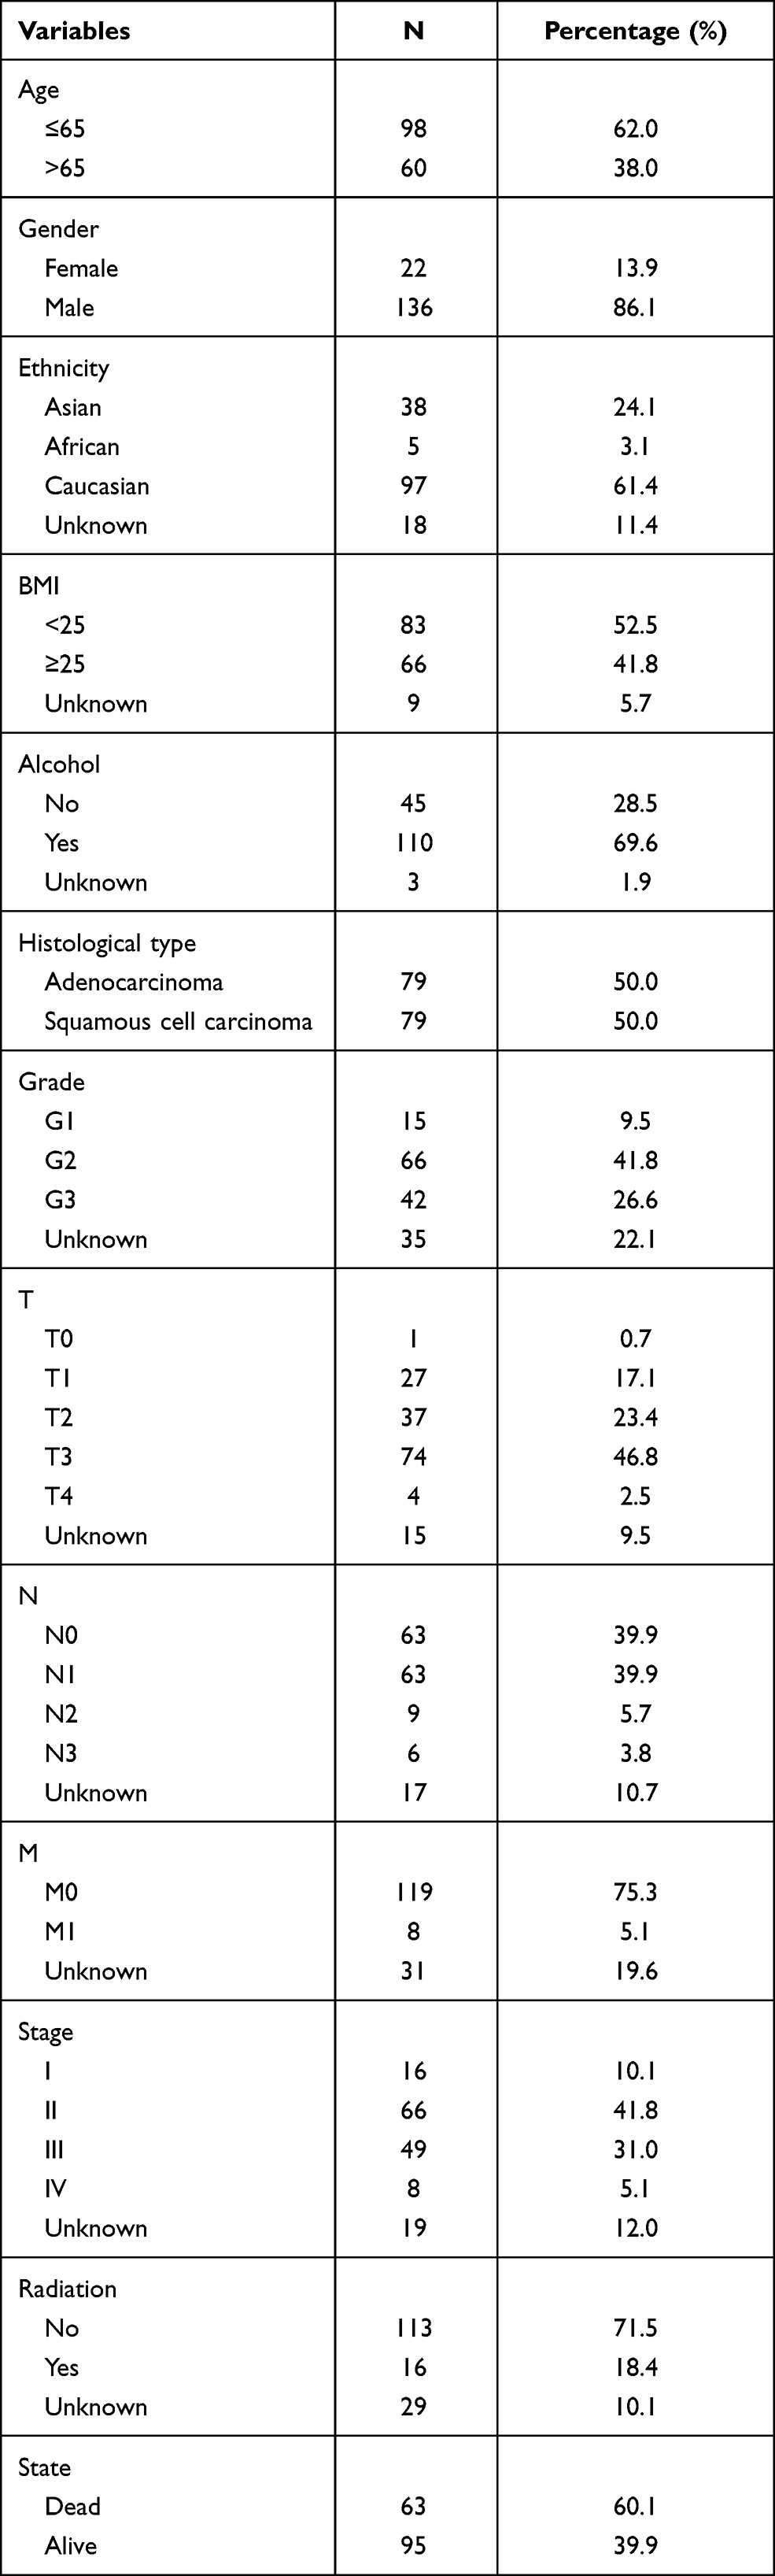 |
Table 1 Clinicopathological Characteristics of 158 Patients with EC |
Identification of Valid DEfalncRNA Pairs and Construction of the falncRNA-famRNA Coexpression Network
The screening was performed as shown in the flow chart (Figure 1). A total of 1229 falncRNAs were identified in the study. A total of 258 DEfalncRNAs were obtained by differential analysis, of which 233 were upregulated and 25 were downregulated respectively (Table S2, Figure 2). By constructing the 0 and 1 matrix, among the 258 DEfalncRNAs, we acquired 22,249 valid DEfalncRNA pairs.
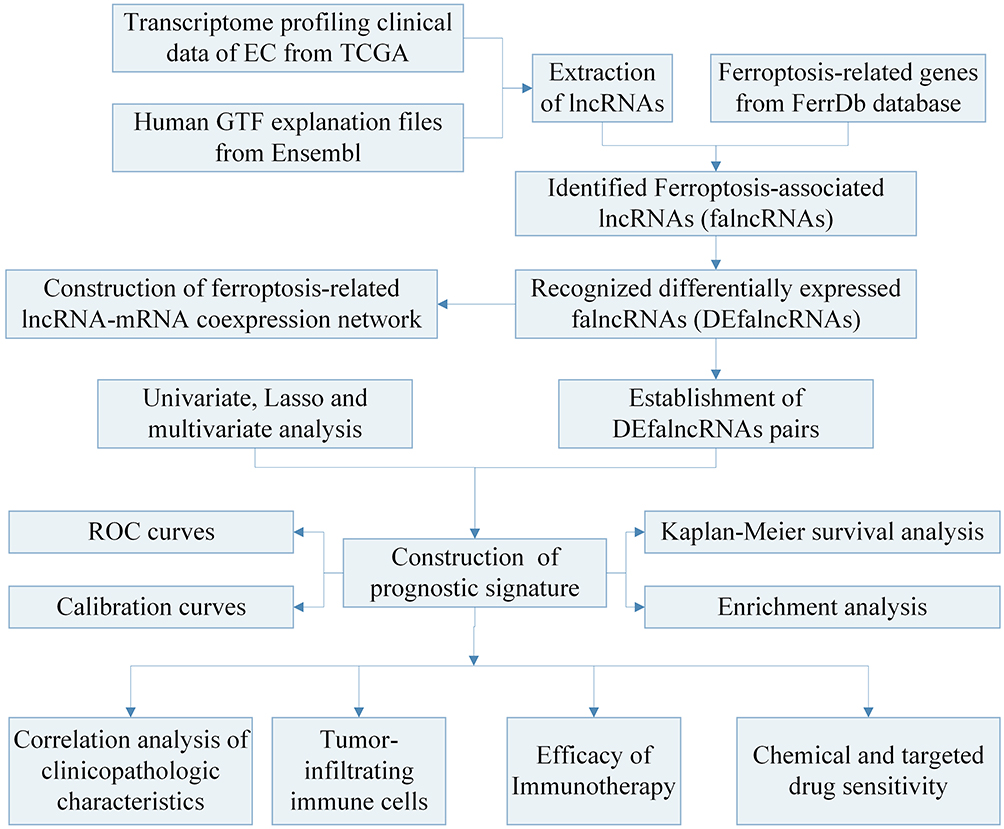 |
Figure 1 Flow chart of the prognostic signature in this study. Abbreviations: TCGA, The Cancer Genome Atlas; ROC, receiver operating characteristic. |
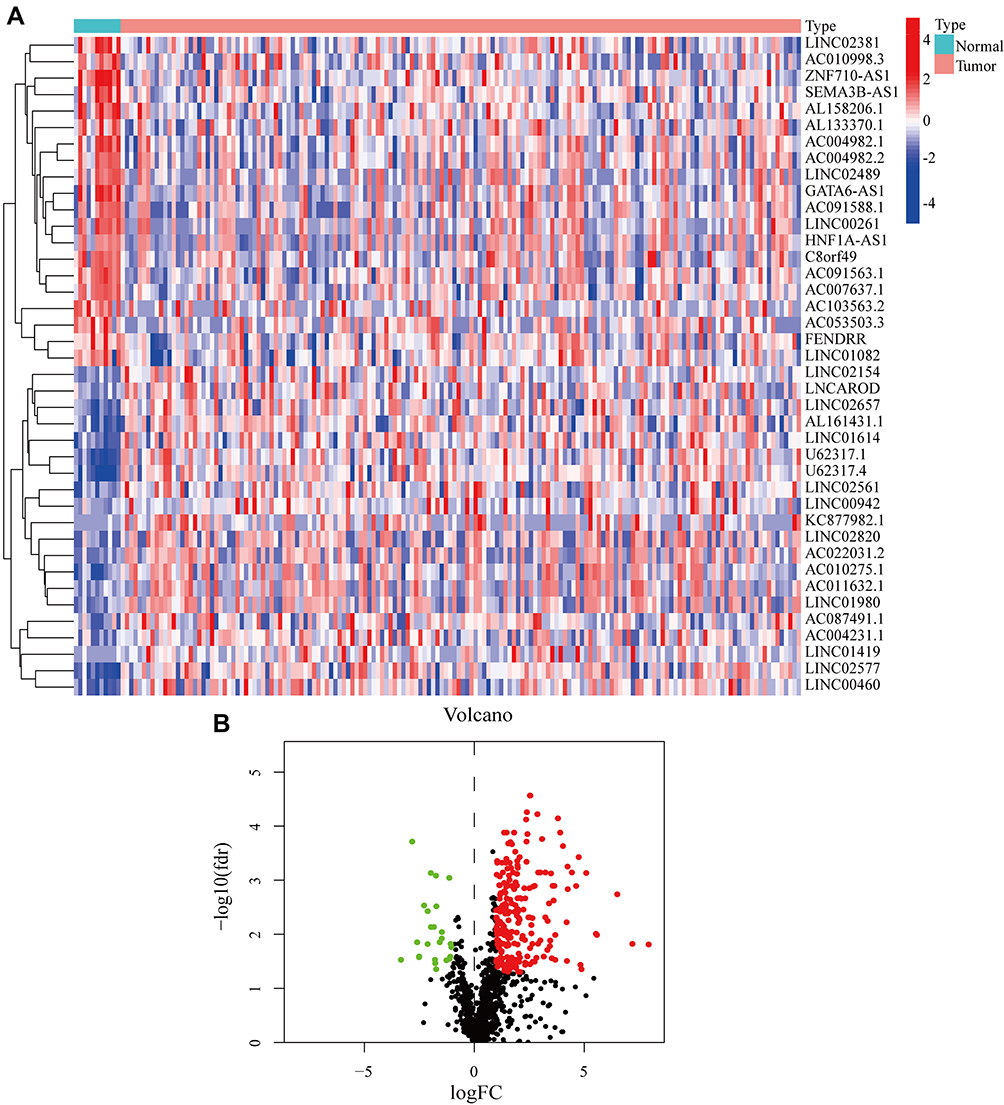 |
Figure 2 Recognition of DEfalncRNAs in TCGA database. (A) Heatmap of the most significantly upregulated and downregulated 20 DEfalncRNAs. (B) Volcano plot of DEfalncRNAs, upregulation as red dot and downregulation as green dot. Abbreviations: DEfalncRNAs, differentially expressed ferroptosis-associated lncRNAs; TCGA, The Cancer Genome Atlas. |
By univariate analysis, we obtained prognostically relevant DEfalncRNAs including AL035461.3, LINC02154, CASC8, LINC00942, AC108673.2, PRANCR, and AC008669.1 (Figure S1A). To investigate the relationship DEfalncRNAs and the corresponding mRNAs, we finally found that the coexpression network consisted of 26 falncRNA-famRNA pairs (Figure S1B and C). AL035461.3 and AC108673.2 each had three genes with coexpression relationship (HMGB1, STMN1, and HELLS; MAPK8, CXCL2, and AURKA, respectively). The ferroptosis-associated gene TMBIM4 was coexpressed with PRANCR and AC008669.1. In addition, LINC00942 had a coexpression relationship with 16 ferroptosis-associated genes (G6PD, PGD, KEAP1, ABCC1, TXNRD1, SRXN1, SLC7A11, KLHL24, MAFG, PRDX1, AKR1C1, AKR1C2, AKR1C3, GCLC NQO1, and PRDX6). Enrichment analysis showed that LINC00942 involved reactive oxygen species metabolism, which regulated ferroptosis in tumor cells (Figure S1D).42 The falncRNA-famRNA coexpression and enrichment analysis illustrated that ferroptosis had a complex and significant relationship with lncRNAs.
Construction and Verification of Prognostic Signature for DEfalncRNA Pairs
In total, 87 DEfalncRNA pairs were extracted by univariate analysis of which the significance filtering condition was P < 0.01. We then carried out LASSO regression analysis to further screen 38 DEfalncRNA pairs, which were further executed multivariate Cox regression analysis to finally identified 18 DEfalncRNA pairs strongly associated with survival prognosis to construct prognostic signature (Figure 3). The patient’s risk score was computed by the expression level of each lncRNA and the correlation coefficient. The optimal cutoff value of the risk score obtained from the 3-year ROC curve was 1.301, according to which patients were split into high-risk and low-risk groups (Figure 4A). By plotting ROC curves multiple times, we found that AUC values at 1-, 2-, and 3-year survival rates were all greater than 0.91, which illustrated the high predictive accuracy of the prognostic model (Figure 4B). The calibration curves of the original model and the internal validation of the Bootstrap method presented the favorable consistency between the predicted values of the 1-, 2-, and 3-year survival rates derived from the model and the actual observed values (Figure 4C and D). According to the Kaplan-Meier survival curve, patients in the low-risk group had a longer survival time than those in the high-risk group (P < 0.001, Figure 4E). The risk curve and survival status scatter plot showed that as the increase of patient’s risk score, the survival time of patients decreased and the number of death cases increased (Figure 4F and G).
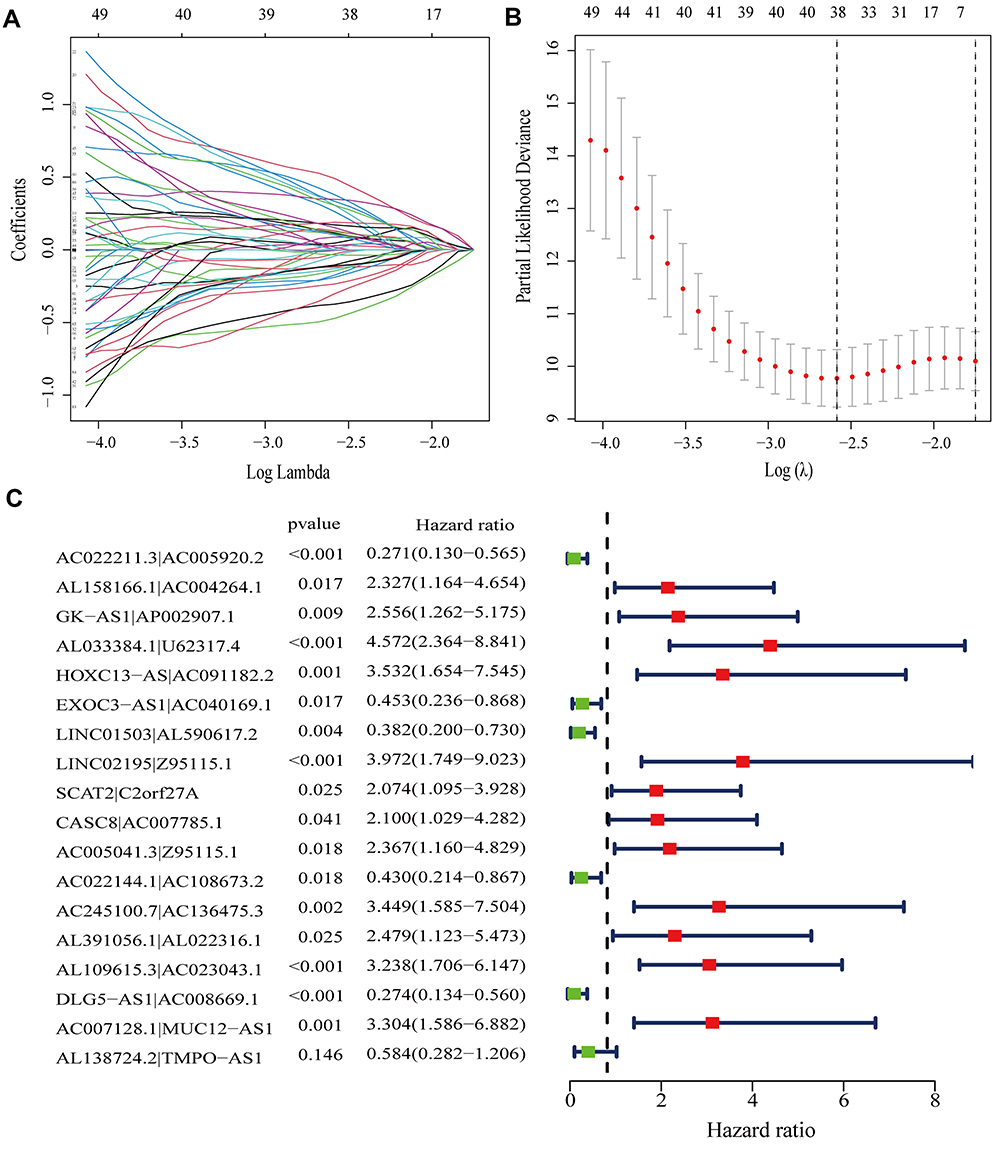 |
Figure 3 Construction of a prognostic signature via DEfalncRNA pairs. (A) Option of the parameter (λ) with 10-fold cross-validation. (B) Curves of Lasso coefficients for 38 DEfalncpairs RNAs. (C) Cox regression identified 18 DEfalncRNA pairs visualized as forest plots. Abbreviation: LASSO, least absolute shrinkage, and selection operator. |
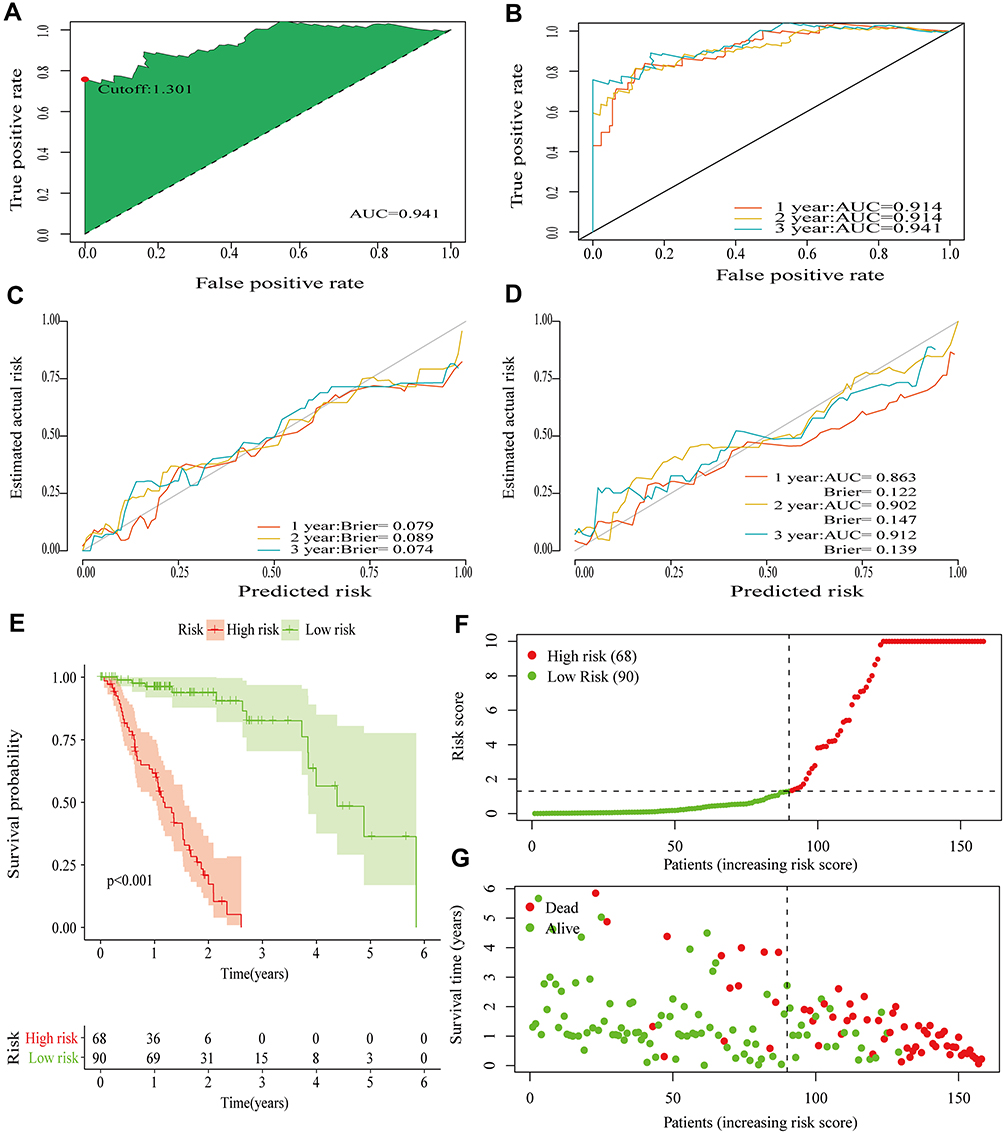 |
Figure 4 Appraisal of the performance in prognostic signature. (A) The optimal cutoff value for the risk score from the ROC curve for 3-year survival. (B) ROC curves for 1-, 2-, and 3-year survival. (C) Calibration curves of original prognostic signature. (D) Calibration curves for internal validation by the Bootstrap method. (E) Kaplan-Meier survival analysis for high-risk and low-risk groups. (F) Risk curve for high-risk and low-risk groups. (G) Scatter plot of vital status by risk score. Abbreviation: ROC, receiver operating characteristic. |
Clinical Influence of Prognostic Signature and Enrichment Analysis
It was well-known that many factors were relevant to the prognosis of patients. Utilizing ROC curves with multiple measures, we visualized that the AUC values of risk score were drastically larger than those of other clinicopathological variables, which furnished evidence to support that the foretelling effect of the prognostic signature had high accuracy (Figure 5A–C). Stage (P < 0.001), M (P = 0.018), N (P < 0.001) and risk score (P < 0.001) obtained by univariate Cox regression analysis were confirmed to be associated with survival prognosis of patients (Figure 5D). In multivariate Cox regression analysis, histology and risk score were associated with the prognosis of patients (P = 0.023, P < 0.001, respectively), while other clinicopathological variables were not associated with patient survival prognosis (all P > 0.05, Figure 5E). We found that the Hazard Ratio (HR) of the risk score was > 1, which represented that it was a risk factor for patients with EC. These results demonstrated that the prognostic hazard model could be acted as an independent prognostic factor independent of other clinicopathological characteristics by independent prognostic analysis. To explore the association between the risk score and clinicopathological features of EC, We found that there were significant differences between risk score and clinicopathological groups, including grade, ethnicity, histology, N, M, and stage (Figure 6A–L). Moreover, we also revealed that risk score was significantly associated with ethnicity, BMI, grade, T, N, M, stage, and radiation by performing clinicopathological correlation analysis (Figure 6M).
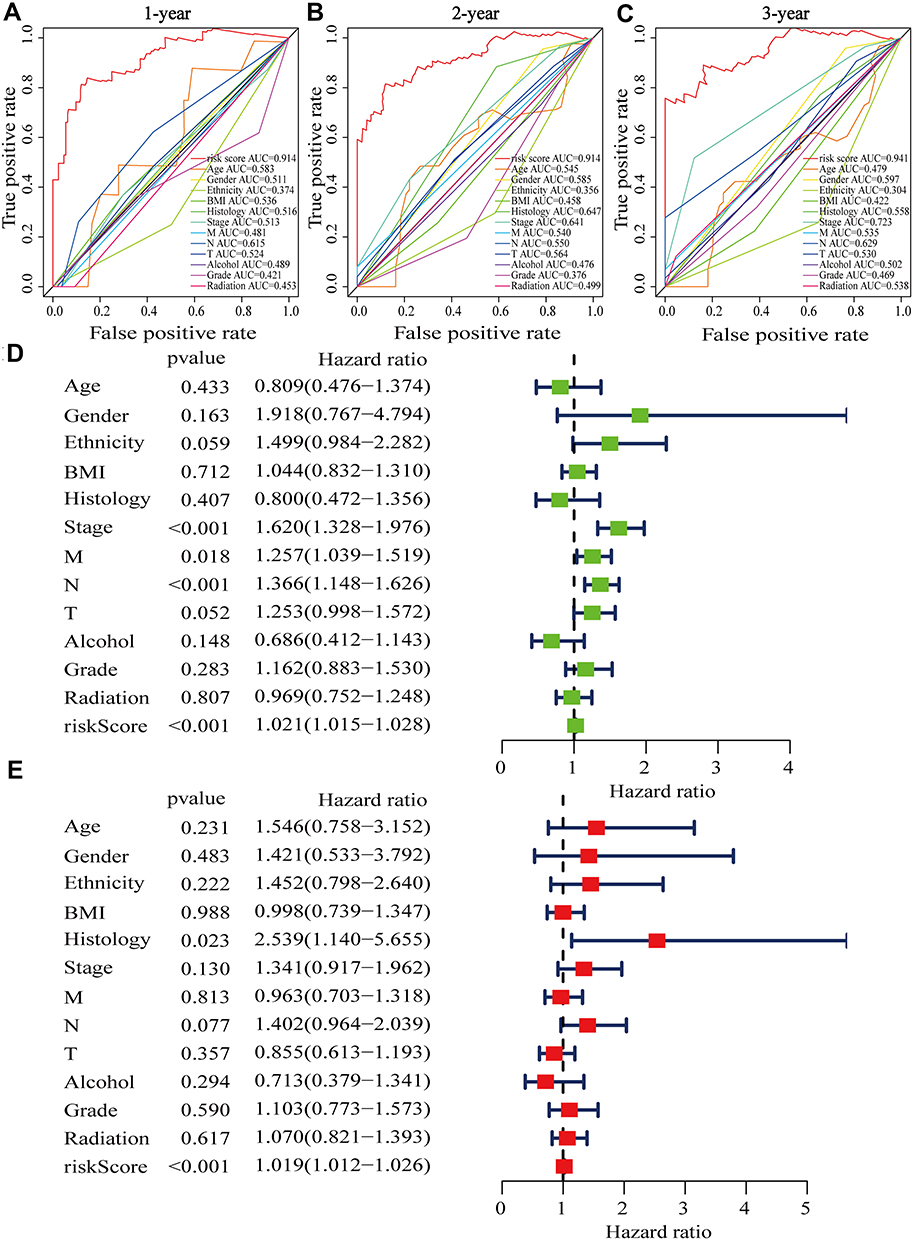 |
Figure 5 Clinical value of risk score by independent prognostic analysis. (A–C) ROC curves with multiple measures in 1-, 2-, and 3-year survival. (D) The result of univariate Cox regression analysis in clinicopathological factors and prognostic signature. (E) The multivariate Cox regression analysis of clinicopathological factors and prognostic signature. Abbreviation: BMI, Body Mass Index. |
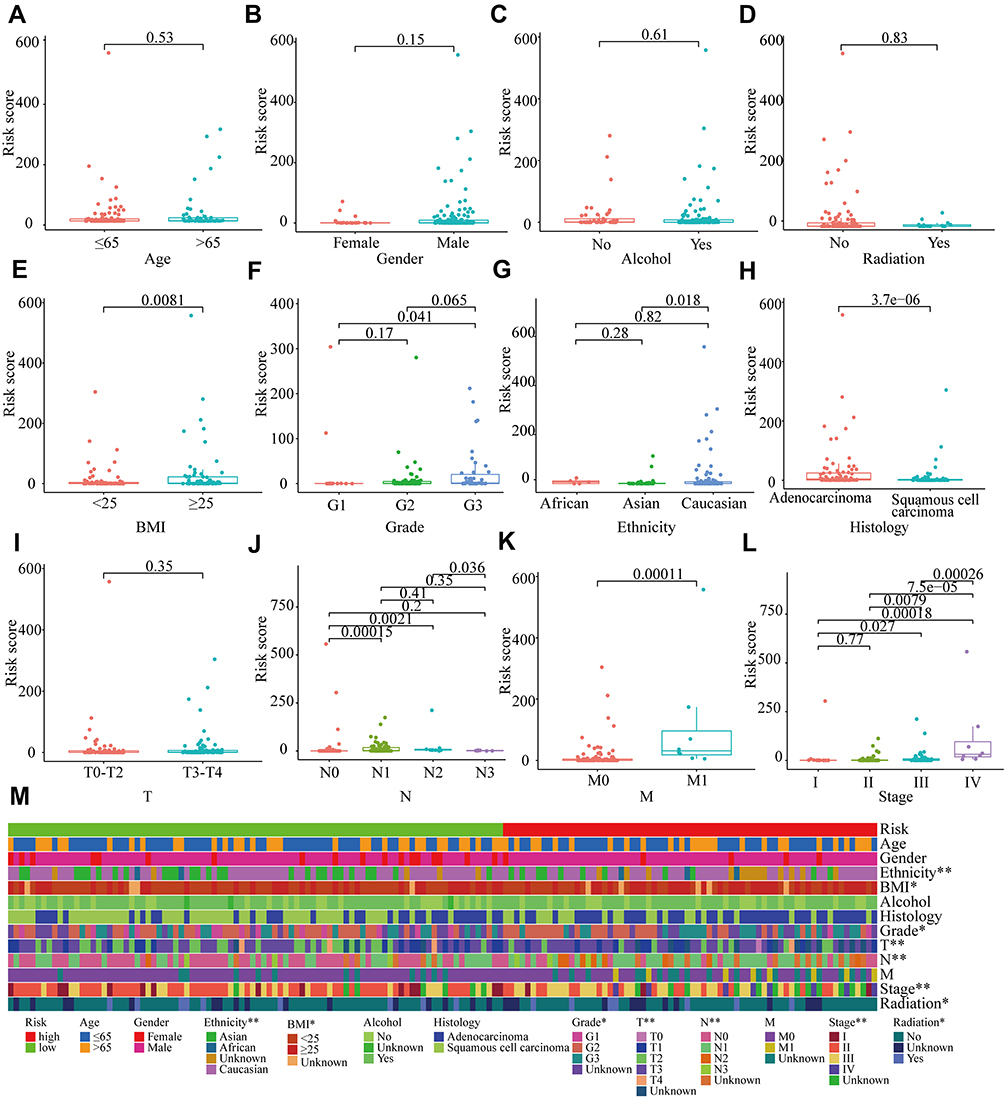 |
Figure 6 Relationship between prognostic signature and clinicopathological features. (A–L) Distribution of risk score in different clinicopathological groups. (M) Heatmap of the clinical relevance of risk score. *P<0.05, **P<0.01. |
The GSEA results revealed that immunoregulatory pathways were significantly enriched in the high-risk group, including innate immune response in mucosa, organ or tissue-specific immune response, antimicrobial humoral immune response mediated by antimicrobial peptide, humoral immune response, and B cells mediated immunity (Figure S2A). Additionally, ferroptosis-related signaling pathways were significantly enriched in the high-risk group by hallmark gene set analysis, including bile acid metabolism, peroxisome, and xenobiotic metabolism (Figure S2B). The enrichment analysis details were given in Supplementary Table S3.
Immune Landscape in Prognostic Signature
The tumor immune microenvironment (TIM) in EC was the accumulation of a large number of immune cells gathered within the tumor cells and in the surrounding stroma, which included effector T cells, T follicular helper (Tfh) cells, natural killer (NK) cells, dendritic cells (DCs), and macrophages (M1) with antitumor effects, regulatory T cells (Tregs), macrophages (M2) and myelogenous suppressor cells with tumor induction.43,44 Notwithstanding the correlation between falncRNA signature and immune infiltrate has been published very recently for other solid tumors, such as in glioma, breast cancer, head, and neck squamous cell carcinoma, it has not been elucidated in EC.27–29 As presented in the bubble diagram, the prognostic signature was positively correlated with memory CD4+T cells, M2 macrophages, Tregs, and Tfh cells, whereas cancer-associated fibroblasts (CAFs) and NK cells were negatively correlated with it (Figure 7A, Table S4). Differential analysis of immune cells reported that compared with the low-risk group, plasma cells, endothelial cells, Tfh cells, and Tregs were upregulated in the high-risk group, whereas downregulated immune cells in the high-risk group included CAFs and NK cells (Figure 7B–G). We demonstrated that the high-risk groups had the infiltration of pro-tumoral immune cell subsets, which differed from low-risk groups in tumor immune contexture.
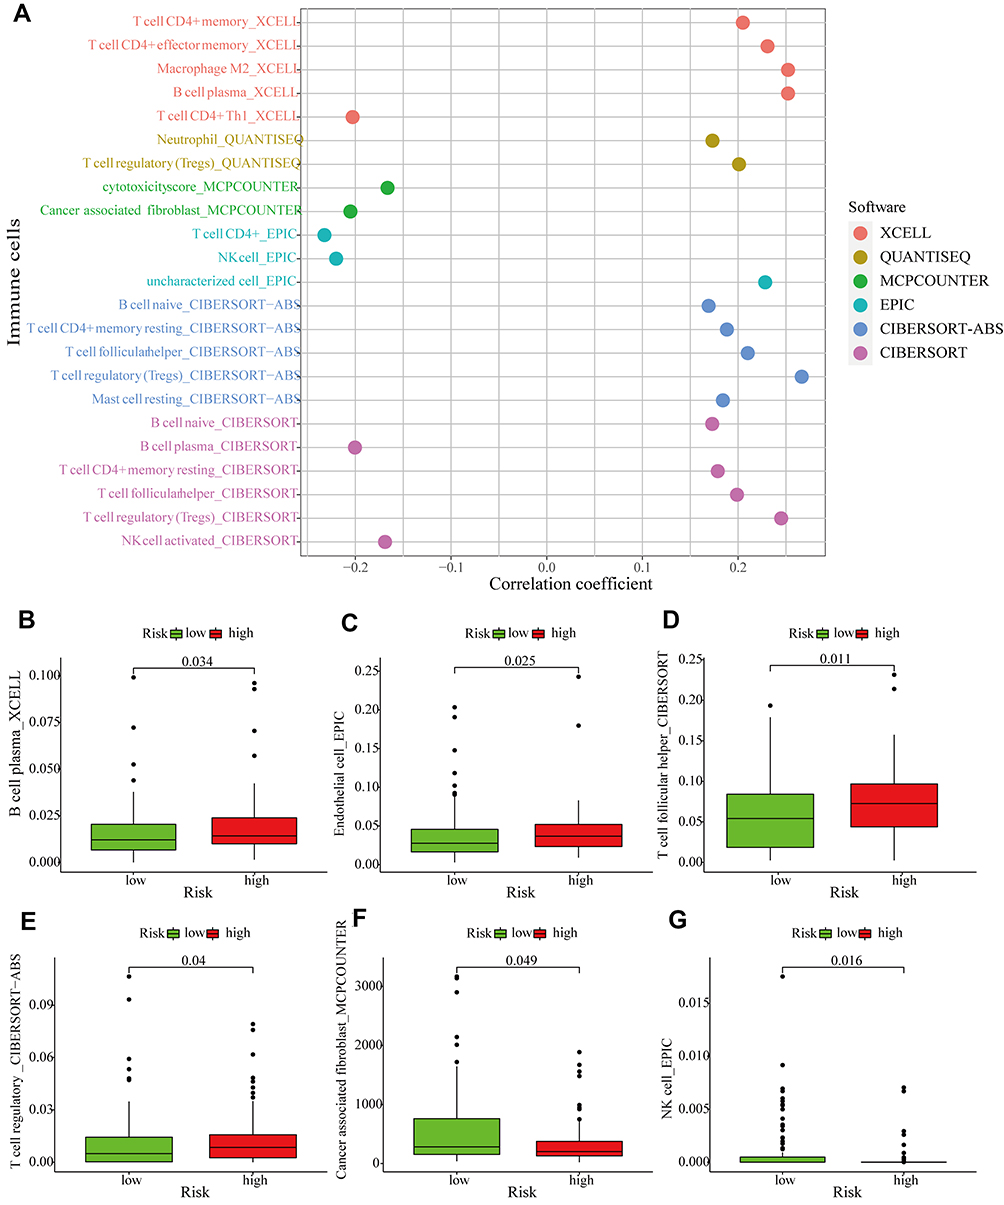 |
Figure 7 Immune landscape in prognostic signature. (A) Correlation analysis of tumor-infiltrating immune cells in prognostic signature, the correlation coefficient greater than 0 represented a positive correlation and less than 0 mean negative correlation. (B–G) Differential analysis of tumor-infiltrating immune cells in high-and low-risk groups. |
Prediction of Efficacy of Immunotherapy in Prognostic Signature
Presently, immunotherapy of tumors has entered a novel era due to the advent of immune checkpoint inhibitors (ICIs).45 In our prognostic signature, although PD-L1, PD-1, CTLA-4, TIM-3, LAG-3, and TIGIT were downregulated in the high-risk group, the results were not statistically significant (Figure 8A–F). We explore the relationship between the prognostic signature and TMB, and the TMB in the high-risk group was higher than that in the low-risk group, which was not statistically significant (Figure S3A–D). We employed the mutation data obtained by VarScan2 software to further visualize the 20 most frequently mutated genes, and there were differences in mutant genes and mutation frequencies between the high-risk and low-risk groups (Figure 8G and H). The mutation frequency was higher in the high-risk group than in the low-risk group at TP53 (81% vs 72%), TTN (45% vs36%), and SYNE1 (25% vs 11%). We sighted that variant classification and type were dominantly missense mutation and SNP (Single Nucleotide Polymorphisms), respectively (Figure S3E and F). The occurrence of C > T was the highest among single nucleotide variants (SNVs), followed by C > A (Figure S3G).
 |
Figure 8 The foresight of immunotherapy response in prognostic signature. (A–F) Differential analysis of the expression of immune checkpoints between high-risk and low-risk groups. (G and H) Waterfall plots of the mutant landscape with and low-risk and high-risk groups, presenting the 20 genes with the highest mutation frequency. Abbreviations: CTLA-4, cytotoxic T-lymphocyte associated protein 4; PD-L1, programmed cell death protein Ligand-1; PD-1, programmed cell death 1; TIM-3, T-cell immunoglobulin mucin 3; LAG-3, Lymphocyte-activation gene 3; TIGIT, T-cell immunoreceptor with immunoglobulin and ITIM domain. |
Drug Sensitivity Analysis of Prognostic Signature
Along with ICIs, chemical and targeted drugs were also considered as a mainstay therapy of EC. It was very necessary for patients requiring chemotherapy or targeted therapy to implement drug sensitivity tests. Therefore, how to avoid ineffective drugs and select effective drugs for treatment had long been a concern for the tumor community. We unveiled that chemotherapeutic drugs with closely related IC50 in low-risk group included paclitaxel (P < 0.001, Figure 9A), vinorelbine (P= 0.012, Figure 9B), and cisplatin (P = 0.018, Figure 9C). Simultaneously, we observed that there were significant differences in the IC50 of targeted drugs between high-risk and low-risk groups, with the low-risk group being more sensitive to targeted drugs including gefitinib (P = 0.012, Figure 9D), lapatinib (P = 0.027 Figure 9E), and erlotinib (P = 0.0013, Figure 9F). These results suggested that it was more sensitive to drugs in the low-risk group, thereby avoiding the use of ineffective drugs, increasing treatment success, and reducing treatment risk.
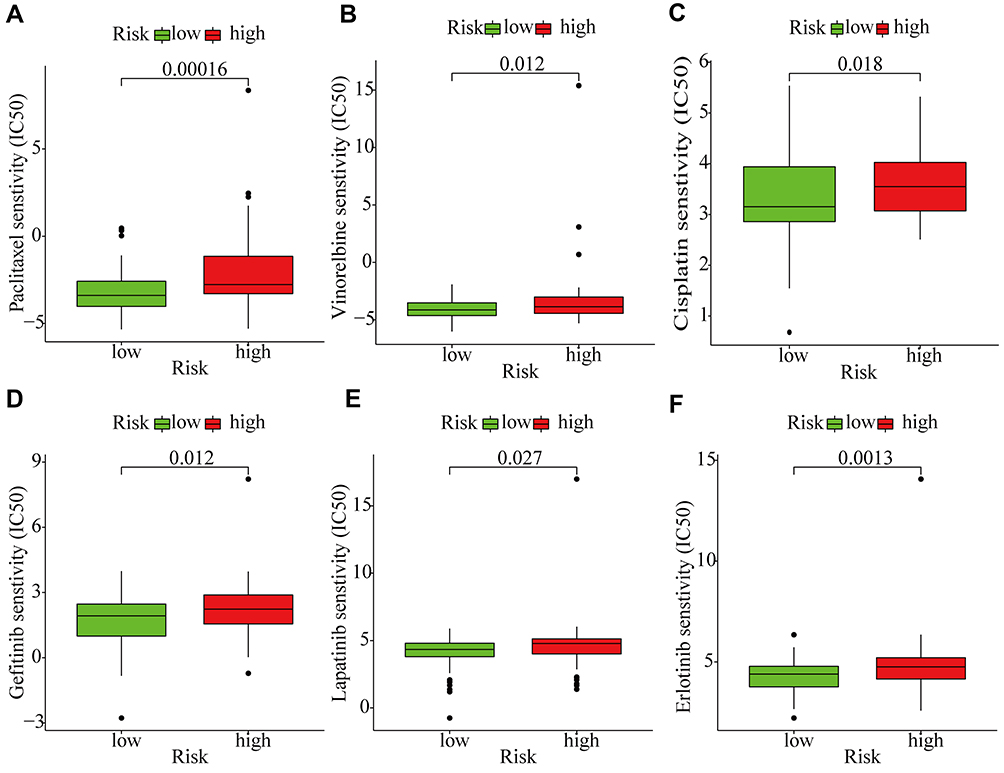 |
Figure 9 Prediction of drug sensitivity in prognostic signature. (A–C) Comparison of chemosensitivity in high-risk and low-risk groups. (D-F) Differential analysis of susceptibility to targeted drugs in high-risk and low-risk groups. |
Discussion
Due to unique tissue specificity, the differential expression of lncRNAs can be regarded as biomarkers of cancer.46 Recently, the occurrence and development of cancer are closely related to lncRNAs, ferroptosis, and infiltration of immune cells. LncRNAs and ferroptosis are considered to be potential targets for cancer therapy, and the specific relationship between them and the immune is intricate and not fully clear. However, a novel prognostic signature of falncRNAs in EC has not been defined yet.
In our study, we investigated whether falncRNAs had a potentially insightful effect on EC. To clarify the effect of falncRNAs on EC, we identified available DEfalncRNA pairs performed by constructing 0 or 1 matrix, which was performed by univariate and LASSO regression analysis to determine prognostically relevant DEfalncRNA pairs that were established prognostic signature by multivariate analysis. Collectively, our study was the first to demonstrate that prognostic signature had predictive value for survival prognosis, tumor-infiltrating immune cells, immunotherapy response, and drug sensitivity of EC.
LncRNAs exerted functions in numerous ways, and an increasing number of studies confirmed that they could regulate ferroptosis in tumor cells. LINC00336 promoted the growth of lung cancer cells, accelerated tumor formation, and inhibited ferroptosis in lung cancer cells.47 It was previously reported that LINC00618 promoted ferroptosis in leukemia cells by increasing the content of reactive oxygen species (ROS) and iron, which intriguingly implicated that lncRNAs associated with ferroptosis were essential for the development and treatment of leukemia.48 Weng et al revealed that the seven-lncRNA signature was an independent factor in esophageal squamous cell carcinoma (ESCC), which was more predictive of patient survival than the TNM stage alone.49 In our prognostic signature, the high-risk group had a worse survival time compared to the low-risk group, which was consistent with the result of the lncRNAs signature.49 In our study, multivariate analysis revealed that prognostically relevant DEirlncRNAs pairs played a far-reaching role, especially in EC, such as AL033384.1, LINC01503, AC007128.1, TMPO−AS1, U62317.4, LINC02195, AL109615.3, and AC023043.1. Correlative studies that were close to our results, uncovered that LINC01503 and AC007128.1 were highly expressed in EC compared to non-tumor tissues and facilitated malignant behavior in EC, with patients with high expression of them having worse survival.50,51 Gao et al disclosed that TMPO-AS1 facilitated the migration and invasion of EC cells by suppressing miR-498, which was reversed by propofol.52 Most notably, this evidence strongly suggested that lncRNAs were tightly associated with the prognosis of EC patients, and thus prognostic signature might provide further novel therapeutic targets for EC patients.
At present, immunotherapy with ICIs has set off an upsurge, which has completely reversed the traditional treatment of EC. Clinical trials of ATTRACTION-1 and KEYNOTE-180 have signified the benefit of nivolumab and pembrolizumab in patients with metastatic or recurrent EC.53,54 The results of prognostic signature with infiltration of immune cells were positively correlated with memory CD4+T cells, M2 macrophages, Tregs, and Tfh cells, and negatively correlated with CAFs and NK cells, found in our study by integrated summary analysis. Consistent with our results was the prognostic value found in a prognostic model established by immune genes associated with memory CD4+T cells, Tfh cells for patients with EC.55 Furthermore, plasma cells, endothelial cells, Tfh cells, and Tregs were upregulated, while CAFs and NK cells were downregulated in the high-risk group compared with the low-risk group in our model. M2 Macrophages induced enhanced the process of epithelial-mesenchymal transition and immune escape through the PD-1 signaling pathway, promoting the ESCC exacerbation which let ESCC patients have a poor prognosis.56,57 Tumor-infiltrating endothelial cells were found to augment descent, migration, and metastasis of EC cells by Epiregulin.58 Tregs inhibited effector T cells to mediate tumor immune escape by producing TGF-β, IL-10, and IL-35.59,60 CCL22 and CCL20 recruited Tregs to promote the progression of EC and the infiltration of Tregs was inversely correlated with the survival of patients.61–63 NK cells were the first line of defense against tumors, and dysfunctional NK cells were accompanied by progression and poor prognosis in EC.64,65 CAFs played an indispensable role in the progression of EC, which mediated immune escape through IL6 and brought on radioresistance by promoting lncRNA DNM3OS expression.66–68 Although our study reported higher expression of immune checkpoints in the low-risk group than in the high-risk group, there was no statistical significance, presumably due to TMB, microsatellite instability (MSI), IFN-γ, and tumor-infiltrating lymphocytes concerning the response to immunotherapy. In our prognostic signature, TMB was higher in the high-risk group than in the low-risk group. The more genetic mutations in tumor cells, the more likely TMB was to produce more neoantigens, which helped the immune system identify the tumors and benefited patients after immunotherapy.69
Although the surgery was the main treatment for EC, the prognosis of EC remained very poor. Simultaneously, chemotherapy, radiotherapy, and targeted therapy have been turned out to have therapeutic benefits for EC.70 Since the efficacy of drugs was related to the degree of drug sensitivity of patients and individual differences, it was essential to detect the drug sensitivity for patients requiring chemotherapy and targeted therapy. With the deepening of the understanding of the molecular mechanism of malignant tumors, drugs targeting epidermal growth factor receptor (EGFR) have been continuously introduced to provide a basis for the precise treatment of EC. Our study illustrated that patients in the low-risk group were more sensitive to paclitaxel, vinorelbine, cisplatin, gefitinib, lapatinib, and erlotinib than those in the high-risk group, which signified that patients in the low-risk group had better survival. Predicting the drug sensitivity enabled avoidance of ineffective drugs, reduced blindness, and increased treatment success. Notwithstanding the prognostic signature was only a bioinformatics analysis result that needs further confirmation.
It was undeniable that there were some shortcomings and limitations in this study. First of all, all patient data were obtained from TCGA database that had certain defects, chiefly due to limited sample size, sequencing technology, or quality control differences, which could affect the accuracy of the data. In order not to chew over batch correction and utilize the information of the data effectively, we used an innovative approach to overcome the problem of data standardization that referred to establishing 0 or 1 matrix to identify effective DEfalncRNA pairs in EC.32 For good measure, it was worth mentioning that we only carried out the validation of internal data and lacked a large sample of external data for model evaluation in the verification of the prognostic signature. We lacked experiments to validate the underlying molecular mechanisms regarding the relationship of lncRNAs, ferroptosis, and infiltration of immune cells. Last but not least, our current study is retrospective and should be further validated by prospective studies in multicenter clinical trials. Therefore, more functional studies and in vitro and in vivo experiments should be implemented subsequently to verify the accuracy of prognostic signature for better clinical application.
Conclusion
The prognostic signature based on ferroptosis-associated lncRNAs has the potential to predict the survival, tumor-infiltrating immune cells, efficacy of Immunotherapy, and drug sensitivity of EC, which may be regarded as a newfangled biomarker and therapeutic target in the future, and thus has promising and significant value in achieving clinical diagnosis and individualized treatment of patients.
Data Sharing Statement
Data in the present study can be freely obtained from TCGA database, which can be utilized and analyzed by the public (https://portal.gdc.cancer.gov/).
Acknowledgments
The authors gratefully acknowledge the public availability of TCGA database so that the data can be freely used by us.
Funding
The study was supported by the National Natural Science Foundation of China (No.81872471).
Disclosure
The authors report no conflicts of interest in this work.
References
1. Alsop BR, Sharma P. Esophageal cancer. Gastroenterol Clin North Am. 2016;45:399–412. doi:10.1016/j.gtc.2016.04.001
2. Bray F, Ferlay J, Soerjomataram I, et al. Global cancer statistics 2018: GLOBOCAN estimates of incidence and mortality worldwide for 36 cancers in 185 countries. CA Cancer J Clin. 2018;68:394–424. doi:10.3322/caac.21492
3. Siegel RL, Miller KD, Fuchs HE, Jemal A. Cancer statistics, 2021. CA Cancer J Clin. 2021;71:7–33. doi:10.3322/caac.21654
4. Su Z, Zou GR, Mao YP, et al. Prognostic impact of family history of cancer in Southern Chinese patients with esophageal squamous cell cancer. J Cancer. 2019;10:1349–1357. doi:10.7150/jca.26511
5. Malhotra GK, Yanala U, Ravipati A, et al. Global trends in esophageal cancer. J Surg Oncol. 2017;115:564–579. doi:10.1002/jso.24592
6. Vioque J, Barber X, Bolumar F, et al. Esophageal cancer risk by type of alcohol drinking and smoking: a case-control study in Spain. BMC Cancer. 2008;8:221. doi:10.1186/1471-2407-8-221
7. Wijnhoven BP, Tran KT, Esterman A, Watson DI, Tilanus HW. An evaluation of prognostic factors and tumor staging of resected carcinoma of the esophagus. Ann Surg. 2007;245:717–725. doi:10.1097/01.sla.0000251703.35919.02
8. Long E, Beales IL. The role of obesity in oesophageal cancer development. Therap Adv Gastroenterol. 2014;7:247–268. doi:10.1177/1756283x14538689
9. Jang R, Darling G, Wong RK. Multimodality approaches for the curative treatment of esophageal cancer. J Natl Compr Canc Netw. 2015;13:229–238. doi:10.6004/jnccn.2015.0029
10. Kojima T, Shah MA, Muro K, et al. Randomized Phase III KEYNOTE-181 study of pembrolizumab versus chemotherapy in advanced esophageal cancer. J Clin Oncol. 2020;38:4138–4148. doi:10.1200/jco.20.01888
11. Yang YM, Hong P, Xu WW, He QY, Li B. Advances in targeted therapy for esophageal cancer. Signal Transduct Target Ther. 2020;5:229. doi:10.1038/s41392-020-00323-3
12. Stockwell BR, Jiang X. A physiological function for ferroptosis in tumor suppression by the immune system. Cell Metab. 2019;30:14–15. doi:10.1016/j.cmet.2019.06.012
13. Zhang Y, Shi J, Liu X, et al. BAP1 links metabolic regulation of ferroptosis to tumour suppression. Nat Cell Biol. 2018;20:1181–1192. doi:10.1038/s41556-018-0178-0
14. Stockwell BR, Jiang X, Gu W. Emerging mechanisms and disease relevance of ferroptosis. Trends Cell Biol. 2020;30:478–490. doi:10.1016/j.tcb.2020.02.009
15. Stockwell BR, Friedmann Angeli JP, Bayir H, et al. Ferroptosis: a regulated cell death nexus linking metabolism, redox biology, and disease. Cell. 2017;171:273–285. doi:10.1016/j.cell.2017.09.021
16. Green DR. The coming decade of cell death research: five riddles. Cell. 2019;177:1094–1107. doi:10.1016/j.cell.2019.04.024
17. Wang W, Green M, Choi JE, et al. CD8(+) T cells regulate tumour ferroptosis during cancer immunotherapy. Nature. 2019;569:270–274. doi:10.1038/s41586-019-1170-y
18. Lang X, Green MD, Wang W, et al. Radiotherapy and immunotherapy promote tumoral lipid oxidation and ferroptosis via synergistic repression of SLC7A11. Cancer Discov. 2019;9:1673–1685. doi:10.1158/2159-8290.Cd-19-0338
19. Nagano T, Fraser P. No-nonsense functions for long noncoding RNAs. Cell. 2011;145:178–181. doi:10.1016/j.cell.2011.03.014
20. Mi X, Xu R, Hong S, et al. M2 macrophage-derived exosomal lncRNA AFAP1-AS1 and microRNA-26a affect cell migration and metastasis in esophageal cancer. Mol Ther Nucleic Acids. 2020;22:779–790. doi:10.1016/j.omtn.2020.09.035
21. Statello L, Guo CJ, Chen LL, Huarte M. Gene regulation by long non-coding RNAs and its biological functions. Nat Rev Mol Cell Biol. 2021;22:96–118. doi:10.1038/s41580-020-00315-9
22. Chen YG, Satpathy AT, Chang HY. Gene regulation in the immune system by long noncoding RNAs. Nat Immunol. 2017;18:962–972. doi:10.1038/ni.3771
23. Jiang N, Zhang X, Gu X, Li X, Shang L. Progress in understanding the role of lncRNA in programmed cell death. Cell Death Discov. 2021;7:30. doi:10.1038/s41420-021-00407-1
24. Spizzo R, Almeida MI, Colombatti A, Calin GA. Long non-coding RNAs and cancer: a new frontier of translational research? Oncogene. 2012;31:4577–4587. doi:10.1038/onc.2011.621
25. Zhu L, Yang F, Wang L, et al. Identification the ferroptosis-related gene signature in patients with esophageal adenocarcinoma. Cancer Cell Int. 2021;21:124. doi:10.1186/s12935-021-01821-2
26. Lu T, Xu R, Li Q, et al. Systematic profiling of ferroptosis gene signatures predicts prognostic factors in esophageal squamous cell carcinoma. Mol Ther Oncolytics. 2021;21:134–143. doi:10.1016/j.omto.2021.02.011
27. Zheng J, Zhou Z, Qiu Y, et al. A prognostic ferroptosis-related lncRNAs signature associated with immune landscape and radiotherapy response in glioma. Front Cell Dev Biol. 2021;9:675555. doi:10.3389/fcell.2021.675555
28. Wu ZH, Tang Y, Yu H, Li HD. The role of ferroptosis in breast cancer patients: a comprehensive analysis. Cell Death Discov. 2021;7:93. doi:10.1038/s41420-021-00473-5
29. Tang Y, Li C, Zhang YJ, Wu ZH. Ferroptosis-related long non-coding RNA signature predicts the prognosis of head and neck squamous cell carcinoma. Int J Biol Sci. 2021;17:702–711. doi:10.7150/ijbs.55552
30. Zhou N, Bao J. FerrDb: a manually curated resource for regulators and markers of ferroptosis and ferroptosis-disease associations. Database. 2020;2020, baaa021. doi:10.1093/database/baaa021
31. Walter W, Sánchez-Cabo F, Ricote M. GOplot: an R package for visually combining expression data with functional analysis. Bioinformatics. 2015;31:2912–2914. doi:10.1093/bioinformatics/btv300
32. Hong W, Liang L, Gu Y, et al. Immune-related lncRNA to construct novel signature and predict the immune landscape of human hepatocellular carcinoma. Mol Ther Nucleic Acids. 2020;22:937–947. doi:10.1016/j.omtn.2020.10.002
33. Mandrekar JN. Receiver operating characteristic curve in diagnostic test assessment. J Thorac Oncol. 2010;5:1315–1316. doi:10.1097/JTO.0b013e3181ec173d
34. Zhang Z. Survival analysis in the presence of competing risks. Ann Transl Med. 2017;5:47. doi:10.21037/atm.2016.08.62
35. Ranstam J, Cook JA. Kaplan-Meier curve. Br J Surg. 2017;104:442. doi:10.1002/bjs.10238
36. Yu G, Wang LG, Han Y, He QY. clusterProfiler: an R package for comparing biological themes among gene clusters. Omics. 2012;16:284–287. doi:10.1089/omi.2011.0118
37. Li T, Fu J, Zeng Z, et al. TIMER2.0 for analysis of tumor-infiltrating immune cells. Nucleic Acids Res. 2020;48:W509–w514. doi:10.1093/nar/gkaa407
38. Sturm G, Finotello F, Petitprez F, et al. Comprehensive evaluation of transcriptome-based cell-type quantification methods for immuno-oncology. Bioinformatics. 2019;35:i436–i445. doi:10.1093/bioinformatics/btz363
39. Merino DM, McShane LM, Fabrizio D, et al. Establishing guidelines to harmonize tumor mutational burden (TMB): in silico assessment of variation in TMB quantification across diagnostic platforms: Phase I of the friends of cancer research TMB harmonization project. J Immunother Cancer. 2020;8:e000147. doi:10.1136/jitc-2019-000147
40. Mayakonda A, Lin DC, Assenov Y, Plass C, Koeffler HP. Maftools: efficient and comprehensive analysis of somatic variants in cancer. Genome Res. 2018;28:1747–1756. doi:10.1101/gr.239244.118
41. Geeleher P, Cox N, Huang RS. pRRophetic: an R package for prediction of clinical chemotherapeutic response from tumor gene expression levels. PLoS One. 2014;9:e107468. doi:10.1371/journal.pone.0107468
42. Yang WS, Stockwell BR. Ferroptosis: death by lipid peroxidation. Trends Cell Biol. 2016;26:165–176. doi:10.1016/j.tcb.2015.10.014
43. Lin EW, Karakasheva TA, Hicks PD, Bass AJ, Rustgi AK. The tumor microenvironment in esophageal cancer. Oncogene. 2016;35:5337–5349. doi:10.1038/onc.2016.34
44. Zheng Y, Chen Z, Han Y, et al. Immune suppressive landscape in the human esophageal squamous cell carcinoma microenvironment. Nat Commun. 2020;11:6268. doi:10.1038/s41467-020-20019-0
45. Horisberger A, La Rosa S, Zurcher JP, et al. A severe case of refractory esophageal stenosis induced by nivolumab and responding to tocilizumab therapy. J Immunother Cancer. 2018;6:156. doi:10.1186/s40425-018-0481-0
46. Chandra Gupta S, Nandan Tripathi Y. Potential of long non-coding RNAs in cancer patients: from biomarkers to therapeutic targets. Int J Cancer. 2017;140:1955–1967. doi:10.1002/ijc.30546
47. Wang M, Mao C, Ouyang L, et al. Long noncoding RNA LINC00336 inhibits ferroptosis in lung cancer by functioning as a competing endogenous RNA. Cell Death Differ. 2019;26:2329–2343. doi:10.1038/s41418-019-0304-y
48. Wang Z, Chen X, Liu N, et al. A nuclear long non-coding RNA LINC00618 accelerates ferroptosis in a manner dependent upon apoptosis. Mol Ther. 2021;29:263–274. doi:10.1016/j.ymthe.2020.09.024
49. Weng NQ, Chi J, Wen J, et al. The prognostic value of a seven-lncRNA signature in patients with esophageal squamous cell carcinoma: a lncRNA expression analysis. J Transl Med. 2020;18:47. doi:10.1186/s12967-020-02224-z
50. Xie JJ, Jiang YY, Jiang Y, et al. Super-enhancer-driven long non-coding RNA LINC01503, regulated by TP63, is over-expressed and oncogenic in squamous cell carcinoma. Gastroenterology. 2018;154:2137–2151.e2131. doi:10.1053/j.gastro.2018.02.018
51. Liu H, Zhang Q, Lou Q, et al. Differential analysis of lncRNA, miRNA and mRNA expression profiles and the prognostic value of lncRNA in esophageal cancer. Pathol Oncol Res. 2020;26:1029–1039. doi:10.1007/s12253-019-00655-8
52. Gao M, Guo R, Lu X, Xu G, Luo S. Propofol suppresses hypoxia-induced esophageal cancer cell migration, invasion, and EMT through regulating lncRNA TMPO-AS1/miR-498 axis. Thorac Cancer. 2020;11:2398–2405. doi:10.1111/1759-7714.13534
53. Kudo T, Hamamoto Y, Kato K, et al. Nivolumab treatment for oesophageal squamous-cell carcinoma: an open-label, multicentre, Phase 2 trial. Lancet Oncol. 2017;18:631–639. doi:10.1016/s1470-2045(17)30181-x
54. Shah MA, Kojima T, Hochhauser D, et al. Efficacy and safety of pembrolizumab for heavily pretreated patients with advanced, metastatic adenocarcinoma or squamous cell carcinoma of the esophagus: the phase 2 KEYNOTE-180 study. JAMA Oncol. 2019;5:546–550. doi:10.1001/jamaoncol.2018.5441
55. Wang L, Wei Q, Zhang M, et al. Identification of the prognostic value of immune gene signature and infiltrating immune cells for esophageal cancer patients. Int Immunopharmacol. 2020;87:106795. doi:10.1016/j.intimp.2020.106795
56. Yang H, Zhang Q, Xu M, et al. CCL2-CCR2 axis recruits tumor associated macrophages to induce immune evasion through PD-1 signaling in esophageal carcinogenesis. Mol Cancer. 2020;19:41. doi:10.1186/s12943-020-01165-x
57. Zhou J, Zheng S, Liu T, et al. IL-1β from M2 macrophages promotes migration and invasion of ESCC cells enhancing epithelial-mesenchymal transition and activating NF-κB signaling pathway. J Cell Biochem. 2018;119:7040–7052. doi:10.1002/jcb.26918
58. Sun L, Pan J, Yu L, et al. Tumor endothelial cells promote metastasis and cancer stem cell-like phenotype through elevated Epiregulin in esophageal cancer. Am J Cancer Res. 2016;6:2277–2288.
59. Rana J, Biswas M. Regulatory T cell therapy: current and future design perspectives. Cell Immunol. 2020;356:104193. doi:10.1016/j.cellimm.2020.104193
60. Sawant DV, Yano H, Chikina M, et al. Adaptive plasticity of IL-10(+) and IL-35(+) T(reg) cells cooperatively promotes tumor T cell exhaustion. Nat Immunol. 2019;20:724–735. doi:10.1038/s41590-019-0346-9
61. Vacchelli E, Semeraro M, Adam J, et al. Immunosurveillance in esophageal carcinoma: the decisive impact of regulatory T cells. Oncoimmunology. 2016;5:e1064581. doi:10.1080/2162402x.2015.1064581
62. Lian J, Liu S, Yue Y, et al. Eomes promotes esophageal carcinoma progression by recruiting Treg cells through the CCL20-CCR6 pathway. Cancer Sci. 2021;112:144–154. doi:10.1111/cas.14712
63. Zhao X, Liu S, Chen X, et al. L1CAM overexpression promotes tumor progression through recruitment of regulatory T cells in esophageal carcinoma. Cancer Biol Med. 2021;18(2):547–561. doi:10.20892/j.issn.2095-3941.2020.0182
64. Zheng Y, Li Y, Lian J, et al. TNF-α-induced Tim-3 expression marks the dysfunction of infiltrating natural killer cells in human esophageal cancer. J Transl Med. 2019;17:165. doi:10.1186/s12967-019-1917-0
65. Zheng Y, Li Y, Tang B, et al. IL-6-induced CD39 expression on tumor-infiltrating NK cells predicts poor prognosis in esophageal squamous cell carcinoma. Cancer Immunol Immunother. 2020;69:2371–2380. doi:10.1007/s00262-020-02629-1
66. Wang J, Zhang G, Wang J, et al. The role of cancer-associated fibroblasts in esophageal cancer. J Transl Med. 2016;14:30. doi:10.1186/s12967-016-0788-x
67. Kato T, Noma K, Ohara T, et al. Cancer-associated fibroblasts affect intratumoral CD8(+) and FoxP3(+) T cells via IL6 in the tumor microenvironment. Clin Cancer Res. 2018;24:4820–4833. doi:10.1158/1078-0432.Ccr-18-0205
68. Zhang H, Hua Y, Jiang Z, et al. Cancer-associated fibroblast-promoted LncRNA DNM3OS confers radioresistance by regulating DNA damage response in esophageal squamous cell carcinoma. Clin Cancer Res. 2019;25:1989–2000. doi:10.1158/1078-0432.Ccr-18-0773
69. Chan TA, Yarchoan M, Jaffee E, et al. Development of tumor mutation burden as an immunotherapy biomarker: utility for the oncology clinic. Ann Oncol. 2019;30:44–56. doi:10.1093/annonc/mdy495
70. Kakeji Y, Oshikiri T, Takiguchi G, et al. Multimodality approaches to control esophageal cancer: development of chemoradiotherapy, chemotherapy, and immunotherapy. Esophagus. 2021;18:25–32. doi:10.1007/s10388-020-00782-1
 © 2021 The Author(s). This work is published and licensed by Dove Medical Press Limited. The full terms of this license are available at https://www.dovepress.com/terms.php and incorporate the Creative Commons Attribution - Non Commercial (unported, v3.0) License.
By accessing the work you hereby accept the Terms. Non-commercial uses of the work are permitted without any further permission from Dove Medical Press Limited, provided the work is properly attributed. For permission for commercial use of this work, please see paragraphs 4.2 and 5 of our Terms.
© 2021 The Author(s). This work is published and licensed by Dove Medical Press Limited. The full terms of this license are available at https://www.dovepress.com/terms.php and incorporate the Creative Commons Attribution - Non Commercial (unported, v3.0) License.
By accessing the work you hereby accept the Terms. Non-commercial uses of the work are permitted without any further permission from Dove Medical Press Limited, provided the work is properly attributed. For permission for commercial use of this work, please see paragraphs 4.2 and 5 of our Terms.