")
Back to Journals » International Journal of General Medicine » Volume 14
A Prognostic Signature of Glycolysis-Related Long Noncoding RNAs for Molecular Subtypes in the Tumor Immune Microenvironment of Lung Adenocarcinoma
Authors Li N , Su M, Zhu L, Wang L, Peng Y, Dong B, Ma L, Liu Y
Received 23 September 2021
Accepted for publication 10 November 2021
Published 27 November 2021 Volume 2021:14 Pages 8955—8974
DOI https://doi.org/10.2147/IJGM.S340615
Checked for plagiarism Yes
Review by Single anonymous peer review
Peer reviewer comments 2
Editor who approved publication: Dr Scott Fraser
Na Li,1 Mu Su,2 Louyin Zhu,2 Li Wang,2 Yonggang Peng,2 Bo Dong,1 Liya Ma,1 Yongyu Liu3
1Department of Central Laboratory, Shenyang Tenth People’s Hospital, Shenyang Chest Hospital, Shenyang, Liaoning, People’s Republic of China; 2Berry Oncology Corporation, Beijing, People’s Republic of China; 3Department of Thoracic Surgery, Shenyang Tenth People’s Hospital, Shenyang Chest Hospital, Shenyang, 110044, Liaoning, People’s Republic of China
Correspondence: Yongyu Liu
Department of Thoracic Surgery, Shenyang Tenth People’s Hospital, Shenyang Chest Hospital, No. 11 Beihai Street, Dadong District, Shenyang, 110044, Liaoning, People’s Republic of China
Tel/Fax +86 024 8832 0630
Email [email protected]
Purpose: Long noncoding RNAs (lncRNAs) and glycolysis regulate multiple types of cancer. However, the prognostic roles and biological functions of glycolysis-related lncRNAs in lung adenocarcinoma (LUAD) remain unclear. In this study, we investigated the role of glycolysis-related lncRNAs in LUAD.
Patients and Methods: We retrieved glycolysis-related genes from the Molecular Signatures Database and screened for prognostic glycolysis-related lncRNAs from The Cancer Genome Atlas.
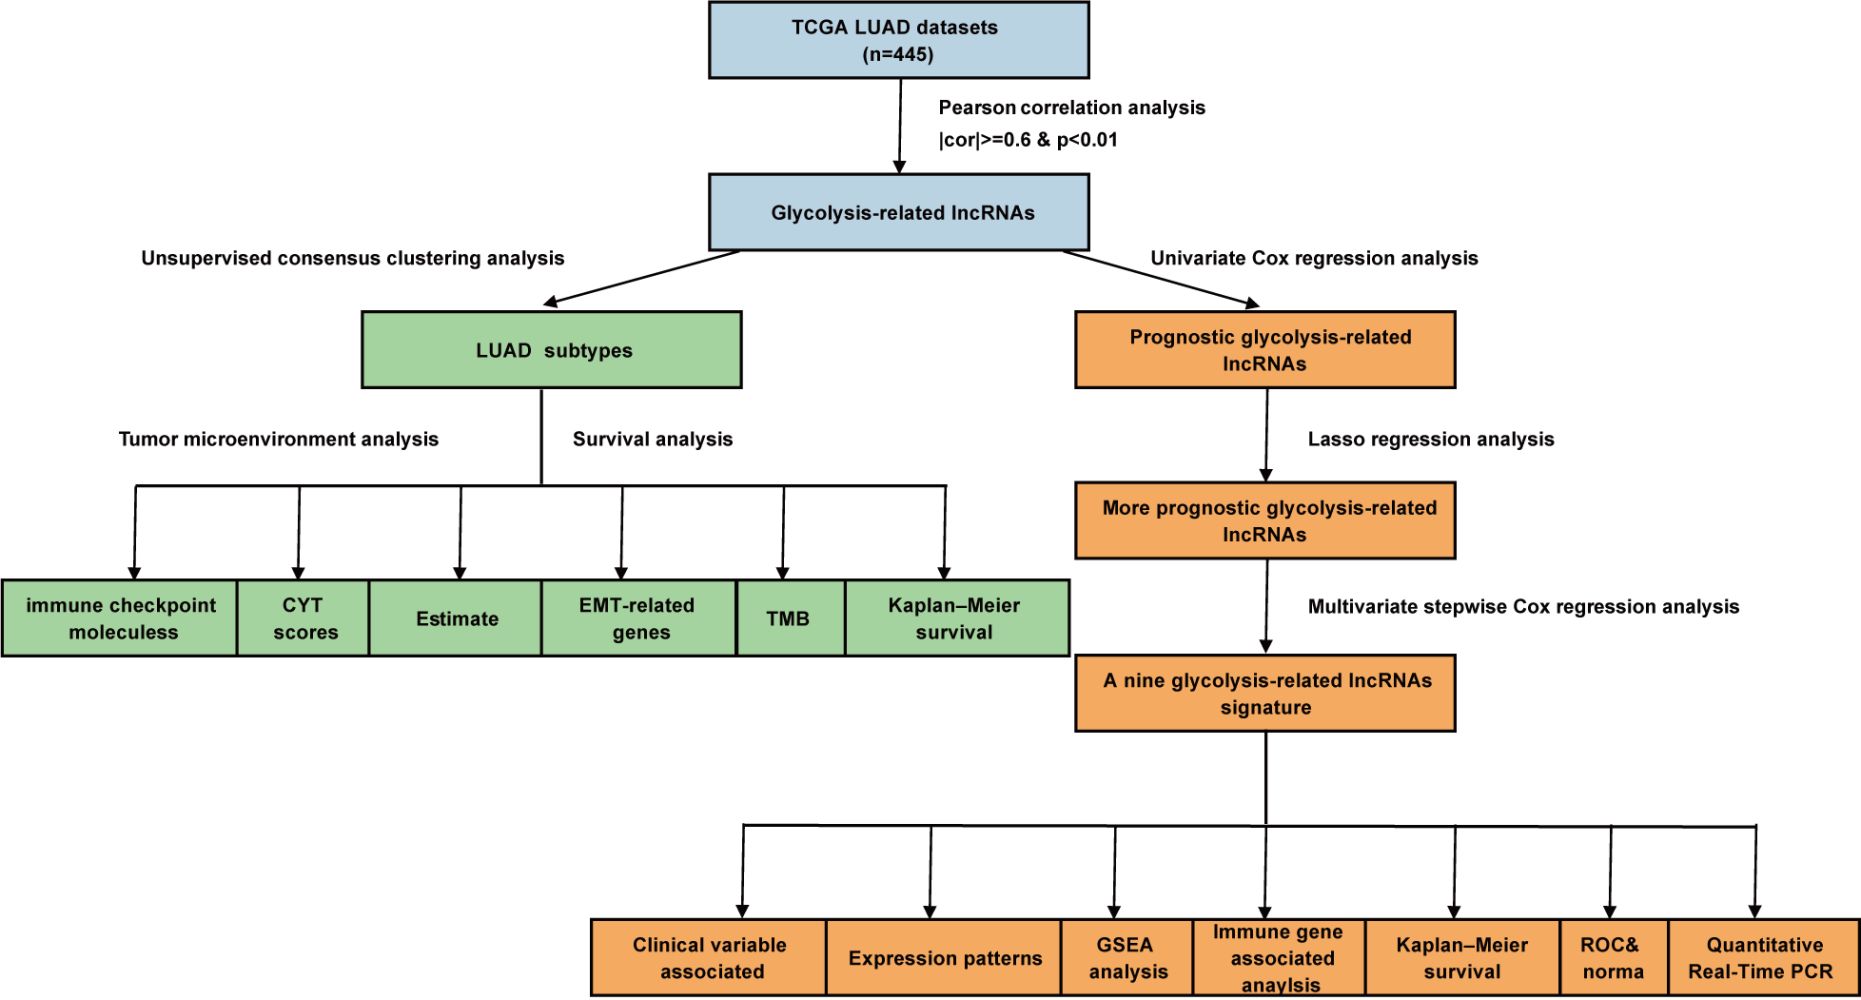
Results: We identified three LUAD subtypes (clusters 1– 3) by univariate Cox regression analysis and consensus clustering. Patients in cluster 1 had the best overall survival rates. Immune, stromal, and cytolytic-activity scores were the highest in cluster 1. The expression of immune checkpoint molecules (programmed cell death protein 1 and cytotoxic T-lymphocyte-associated protein 4) and other immune-related indicators was the highest in cluster 1, whereas that of epithelial cell biomarkers (Cadherin 1, Cadherin 2, and MET) was the lowest. Therefore, patients in cluster 1 may benefit from immunotherapy. Lasso–Cox regression and multivariate Cox regression analyses were used to select nine lncRNAs to build a robust prognostic model of LUAD. The area under the curve classifier values and a nomogram performed well in predicting survival times for patients with LUAD. The expression levels of nine lncRNAs were validated by quantitative reverse transcriptase-polymerase chain reaction analysis, and most of these lncRNAs were significantly related to immune-related mRNAs. Gene set enrichment analysis revealed that the high-risk group was enriched for cell cycle-related pathways and the low-risk group was enriched for pathways associated with immunity or immune-related diseases.
Conclusion: The LUAD subtypes and prognostic model developed here may help in clinical risk stratification, prognosis management, and treatment decisions for patients with LUAD.
Keywords: bioinformatics, expression, prognosis, regression
Graphical Abstract:
Introduction
Lung cancer is the malignant disease with the highest incidence and mortality rate worldwide.1 Lung cancer can be divided into two major categories: non-small cell lung cancer (NSCLC) and small-cell lung cancer. Lung adenocarcinoma (LUAD) is the major subgroup of NSCLC; its incidence has increased in recent years,2 and current treatments have shown limited ability for improving patient survival.3
Targeting glycolysis may be an attractive strategy for improving treatment outcomes for patients with cancer. The results of several studies have revealed that glycolysis is correlated with cancer progression. Cancer cells predominantly use glucose through the glycolysis pathway to generate adenosine triphosphate and pyruvic acid, even in the presence of sufficient oxygen.4 Many glycolysis-related enzymes, including hexokinase 2, phosphofructokinase, pyruvate kinase, lactate dehydrogenase, and glucose transporter GLUT1, are expressed at significantly higher levels in lung cancer cells than in normal cells.5–8 Reprogrammed glucose metabolism owing to enhanced glycolysis is a hallmark of cancer. In tumors and other proliferating cells, the rate of glucose uptake increases dramatically, and lactate is produced even in the presence of oxygen. This increase in glycolysis is termed the Warburg effect and was first discovered by Otto Warburg in 1956. The Warburg effect has been documented for over 90 years and is a critical metabolic pathway in cancer cells that supplies energy to sustain growth and proliferation.9 The remodeling of metabolic pathways is a key indicator of carcinogenesis and advanced progression in LUAD.10
Data from a pan-cancer study revealed that activated glycolysis was correlated with increased tumor immunity.11 Cancer cells primarily utilize the glycolysis pathway for energy metabolism, and inhibit cytotoxic T cell and natural killer cell activation to promote tumor immune evasion.12 According to recently published data, tumor glycolysis and tumor immune evasion are interdependent. Energy competition between the immune cells and tumor cells may contribute to tumor immunosuppression, and increased tumor glycolysis impairs tumor cell elimination by the immune system.5,6
Long noncoding RNAs (lncRNAs) are over 200 nucleotides long and lack protein-coding capacity.13 Increasing evidence shows that non-coding RNAs participate in signaling pathways involved in processes such as the cell cycle, immune regulation, and regulation of the epithelial–mesenchymal transition (EMT).14 Different types of lncRNAs can promote glycolysis activation, including HISLA and LINK-A.15,16
During carcinogenesis, various lncRNAs can function as mediators that modulate glycolysis and remodel cell metabolism through multiple pathways. For example, the lncRNA Tp53-regulated inhibitor of necrosis (TRINGS) is found in many types of cancer and can promote cancer cell proliferation through the STRAP–GSK3β–NF-κB pathway in an oxygen-deprived glycolytic environment.17 In addition, LINC01554 can interact with miR-365a and downregulate its activity, resulting in accelerated degradation of PKM2 (a glycolytic pyruvate kinase isoenzyme) via the ubiquitin–proteasome pathway, which represses aerobic glycolytic metabolism.18
The expression patterns of different groups of lncRNAs have been characterized as signatures for different subtypes or stages of cancer. Hence, many research groups have reported multiple disease-related lncRNA models for disease prognosis. Zhou et al identified eight lncRNAs that were significantly associated with improved overall survival (OS) in patients with NSCLC.19 Similarly, Zhou et al suggested the use of a risk score-prediction model for LUAD that was established using nine relapse-related lncRNAs.20 In addition, specific biological processes or pathway-related lncRNA signatures may provide a more precise prognostic model and suggest novel treatment options. For instance, Guo et al and Lu et al reported a ferroptosis-related lncRNA prognosis model for LUAD, and Sun et al showed immune infiltration-associated lncRNA signatures that may influence checkpoint factors in NSCLC.21–23
Moreover, elucidating the relationships between lncRNAs, glycolysis, and cancer progression may shed light on potential strategies for cancer control. So far, correlations between glycolysis-related lncRNAs and clinical outcomes of cancer patients have been clarified,24,25 with several studies focusing on a particular candidate and its functions in promoting glycolysis.5,26 However, few studies have investigated the underlying correlations among glycolysis-related lncRNAs, prognosis, and the immunological microenvironment in patients with LUAD.27–30
In this study, we successfully used lncRNAs to classify LUAD subtypes and construct a glycolysis-associated prognosis model for patients with LUAD. We also analyzed differences in the tumor microenvironment between the high-risk and low-risk groups identified using the prognostic model. Future investigations will focus on identifying the key mechanisms that are regulated by glycolysis and the tumor microenvironment to shed light on potential new treatments for LUAD.
Materials and Methods
Collecting Data from Patients with LUAD
Gene expression profiles (in fragments per kilobase million [FPKM] format), simple nucleotide variation data, and the corresponding clinicopathological details of patients with LUAD were obtained from The Cancer Genome Atlas (TCGA; https://portal.gdc.cancer.gov/). To reduce statistical bias, we excluded samples from patients with survival times of less than 30 days. We enrolled 445 patients with matching clinical features in this study. The gene expression profiles (HiSeq counts format) of patients with LUAD, breast cancer (BRCA), colon cancer (COAD), liver cancer (LIHC), lung squamous cell carcinoma (LUSC), prostate cancer, stomach cancer, and thyroid cancer (THCA) were also obtained from TCGA.
Correlation Analysis to Identify Glycolysis-Related lncRNAs
To identify glycolysis-related lncRNAs, we first selected all glycolysis-related genes from the Molecular Signatures Database (MSigDB, v7.2; http://www.gsea-msigdb.org/gsea/msigdb/index.jsp) and extracted an mRNA-expression matrix for the glycolysis-related genes.31 We then identified all lncRNAs from the TCGA gene expression data based on the GENCODE project (https://www.gencodegenes.org). Subsequently, Pearson correlation analysis was performed between glycolysis-related gene expression levels and all lncRNA expression data in all LUAD samples to mine for glycolysis-related lncRNAs based on correlation coefficients (cor) and p-values (|cor| ≥ 0.6 and p < 0.01).
Unsupervised Consensus Clustering Analysis
To explore potential molecular subtypes, the “ConsensusClusterPlus” package of R software32 was used to cluster the LUAD samples. The cluster number, k, was set to range from two to nine. We selected the optimal k value based on empirical cumulative-distribution function (CDF) plots, delta area scores, and consistent matrix (CM) plots. The CDF plots were generated to reveal the consensus distributions for each k value. The CM plots were generated to determine whether the boundaries for each subtype were sharp and clear in order to assess the robustness and reliability of each subtype. The delta area score (y-axis) was analyzed as a measure of the relative increase in cluster stability.
Tumor Microenvironment Analysis of LUAD Subtypes
Cytolytic-activity (CYT) scores were calculated based on the geometric means of granzyme and perforin expression.33 We calculated the immune, stromal, and estimate scores for all patients using the “estimate” package of R software.34 The tumor-mutational burden (TMB) of each sample was analyzed using Perl language to calculate the number of bases per million bases mutated.
Construction and Validation of a Glycolysis-Related lncRNA Signature
Univariate Cox regression analysis was performed to screen for prognostic glycolysis-related lncRNAs, with a p value of <0.05 as the screening criterion. Thereafter, 445 LUAD patients were randomized into a training cohort (n = 222) and a testing cohort (n = 223). The training cohort was used to construct the signature, and the testing cohort was used to validate its efficiency. In the training cohort, we selected lncRNAs with significant clinical prognostic variability using LASSO.35 These filtered genes were subjected to multivariate, stepwise Cox regression analysis, and a glycolysis-related lncRNA risk score was developed to determine the prognosis. The following formula was used to calculate the risk scores:

where Expi and βi represent the FPKM value and multivariate Cox coefficient of each prognostic lncRNA, respectively, and N is the number of lncRNAs. A risk score was calculated for each patient, and patients were divided into high- and low-risk groups based on the median risk score. The patient survival status, survival time, and lncRNA expression levels were displayed using the “pheatmap”36 and “survival” packages of R software. Kaplan–Meier analysis, receiver operating characteristic (ROC) analysis, and a nomogram were used to estimate the performance of the signature. The nomogram integrated all independent prognostic factors via the “rms” package of R software. ROC analysis was performed using the “timeROC” package of R software.
Gene Set Enrichment Analysis (GSEA)
GSEA37 was used to identify significantly enriched Kyoto Encyclopedia of Genes and Genomes (KEGG) pathways in the high-risk and low-risk groups. Pathways with a p value of <0.05 were considered to be significantly enriched.
Correlation Analysis Between Glycolysis-Related lncRNAs and Immune-Related mRNAs
We obtained immune-related mRNAs from the ImmPort database (https://www.immport.org/).38 We performed Pearson correlation analysis between the selected glycolysis-related lncRNAs and immune-related mRNAs to build a prognostic model for LUAD. Relationships with “|cor| ≥ 0.6” and “p < 0.05” were considered to reflect significant differences and were visualized as heatmaps using the “ComplexHeatmap” package of R software.
Independence of the Glycolysis-Related lncRNA Signature
To determine whether the glycolysis-related lncRNA signature could serve as an independent prognostic indicator for OS, we studied it in combination with other clinical features and performed univariate and multivariate Cox regression analyses; p < 0.05 was considered to reflect a statistically significant difference.
Extraction of lncRNA and Quantitative Reverse Transcriptase-Polymerase Chain Reaction (qRT-PCR) Analysis
Total RNA was extracted from normal and LUAD tissues using the TRIzol reagent (Life Technologies, Carlsbad, CA, USA). Total RNA was reverse-transcribed to complementary DNA (cDNA) using the TOYOBO ReverTra Ace qPCR RT Kit. The following lncRNAs were detected by qRT-PCR: LINC02390, AC010999.2, IER3-AS1, AL031600.2, NR2F2-AS1, AC073517.1, LINC02086, AL358115.1, and HSPC324. Briefly, 2 µL of pre-amplified cDNA was mixed with 10 µL of SYBR Green Master Mix, 6.4 µL of ddH2O, and 0.8 µL of specific primers. Quantitative real-time PCR was performed with the cDNA products using an initial heating step at 95 °C for 60 s, followed by 40 cycles of 95 °C for 15 s, 57 °C for 15 s, and 72 °C for 45 s. All qRT-PCR data were obtained from at least three independent experiments. Gene expression levels were normalized to that of the reference gene, GAPDH.24,39–43 The primer sequences for each lncRNA were as follows: AC010999.2: forward primer: 5′-CGGTCAAGAGCAGTCTGAGATATTGG-3′, reverse primer: 5′-TGTGTCATAATGTGCCCTATCCTTAGC-3′; HSPC324 forward primer: 5′-CGAGCCCTGAGTGATTCCATTGAC-3′, reverse primer: 5′-TCCTCCTGCGGTCCTTGGTAAC-3′; AL358115.1 forward primer: 5′-TCATTCTCTTCTGCTCTTCTGCCATG-3′, reverse primer: 5′-CCGCTGTCTGCTTCCAAGGATG-3′; LINC02390 forward primer: 5′-ATGGGAGTGCTGGGAAGGGAAG-3′, reverse primer: 5′-TGGCAGTAGGGCAGAAGTGGAG-3′; LINC02086 forward primer: 5′-CCTTATACCAGACAGTGATGCGAGAC-3′, reverse primer: 5′-GTAATTGGCAGAGCAGGAACTTGAAC-3′; AC073517.1 forward primer: 5′-CCACTCACCTCCTCCAACTCCTC-3′, reverse primer: 5′-ACCGCTCTCAGATAGTCCTGTTCC-3′; NR2F2-AS1 forward primer: 5′-GTACTCGGATCTCGCCACCTCTG-3′, reverse primer: 5′-AGATTCAACTGCCTGCCACTCTTG-3′; AL031600.2 forward primer: 5′-GCCATCACCTGCCGTTCTATCAC-3′, reverse primer: 5′-CATCTCTCCCTCCACCTTCCTCAG-3′; IER3-AS1 forward primer: 5′-TCTACCTCGCAGCCACCCTAAAG-3′, reverse primer: 5′-GCATCTCAACTCCGTCTGTCTACTG-3′; GAPDH forward primer: 5′-ATCCCATCACCATCTTCCAGG-3′, reverse primer: 5′-TGATGACCCTTTTGGCTCCC-3′.
Statistical Analysis
All statistical analyses were performed using R software, version 3.6.3 (www.r-project.org). Kaplan–Meier curves were generated to analyze survival differences, and the log–rank test was used for comparisons. The Wilcoxon test was used to analyze continuous variables and one-way analysis of variance was used to analyze categorical variables. For all statistical analyses, the threshold for statistical significance was set at p < 0.05.
Results
LUAD is a very common type of NSCLC. The results of many studies have revealed the importance of lncRNAs and glycolysis in many cancers. However, the associations between lncRNAs and glycolysis in LUAD remain unclear. To explore the prognostic roles and biological functions of lncRNAs and glycolysis in LUAD, three clusters of LUAD subtypes were identified based on the expression profiles of certain prognostic glycolysis-related lncRNAs. These LUAD subtypes were found to have different tumor microenvironment characteristics by analyzing multiple immune-related indicators and EMT biomarkers. In addition, a nine-lncRNA, glycolysis-related risk signature was identified to predict the treatment outcomes of patients with LUAD. Furthermore, the functions of lncRNAs were investigated, and the expression levels of lncRNAs were also verified. Our work revealed that glycolysis-related lncRNAs may affect the survival of patients with LUAD by influencing the tumor microenvironment.
Identifying Prognostic lncRNAs
Glycolysis-related genes were obtained from MSigDB, mainly from the following three gene sets: Hallmark glycolysis, Reactome glycolysis, and KEGG glycolysis and gluconeogenesis. After removing the overlapping genes, 288 glycolysis-related genes remained (Supplementary Table 1). By performing correlation analysis between glycolysis-related genes and all lncRNA expression data, 1113 lncRNAs were selected as glycolysis-related lncRNAs (filter: |cor| ≥ 0.6 and p < 0.01; Supplementary Table 2). Then, 43 lncRNAs with significant prognostic differences in patients with LUAD were obtained by univariate Cox regression analysis (p < 0.05; Supplementary Figure 1).
Consensus Clustering Identified Three LUAD Clusters
Consensus clustering was performed to explore the potential molecular subtypes of LUAD based on the 43 lncRNAs. The smoothest CDF curve according to the value of the consensus index (Supplementary Figure 2A), the highest delta area scores (Supplementary Figure 2B), and the highest consistency of the CM plot was achieved with k = 3 (Supplementary Figure 2C). This was thus considered to provide the optimal subtype grouping. Using this k value, the 445 cases were divided into three subtypes: cluster 1, cluster 2, and cluster 3 (Figure 1A).
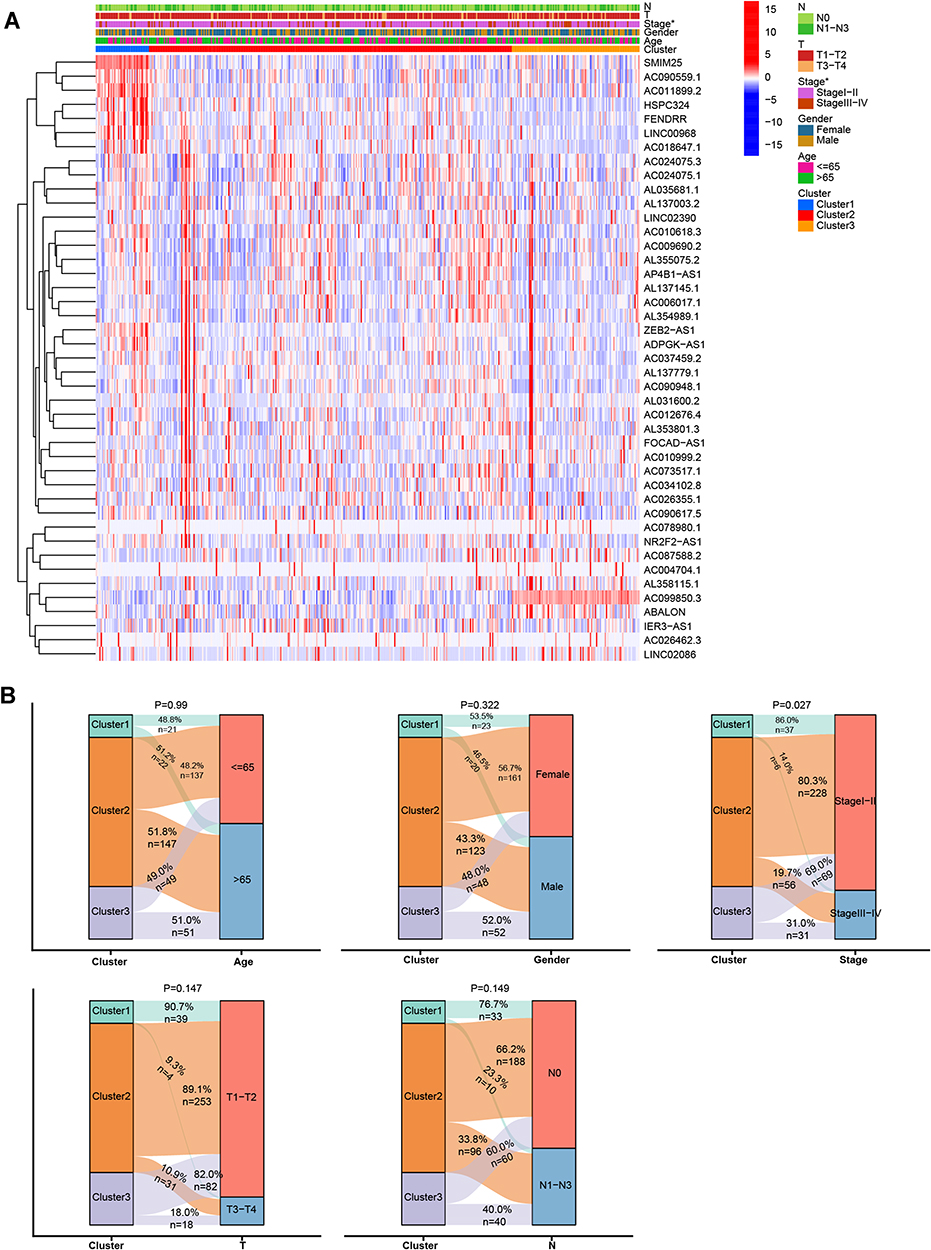 |
Figure 1 Clinical and molecular characteristics of the LUAD subtypes. (A) Heatmap showing lncRNA expression and clinical characteristics in the three LUAD subtypes. (B) Comparison of clinical characteristics in the three subtypes. *P < 0.05. |
To explore the correlations among molecular subtype, clinical features, and prognosis-related lncRNA expression in the LUAD patients in our study cohort, we generated a heatmap and found differential expression of lncRNAs in the different cluster subtypes (Figure 1A). Among the prognosis-related lncRNAs, we observed a high expression of SMIM25, AC090559.1, AC011899.2, HSPC32.4, FENDRR, LINC00968, and AC018647.1 in cluster 1 and of AC099850.3 in cluster 3. There were no significant differences in age, sex, T stage, or N stage among the three clusters; however, the staging showed significant differences, with the proportion of stage I–II tumors decreasing from cluster 1 to cluster 2 and from cluster 2 to cluster 3 (Figure 1B).
Cluster 1 Represents a Novel Inflammatory LUAD Subtype
In addition, we explored whether differences in survival were associated with the different subtypes. Kaplan–Meier survival analysis showed significant differences in OS between the three clusters. Patients in clusters 2 and 3 had significantly lower OS rates than those in cluster 1 (p = 0.003; Figure 2A).
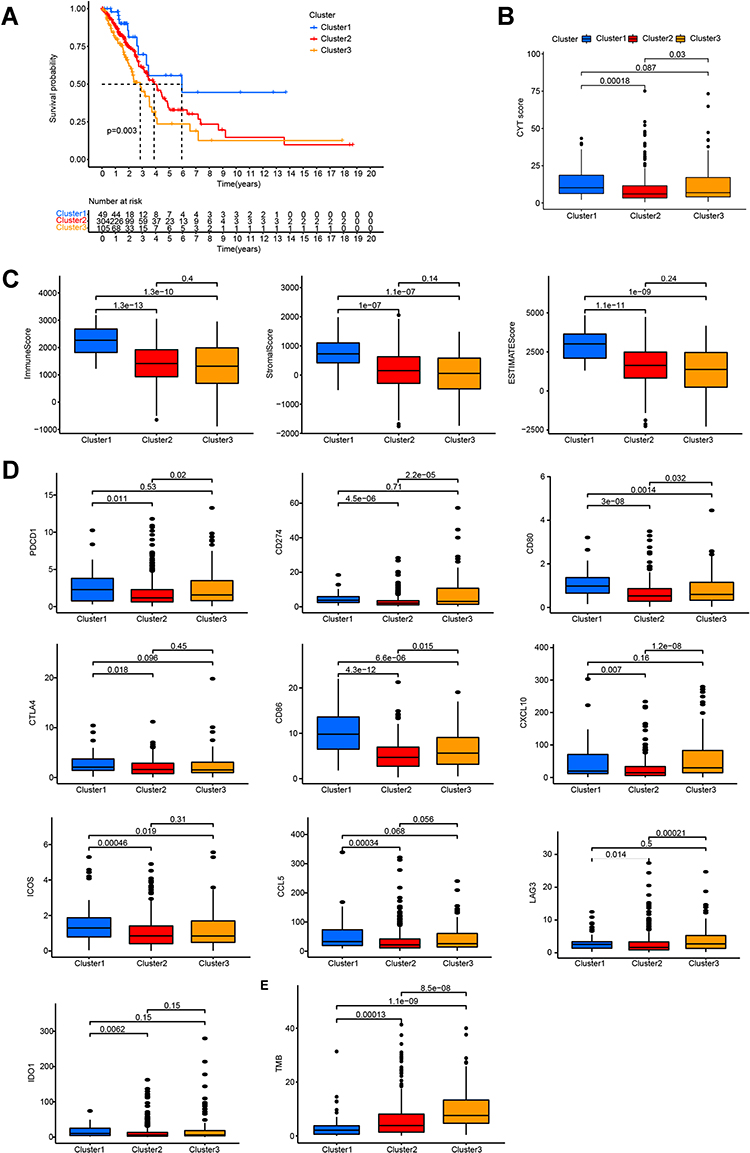 |
Figure 2 Cluster 1 is a novel inflammatory LUAD subtype. (A) Kaplan–Meier survival curves for the LUAD subtypes. (B) Comparison of CYT scores for the three subtypes. (C) Immune, stromal, and estimate score for the LUAD subtypes. (D) Differences in the expression of immune-target genes between the LUAD subtypes. (E) Differences in TMB between the LUAD subtypes. |
We hypothesized that the better prognosis of patients in cluster 1 may have resulted from better immune performance in these patients. Previous data showed a relationship between glycolysis-related genes and the tumor microenvironment; however, this relationship has not yet been systematically elucidated in LUAD. Hence, in this study, we analyzed correlations between prognostic glycolysis-related lncRNAs and multiple immune-related indicators with different molecular subtypes. Cluster 1 tumors had the highest CYT scores (Figure 2B) as well as the highest immune, stromal, and estimated scores according to the “estimate” package of R software (Figure 2C). Moreover, cluster 1 tumors had the highest expression levels of many immune checkpoint molecules (Figure 2D), including PDCD1, which encodes programmed cell death protein 1 (PD-1). They also had the highest levels of cytotoxic T-lymphocyte-associated protein 4 (CTLA4) and the CTLA4-related proteins, CD80 and CD86. Other targetable immune checkpoints, including ICOS and IDO1, showed the highest expression in cluster 1 tumors. Although CD274, which encodes programmed death ligand 1, was not highly expressed in cluster 1 tumors, it had a significantly higher expression in cluster 1 than in cluster 2. A similar pattern was observed for CXCL10, which is a stimulator of interferon genes (STING)-induced T-cell-attractant chemokine; it was the most highly expressed in cluster 1 and cluster 3 and at significantly higher levels than in cluster 2. CCL5, another STING-induced T-cell-attractant chemokine, also showed the highest expression in cluster 1 tumors. Notably, TMB was not consistently higher in cluster 1 tumors (Figure 2E); however, many studies have shown that TMB is not the only standard for immunity.
The EMT refers to the specific biological processes whereby epithelial cells transform into mesenchymal cells; this transformation serves important roles in chronic inflammation, cancer metastasis, and invasion. Many studies have clarified the correlations between the EMT, T cell infiltration, and immunotherapy. The results suggest that patients who have tumors with higher expression of EMT-related genes are more likely to benefit from immune checkpoint blockade. Therefore, we detected the expression levels of EMT-related genes in all three tumor clusters. CDH1, CDH2, and MET, which are epithelial cell markers, showed the lowest expression in cluster 1 tumors. SNAI1, VIM, AXL, TWIST2, ZEB1, ZEB2, and TGFB1 are mesenchymal cell markers. In cluster 1, these markers had the highest expression levels or expression levels similar to those in cluster 3, and their expression levels were higher than those in cluster 2 (Figure 3). Therefore, we propose that cluster 1 was the “most mesenchymal” cluster, whereas cluster 2 was the “most epithelial” cluster. These results suggest that cluster 1 is an inflammatory subtype of LUAD.
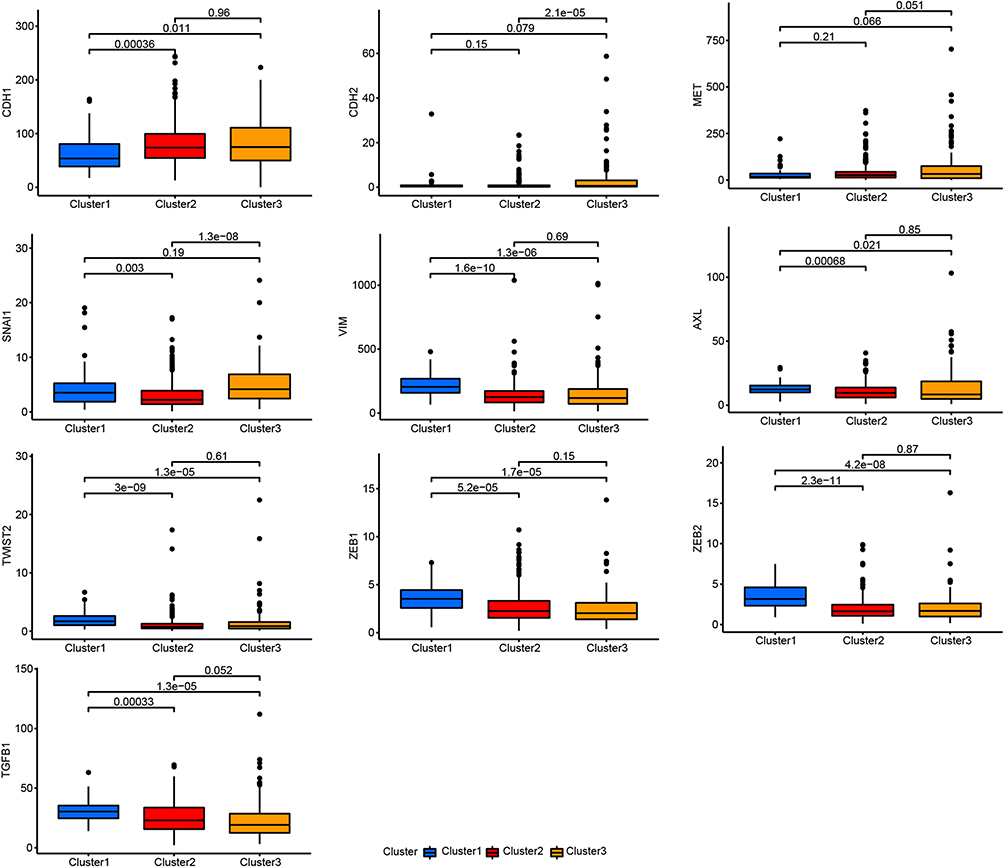 |
Figure 3 Differences in the expression of EMT-related genes between the LUAD subtypes. |
Construction of a Prognostic LUAD Model Based on the Signature of Nine Glycolysis-Related lncRNAs
We further constructed a prognostic model for LUAD based on the 43 lncRNAs used for LUAD subtype analysis. After preprocessing the clinical data, 445 patients with an OS of ≥30 days were included in the study cohort to establish the prognostic model. The 445 patients were randomly divided into a training cohort (n = 222) and a testing cohort (n = 223). By studying the training cohort, we identified 16 lncRNAs as effective prognostic lncRNAs, using LASSO and Cox regression analyses (Supplementary Figure 3). Subsequently, nine lncRNAs (AC010999.2, IER3-AS1, AL031600.2, NR2F2-AS1, AC073517.1, LINC02086, LINC02390, AL358115.1, and HSPC324) that constituted the best combination as a risk score signature for predicting patient outcomes were selected by multivariate, stepwise Cox regression analysis. The prognosis-associated glycolysis-related lncRNA signature was constructed, and the risk score of each patient in the cohort was calculated using the following risk formula: Risk score = (−2.325 × expression value of AC010999.2) + (0.738 × expression value of IER3-AS1) + (−2.699 × expression value of AL031600.2) + (3.073 × expression value of NR2F2-AS1) + (−1.23 × expression value of AC073517.1) + (0.622 × expression value of LINC02086) + (−1.41 × expression value of LINC02390) + (2.13 × expression value of AL358115.1) + (−0.604 × expression value of HSPC324). Hazard ratios (HRs) were calculated to represent the risk associated with each lncRNA. AC010999.2, AL031600.2, AC073517.1, LINC02390, and HSPC324 all had HR values of <1, indicating that they were low-risk protective lncRNAs, whereas the other four lncRNAs had HR values of >1, indicating that they were high-risk lncRNAs (Table 1).
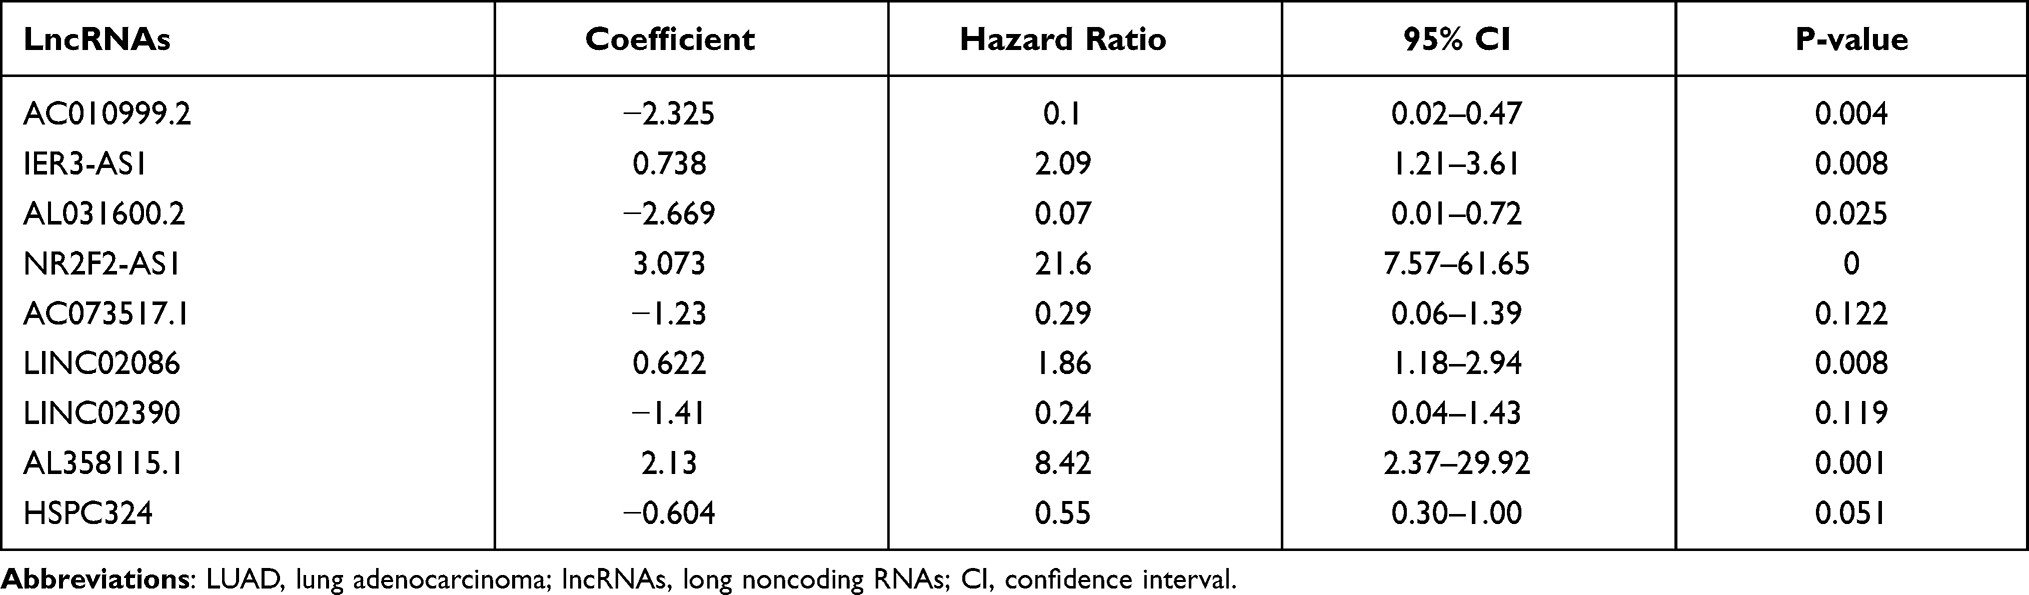 |
Table 1 Characteristics of the Nine Glycolysis-Related lncRNAs in LUAD |
To assess the sensitivity and specificity of the glycolysis-related lncRNA prognostic model, the area under the curve (AUC) values for the training and testing sets were calculated. These values were 0.821 and 0.721 for 1-year prognostic predictions based on the time-dependent ROC curve, respectively, whereas the respective values for 3-year predictions were 0.717 and 0.736, and those for 5-year predictions were 0.772 and 0.726 (Figure 4A and C). LUAD tumor samples were divided into high-risk and low-risk groups based on the median risk score. Patients in the high-risk group had a significantly worse prognosis than those in the low-risk group, according to the Kaplan–Meier survival curves (p < 0.001; Figures 4B and D). The ability of the signature to determine the prognosis of patients with LUAD was also demonstrated using a nomogram constructed by multivariate, stepwise Cox regression analysis. According to the corresponding scores of each feature, if the associated cumulative score was <200, the survival probability at 1 year may be >95%; for 3 years, the cumulative score was <186 and the survival probability at 3 years may be >95%; and for 5 years, the cumulative score was <172 and the survival probability may be >95% (Figure 4E). The nomogram showed that AL031600.2, NR2F2-AS1, and AC010999.2 were the most important lncRNAs in the prognostic LUAD model.
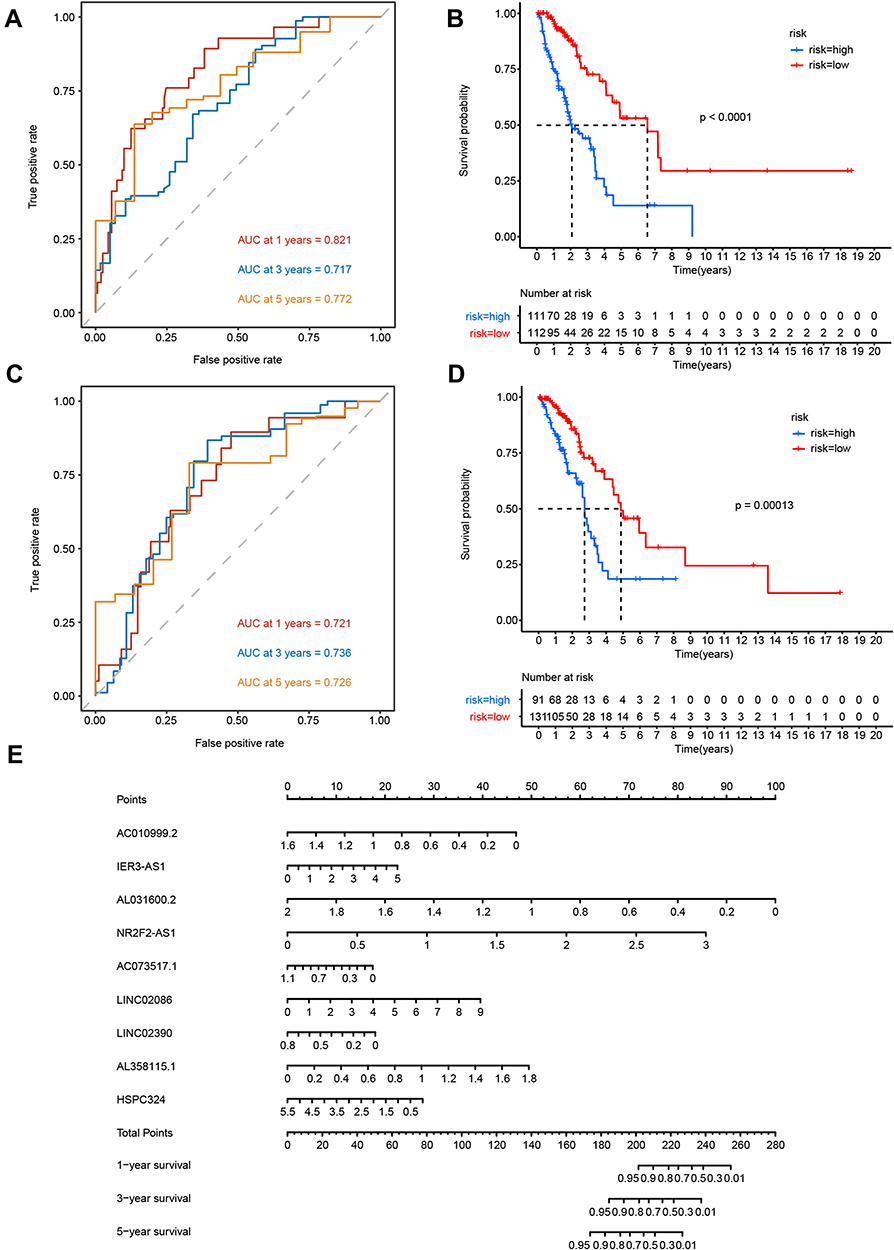 |
Figure 4 LUAD lncRNA prognostic prediction model. (A and B) AUC value of the ROC curves for the lncRNA risk score in the training set and testing set. (C and D) Kaplan–Meier OS curves for patients in high- and low-risk groups in the training set and testing set. (E) Nomogram from multivariate stepwise Cox regression for 1-, 3-, and 5-year survival. |
We also compared several lncRNA prognostic models of LUAD that have been published, including an immune-related six-lncRNA signature constructed by Miao et al,44 an immune-related four-lncRNA signature by Zhang et al,45 and a ferroptosis-related twelve-lncRNA signature proposed by Lu et al.22 The model generated by Wen et al did not show good performance with the LUAD datasets; Zhang et al’s model showed poor performance with the test datasets, and Zhao et al’s model was also not stable enough. The AUC value of these three training sets was almost 0.7, but the AUC of their testing set was mostly between 0.6 and 0.7 (Supplementary Figure 4).
Expression Patterns of the Nine Glycolysis-Related lncRNAs
Although the signature of the nine glycolysis-related lncRNAs performed well in predicting the 1-, 3-, and 5-year survival for patients with LUAD, we were also interested in understanding whether it could effectively differentiate between LUAD and normal samples. As expected, we found that the nine lncRNAs showed significant expression differences between LUAD cancer samples and normal samples and could thus be used to distinguish normal samples from tumor samples (p < 0.05; Figure 5A). HSPC324 and NR2F2-AS1 were highly expressed in normal samples, whereas the remaining seven lncRNAs were highly expressed in tumor samples. We also validated the expression levels of nine glycolysis-related lncRNAs in normal and LUAD tissues by performing qRT-PCR assays. The results showed that HSPC324 and NR2F2-AS1 were expressed at significantly higher levels in normal samples, whereas AC010999.2, IER3-AS1, AC073517.1, LINC02086, and LINC02390 were expressed at significantly higher levels in tumor samples. Although AL031600.2 expression did not differ significantly between normal and tumor samples, we observed that at least three pairs of samples had higher AL031600.2 expression in tumor tissues than in normal tissues. Similarly, we also found that AL358115.1 was more highly expressed in tumor tissues than in normal tissues, although this difference was not statistically significant (Figure 5B). The AL031600.2 and AL358115.1 expression levels were not significantly different between tumor and normal tissues. Analysis of the LUAD datasets from the TCGA database revealed that the expression levels of AL031600 and AL358115.1 were not higher in tumor tissues. Therefore, we allowed individual pairs of samples to have different expression patterns. To further investigate the expression patterns of the nine glycolysis-related lncRNAs, we determined their expression levels in seven other common cancers. The expression patterns of the nine glycolysis-related lncRNAs in LUAD were similar to those in other cancers. HSPC324 was highly expressed in adjacent non-tumor tissues of BRCA, COAD, LIHC, LUSC, and PRAD; NR2F2-AS1 was highly expressed in normal samples of BRCA, COAD, LUSC, PRAD, and THCA; and the remaining seven lncRNAs were highly expressed in tumor samples of most cancers (Figure 6). These findings may apply to other cancers as well.
 |
Figure 5 Expression patterns of the nine glycolysis-related lncRNAs. (A) Heatmap of the expression of the nine glycolysis-related lncRNAs in tumor and normal samples. (B) Expression of the nine glycolysis-related lncRNAs in eight pairs of LUAD tumor and normal tissues. *P<0.05, **P<0.01, ***P<0.001. |
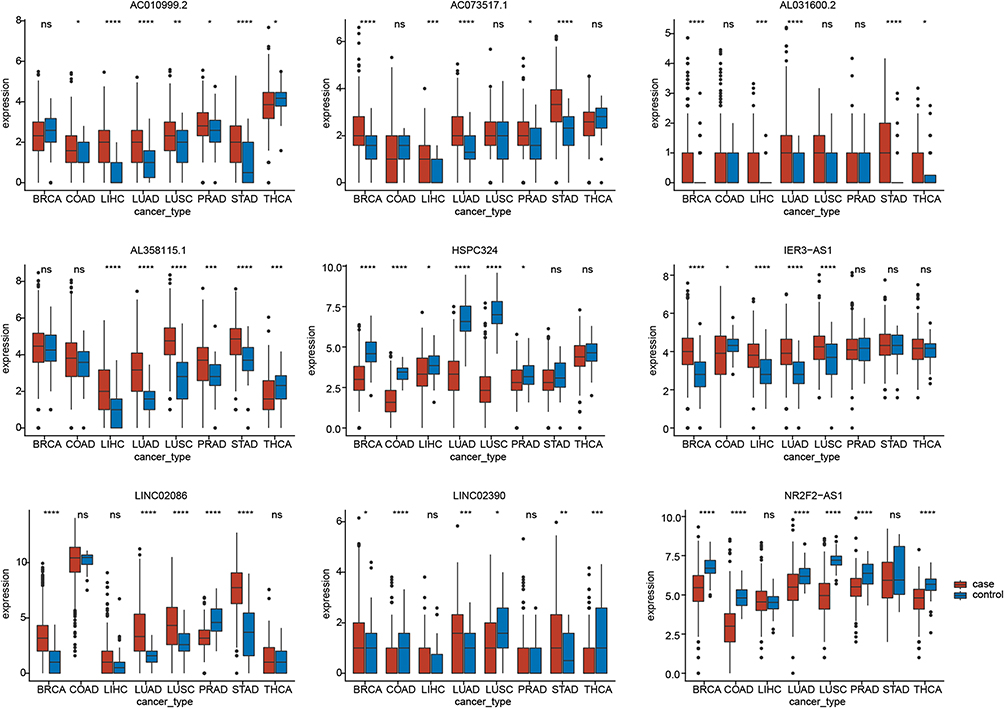 |
Figure 6 Expression of the nine glycolysis-related lncRNAs across multiple cancer types. *P<0.05, **P<0.01, ***P<0.001, ****P<0.0001. |
Function of the Nine Glycolysis-Related lncRNAs
The expression levels of the nine glycolysis-related lncRNAs correlated significantly with LUAD, based on univariate analysis. Through the above analysis, we found that cluster 1 was related to immunity; therefore, we next examined whether the nine lncRNAs were also related to immune-related mRNAs using the ImmPort database. Seven of them (AC010999.2, AL031600.2, NR2F2-AS1, AC073517.1, LINC02390, AL358115.1, and HSPC324) were significantly associated with immune-related mRNAs, of which six (AC010999.2, AL031600.2, NR2F2-AS1, AC073517.1, LINC02390, and AL358115.1) shared many significant immune-related mRNAs (Figure 7A).
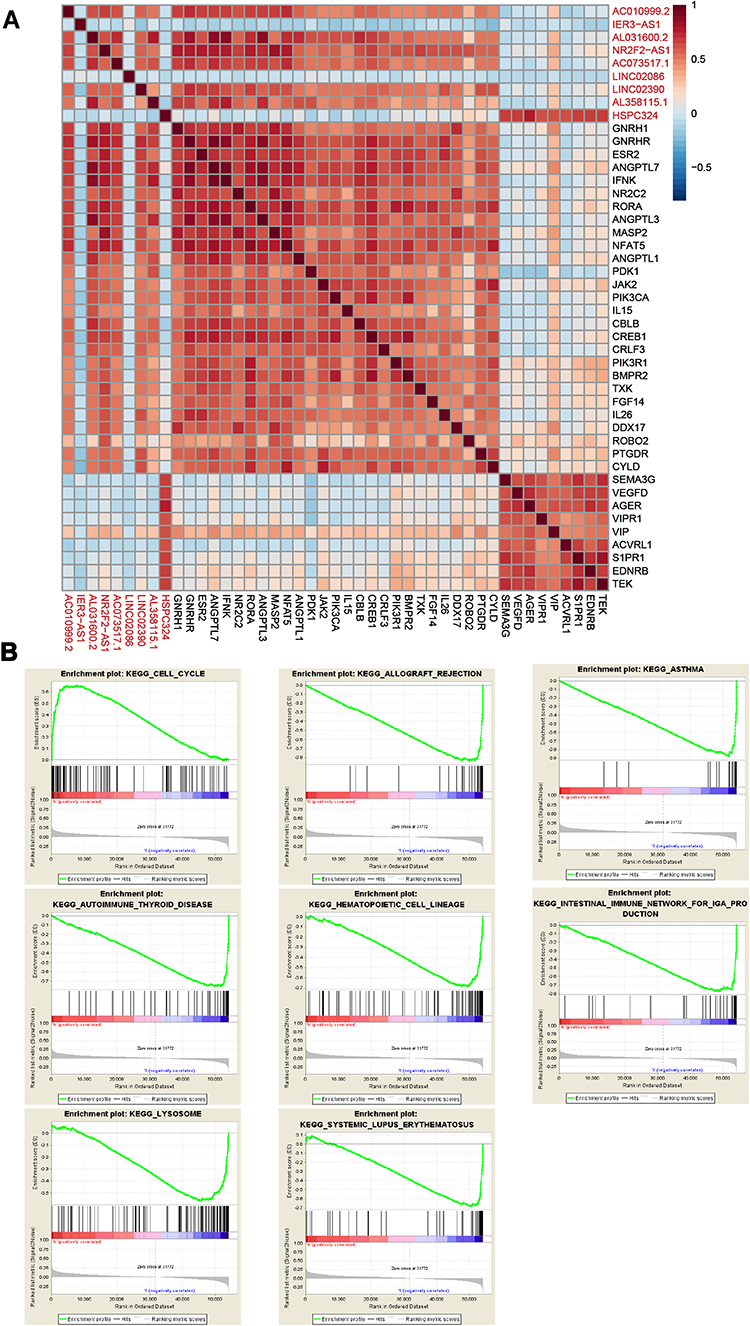 |
Figure 7 Functional analysis of the nine glycolysis-related lncRNAs. (A) Correlations between the glycolysis-related lncRNAs and immune-related mRNAs. (B) GSEA for high- and low-risk groups. |
To identify biological pathways that are potentially associated with the glycolysis-related lncRNA signature, GSEA was conducted to screen for significantly enriched KEGG pathways in the low- and high-risk groups. We found that the high-risk group was enriched in terms of cell cycle pathways, whereas the low-risk group was enriched in pathways associated with allograft rejection, asthma, autoimmune thyroid disease, hematopoietic cell lineages, the intestinal immune network for IgA production, lysosomes, and systemic lupus erythematosus (Figure 7B). Many of the KEGG pathways enriched in the low-risk group were related to immunity or immune-related diseases. These results further indicate that the nine lncRNAs may affect LUAD-related immune functions and, thus, the survival of patients with LUAD.
Correlation of the Nine Glycolysis-Related lncRNAs with Clinical Characteristics
To further confirm the robustness of the glycolysis-related lncRNA signature for LUAD prognosis, a stratified analysis of clinical variables was performed, and patients were assigned into different subgroups according to age, sex, stage, tumor (T), and node (N). As shown in Supplementary Figure 5, even in different stratification subgroups, the OS times of patients with LUAD in the low-risk group were significantly higher than those in the high-risk group (p < 0.05). These results indicate that the glycolysis-related lncRNA signature is a robust marker that can help determine the prognosis of LUAD without considering the influence of other clinical factors.
By comparing different clusters and clinical groups, we found that the risk scores based on the combination of the nine glycolysis-related lncRNAs differed significantly with different clusters, stages, and T subgroups (Figure 8A). Moreover, to verify that the signature was an independent prognostic factor in LUAD, we performed univariate and multivariate Cox regression analyses, in combination with other clinical factors. The stage, T, N, and risk score were significantly associated with LUAD prognosis when performing univariate analysis (p < 0.01; Figure 8B), but only the N stage and the lncRNA risk score remained significantly associated after performing multivariate analysis (p < 0.01; Figure 8C).
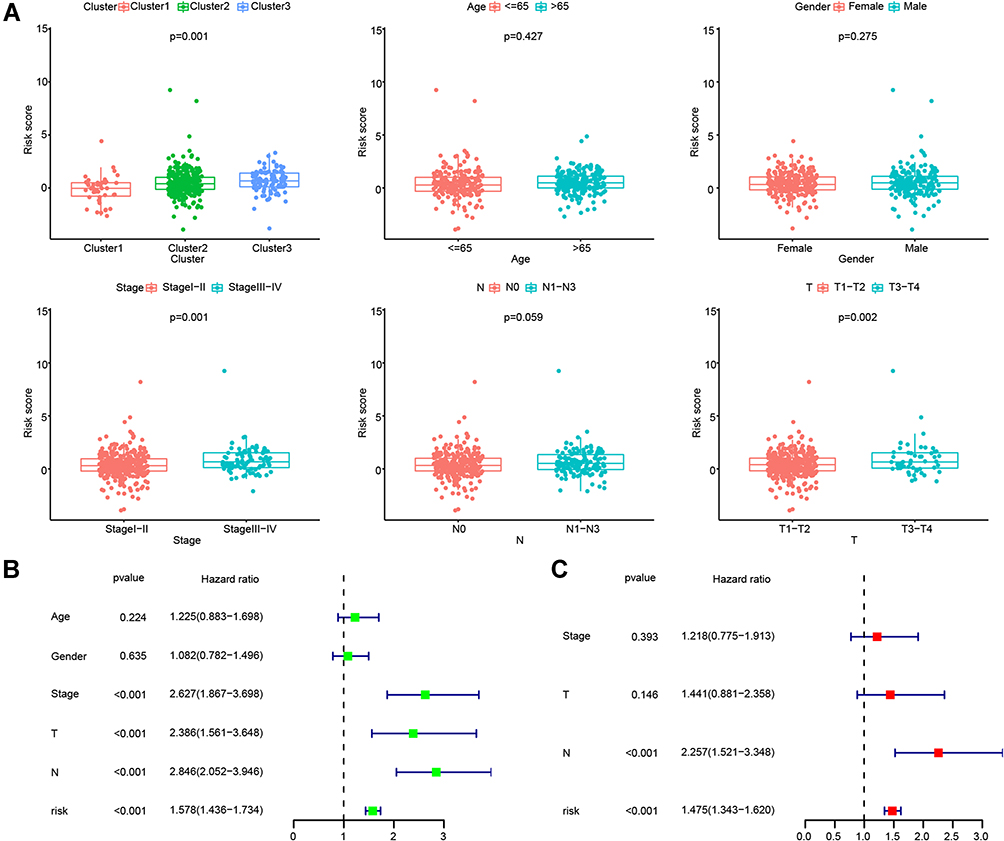 |
Figure 8 The signature of the nine glycolysis-related lncRNAs was an independent prognostic factor. (A) Comparisons of risk scores in different groups, including patients grouped by LUAD subtype, age, gender, stage, N, and T. (B) Univariate Cox regression analysis between glycolysis-related lncRNAs and clinical characteristics. (C) Multivariate Cox regression analysis between glycolysis-related lncRNAs and clinical characteristics. |
Construction of a Prognostic LUAD Model Based on lncRNA Risk Score and N Stage
We integrated both independent factors (ie, the N stage and lncRNA risk score) related to the prognosis of LUAD, as determined by multivariate Cox regression analysis. The ROC AUC values in the training set were 0.823, 0.782, and 0.863 for 1-, 3-, and 5-year survival, respectively, whereas those in the testing set were 0.788, 0.819, and 0.719, respectively (Figure 9A and C). The performance of the combined prognostic model showed little improvement when compared with the lncRNA risk score alone. The low-risk group had a better prognosis than the high-risk group in both the training and testing sets (Figure 9B and D). Furthermore, the nomogram showed good performance in predicting 1-, 3-, and 5-year survival in patients with LUAD. Our findings indicated that a cumulative score of <26 corresponds to a survival probability at 1 year of >95%, that a cumulative score of <12 corresponds to a 3-year survival probability of >95%, and that a cumulative score of <8 corresponds to a 5-year survival probability of >90% (Figure 9E). Although the nomogram constructed using lncRNA risk scores and N stages did not represent an improvement compared with the lncRNA risk score alone, it could at least predict 90% 1-, 3-, and 5-year survival probabilities. This in turn indicates that the nine glycolysis-related lncRNAs identified here were sufficient for determining the prognosis of LUAD.
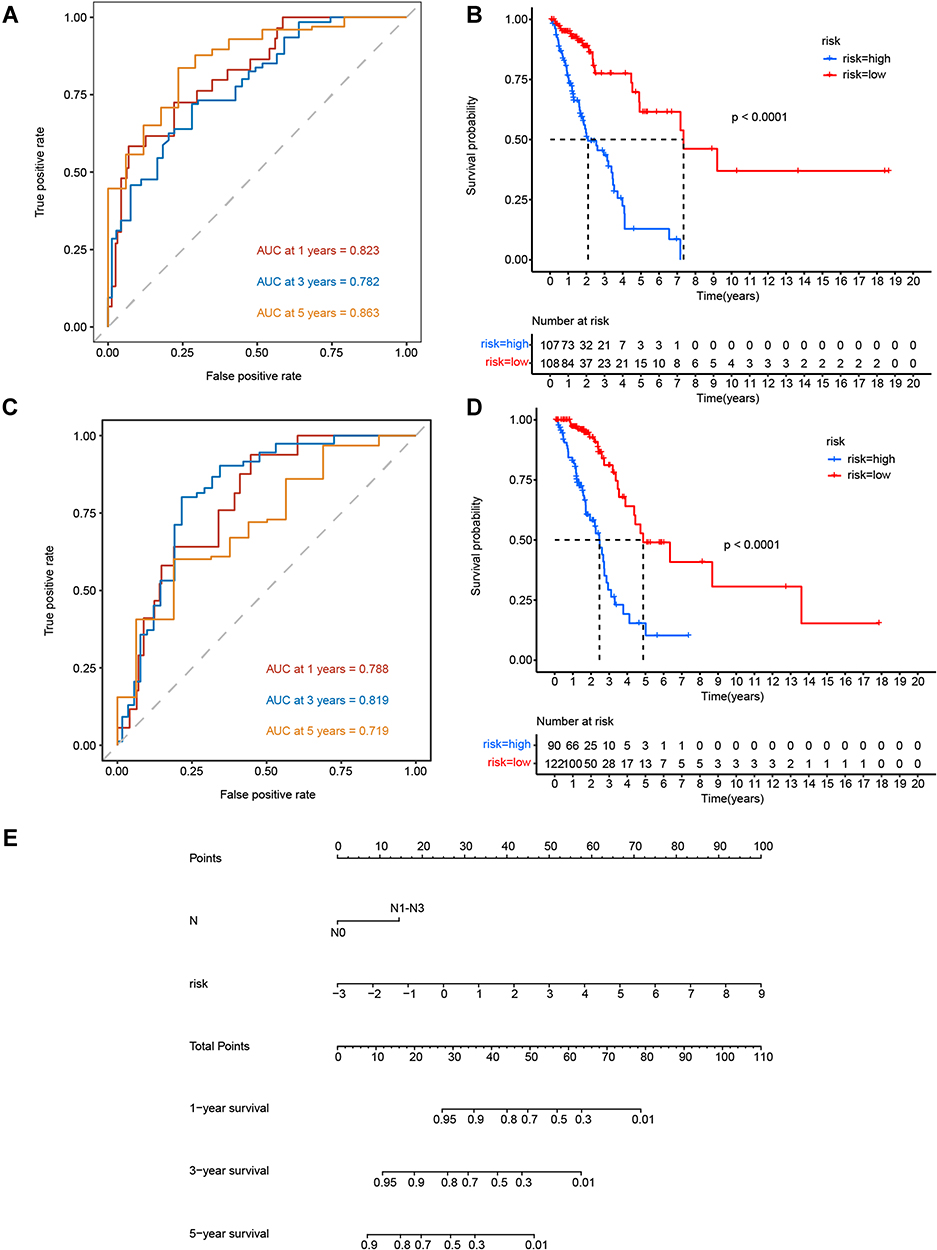 |
Figure 9 Clinical and lncRNA-based LUAD prognostic prediction model. (A and B) AUC values of the ROC curves for N stage and lncRNA risk score in the training set and testing set. (C and D) Kaplan–Meier OS curves for patients in the high- and low-risk groups in the training set and testing set. (E) Nomogram of multivariate Cox regression for 1-, 3-, and 5-year survival. |
Discussion
In this study, we identified a glycolysis-related lncRNA signature for LUAD prognosis. The AUC values for 1-year prognostic predictions in the training and testing sets were 0.821 and 0.721, respectively, indicating that the signature achieved good performance. The nomogram also showed good performance in predicting OS in patients with LUAD, which is important for predicting clinical outcomes. These results demonstrate that glycolysis-related lncRNAs can help determine the prognosis of LUAD.
Recently, many lncRNA-related clinical prediction models have been developed for LUAD. Wang et al developed a four-lncRNA signature, which was combined with TNM staging in a model for survival prediction in patients with NSCLC.46 Li et al presented a model consisting of seven immune-related lncRNAs for survival predictions in patients with LUAD.27 Although various lncRNA-associated models have been established, the relationships among glycolysis, different lncRNAs, and clinical outcomes have not been studied in detail. Thus, we established a glycolysis-related lncRNA model for LUAD prediction based on a risk score signature using LASSO analysis and multivariate Cox regression. Nine lncRNAs were selected from 16 prognosis-associated lncRNAs, of which AC010999.2, AL031600.2, AC073517.1, LINC02390, and HSPC324 were protective and low-risk-related in LUAD, whereas IER3-AS1, NR2F2-AS1, LINC02086, and AL358115.1 were harmful and high-risk-related. Notably, one of these identified lncRNAs (HSPC324) was expressed at especially high levels in patients in cluster 1, which may be important because HSPC324 can inhibit proliferation, cell cycling, and the migration of A549 NSCLC cells.47 In addition, NR2F-AS1 has been reported to target miR-320b as a competitive endogenous RNA and promote NSCLC cell proliferation, migration, and invasion by regulating BM1 expression levels.48
Our model had a confidence interval value of 0.73, demonstrating its high precision. Moreover, we divided the patient cohort into two groups based on risk scores and found that the clinical outcomes of patients were related to their risk scores. Patients in the high-risk group showed lower OS and disease-free survival (DFS), whereas those in the low-risk group exhibited prolonged OS and DFS. The ROC AUC values in the testing cohort were 0.721, 0.736, and 0.726 for the 1-year, 3-year, and 5-year predictions, respectively. These high AUC values indicate that our prognostic LUAD model, based on nine lncRNAs, has good consistency and is capable of accurate prediction. The data also show that the selected lncRNAs were closely related to carcinogenesis; therefore, lncRNAs have potential as biomarkers and therapeutic targets for LUAD. LncRNAs show strong tissue- and cell-type specificity;49 hence, lncRNA profiling can be used to distinguish different progression stages and subtypes of cancer. Zhao et al identified 72 lncRNAs associated with tumor subtypes, of which three could be used to identify estrogen receptor α-positive or -negative BRCA.50 Berger et al reported that breast carcinoma, cervical squamous cell carcinoma, and endocervical adenocarcinoma have similar lncRNA signatures, whereas uterine corpus endometrial carcinoma and ovarian cancer have different lncRNA profiles.51 Similarly, in this study, we divided the 445 LUAD patients into three subtypes and identified distinct lncRNA signatures in the three clusters. We found that SMIM25, AC0905591.1, AC011899.2, HSPC32.4, FENDRR, Linc00968, and AC018647.1 were particularly highly expressed in cluster 1 patients, whereas AC099850.3 was highly expressed in cluster 3 patients. Interestingly, we also found that different LUAD stages were prevalent among the three clusters, with stage I–II patients mostly distributed in cluster 1. These results revealed the spatiotemporal specificity of the lncRNAs. However, it should be noted that these results originated from online databases and, therefore, need to be further verified in clinical trials.
We also observed that the OS in cluster 1 was significantly higher than those in clusters 2 and 3, possibly owing to better immune performance in the patients in cluster 1. In this study, we found that many lncRNAs are enriched for immune-related signaling pathways, suggesting that lncRNAs may regulate innate immune responses and influence the proliferation and cell cycle of cancer cells. Previous reports have shown a relationship between lncRNAs and the immune microenvironment. For example, LincRNA-Cox2 was shown to interact with hnRNP-A/B and hnRNAP-A2/B1, resulting in altered expression levels of 787 genes in bone marrow-derived macrophages.52 In addition, FOXC1-mediated LINC00301 was found to trigger the malignant potential of NSCLC cells and modulate regulatory T (Treg) cell and CD8+ T cell populations by activating TGF-β signaling.53
In this study, by analyzing multiple immune-related genes, we identified a group of immune checkpoint molecules (including PDCD1, CTLA4, CD80, CD86, ICOS, IDO1, CD274, CXCL10, and CCL5) which showed the highest expression in tumor samples from cluster 1 patients. Although there is a lack of mechanistic evidence directly linking glycolysis-related lncRNAs and checkpoint molecules, accumulating evidence demonstrates that many lncRNAs serve important regulatory roles in cancer immunity, including antigen release and presentation, immune cell priming and T cell activation, and immune cell migration and infiltration. For example, lncSNHG1 was shown to upregulate miR-448 expression, which decreased IDO protein-expression levels and prevented Treg cell differentiation, resulting in the inhibition of immune escape.54 Moreover, the results of a carcinoma-metabolism study suggested that the high glycolytic activity ratio in cancer cells could increase PD-L1 expression and was closely related to apoptosis and immune CYT scores.11 Similarly, Ho et al reported a glycolysis-related lncRNA model in which one of the identified lncRNAs, MIR4435-2HG, was closely associated with immune infiltration in different types of cancer.55 In addition, we found significant differences in the EMT-signaling pathway among the three patient clusters; therefore, we propose that PDCD1, CTLA4, CD80, CD86, ICOS, and IDO1 could be regarded as potential targets for immunotherapy. Despite the lack of direct relationships or underlying mechanisms, our results demonstrate that glycolysis-related lncRNAs can regulate the expression of immune checkpoint proteins and influence the prognosis of patients with LUAD through a complex gene regulation network.
In summary, our study reveals that glycolysis-related lncRNAs may affect the survival of patients with LUAD by influencing the tumor microenvironment. Patients in cluster 1 may benefit from immune therapy, and the glycolysis-related lncRNA LUAD prognostic prediction model may help clinicians evaluate the survival of patients with LUAD. Our study provides a notable perspective on the relationship between LUAD prognosis, glycolysis, lncRNA, and immunity, and it may help diagnose and treat patients with LUAD.
Conclusion
In this study, we filtered out 43 glycolysis-related lncRNAs highly associated with LUAD and identified three LUAD clusters. Interestingly, patients with the cluster 1 subtype showed a novel inflammatory pattern with higher expression of immune checkpoint molecules, higher CYT scores, and better OS than the patients in clusters 2 and 3. Furthermore, we established a prognostic LUAD model based on nine glycolysis-immune-related lncRNAs. Our model provides a potential tool for the clinical prognosis of LUAD and sheds new insights into glycolysis, the immune microenvironment, and LUAD.
Data Sharing Statement
All gene expression data were obtained from TCGA (https://tcga-data.nci.nih.gov/).
Ethical Statement
The TCGA and molecular signature databases are publicly available, and our study was performed based on the guidelines of these databases. The use of the tissue samples for real-time PCR was approved by the Medical Ethics Committee of the Shenyang Tenth People’s Hospital (KYXM-2021-01).We confirm that all tissue donors have provided informed consent for the tissues used in this study and this study was in accordance with the Declaration of Helsinki.
Funding
This work was supported by the Liaoning Natural Science Fund Project [grant number 20180550054] and the Shenyang Science and Technology Project [grant number 18-014-4-57].
Disclosure
The authors report no conflicts of interest.
References
1. Bray F, Ferlay J, Soerjomataram I, Siegel RL, Torre LA, Jemal A. Global cancer statistics 2018: GLOBOCAN estimates of incidence and mortality worldwide for 36 cancers in 185 countries. A Cancer J Clin. 2018;68(6):394–424. doi:10.3322/caac.21492
2. Schabath MB, Digiovanni J. Introduction to special issue: recent advances in mechanisms, prevention and treatment of lung cancer. Mol Carcinog. 2015;54:vi. doi:10.1002/mc.22337
3. Hirsch FR, Scagliotti GV, Mulshine JL, et al. Lung cancer: current therapies and new targeted treatments. Lancet. 2017;389:299–311. doi:10.1016/S0140-6736(16)30958-8
4. Person P. Otto warburg: “on the origin of cancer cells”. Oral Surg Oral Med Oral Pathol. 1957;10:412–421. doi:10.1016/0030-4220(57)90167-6
5. Zhang L, Fu Y, Guo H. c-Myc-induced long non-coding RNA small nucleolar RNA host gene 7 regulates glycolysis in breast cancer. J Breast Cancer. 2019;22:533–547. doi:10.4048/jbc.2019.22.e54
6. Chang L, Fang S, Gu W. The molecular mechanism of metabolic remodeling in lung cancer. J Cancer. 2020;11:1403–1411. doi:10.7150/jca.31406
7. Mamede M, Higashi T, Kitaichi M, et al. [18F]FDG uptake and PCNA, Glut-1, and Hexokinase-II expressions in cancers and inflammatory lesions of the lung. Neoplasia. 2005;7:369–379. doi:10.1593/neo.04577
8. Li XB, Gu JD, Zhou QH. Review of aerobic glycolysis and its key enzymes - new targets for lung cancer therapy. Thorac Cancer. 2015;6:17–24. doi:10.1111/1759-7714.12148
9. Heiden M, Cantley LC, Thompson CB. Understanding the Warburg effect: the metabolic requirements of cell proliferation. Science. 2015;324(5930):1029–1033. doi:10.1126/science.1160809
10. Fan WM, Lorkiewicz PK, Sellers K, Moseley H, Higashi RM, Lane AN. Stable isotope-resolved metabolomics and applications for drug development. Pharmacol Ther. 2012;133:366–391.
11. Jiang Z, Liu Z, Li M, Chen C, Wang X. Increased glycolysis correlates with elevated immune activity in tumor immune microenvironment. EBioMedicine. 2019;42:431–442. doi:10.1016/j.ebiom.2019.03.068
12. Scharping N, Menk A, Moreci R, et al. The tumor microenvironment represses T cell mitochondrial biogenesis to drive intratumoral T cell metabolic insufficiency and dysfunction. Immunity. 2016;45:701–703. doi:10.1016/j.immuni.2016.08.009
13. Rinn JL, Hy C. Genome regulation by long non-coding RNAs.
14. Statello L, Guo CJ, Chen LL, Huarte M. Gene regulation by long non-coding RNAs and its biological functions. Mol Cell Biol. 2021;22(2):96–118. doi:10.1038/s41580-020-00315-9
15. Chen F, Chen J, Yang L, et al. Extracellular vesicle-packaged HIF-1α-stabilizing lncRNA from tumour-associated macrophages regulates aerobic glycolysis of breast cancer cells. Nat Cell Biol. 2019;21:498–510. doi:10.1038/s41556-019-0299-0
16. Lin A, Li C, Xing Z, et al. The LINK-A lncRNA activates normoxic HIF1α signalling in triple-negative breast cancer. Nat Cell Biol. 2016;18:213–224. doi:10.1038/ncb3295
17. Yang F, Zhang H, Mei Y, Wu M. Reciprocal regulation of HIF-1α and lincRNA-p21 modulates the Warburg effect - ScienceDirect. Mol Cell. 2014;53:88–100. doi:10.1016/j.molcel.2013.11.004
18. Zheng YL, Li L, Jia YX, et al. LINC01554-mediated glucose metabolism reprogramming suppresses tumorigenicity in hepatocellular carcinoma via downregulating PKM2 expression and inhibiting Akt/mTOR signaling pathway. Theranostics. 2019;9:796–810. doi:10.7150/thno.28992
19. Zhou M, Guo M, He D, et al. A potential signature of eight long non-coding RNAs predicts survival in patients with non-small cell lung cancer. J Transl Med. 2015;13:231. doi:10.1186/s12967-015-0556-3
20. Zhou M, Xu W, Yue X, et al. Relapse-related long non-coding RNA signature to improve prognosis prediction of lung adenocarcinoma. Oncotarget. 2016;7(20):29720–29738. doi:10.18632/oncotarget.8825
21. Guo Y, Qu Z, Li D, et al. Identification of a prognostic ferroptosis-related lncRNA signature in the tumor microenvironment of lung adenocarcinoma. Cell Death Discov. 2021;7(1):190. doi:10.1038/s41420-021-00576-z
22. Lu L, Liu LP, Zhao QQ, Gui R, Zhao QY. Identification of a ferroptosis-related LncRNA signature as a novel prognosis model for lung adenocarcinoma. Front Oncol. 2021;11:675545. doi:10.3389/fonc.2021.675545
23. Sun J, Zhang Z, Bao S, et al. Identification of tumor immune infiltration-associated lncRNAs for improving prognosis and immunotherapy response of patients with non-small cell lung cancer. J Immunother Cancer. 2020;8(1):e000110. doi:10.1136/jitc-2019-000110
24. Jiang Y, Chen J, Ling J, et al. Construction of a Glycolysis-related long noncoding RNA signature for predicting survival in endometrial cancer. J Cancer. 2021;12:1431–1444. doi:10.7150/jca.50413
25. Kong XZ, Hu SS, Sun Z, et al. Regulation of aerobic glycolysis by long non-coding RNAs in cancer. Biochem Biophys Res Commun. 2016;479:28–32. doi:10.1016/j.bbrc.2016.09.007
26. Wang Y, Lu J, Wu Q. LncRNA LINRIS stabilizes IGF2BP2 and promotes the aerobic glycolysis in colorectal cancer. Mol Cancer. 2019;18(1):174. doi:10.1186/s12943-019-1105-0
27. Li JP, Li R, Liu X, et al. A seven immune-related lncRNAs model to increase the predicted value of lung adenocarcinoma. Front Oncol. 2020;10:560779. doi:10.3389/fonc.2020.560779
28. Liu Z, Mi M, Li X, Zheng X, Wu G, Zhang L. A lncRNA prognostic signature associated with immune infiltration and tumour mutation burden in breast cancer. J Cell Mol Med. 2020;24:12444–12456. doi:10.1111/jcmm.15762
29. Wang Y, Zhou W, Ma S, et al. Identification of a glycolysis-related LncRNA signature to predict survival in diffuse glioma patients. Front Oncol. 2020;10:597877. doi:10.3389/fonc.2020.597877
30. Bai Y, Lin H, Chen J, Wu Y, Yu S. Identification of prognostic glycolysis-related lncRNA signature in tumor immune microenvironment of hepatocellular carcinoma. Front Mol Biosci. 2021;8:645084. doi:10.3389/fmolb.2021.645084
31. Subramanian A, Tamayo P, Mootha VK, et al. Gene set enrichment analysis: a knowledge-based approach for interpreting genome-wide expression profiles. Proc Natl Acad Sci U S A. 2005;102(43):15545–15550. doi:10.1073/pnas.0506580102
32. Wilkerson MD, Hayes DN. ConsensusClusterPlus: a class discovery tool with confidence assessments and item tracking. Bioinformatics. 2010;26(12):1572–1573. doi:10.1093/bioinformatics/btq170
33. Gay CM, Stewart CA, Park EM. Patterns of transcription factor programs and immune pathway activation define four major subtypes of SCLC with distinct therapeutic vulnerabilities. Cancer Cell. 2021;39(3):346–360.e347. doi:10.1016/j.ccell.2020.12.014
34. Yoshihara K, Shahmoradgoli M, Martínez E, et al. Inferring tumour purity and stromal and immune cell admixture from expression data. Nat Commun. 2013;4:2612. doi:10.1038/ncomms3612
35. Gao J, Kwan PW, Shi D. Sparse kernel learning with LASSO and Bayesian inference algorithm. Neural Netw. 2010;23:257–264. doi:10.1016/j.neunet.2009.07.001
36. Li H, Zhao X, Jing W, Zong M, Yang H. Bioinformatics analysis of gene expression profile data to screen key genes involved in pulmonary sarcoidosis. Gene. 2017;596:98–104. doi:10.1016/j.gene.2016.09.037
37. Kuleshov MV, Jones MR, Rouillard AD, et al. Enrichr: a comprehensive gene set enrichment analysis web server 2016 update. Nucleic Acids Res. 2016;44:W90–W7. doi:10.1093/nar/gkw377
38. Bhattacharya S, Dunn P, Thomas CG, et al. ImmPort, toward repurposing of open access immunological assay data for translational and clinical research. Sci Data. 2018;5:180015. doi:10.1038/sdata.2018.15
39. Na SS, Aldonza MB, Sung HJ, et al. Stanniocalcin-2 (STC2): a potential lung cancer biomarker promotes lung cancer metastasis and progression. Biochim Biophys Acta. 2015;1854(6):668–676. doi:10.1016/j.bbapap.2014.11.002
40. Yu J, Liu TT, Liang LL, et al. Identification and validation of a novel glycolysis-related gene signature for predicting the prognosis in ovarian cancer. Cancer Cell Int. 2021;21(1). doi:10.1186/s12935-021-02045-0
41. Niu Y, Ma F, Huang W, et al. Long non-coding RNA TUG1 is involved in cell growth and chemoresistance of small cell lung cancer by regulating LIMK2b via EZH2. Mol Cancer. 2017;16(1):5. doi:10.1186/s12943-016-0575-6
42. Wu F, Zhou D, Cui Y, Shen G, Li Y, Wei F. Long non-coding RNA UCA1 modulates the glycolysis of cervical cancer cells by miR-493-5p/HK2. Int J Clin Exp Pathol. 2018;11(8):3943–3951.
43. Yin D, Hua L, Wang J, Liu Y, Li X. Long non-coding RNA DUXAP8 facilitates cell viability, migration, and glycolysis in non-small-cell lung cancer via regulating HK2 and LDHA by inhibition of miR-409-3p. Onco Targets Ther. 2020;13:7111–7123. doi:10.2147/OTT.S243542
44. Miao H, Chen D, Li R, et al. Identification of an immune-related six-long noncoding RNA signature as a novel prognosis biomarker for adenocarcinoma of lung. Biosci Rep. 2021;41(1). doi:10.1042/BSR20202444
45. Zhang B, Wang R, Li K, et al. An immune-related lncRNA expression profile to improve prognosis prediction for lung adenocarcinoma: from bioinformatics to clinical word. Front Oncol. 2021;11:671341. doi:10.3389/fonc.2021.671341
46. Wang RQ, Long XR, Ge CL, Zhang MY, Wang HY. Identification of a 4-lncRNA signature predicting prognosis of patients with non-small cell lung cancer: a multicenter study in China. J Transl Med. 2020;18:320. doi:10.1186/s12967-020-02485-8
47. Jafarzadeh M, Tavallaie M, Soltani BM, Hajipoor S, Hosseini SM. LncRNA HSPC324 plays role in lung development and tumorigenesis. Genomics. 2020;112:2615–2622. doi:10.1016/j.ygeno.2020.02.012
48. Shijie Z, Xiaoyun Q, Sun C, Zhuang G, Huaqi W. LncRNA NR2F2-AS1 promotes tumourigenesis through modulating BMI1 expression by targeting miR-320b in non-small cell lung cancer. J Cell Mol Med. 2018;23:2001–2011. doi:10.1111/jcmm.14102
49. Cabili MN, Trapnell C, Goff L, et al. Integrative annotation of human large intergenic noncoding RNAs reveals global properties and specific subclasses. Genes Dev. 2011;25:1915–1927. doi:10.1101/gad.17446611
50. Zhao W, Luo J, Jiao S. Comprehensive characterization of cancer subtype associated long non-coding RNAs and their clinical implications. Sci Rep. 2014;4:6591. doi:10.1038/srep06591
51. Berger AC, Korkut A, Kanchi RS, et al. A comprehensive pan-cancer molecular study of gynecologic and breast cancers. Cancer Cell. 2018;33:690–705. doi:10.1016/j.ccell.2018.03.014
52. Murphy MB, Medvedev AE. Long noncoding RNAs as regulators of Toll-like receptor signaling and innate immunity. Plants (Basel). 2016;99:839–850.
53. Sun C, Zhu W, Li S, Hu W, Li DJ. FOXC1-mediated LINC00301 facilitates tumor progression and triggers an immune-suppressing microenvironment in non-small cell lung cancer by regulating the HIF1α pathway. Genome Med. 2020;12:77. doi:10.1186/s13073-020-00773-y
54. Pei X, Wang X, Li H. LncRNA SNHG1 regulates the differentiation of Treg cells and affects the immune escape of breast cancer via regulating miR-448/IDO. Int J Biol Macromol. 2018;118(Pt A):24–30. doi:10.1016/j.ijbiomac.2018.06.033
55. Ho KH, Huang TW, Shih CM. Glycolysis-associated lncRNAs identify a subgroup of cancer patients with poor prognoses and a high-infiltration immune microenvironment. BMC Med. 2021;19(1):59. doi:10.1186/s12916-021-01925-6
 © 2021 The Author(s). This work is published and licensed by Dove Medical Press Limited. The full terms of this license are available at https://www.dovepress.com/terms.php and incorporate the Creative Commons Attribution - Non Commercial (unported, v3.0) License.
By accessing the work you hereby accept the Terms. Non-commercial uses of the work are permitted without any further permission from Dove Medical Press Limited, provided the work is properly attributed. For permission for commercial use of this work, please see paragraphs 4.2 and 5 of our Terms.
© 2021 The Author(s). This work is published and licensed by Dove Medical Press Limited. The full terms of this license are available at https://www.dovepress.com/terms.php and incorporate the Creative Commons Attribution - Non Commercial (unported, v3.0) License.
By accessing the work you hereby accept the Terms. Non-commercial uses of the work are permitted without any further permission from Dove Medical Press Limited, provided the work is properly attributed. For permission for commercial use of this work, please see paragraphs 4.2 and 5 of our Terms.